Vindby—A Serious Offshore Wind Farm Design Game


Department of Civil and Environmental Engineering, Norwegian University of Science and Technology NTNU, NO-7491 Trondheim, Norway
*
Author to whom correspondence should be addressed.
Energies 2019, 12(8), 1499; https://doi.org/10.3390/en12081499
Submission received: 25 March 2019
/
Revised: 17 April 2019
/
Accepted: 18 April 2019
/
Published: 20 April 2019
(This article belongs to the Special Issue Recent Advances in Offshore Wind Technology)
Abstract
:To maintain the increasing interest and development in offshore wind energy, novel training tools for engineers and researchers are needed. Concurrently, educational outreach activities are in demand to inform the public about the importance of offshore wind energy. In this paper, the development of a serious game about the design and management of offshore wind farms is presented to address such demands. Such a serious game may enable a new audience to explore the field of offshore wind as well as provide researchers entering the field a better understanding of the intricacies of the industry. This requires a simulation that is realistic but also effective in teaching information and engaging outreach. Ultimately, increased public support and expanded training tools are desired to improve decision-making and to provide opportunities to test and integrate innovative solutions. The work presented here includes the game design and implementation of a prototype game. The game design involves building a game framework and developing a simplified simulation. This simulation addresses weather prediction, offshore wind farm design, operation and maintenance, energy demand, climate change, and finance. Playtesting of the prototype demonstrated immersion and informed decision-making of the players and surveys revealed that knowledge had increased while playing the game. Recommendations for future versions of the game are listed.
1. Motivation
International climate change policies have driven the offshore wind energy sector to immense investments in industry and research globally. Despite the growing success, there are still challenges to overcome before truly competitive costs of energy compared to other energy sources that can be achieved without sacrificing safety or productivity. A frequently referenced challenge that will affect the future of support structures in offshore wind is the transition to deeper water [1], enabling also the construction and use of larger turbines. Additionally, the reduction of uncertainty in weather prediction may improve O&M by allowing for decisions to be more informed in efforts to reduce downtime. To address such specific offshore wind challenges, many studies are being conducted and field tested on cost reducing and production enhancing measures. Some topics at the forefront of research include innovative bottom fixed and floating support structures, improved wind speed and power forecasting methods, intelligent control systems, realistic grid integration sensitive to economic and political objectives, and optimization of operation and maintenance (O&M) strategies under uncertainty. According to Ernst & Young [2], one of the priority measures required to realize the full potential of offshore wind in Europe’s future energy mix includes the support of innovation and training and enhancement of synergies to reduce costs.
Offshore wind farm design and operational management is a complex task as is demonstrated by the variety of approaches in practice and research. Even for experienced engineers, it is sometimes difficult to correctly judge the relevance of different cost factors and design drivers in a multidisciplinary field. Additionally, researchers in offshore wind energy often come from diverse backgrounds and often need to collect and understand lots of unfamiliar information in a short amount of time. To maintain the current momentum of increasing investment, interest, and development in the field, there is a need for novel training tools and techniques for engineers and researchers that integrate the work of both industry and academia. Concurrently, the general public is concerned about the price of energy from offshore wind energy and the costs of research to improve it. A list of “wind energy myths” compiled by the European Wind Energy Association [3] highlights misconceptions of wind power: that it is a niche-technology, expensive, unreliable, and bad for health and the environment. To address these concerns, there is therefore also a need for educational outreach activities.
A modern approach to provide this education is the development of a serious game that teaches users’ facts and lessons about offshore wind energy. This approach offers the opportunity to integrate both existing and pioneering offshore wind practices in a tool that is as educational as it is entertaining. The game will be driven by an underlying complex simulation based on engineering models, which is packaged in the form of an optimization challenge. The playability and engagement of the game drives how this otherwise non-unique simulation fits into an entirely new context.
The goal of this study is to evaluate a new, alternative form of training and dissemination of scientific knowledge of offshore wind energy in the form of a serious game. This is done by focusing on the simplification of offshore wind farm design, management, and lifetime costs in addition to assessing alternative serious game approaches. The results consist of the development of a playable prototype of a serious game in wind farm design and operational management. The project goals were to:
- Develop a digital game for the design and the operational management of offshore wind farms to be used for two purposes:
- (a)
- Training: The game should act as a novel training technique/tool for engineers and researchers to better understand cost and design drivers.
- (b)
- Dissemination: The game should teach the public important facts about offshore wind energy and serve as educational outreach.
- Measure game effectiveness in terms of the accuracy and responsiveness of its simulations and its educational power.
The educational goals of the game are different for the two purposes of training and dissemination. For training, users include engineers and researchers who want or need to improve their comprehension of offshore wind farm processes. After playing, these users should be able to describe terminology and design drivers in detail. They should feel more confident and prepared to begin or continue their work in wind energy. For dissemination, users include young adults or adults without prior knowledge of offshore wind who are prompted or interested to gain knowledge on important facts or trends. After playing, these users should be able to generally describe challenges and opportunities of offshore wind as well as basic physical elements and costs. They should feel that they are aware of the basic principles of offshore wind and feel an increased appreciation for the topic.
1.1. Boundary Conditions
This study is conducted under several boundary conditions as follows. The simulation behind the game includes simplified methods of wind farm design and management, with emphasis on future expandability. Minimal effort is put into game production (i.e., making an attractive user experience). Procedural generation using random numbers is used to present a different scenario to the user for each run. The prototype is implemented in Python [4]. The prototype was playtested once with voluntary participants. Lastly, it is assumed that the results of this work may be improved upon and utilized by game developers and producers in the future to create an attractive user experience. To promote development, the game is open source and can be downloaded by anyone from the internet. Currently, the game is hosted at http://folk.ntnu.no/muskulus/vindby/.
1.2. Organization of Research
The three topics explored in this study are offshore wind energy (design, operation, and economics), serious game design, and prototype development. The organization of this paper was constructed in a way to capture the justification behind the major decisions made to produce the resulting prototype. Section 2 presents a review of the definition and scope of serious games in general. Section 3 presents the game, called Vindby, which is then described in detail with respect to the game framework defined by game dynamics, game elements, and game mechanics. This section also covers the offshore wind energy topics demonstrated by Vindby, including the weather simulation created specifically for the game. Section 4 summarizes the outcome of testing the game prototype. Section 5 presents a discussion of the simulation development and key experiences in game development and testing. Section 6 presents the study conclusions and a summary of potential future work.
2. Serious Games
An enhanced understanding of uncertainties by researchers and the public alike can contribute to informed decision-making. Better decisions are desired to enhance progress and reduce costs. Looking to learning methods to enhance this understanding, there is a multitude of various teaching and learning techniques. Some learners prefer to learn by reading a textbook, watching a documentary, studying in a group, or individually. The success of existing serious games indicates that some learners value alternative strategies. This does not imply superiority but rather that a greater number of learners can be reached by increasing the set of learning tools. Serious games provide one more way to explore the topic of offshore wind for a new group of learners [5].
A great deal of practical work and research has been carried out in the field of serious games designed for medical purposes, history, social issues, engineering, and much more. “Serious Games Foundations, Concepts and Practice” by [5] consolidates the work of over 50 authors including researchers and professionals whose expertise or career lies in serious games. Reference [5] define a serious game as a digital game intended to entertain and to achieve at least one supplementary goal. This additional goal is known as a characterizing goal. The characterizing goal for training purposes in the Vindby game is to improve the user’s technical judgment of offshore wind farm design and industry. The characterizing goal for dissemination purposes in the game is to enhance the user’s sentiment towards offshore wind energy and introduce basic terminology.
Modern serious games are used in schools for many educational purposes because serious games can provide an extrinsic motivation to players who do not have the intrinsic motivation to engage with the subject matter otherwise. Serious game developers use various motivational tools to join fun and learning. They integrate amusing gameplay closely tied to the subject matter, using the power of stories, rules, rewards, and other mechanics to teach principles as well as complex concepts rather than just facts [6]. Some serious games are developed for training in technical areas and decision-making such as in SimPort: a multiplayer management game framework as documented by Warmerdam et al. [7]. The dual characterizing goals of the proposed serious game is what distinguishes it from similar existing games, where either training or dissemination is desired but not both. Additionally, the nature of the game content is highly subject to evolution with time. The game Vindby that is detailed in this article aims to be technically as accurate as possible, while teaching about the technology choices in wind energy. Existing games with wind energy as topic [8,9] do not provide such level of technical details as Vindby. Fu et al. [10] measured the effectiveness of serious games and noted that whether a player enjoyed a game is a key factor in determining whether the player continues to learn from the game. In other words, when the learner is prompted by self-motivation factors in the game, they will choose to devote more time to playing the game and understanding its content. The importance of the game mechanics and engineering principles driving the simulation must not overtake the importance of designing an immersive, fun-to-play game. This distinguishes the product from an engineering simulation because, if the goal to entertain is neglected, the playing experience might result in a failure to achieve the characterizing goal. To properly integrate the subject matter (in this case, the design and operation of offshore wind farms) and enjoyment (fun and amusement), a collaboration between game designers, programmers, artists, and domain experts through the entire development is essential to create a successful serious game. The task of interface development and final prototype development of the game would largely rely on work done by a dedicated game development team.
The content of the game includes the design and maintenance of offshore wind farms. There is a high upper limit for how detailed the content can be in a serious game because it is packaged in a simulation. Scientific simulations focus on accuracy, while ordinary game simulations focus on entertainment. The simulation of a serious game falls between an entertainment and scientific simulation depending on the characterizing goals. For training purposes, such a game is expected to represent the subject matter correctly, like a flight simulator. While an entertainment game eliminates details that are not fun, a serious game relies on realistic details to educate users about the subject. A simulation is always an abstraction of the system it represents. Abstraction of the system can be done by eliminating factors that have little effect, or by simplifying features that contribute to the overall mechanics, but whose inner workings do not significantly change the outcome [6]. In an effort to balance accuracy with fun, the final game design presented here is the product of many iterations internally tested for accuracy of scale, accuracy of weather prediction, and, most of all, playability. Playability is vital to the players’ understanding and grasp of game content as well as general enjoyment and can be influenced by the feedback the game provides to the player. Different mechanisms to provide feedback have been tested to achieve playability in the prototype.
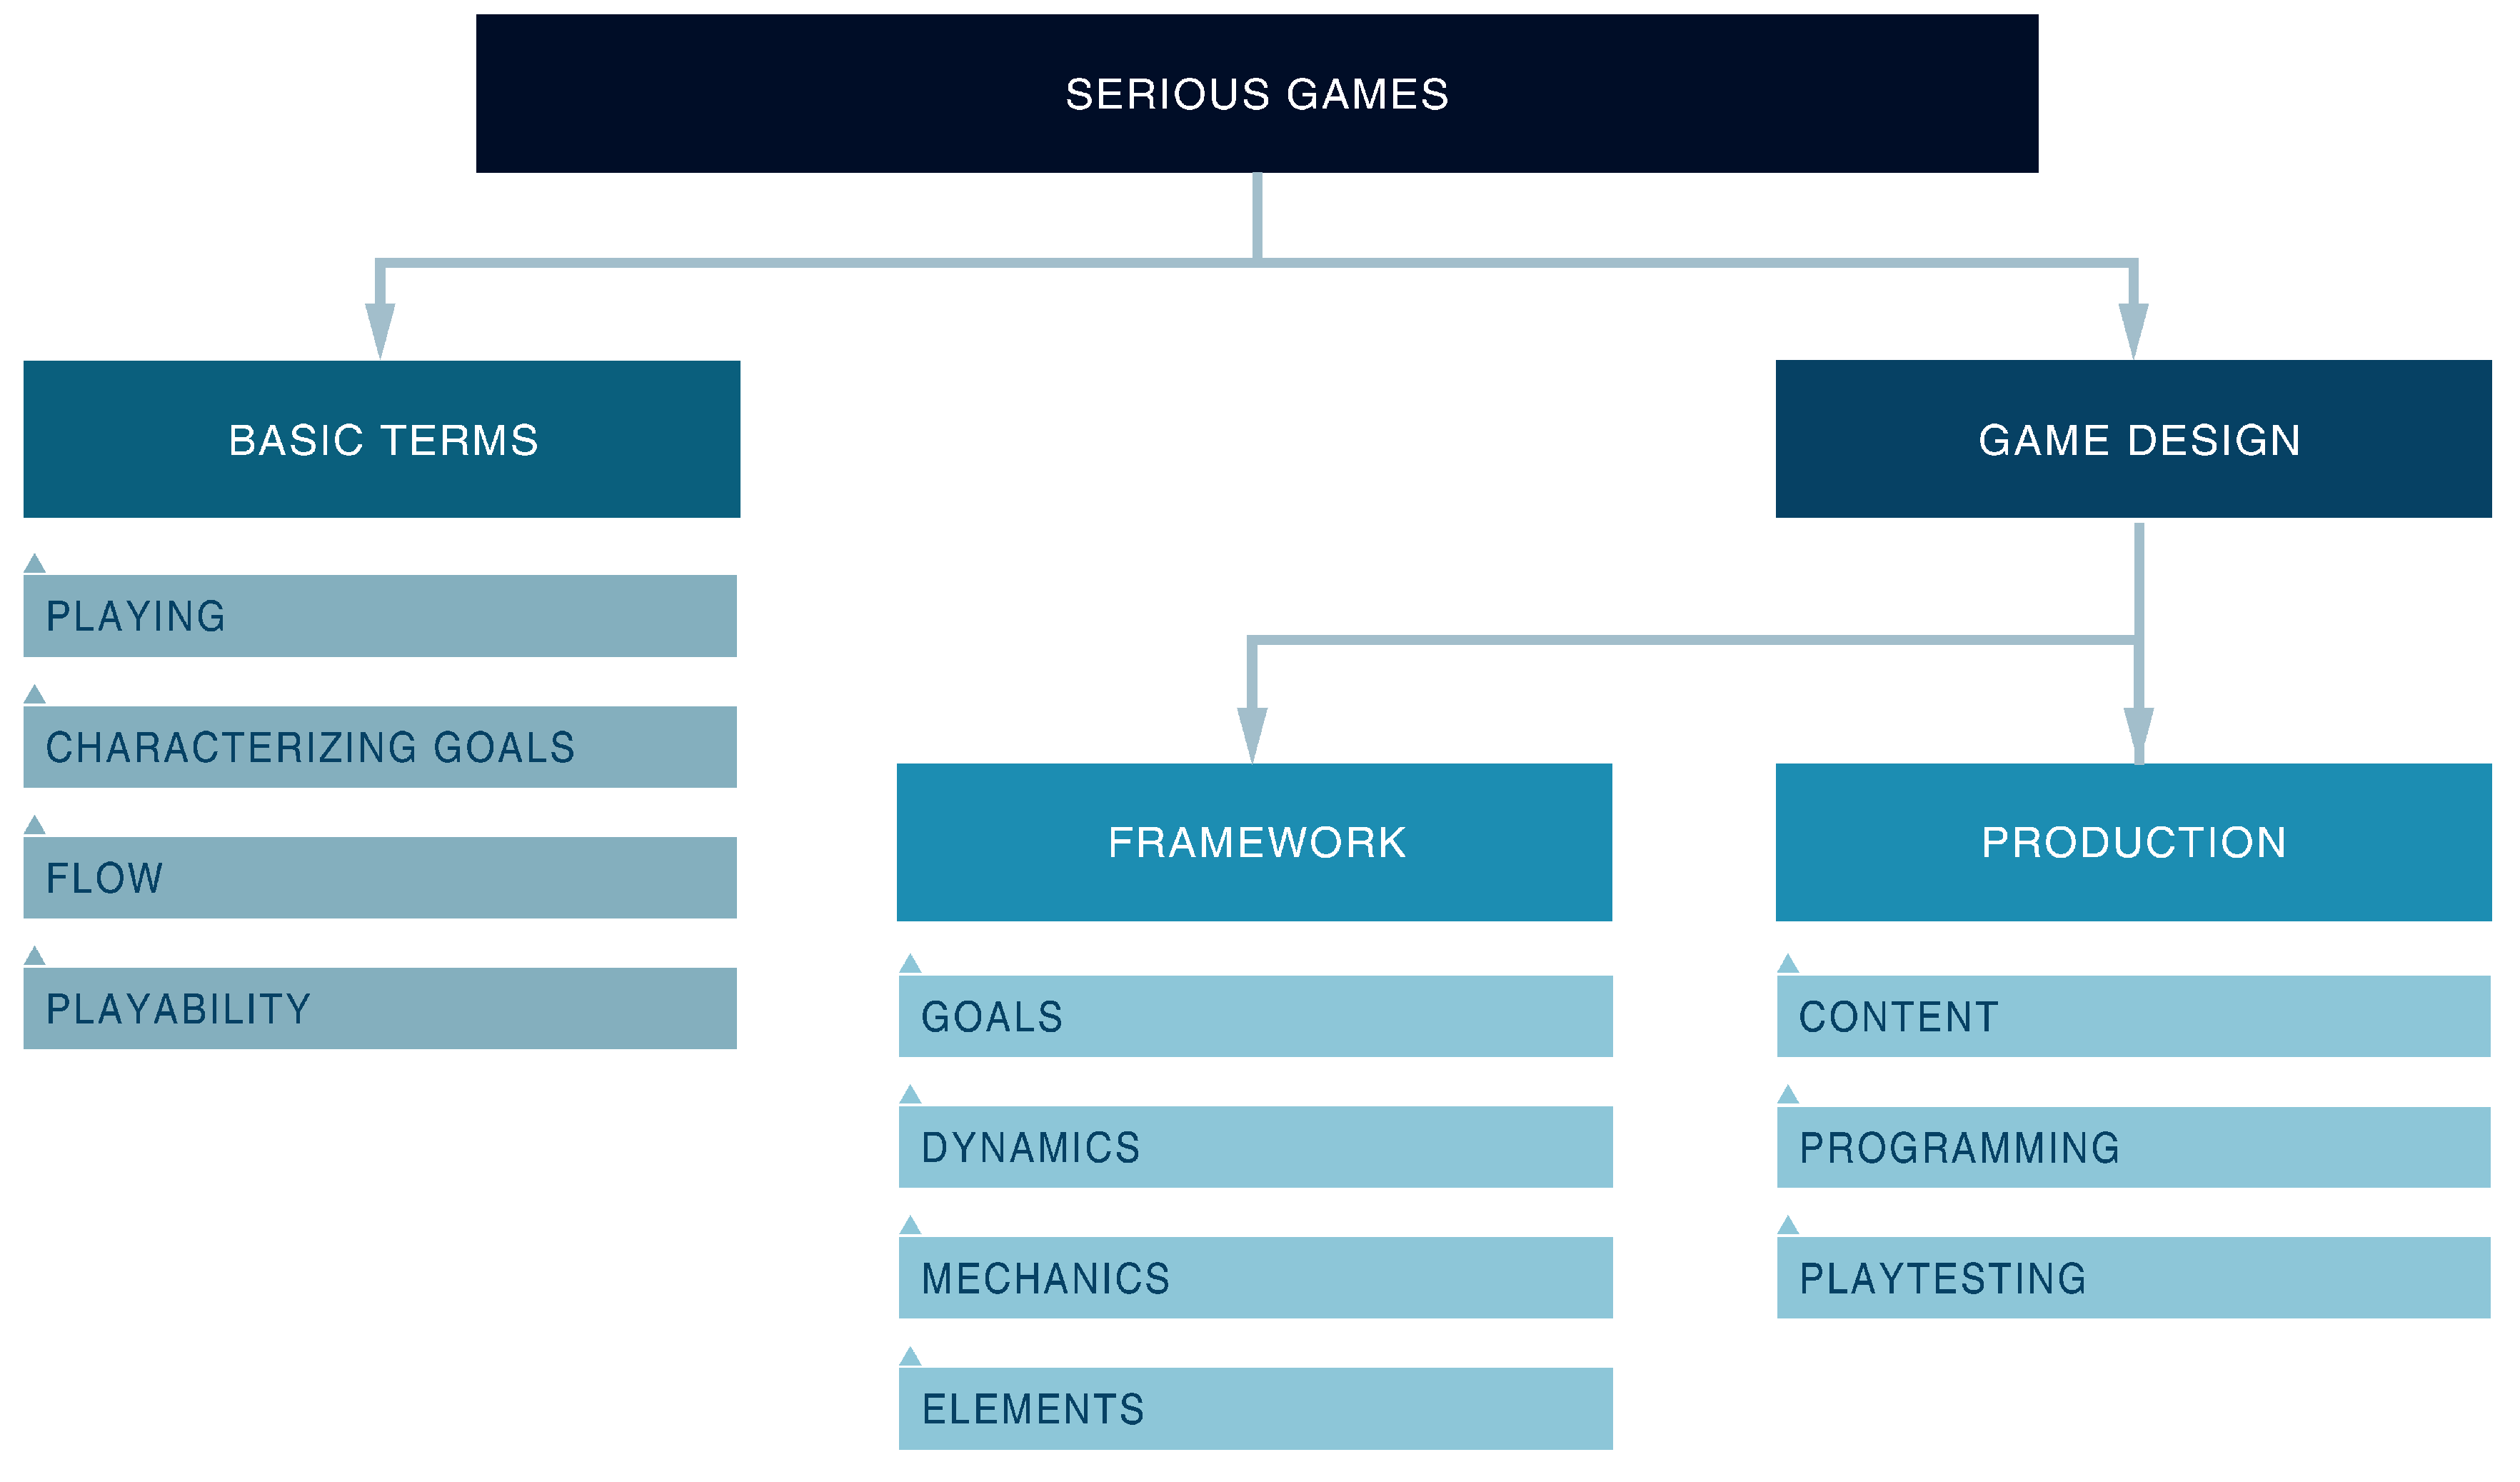
The existing body of knowledge on how to design a serious game is extensive. While the majority of the terminology and approaches align between sources, there are several differences in the literature. To maintain clarity and consistency, the guidelines in [5] are generally followed in this paper and supplemented when appropriate. Terminology used throughout is outlined in Table 1. The structure of how the individual terms fit into the concept of serious games can be seen from Figure 1.
3. Vindby the Game
The game created for this study is called Vindby and will be referred to as such. Vindby is chosen as the name of the game both as an ode to the world’s first offshore wind park in 1991 in Denmark and as a translation to Norwegian of “wind city”. The serious game must have one or more game goals and a framework to support the players to achieve these goals. The framework for Vindby was established alongside the development of game content and the programming to ensure proper integration of playability while achieving the characterizing goals. In this section, the game framework and game content is described.
3.1. Game Framework
3.1.1. Objectives
The goal of Vindby is to reach a target by building wind farms in a virtual sea within an alloted time and budget. Five different game goals were defined and evaluated during playtesting to compare different game duration, level of difficultly, and interest in the subject. The player can select from the following game goals to play during one game:
- Profit: Invest all the initial investment (€1 billion) in capital costs and break overall profit by 2025,
- Compete: Keep playing until 2030 and achieve an overall score higher than any other player,
- Dominate: Achieve 10% share of all energy supply that can be provided by offshore wind by 2050,
- Save the planet: Prevent the global temperature from increasing by 2 degrees by 2100, and
- Free for all: Free play without time limits.
3.1.2. Dynamics
Common game dynamics include: Race to the finish, collection, solve, rescue, escape, and construct [12]. Of these, the main game dynamic of Vindby is constructed in addition to collect or solve, depending on the game goal selected, under time constraints. While the game does impose a time limit to reinforce real-life constraints on renewable energy, it is relatively slow paced and does not require quick reactions since reflective thinking is often necessary for learning. To aid in learning, the player may pause the game at any moment.
3.1.3. Elements
Studies in neural sciences indicate the positive impact of emotional engagement, or immersion, on learning. Game elements provide immersion by creating motivation to the player to continue playing and incentive to achieve the game goals [5]. Elements used in Vindby are rewards, resources, scoring, story, chance, and strategy.
Rewards are used to build player self-esteem. Resources are limited and displayed with transparency to aid in decision-making that results in success and rewards. To maintain immersion, player decisions must be impactful and informed and not tangential to the game goal, hollow, or obvious, so as not to cause disinterest [13]. Scoring indicates progress on a variety of measures not necessarily directly related to the game goal and is used in Vindby to teach the player about how offshore wind energy is affected by a combination of effects. The story of Vindby takes place in a virtual sea given input from a growing energy demand onshore and climate change effects. The player is the designer and operator while other characters include the government, the general public, and shareholders to demonstrate external consequences. Chance is incorporated using random events related to weather and failure, which make each game unique and interesting to play multiple times and demonstrate real world uncertainty. The player’s freedom to test various strategies allows for the comparison and contrast of offshore wind concepts and understanding that there is not one solution to all the challenges encountered.
3.1.4. Mechanics
Game mechanics include rules and procedures that guide the player and determine the internal structure of the game. As Vindby is an educational game, game mechanics heavily rely on the serious content to determine rules and processes, although these are sometimes modified to enhance playability. Such rules are typically defined for game space, time, objects, actions, and resources [11]. The game space in Vindby is a virtual sea (referred to as the “sea grid”) divided into 100 unique cells. Game time is measured in calendar dates to teach users about realistic timelines. Specific game mechanics are explored in the game content section.
A few game mechanics defined early in the game design include the following. The player is given an initial investment at the start of the game to pay for site investigation, building and maintaining wind farms. The player must not run out of money (or the game is lost). The game is won if the player reaches the target of the selected goal. Additionally, various bonuses, penalties, and special features are revealed throughout playing. Such additional features include the reward and penalty of money and the expansion of design capabilities.
3.2. Implementation
The Vindby prototype was coded using Python (version 3.6) with an object-oriented programming (OOP) approach. OOP is a programming style used to organize code by encapsulating data together with operations that act on it in a single code unit called an object. For preliminary game development, the prototype is minimal but enough to test game mechanics and generate random values. Within OOP, a common game-specific programming pattern is a game loop. The game continuously cycles through process input, update game, render, and a time delay. Each update advances the game time by a specified amount while it takes a certain amount of real time to process the updates. To deal with user defined game speed (slow, normal, or fast) and variable machine capabilities, a catch-up method is used by applying a fixed time step with synchronization. The game runs at a fixed speed and adds a delay to maintain consistent speed. Specifically, each loop in the game is designed to be completed in one real-time second. The user may select to run one hour, one week, or one month of simulation time in that second. If the computation time for one loop is less than one real time second, a delay is added to force the loop to maintain a one real-time second per loop speed.
The terms used to reference measures of time in the simulation are defined as follows. Game time is used to measure the time that has passed since beginning the game in units mimicking the game’s story line. In the simulation, game time is measured in hours for simplicity in calculations, and presented as calendar dates to the player for relevance. Game speed measures the interval of game time that occurs per second of real time. Game speed is chosen by the user. Slow speed runs at one hour (game time) per second (real time), normal speed runs at one week (168 h) per second, and fast speed runs at one month (730 h) per second. For example, at fast game speed, the player may simulate 10 years of wind farm activity in 120 s of real time. Wind time measures the number of loops in the simulation that have passed since beginning the game. Each loop represents one hour in the game (theoretically, this interval may be different). Wind time progresses by this interval regardless of the game speed selected. Wind time is used by the simulation to perform ongoing calculations. Specifically, wind speeds and power production must be calculated continuously, regardless of the game speed that the player chooses to use. Wind time interval is the amount game time that represents one loop in the simulation. This is equal to one hour in the current version of Vindby, as mentioned above. This was selected because the weather model was built to produce output including hourly wind speed and wave height. For example, one loop in the simulation is performed in one real second at “slow” game speed, and 168 loops in the simulation are performed in one real second at "normal” game speed.
3.3. Game Content
The game content includes the design and maintenance of offshore wind farms. The topics that are integrated into Vindby are weather prediction, wind farm design, operation and maintenance, energy demand, costs, stakeholder influence, and optimization. These topics were identified through many iterations of game mechanics, review of offshore wind current practices, review of ongoing research, and discussions with colleagues regarding areas of interest to potential players.
3.3.1. Weather Simulation
Accurate weather modelling is incorporated to improve the player’s understanding of expected energy production and weather windows for construction and operation. This topic is addressed with the most detail in Vindby’s development. It is meant to illustrate the game’s potential use as an advanced training tool and serves as an example for the other game content topics to be explored in further detail.
The two environmental parameters used in Vindby are significant wave height and mean wind speed. Wind speed is used to determine power production. Both the wind and wave parameters are used to determine persistence of weather windows. Weather windows indicate the availability of a turbine to be repaired, i.e., repairs cannot take place during weather that is unsafe for vessels. The parameters are modelled probabilistically and realizations are established using a random number generator. The Vindby weather simulation uses 10 min intervals, as this interval is used throughout the wind industry to measure turbulence and reliability of larger wind turbine [14].
A Markov chain model is used for wave (or wind) time series generation in Vindby, but only for one parameter. The second parameter is then generated using conditional probability distributions. A Markov model is a discrete stochastic process. It is a simple and efficient method that assumes the future weather only depends on the current weather state. The development of current to future weather state is described by stochastic transitions. The transitions are established using an existing data set. The transition probabilities are estimated by discretizing the average frequencies of transitions observed in the data and can be presented in matrix form as described by [15]. The data was discretized with bin sizes of 0.4 m and 1.0 m/s, respectively. The wave and wind data used is from FINO1, which is a research platform in the German North Sea near the wind farm Alpha Ventus, 45 km from shore. Year-round seasonality was accounted for by using different matrices for each month.
One challenge while using conditional probabilities between wind and wave data is that the original datasets are at different resolutions. The recorded observations of wave heights were provided by buoy measurements, and the data resolution is more or less one hour, with slight variations in length. For the wind speed, the resolution is uniformly 10 min. Markov transition matrices based on one hour wave data may only accurately model one hour resolution. As the goal was to use 10 min wind speeds to describe the power production, a number of different modeling approaches were tested. The results from these test are summarized in Table 2 and explained in the following.
Two main approaches to capture the correlation between wind speeds and wave heights can be distinguished. The “wave to wind” approach uses a Markov matrix to generate wave heights and then uses a matrix containing conditional probabilities to generate wind speeds consistent with the seastate. The alternative “wind to wave” method uses a Markov matrix to generate wind speeds and then uses conditional probabilities to generate corresponding wave heights. Another distinction was made regarding the method to sample six realizations of 10 min wind speeds for each hour of a seastate, necessary to address the issue of the different timescales. The two approaches used for this were a “Markov” method, that relies on a Markov chain for generating 10 min wind speed values within each hour, versus a “Gaussian” approach that randomly draws wind speed values, based on the measured standard deviations of 10 min speeds within an hour. Although the latter approach does not correctly reproduce correlations in time between the 10 min wind speed values, it was introduced due to its simplicity and since it was observed that the distributions of 10 min wind speeds within each hour appeared consistently Gaussian (for hourly means less than 25 m/s).
Before implementing the weather prediction model into Vindby, the different approaches were tested. Six observations of 10-min wind speeds where aggregated (by averaging) to create hourly wind speed observations. This provides an unbiased estimate of the hourly mean wind speed. It needs to be noted, however, that fluctuations among the wind speeds are smoothed out at the lower resolution. This is unproblematic in this case, but would have to be addressed if also the variance of the wind speeds would be needed (e.g., for modelling fatigue damage). These hourly values were then used to calculate conditional probabilities for observing corresponding wave height measurements (or vice versa), in order to capture the correlation between wave height and wind speed. The different simulation methods were then each run 10 times for 10 simulated years each to establish the effects of the different modeling strategies: (a) 10 min data sampling method (Markov vs. Gaussian), and (b) using a “wave to wind” vs. a “wind to wave” approach. Wave height boundaries of 1.5 m and 2 m, and upper wind speed boundaries of 15 m/s and 20 m/s were used to test persistence of weather windows. A 10-year simulation length was chosen after an analysis of the stability of mean wind speeds after 1, 5, 10, 15, and 20-year simulations. The 10-min wind speed time series and one hour wave height time series generated were compared to the original dataset. After at least 10 years of simulation, the mean of the 10 min wind speeds did not vary more than 1% when increasing the simulation length by another year.
The further results of the weather simulation model (see [16] for details) establish that (using the same dataset and Markov chain for each run) the simulated hourly wave height and wind speed distributions had average percent errors of 2.1% and 1.0%, respectively, from the distributions obtained from the measurement data. The persistence of weather windows for sea states was well represented with a slight underestimation of weather windows for periods of 12 to 24 h.
Somewhat predictably, the simulations using the wind Markov matrices resulted in lower percent errors than for the wind speeds derived by conditional probabilities, and those using the wave Markov matrices performed similarly for the wave height. Interestingly, the hourly distribution of 10 min wind speeds was closer to the observed values using the Gaussian approach. This is probably due to a more accurate parameterization: the Gaussian approach is based on only two parameters that need to be estimated from the data, whereas the alternative Markov approach is based on many more parameters. In the end, the “wave to wind” simulation method with Gaussian sampling was implemented in Vindby, as it enables more accurate wind speeds and wave heights.
In order to represent sea-wide weather variation in the weather, it was necessary to include some spatial variation of weather parameters in the game. To demonstrate variations of weather in the offshore environment, Vindby’s virtual sea is divided into 100 cells, each with distinct environmental characteristics. All cells use the same Markov matrix, mainly to save setup time and memory. Each occupied cell then runs its own weather simulation (unoccupied cells are excluded to minimize computing time). Cells must have distinct mean wind speeds to demonstrate variation offshore. This is achieved by using a wind speed factor to scale (increase or decrease proportionally) the simulated mean wind speed and wave height magnitudes, while maintaining their distributions. Because Vindby’s sea is fictitious, wind speed factors were assigned more or less randomly to different cells, with generally increasing mean wind speed farther from shore. The factors range from 0.5 to 1.3, thereby achieving a range of annual mean wind speeds between 4.7 to 12.2 m/s (the mean of the wind speed measurements was 9.37 m/s).
3.3.2. Wind Farm Design
Intelligent wind farm design is Vindby’s most fundamental activity. This section presents how wind farm design translates into game mechanics.
Site Selection: One characterizing dissemination goal is for the player to gain an appreciation for the short-listing process of selecting an adequate site. The characterizing training goal is for the player to learn about relevant offshore parameters that dictate this process. Players are given minimal information about the physical characteristics of each of the 100 cells within the sea grid, each of which is considered one site. The player can then pay for site investigations to gather more details. The full site information includes mean wind speed, water depth, soil quality (poor, medium or good), distance to shore, environmental restrictions, vessel traffic, and whether there are already wind farms built in that cell or not.
Turbine technology: The building blocks of the offshore wind structures in Vindby are turbines (including the tower) and substructures (including a foundation and transition piece). Typically, the wind turbine model is selected before site investigation as it will influence the grid connection and design capacity. Vindby prompts for the turbine selection after site selection because limited prior knowledge of offshore wind farm design may negatively inform the player’s selection.
Turbine capacity options are 3, 5, 7, 10, and 15 MW to capture existing and future technology. The 10 and 15 MW turbines only become available after building five wind farms in the game, to demonstrate the development of technology with experience. Vindby addresses different turbine states including “operational”, “waiting”, “automatic shut down”, and “fault shut down”. Future versions of Vindby may expand more states to test control system strategies.
Each turbine has its own failure rates based on Carroll et al. [17], who provide failure rates in failure per turbine per year as well as expected costs for minor and major repairs and major replacements. Although failure rates vary throughout the turbine lifetime, the majority of studies and industry practice use the simplification of constant failure rates, as used in Vindby throughout the turbine original 20-year lifetime. The player has the option to extend the farm lifetime by five years, twice. During lifetime extension, turbine failure rates are doubled to add consequence to extending farm lifetime and add weight to decisions. The capacity factors for wind farms in Vindby are updated in each time step and presented to the player to indicate how efficiently wind farms are running and what the consequences of certain O&M decisions are.
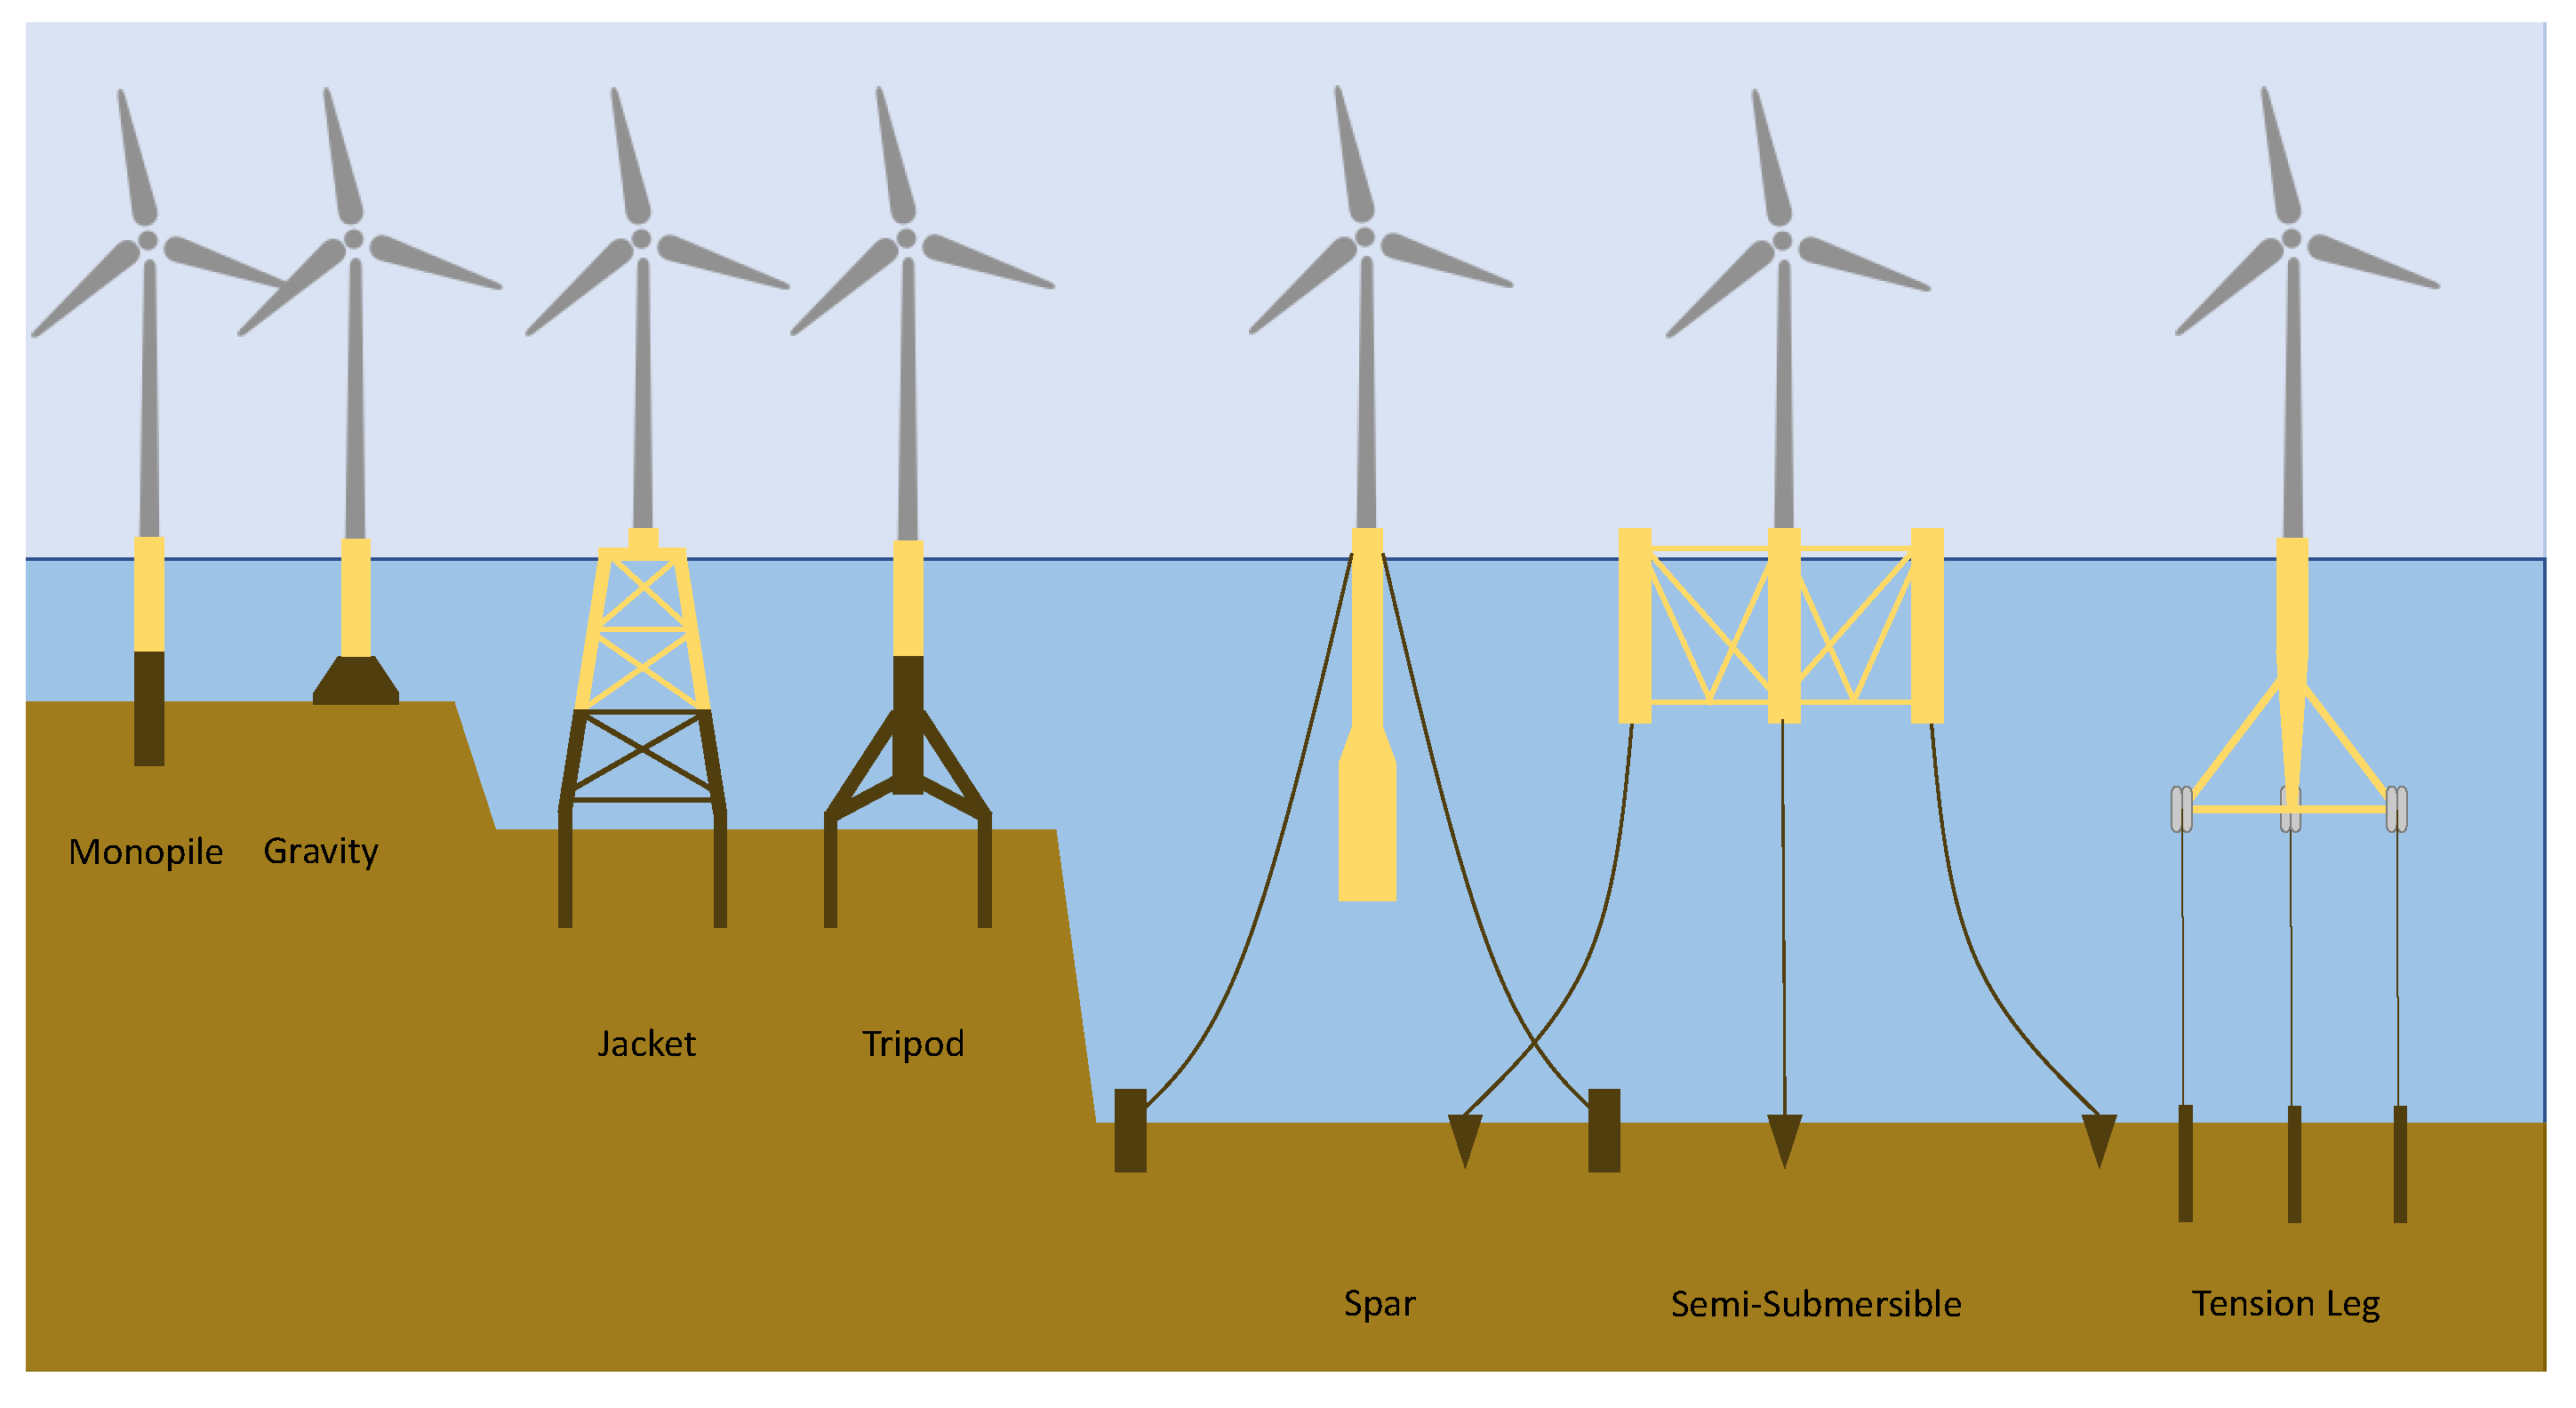
Support Structures: The support structure types in Vindby are “monopile”, “gravity”, “jacket”, “tripod”, “spar”, “semi-submersible”, and “tension-leg platform”, presented in Figure 2. The three floating concepts only become available to the player after seven wind farms are in operation, to demonstrate industry growth with time and to reward the user for continued play. Floating offshore wind structures are both important to industry development and considered a hot-topic in research and the general public.
One characterizing goal of Vindby is to enhance the players understanding of design drivers. For training purposes, this includes how to address poor soil conditions or rough sea states. For dissemination purposes, this includes recognizing failure modes and the complexity of designing structures offshore. Structural failure rates in Vindby are not designed to represent realistic occurrence probability, rather to direct the player to which parameters affect which substructures. The game mechanics describing these rates is a balancing task between engineering reality and playability. Each substructure has its own failure rates based on the mean wave height, soil quality, structure type, and turbine size. The substructure failure rates used in the game are presented in Table 3.
Vindby uses scour as an example of addressing reliability in structural design. For each new wind farm, the player is prompted to pay for scour protection. If scour protection is not provided but was not needed, nothing happens. If it was needed (i.e., for some concepts in poor soil conditions), scour failure is guaranteed to occur soon after construction. The player must then pay for scour protection for the entire farm at a higher price. The price for installation during wind farm construction is set to €80.000 per turbine and to €150.000 per turbine for later installation of the protection measures. These values have been chosen based on the range of scour protection costs presented in [18].
Layout: Wake effects and losses are not considered in Vindby. Therefore, turbine spacing is constant for all farms. Using a grid layout and 1 km spacing, a resulting cell of 10 × 10 km could hold a maximum of 100 turbines, which falls within the realistic scale of existing farms [19]. To demonstrate sea-wide layout considerations to the player, there are cost penalties for constructing farms relatively close to shore because of visual impact. This specifically considers the possible major, moderate, and minor effects for distances “less than 13 km”, “between 13 and 24 km”, and “greater than 24 km” from shore, respectively [20].
Grid integration: Vindby simplifies grid integration and teaches the player about subsea cables, wind farm clusters, alternating versus direct current transmission, and onshore versus offshore substations. Subsea cable lengths are computed as straight-line distances from the center of the grid cell to the onshore substation. With a growing number of offshore wind farms, many advantages can be gained through coordination of offshore installations and the use of clustered wind farms that feed their electrical output into common nodes [21]. The player has the option to connect to the closest possible wind farm if it results in shorter cable lengths. Given their connection, grid and cable failures at one farm affect the farms connected via the same cable.
Offshore wind farms require a substation, either onshore or offshore. In Vindby, all farms at a distance greater than 100 km from the onshore substation are required to have an offshore substation. Additionally, the onshore substation starts with a 500 MW capacity, and increases in increments of 500 MW as needed by the construction of the new farms.
Construction: Logistical constraints regarding fabrication yard and port capacity to handle offshore wind farm elements are not included in Vindby because Vindby’s onshore infrastructure is not considered in detail. The construction duration is calculated as a sum of installation time for cable length, support structure type, and waiting time considering random construction accidents and delays. Significant detail in construction time calculation and feedback is reduced as it may distract the player and cause impatience (even at maximum game speed) with respect to when the wind farm becomes operational; however, to teach the user about the impact of design choices on construction time, construction time may vary between under a month to several years. Before construction, the player is prompted to provide a name for the new wind farm. If they choose a name of a real offshore wind farm in the North Sea, the construction time is reduced to zero days. This is one of the game’s easter eggs, chosen to encourage players to research existing offshore wind farms.
Decommissioning and disposal: The lifetime of all wind farms in Vindby is 20 years. There is no option to decommission early, but it is possible to extend the lifetime by five years, twice. The cost of decommissioning the turbines and substructures is based on Shafiee et al. [22] and includes port preparation, removal, waste processing, waste transportation, landfill, post decommissioning monitoring, and recycling materials. Decommissioning cost for subsea cables is estimated according to Myhr et al. [23].
3.3.3. Operation and Maintenance
Operation activity and costs are greatly simplified in Vindby in order to highlight the high level risks and decisions considered in O&M for both training and dissemination. Maintenance of an offshore wind farm consists of repair, replacement, and annual inspections. The challenge of applying maintenance efficiently for the player is maximizing turbine availability while minimizing costs associated with unexpected failures [22]. Based on a combination of strategy organizations in literature, Vindby offers three maintenance strategies to choose from for each farm. Vindby uses an O&M manager object to manage and repair failures based on the three strategies.
The three O&M strategies in Vindby are: (1) Calendar based maintenance—failures are repaired at the end of the month, accumulating more downtime but saving costs by using the same vessel for multiple repairs, (2) Corrective maintenance—minor failures are delayed for repair at the end of the month, but certain expensive repairs prompt the player to decide if the high cost of immediate repair is necessary to keep the productivity going, and (3) Condition based preventive and corrective maintenance—for an upfront cost for a monitoring system, certain failures can be predicted ahead of time and repaired immediately at a reduced cost, and failures that are not anticipated are either repaired automatically at the end of the month or can be repaired immediately.
Actual repair times and therefore costs are not well understood, largely because of data availability, and the differences among literature regarding the definition of failure. Therefore, repair costs are estimated using a fixed repair duration per failure based on Carroll et al. [17] multiplied by a daily vessel rate plus the cost of the repair itself. Programming of the maintenance strategies involved many iterations to capture accurate representation and playability. One big challenge is to not overwhelm the player with decision-making over maintenance issues so focus can be kept on building farms and achieving the overall goal. Some decision-making is required for the training and dissemination of maintenance knowledge. A possible solution to this issue is improved interface interaction, which is out of scope of this study.
3.4. Power Production
The power production of a wind farm depends on the turbine type, the number of turbines and the weather. To demonstrate the concept of turbine capacity to the user and the importance of wind speed in production, the game uses linearized power curves to calculate the energy production depending on the (10 min mean) wind speed and turbine rating. The power curves are hidden from the player and only the turbine rating is known. This keeps the game experience simple while also giving the player a tool to utilize to improve performance. The parameters defining the power curves used in the game are presented in Table 4.
3.4.1. Energy Demand
To give context to the player about electricity supply, there is some electricity demand that must be met. The scale of Vindby in this prototype does not allow for full capacity to be met by offshore wind. One principle that is stubbed out in the game is the investment in other renewables to demonstrate how to address storage and variation in wind speeds. More specifically, an additional characterizing goal may be needed to teach users about long term integration costs of variable renewable energy. Combating climate change and reducing CO2 emissions are arguably the core goals of why the player should be building offshore wind farms. One characterizing dissemination goal is that the player at a minimum understands that energy produced by offshore wind is replacing energy provided by non-renewable electricity generation means, such as coal, which releases large quantities of CO2 into the atmosphere, only half of which is absorbed by earth’s surface. To enable the player to learn about the reduction in CO2 emissions, the game provides feedback on the amount of CO2 prevented from being released.
Relatable feedback is also presented in terms of households powered, equivalent cars taken off the road, and acres of forest reclaimed. The average household demand is assumed to be 3900 KWh per household as presented by [24]. Vindby demonstrates in the graphical user interface (GUI) that, because wind power generation varies with time, the number of homes powered by offshore wind is not constant.
3.4.2. Economics and Costs
Vindby includes resource management of an initial investment, expenditures, revenues, fines, and bonuses. Relevant characterizing dissemination and training goals include recognizing the influence of O&M costs and gaining a sense of scale for offshore wind farm costs. More specifically, the player must use limited resources to make better design and operational decisions. If the player’s balance runs out, the game is over. The resource manager object is called the player’s “wallet”, to which money can be withdrawn and deposited.
Costs for all items in Vindby are based either on realistic values when data is available, or are manipulated to enhance game flow and playability. For example, monopiles typically reach their water depth limit around 30–40 m, when the design reaches engineering limits for pliable diameters and wall thickness. Rather than imposing depth limits in Vindby (also considering that the technology is often upgrading), the concept of building outrageously sized and priced structures is both amusing and indicative of the real world considering unrealistically high costs. Therefore, fictitious cost factors are applied to increase cost dramatically in deeper water. This cost factor is selected based on a careful balancing of all bottom-fixed structure costs with depth to ensure that at different depths and soil qualities, different structures become the most economic option. Table 5 shows examples of the costs of the different substructures at different water depths. Without this consideration, the same structure (i.e., a monopile) would be the cheapest every time.
Costs can also be leveraged to incorporate rewards and repercussions for certain game actions. For example, a reward is offered when a wind farm pays back its initial investment. Fines are deducted when a wind farm is constructed in an environmentally sensitive area without performing mitigation measures.
A wind farm’s selling cost is the price at which electricity is purchased and is established following the feed-in tariff (FIT) approach for simplicity. The FIT value depends on technology used, distance to shore, and mean wind conditions on site. The profit that the player is encouraged to realize is the difference between the selling cost and the levelized cost of energy (LCOE). The LCOE is updated monthly to account for maintenance activities and serves as a way to compare wind farms and maintenance strategies within one game.
Various fines and rewards are used in Vindby to introduce positive and negative consequences for specific player decisions. The values are not based on any research, but rather scaled to have an impact on the player’s emotion regarding their decision. Some fines include: building in an environmentally protected area, and building in an area with an active vessel route. Some rewards include: breaking even on capital cost of a wind farm, and breaking even on CO2 emissions during construction of a wind farm versus CO2 prevented in electricity generation.
3.4.3. Stakeholders
Part of the characterizing training and dissemination goals is to recognize the influence that government, the public, and shareholders have on offshore wind projects. The effect of stakeholder reactions does not consider current research or actual events, but rather is incorporated as points used as indicators for the player. The background behind the satisfaction points belonging to each stakeholder considers a broad understanding of what impacts certain actions have on stakeholders. One example of an increase in stakeholder satisfaction due to game play is an increase by one point for the public, when 1 million additional homes can be powered with the energy produced by a wind farm. Another example is that construction of a wind farm close to shore will result in a decrease in public satisfaction.
3.4.4. Optimization
One of the original sub-tasks of constructing Vindby was to build an optimization algorithm that “solves” the game, which theoretically can determine optimal playing strategies corresponding to optimal design or operational management of a wind farm. Throughout this work, it was agreed that the development of a fully integrated optimizer that acts as the “computer player” is outside of the scope of this study. Nonetheless, using optimization strategies as a form of feedback for the player is incorporated into Vindby in the form of small optimizer functions. Two optimizer functions used are: (a) yearly reports on operation and maintenance costs and downtime, and what they would be under alternative strategies; and (b) information on the potential consequences of alternative substructure choice, in terms of economy and reliability, provided after construction of a wind farm.
3.5. Game Design
The final game design is the product of many iterations internally tested for accuracy of scale, accuracy of weather prediction, and, most of all, playability. Feedback is vital to the player’s understanding of game content as well as general enjoyment and experienced the most iteration during programming. Feedback given by the game to the player is done through two means: textual, in the Python console, and by way of a GUI. The GUI presents information that changes throughout the game as well as a graphical representation of the sea grid. The prototype Vindby GUI is shown in Figure 3. In the center, the virtual sea grid is visualised with individual cells, numbered from 1 to 100. Dark blue cells are the default, before any player interaction. Light blue color indicates that the player has already conducted research on the cell in question. In the example shown in Figure 3, cell 34 is an example. Yellow color indicates that a wind farm is under construction in the given cell, shown by cell 27 in the example. Green cells, 17, 22 and 35 host operating wind farms, while the color red (cell 24) indicates a fault that needs attention of a maintenance team. In the bottom of the GUI, the selected goal of the game is displayed, together with information about how close the player has come to achieve this selected goal. The left-hand side of the interface shows information about the selected cell, in the example cell 35. Depending on previous interaction of the player with the game, this information is altered. If a player investigates a cell, additional information is shown. When a wind farm is constructed on a cell, the information about the wind farm is also shown here. The right-hand side of the user interface shows general information about the game progress, like the players’ wallets and stakeholder scores.
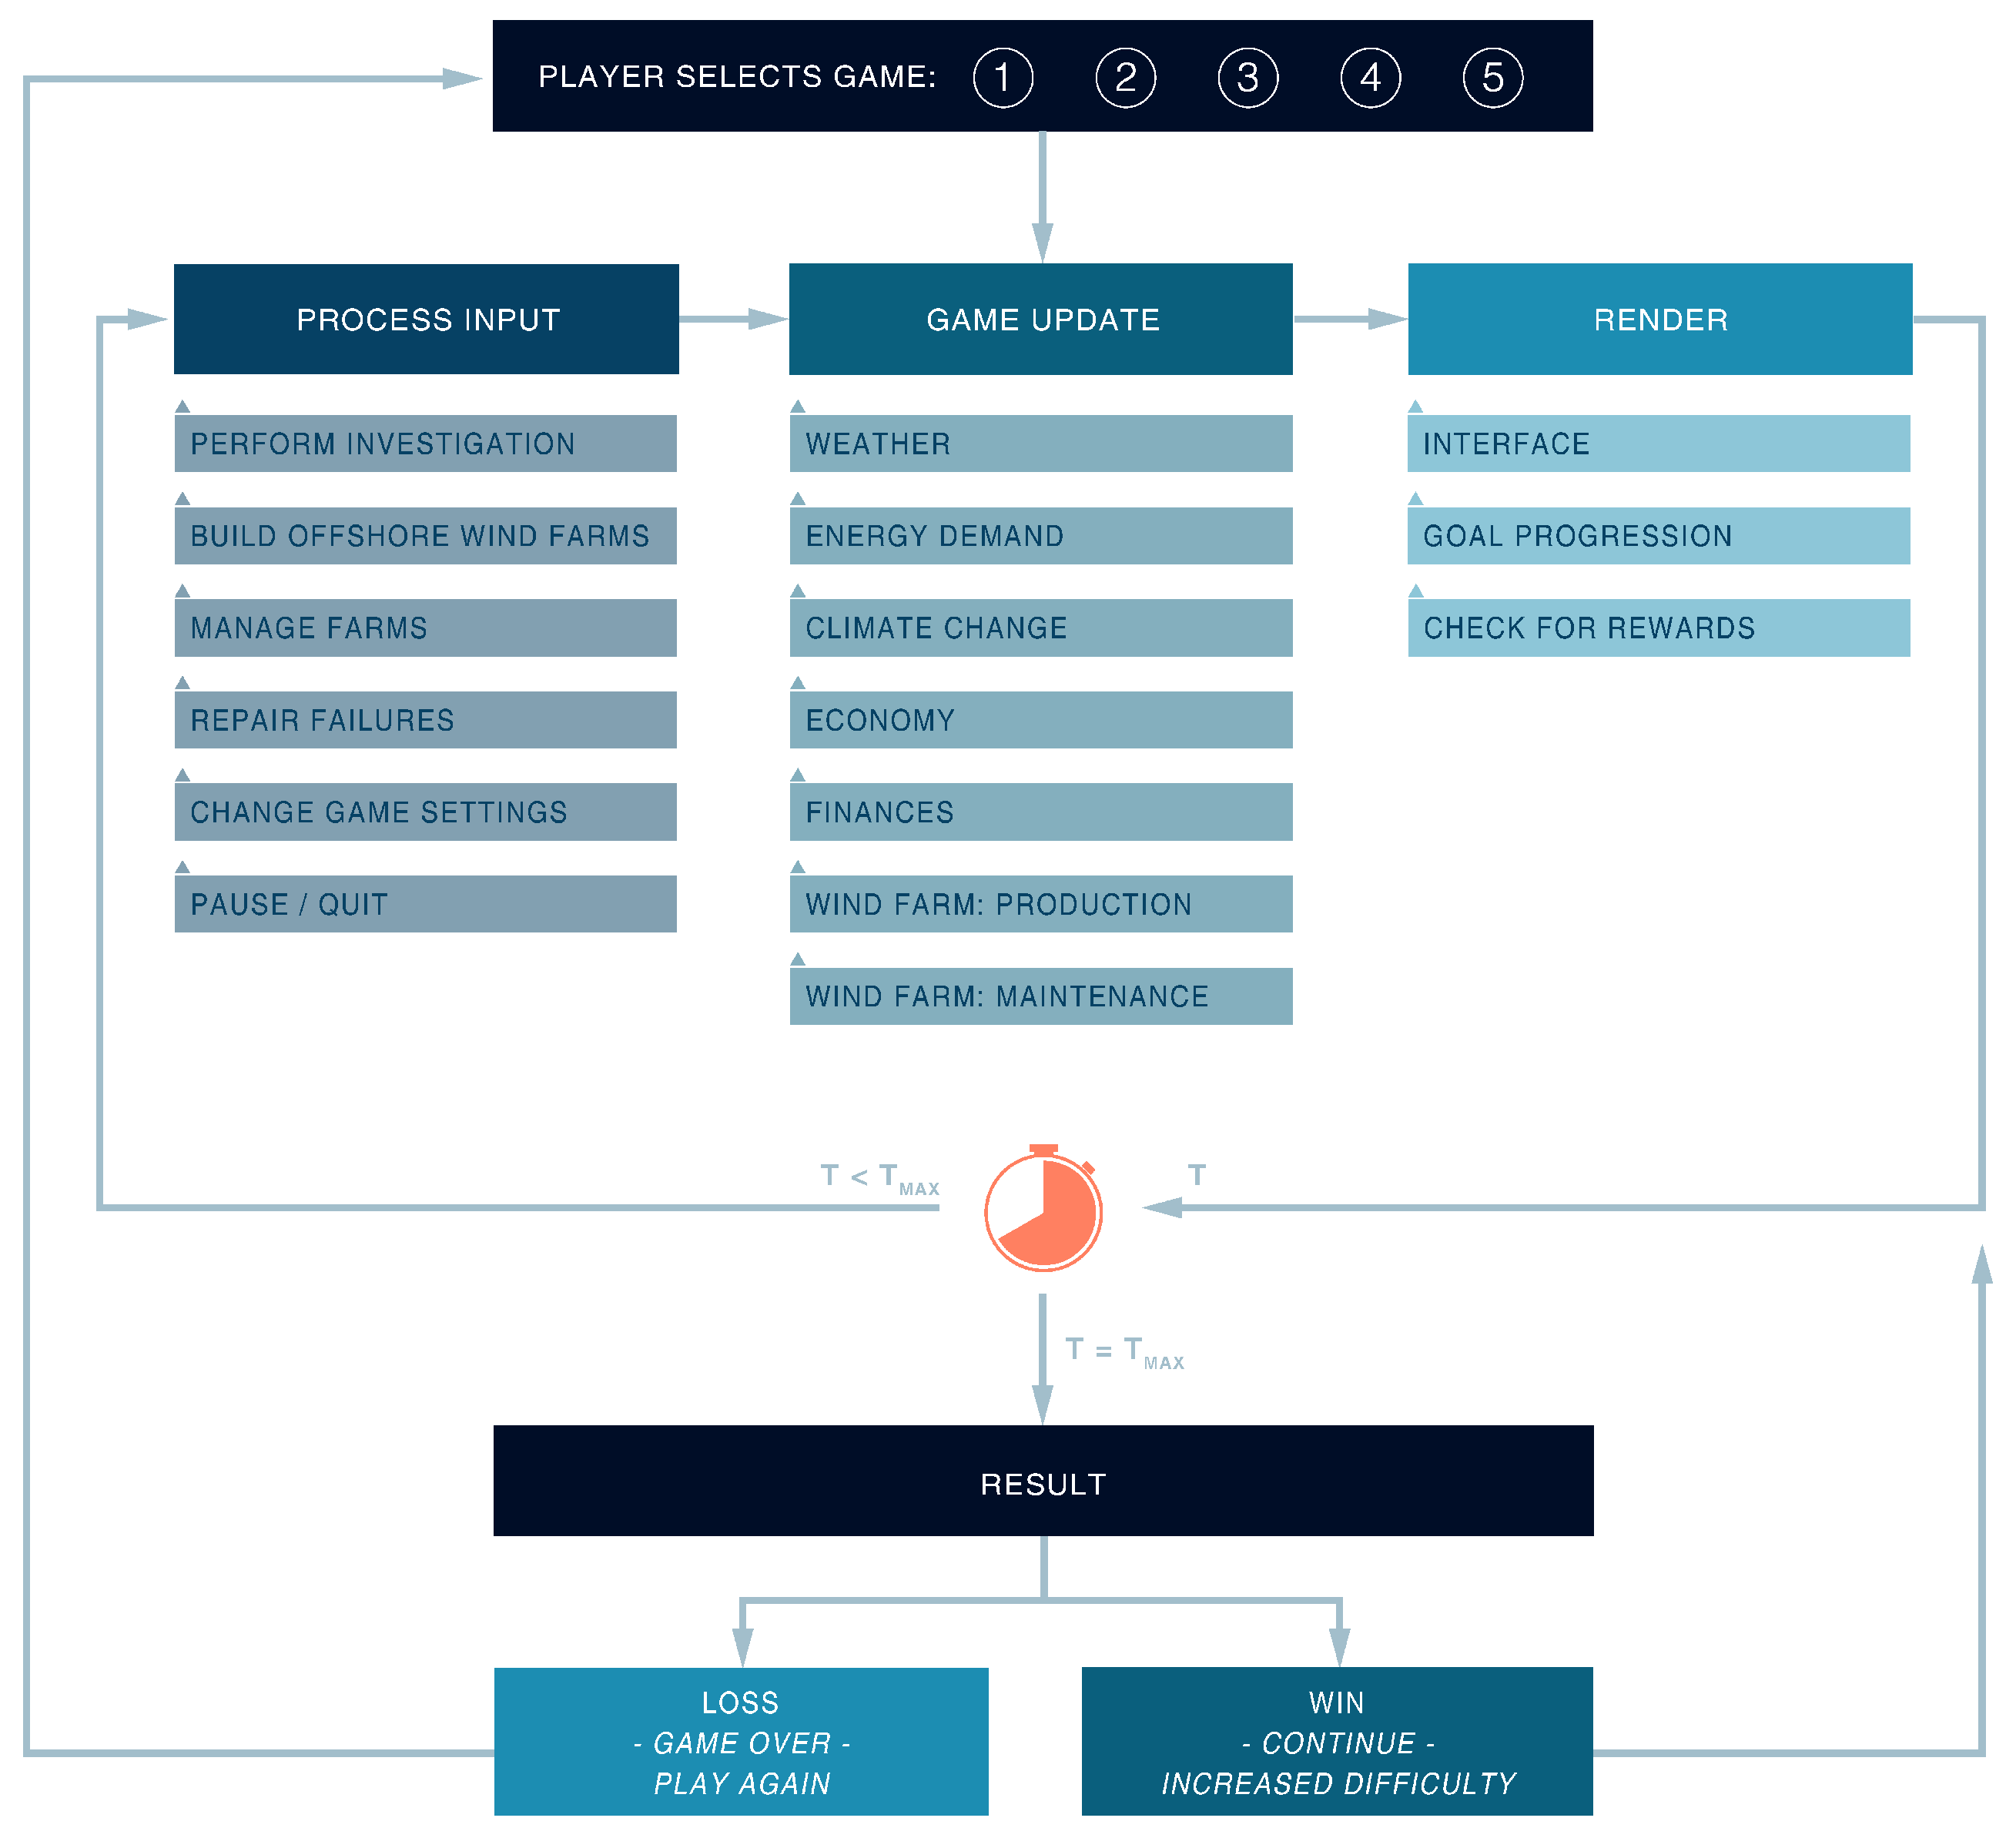
Feedback provided in the console is provided based on individual actions and occurrences in the game and in the form of regular reports. The default report is issued annually and presents game information with additional information about wind farm activity including a list of wind farms, list of investigated cells and their results, construction activity, climate change details, and details about stakeholder satisfaction. Vindby’s final game design includes a simulation loop displayed in Figure 4.
The loop begins with the player selecting the scenario they want to play among five possible game choices. The simulation loop then begins by updating the game’s weather, energy demand, climate change status, economy, and finances. The interface is rendered displaying the updated information, along with any important notifications about goal progression or game rewards. After this step in the loop, the game continues unless the designated game time for ending the chosen scenario (e.g., 2025 in scenario 1) has been reached, in which case the player is notified whether he or she has won or lost.
If the game is not over yet, the game loop continues to process any input that has been entered. This may include the player’s request to perform site investigation, build a wind farm, manage existing wind farms, change game settings, or pause or quit the game. The loop continues to the update phase once again, including the update of all wind farm production and maintenance status. The simulation has been designed such that the loop is continuous, although it can register input at any moment. The input is addressed in the “process input” step. Once the game time which presents the limit for the chosen scenario is reached, the result determines how the player can continue. A loss forces the player to either quit or play again, while a win offers a choice to continue playing the game.
4. Playtesting Results
In order to measure the effectiveness of the serious game and also to ensure playability, it was decided early in the game design phase to involve representatives from both target groups.
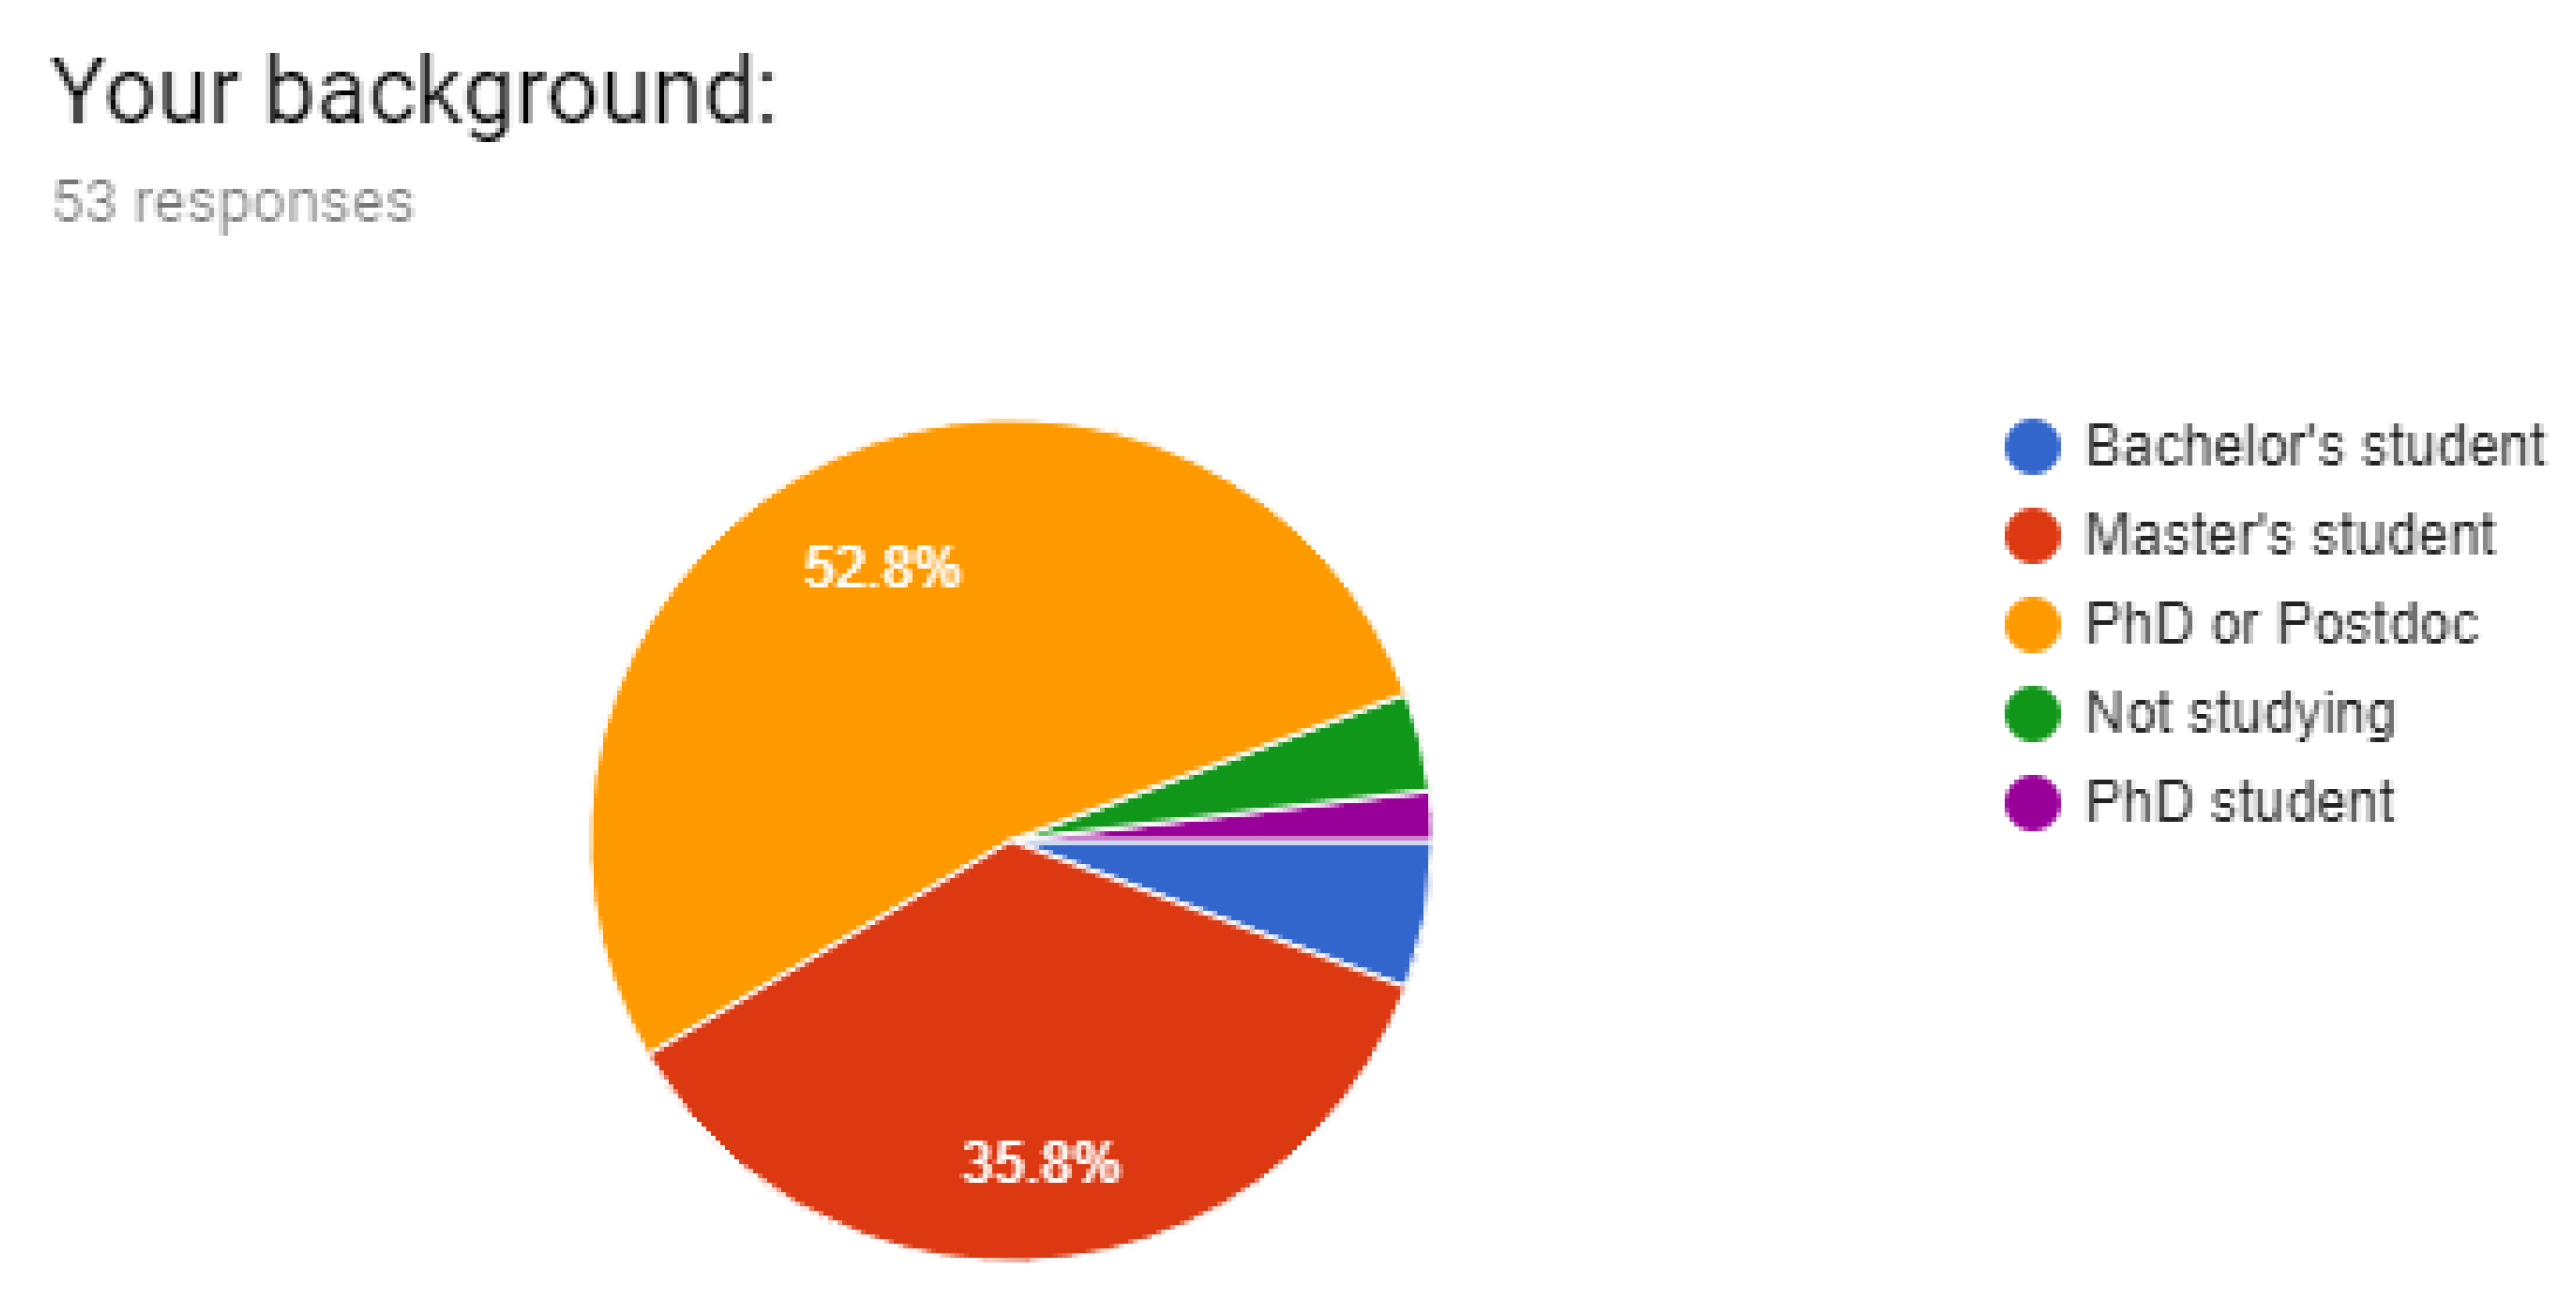
First, during the game design, a questionnaire was sent out to collect information on specific areas of interest by potential users. The link to the online questionnaire was sent to students at NTNU (Department of Civil and Environmental Engineering) not working in wind energy, early stage researchers in wind energy in Europe, as well as some members of the general public (selected based on non-work related relationships). The questionnaire was filled out 53 times. An overview over the background of the participants can be seen in Figure 5. Out of all the responses, 40% of participants indicated studying or knowing more about wind energy than the average person. The questionnaire had the option for the participants to provide a free response on what they would like to learn more about by playing the Vindby game. From 53 responses, the two most common topics were “payback period on carbon emissions” and “environmental impacts of offshore construction”. These, among other suggestions, were integrated into the game mechanics. Among individuals with some knowledge or background of offshore wind, there was a higher interest in the physical components of offshore wind and the O&M strategies. Participants with little to no knowledge of the topic were more interested in the costs and the stakeholder influence.
After game development, a playtesting session was organized for volunteers to play the final prototype game to analyze the educational strength of the game. The playtesting session was hosted at NTNU and consisted of volunteers. All of the participants were either Master- or PhD-students at the Department of Civil and Environmental Engineering. Out of the eight participants, four studied a subject related to wind energy. The other four studied another engineering field. Surveys were distributed before and after playtesting to identify potential shifts in knowledge. Additionally, a group discussion after the playtesting was used to identify playability issues and recommendations for improvements of the game.
During playtesting, a total of 203 wind farms were constructed in a total of 24 games played by eight people. The results from each game were saved and post-processed. The variation in wind farm characteristics (number and size of turbines, project costs, and capacity factors) indicate that the game encourages exploration. The degree to which players recognized value of site investigation information was measured by overlapping the investigated sites with sites with constructed wind farms. Across nearly all games played, 99% of wind farms constructed were in cells that had previously been investigated. This indicates that players quickly learned about the value of site investigations to make more informed decisions about building farms, and that they actively sought out that information. The cells that were investigated and not built on were broken down by site conditions to identify where players made informed decisions. Out of 344 instances, 137 of such decisions were made because of a restricted area (environmental or navigation), 92 decisions were made in areas with lower wind speeds (wind speed factor less than 1), and 118 were made in areas with poor soil quality.
Out of 169 farms built on investigated areas, 12% were built on cells with poor soil quality, but all of those farms were constructed using substructures that are suitable for poor soil (not monopile or gravity). This is a strong indicator that players made informed decisions about substructure choice and made use of information provided by the game.
Following playtesting, players shared and expressed their game experience in a group discussion. Players recognized that they felt engaged in the game and wanted to keep playing. The interest to continue playing was also observable in the replies to the post-game survey, where seven out of the eight participants replied that they would like to play the game again. The main point for improvement was considered to be improvements in the feedback provided by the game. Several players felt that they could not properly assess the long-term impacts of certain choices, e.g., for substructure reliabilities. Additionally, the frequent notifications for corrective or condition-based maintenance were deemed distracting, rather than informative, despite being recognized as information necessary to make better O&M choices.
5. Discussion
This section includes discussions on various results and challenges that arose as an outcome of this work.
Weather modeling: As part of the game, a weather simulation model has been developed. The mean hourly wave height is modeled with a Markov chain model. The correlated hourly mean wind speeds are then modeled based on conditional probabilities. From the hourly mean wind speeds, 10 min wind speeds are sampled from a Gaussian distribution with the hourly mean wind speed and its intra-hour variance as parameters. Investigations have shown that this model is capable of reproducing the properties of the data relatively well, both in terms of mean wind speeds for production estimates, and regarding the length of windows for maintenance access. The combination of Markov transitions with sampling from a distribution enables faster modeling time compared to pure Markov chain modeling, while still reproducing the statistical properties of the original data with sufficient accuracy.
Balancing accuracy and playability in game design: The product of this study, Vindby, is an interactive simulation that integrates two topics: simplified offshore wind farm design, and the design of a serious game. A holistic approach to game design was employed throughout this study. This ensured that the game is not a mere add-on to simplified offshore wind farm design, or that a simplified offshore wind farm design was merely added to an unaltered entertainment game [5]. This approach affected decisions made on the overall game dynamics and framework as well as the finer details of the game mechanics and the engineering processes. Great attention and detail were applied to developing an accurate weather simulation model to ensure that each game played is different than the next.
The other offshore wind farm topics were modelled by starting from the basic definition of elements and adding details that would be valuable to the player’s learning. This required a method of finding the appropriate level of detail, which was subsequently applied throughout the simulation. For example, substructure definitions were introduced as a fundamental element to offshore wind farm design. Subsequently, the reliability and costs were added to build game mechanics around choosing different substructures for different farms. The reliability and costs of the substructures vary with year of construction and site selection to teach the cost and design drivers to the player. This level of detail was considered sufficient, as there was ample information to generate the same outcome without adding more computations. Playability requires meaningful feedback, and unnecessary details may be detrimental to learning. In the example of substructures, this meant that the choice of the most economic and most reliable structure would be the same with or without further refinement of failure rates and specific costs.
In the end, Vindby managed to incorporate all the investigated game content into game rules and functions that resulted in an engaging game (as shown by the user feedback).
Simulation efficiency: Simulation efficiency directly impacts the speed at which the game runs. A digital game ideally runs at a speed consistent between computers and other platforms (e.g., mobile devices) for all game speed settings (slow, normal, and fast). The analysis of Vindby’s performance showed that the game runs with adequate, yet somewhat suboptimal efficiencies. The random generation of numbers in each game tick greatly slows down the simulation. While the selected weather model suits the game mechanics (reproducing variations in time and space), adjustments should be made to increase efficiency of calculations. This could be achieved by generating random time series for longer periods (e.g., during periods of inactivity, or between games), and then reading values from these series in each game tick.
Memory usage is another factor relevant for simulation efficiency. Values and attributes of nearly all objects are updated or checked every tick of the game loop. The storage of these values was kept to a minimum in the prototype, although it can be further reduced. This is possible by refining the game mechanics and minimizing the storage of unnecessary information. Furthermore, advanced programming concepts may be incorporated for serializing object structure, saving memory in the game module itself. Future programming should improve simulation efficiency without sacrificing feedback necessary for the player.
Alternatively, simulation efficiency can be improved by increasing the game loop interval resolution (currently set to one hour). This value may be increased to a day, or even a week, to decrease the number of updates and checks performed. In this case, adjustments must be made to ensure that production and weather are being updated correctly within the new interval. Additionally, the value of failure rates and unit costs must be either updated to a higher resolution or the code must be adjusted to still update these on an hourly basis.
Optimizer: The optimizer was originally planned as a prominent feature in the game and was intended as a dynamic function capable of independently running the game to produce large amounts of feedback. The development of such a sophisticated optimizer proved to be beyond the scope of this study. Small optimizer functions were created instead to provide feedback to the player on individual topics at specified points in the game. This approach is considered more static as it only runs these functions during specific events (when instructed to do so). This simplified strategy was used during gameplay and may be expanded to cover more topics. Alternatively, the original concept may be revisited through the incorporation of deep learning. The framework of multi-agent systems could be a fitting approach for providing close to optimal benchmark solutions for comparing with player behaviour.
Incompleteness of game development: Development of a serious game for the wind industry is actually an open-ended effort that might never be completely finished. New technologies are being constantly developed and existing technologies improved. Many researchers are working in the field and it is very likely that new concepts will need to be included in a serious game in the future, if this game should be a useful teaching tool or tool for outreach. Additionally, the user interface of the game can (and should be) improved. It was decided to publish the game now at this stage of development, such that others can immediately use it and contribute to further development. The reasons for decisions made in the game development and technical details are explained and documented here, enabling others to better understand and use the game.
6. Materials and Methods
Wind and wave data from the FINO 1 project are provided by the Bundesministerium für Wirtschaft und Energie (BMWi), Federal Ministry for Economic Affairs and Energy and the Projektträger Jülich, project executing organization (PTJ). They can be downloaded from http://fino.bsh.de/ by users from Europe, for research purposes.
The developed prototype of the game is freely available from the webpage http://folk.ntnu.no/muskulus/vindby/, licensed under Creative Commons Attribution—NonCommercial 4.0 International (CC BY-NC 4.0).
7. Conclusions and Future Work
7.1. Conclusions
The goals of this study were to develop a digital game for the design and the operational management of offshore wind farms, to be used for the purposes of training and dissemination, and to measure game effectiveness in terms of its simulations and educational power. After identifying the core components of serious games and methods for simplified wind farm design, a complete game framework was established and integrated into a prototype. The final prototype of the game is a functional simulation capable of reproducing realistic values of offshore wind farm parameters including weather, site investigation, design, O&M, climate impacts, and costs. The game mechanics were constructed around simplified wind farm design and are documented in detail in this study (additional details can be found in [16]). The game was playtested with voluntary participants, who filled out surveys before and after playtesting. A comparison of the answers in the pre- and post-playtesting surveys revealed that learning had taken place during playing the game. Therefore, the effectiveness in terms of the educational power of the game has proven successful at achieving its characterizing goals of learning about offshore wind farms. The engagement and exploration of the players in the game demonstrated that playability of the game was overall achieved.
7.2. Future Work
The game presented in this article is an implementation prototype and it has to be said that the development of a serious game for the given purpose is an open-ended effort as there will always remain potential for improvement. The success of a deployed version of a serious game about offshore wind energy in the future will depend on the improvement on various aspects of game design, simulation improvements, and interface development. A (non-exhaustive) list of recommendations for future work is presented below:
Simulation improvements: The game speeds must be improved to acquire 100% efficiency (i.e., the game must run at the desired speed across all platforms, whereas currently there is some lag when multiple farms are running at the game’s fast mode). This may be done by re-examining the simulation resolution. The program may be modified to preserve one hour of weather sampling and 10 min production estimates while performing the remaining calculations (such as checking for rewards and point deductions, updating energy demand, and repairing wind farm failures) once every 24 h only, whereas currently these are updated for every hour of game time. Another approach to improving game speeds is to consolidate the weather generation computations. Rather than generating random values when needed (i.e., in every hour of game time), a synthetic time series may be generated either at the start of every year, or while the game is paused. Waiting times during regular game play will then be minimized or eliminated.
Augmented offshore wind farm design: The simplified offshore wind farm design as represented in the game simulation currently includes a fraction of the possible topics that can be explored and integrated. Some key topics that have been discussed and suggested to add to the game include inter-farm and inter-turbine wake effects, turbine control systems, transmission losses, different types of site investigations, balancing costs in other non-renewable energies, investments in R&D, and more detailed stakeholder influence.
Optimizer: Playtesters paid attention to the small optimizer functions for O&M strategies and substructure selection. Further development of more optimizer functions regarding other design elements such as turbine selection, O&M decisions, and site selection may accelerate learning. Alternatively, a new large-scale optimizer may be developed that solves the entire game and offers complete optimally designed wind farms for the player to study for comparison.
Extensive Playtesting: In order to further validate the effectiveness of this serious game as a teaching tool, we highly recommend further testing of the game with a varied test-group. This group should specifically contain members of the general public with little to no knowledge about engineering. In order to achieve this variation in background, the members of the test group should be found through other means than university contacts. One possibility to find participants would be to look for volunteers at a local library, sport facility or other community that is not related to engineering.
Expanded platforms and improved interface: To expand the interest in playing, the game should be adapted for multiple platforms and devices. The ability to save and return to games would be valuable for continued use. A multiplayer platform may also broaden the outreach capabilities. Furthermore, an attractive user interface is necessary for deployment.
Author Contributions
M.M. conceived the idea of developing a serious game. H.S. and M.M. outlined the scope of the game. E.D., H.S. and M.M. designed and discussed the mechanics of the game. E.D. programmed the game. H.S. and M.M. reviewed the code and helped with debugging. E.D. developed the surveys, conducted the playtesting and analyzed the participant feedback. E.D. and H.S. prepared the figures for the paper. E.D. wrote the paper. H.S. and M.M. reviewed and edited the paper. H.S. was responsible for the paper submission.
Funding
The contribution of H.S. and the playtesting have received funding from the European Union’s Horizon 2020 research and innovation programme under the Marie Skłodowska-Curie Grant No. 642108.
Acknowledgments
We would like to thank four anonymous reviewers for their valuable comments and questions that have helped to improve the content of this article.
Conflicts of Interest
The authors declare no conflict of interest. The funders had no role in the design of the study; in the collection, analyses, or interpretation of data; in the writing of the manuscript, or in the decision to publish the results.
References
- Yanguas Miñambres, Ó. Assessment of Current Offshore Wind Support Structures Concepts: Challenges and Technological Requirements by 2020. Master’s Thesis, Karlshochschule International University, Karlsruhe, Germany, 2012. [Google Scholar]
- Ernst & Young. Offshore Wind in Europe: Walking the Tightrope to Success; Ernst & Young et Associes: Courbevoie, France, 2015. [Google Scholar]
- EWEA. Wind Energy Myths; European Wind Energy Association: Brussels, Belgium, 2018. [Google Scholar]
- Rossum, G. Python Reference Manual; CWI (Centre for Mathematics and Computer Science): Amsterdam, The Netherlands, 1995. [Google Scholar]
- Dörner, R.; Göbel, S.; Effelsberg, W.; Wiemeyer, J. Serious Games: Foundations, Concepts And Practice; Springer: Berlin/Heidelberg, Germany, 2016. [Google Scholar]
- Adams, E.; Dormans, J. Game Mechanics: Advanced Game Design; New Riders Games: Berkeley, CA, USA, 2012. [Google Scholar]
- Warmerdam, J.; Knepflé, M.; Bidarra, R.; Bekebrede, G.; Mayer, I. SimPort: A multiplayer management game framework. In Proceedings of the 9th International Conference on Computer Games (CGAMES06), Dublin, Ireland, 22–24 November 2006. [Google Scholar]
- Persuasive Games. Windfall. Available online: http://persuasivegames.com/game/windfall (accessed on 13 April 2019).
- 3M. 3M Wind Energy Virtual Lab. Available online: www.youngscientistlab.com/sites/youngscientistlab.com/files/interactives/wind-energy (accessed on 13 April 2019).
- Fu, F.L.; Su, R.C.; Yu, S.C. EGameFlow: A scale to measure learners’ enjoyment of e-learning games. Comput. Educ. 2009, 52, 101–112. [Google Scholar] [CrossRef]
- Schell, J. The Art of Game Design: A Book of Lenses; AK Peters/CRC Press: Boca Raton, FL, USA, 2014. [Google Scholar]
- Boller, S. Learning Game Design: Game Goals and Dynamics. Available online: http://www.theknowledgeguru.com/learning-game-design-goals-dynamics/ (accessed on 18 March 2019).
- Fullerton, T. Game Design Workshop: A Playcentric Approach to Creating Innovative Games; AK Peters/CRC Press: Boca Raton, FL, USA, 2014. [Google Scholar]
- Tavner, P. Offshore Wind Turbines: Reliability Availability and Maintenance; The Institution of Engineering and Technology: London, UK, 2012. [Google Scholar]
- Scheu, M.N.; Matha, D.; Muskulus, M. Validation of a Markov-based weather model for Simulation of O&M for Offshore Wind Farms. In Proceedings of the The Twenty-Second International Offshore and Polar Engineering Conference. International Society of Offshore and Polar Engineers, Rhodes, Greece, 17–22 June 2012. [Google Scholar]
- Dornhelm, E. Simplified Wind Farm Design as a Serious Game. Master’s Thesis, Norwegian University of Science and Technology NTNU, Trondheim, Norway, 2018. [Google Scholar]
- Carroll, J.; McDonald, A.; McMillan, D. Failure rate, repair time and unscheduled O&M cost analysis of offshore wind turbines. Wind Energy 2016, 19, 1107–1119. [Google Scholar]
- Group, D. Predicting Scour in Offshore Wind Turbines. Available online: https://www.dhigroup.com/global/news/imported/2012/7/31/predictingscourinoffshorewindfarms-nowabreezewithwitus (accessed on 18 March 2019).
- Kaiser, M.J.; Snyder, B. Offshore Wind Energy Cost Modeling: Installation and Decommissioning; Springer Science & Business Media: Berlin/Heidelberg, Germany, 2012; Volume 85. [Google Scholar]
- Department of Trade and Industry. Guidance on the Assessment of the Impact of Offshore Wind Farms: Seascape and Visual Impact Report; DTI: Makati, Philippines, 2005.
- Heier, S. Grid Integration of Wind Energy: Onshore and Offshore Conversion Systems; John Wiley & Sons: Hoboken, NJ, USA, 2014. [Google Scholar]
- Shafiee, M.; Brennan, F.; Espinosa, I.A. A parametric whole life cost model for offshore wind farms. Int. J. Life Cycle Assess. 2016, 21, 961–975. [Google Scholar] [CrossRef]
- Myhr, A.; Bjerkseter, C.; Ågotnes, A.; Nygaard, T.A. Levelised cost of energy for offshore floating wind turbines in a life cycle perspective. Renew. Energy 2014, 66, 714–728. [Google Scholar] [CrossRef] [Green Version]
- renewableUK. Wind Energy Statistics Explained. Available online: https://www.renewableuk.com/general/custom.asp?page=UKWEDExplained (accessed on 18 March 2019).
Figure 1.
Serious game terminology and concepts.

Figure 2.
Types of support structure concepts. From left to right: monopile, gravity based, jacket, tripod, spar, semi-submersible platform and tension-leg platform.
Figure 2.
Types of support structure concepts. From left to right: monopile, gravity based, jacket, tripod, spar, semi-submersible platform and tension-leg platform.

Figure 3.
Game graphic user interface. The left-hand side of the user interface shows information about a selected cell. The right hand side of the interface displays general information about the game. In the center, the virtual sea grid is displayed. More information about he colors and the content of the GUI is provided in the main text.

Figure 4.
Game design framework beginning with the selection of one of the five game options presented in Section 3.1.1. Please refer to the text for a detailed explanation.
Figure 4.
Game design framework beginning with the selection of one of the five game options presented in Section 3.1.1. Please refer to the text for a detailed explanation.

Figure 5.
Summary of the replies to the question “What is your educational background?” in the initial questionnaire.
Figure 5.
Summary of the replies to the question “What is your educational background?” in the initial questionnaire.


Table 1.
Concepts of serious games and terminology used throughout this article.
| Terminology for serious games | |
| Playing | Playing refers to a user engaging in the serious game for training or dissemination. This includes voluntary or required participation. Characterizing goals refer to the additional purpose of a serious game other than entertainment. |
| Characterizing goal | The characterizing goal for training is to improve technical judgement of the user. The characterizing goal for dissemination is to enhance the sentiment of the user towards offshore wind energy and introduce basic terminology. These goals are refined throughout the report and summarized in the conclusion. |
| Flow | Flow is the experience while playing characterized by exclusive concentration on the game, feeling immersed, feeling in control, facing clear goals, and receiving immediate and consistent feedback. Flow should encompass motivation to play, appeal to a spectrum of end users, removing factors that demotivate, and creating meaningful hints with feedback [5,11]. |
| Playability | Playability is the term used when referring to game usability, player experience, and the inclination for continued play. For the sake of simplicity playability will almost always be referred to as a composite measure throughout this study. |
| Terminology for game design framework | |
| Goals | Game objectives or game goals are what the player must achieve to win (not to be confused with the characterizing goals). The game goal includes a specific target to reach by playing e.g., an award or a certain number of points. |
| Dynamics | Game dynamics are the means by which players achieve the goal and can include one or many different dynamics. Common well-known dynamics include race-to-the-finish, construct, solve, and collection. |
| Mechanics | Game mechanics control the way players interact with the game. This includes specific rules and procedures that guide the player and the internal structure of the game, as defined by game dynamics. |
| Elements | Game elements are features of the game that keep players engaged such as story, rewards, and scoring. Games use one or more of these elements [12]. |
| Terminology for game production | |
| Content | Content refers to domain-specific knowledge. In this study, this pertains to simplified offshore wind farm design. This includes the engineering models, weather simulation, assumed parameter values, and formulas used to build the game. |
| Programming | Programming refers to the relevant algorithms and programming concepts used in the hardware and software arrangements on which the game is played. One of the challenges of programming is to ensure the game runs at a desired speed on different computers throughout the game. |
| Playtesting | Playtesting is the process of testing the prototype of a game by individuals not involved in the design. Feedback from players after playtesting is used to improve the prototype. |
Table 2.
Weather model results for mean wave height and wind speed for 10-year simulation.
| Simulation Hourly | Simulation 10 min | Mean Wave Height [m] | Mean Wind Speed [m/s] | Intra-Hour Variation [m/s] | Error Wave Height | Error Wind Speed |
|---|---|---|---|---|---|---|
| Observed | Observed | 1.51 | 9.37 | 0.55 | - | - |
| wave to wind | Markov | 1.52 | 9.55 | 0.75 | 0.55 % | 1.97 % |
| wave to wind | Gaussian | 1.49 | 9.48 | 0.56 | −1.18 % | 1.20% |
| wind to wave | Markov | 1.47 | 9.38 | 0.73 | −2.66% | 0.12% |
| wind to wave | Gaussian | 1.47 | 9.35 | 0.56 | −2.73 % | −0.25% |
Table 3.
Failure rates per turbine per hour. The failure rates depend on the mean wave height (WH), soil quality (poor/medium/good), turbine size (TS) and type of structure.
Table 3.
Failure rates per turbine per hour. The failure rates depend on the mean wave height (WH), soil quality (poor/medium/good), turbine size (TS) and type of structure.
| Monopile | Gravity | Jacket | Tripod | Spar | Semi-Submersible | Tension Leg | |
|---|---|---|---|---|---|---|---|
| Scour | poor: 0.0001 | poor: 0.0001 | 0 | 0 | 0 | 0 | 0 |
| Fatigue | 0.00001 × WH | 0.00001 × WH | 0.000005 × WH | 0.000005 × WH | 0.00002 × WH | 0.00002 × WH | 0.00002 × WH |
| Corrosion | 0.00001 | 0 | 0.00002 | 0.00002 | 0.00001 | 0.00002 | 0.00001 |
| Bearing | 0 | medium: 0.0001 poor: 0.0002 | 0 | 0 | 0 | 0 | 0 |
| External load | 0.000001 × TS | 0.0000005 × TS | 0.000001 × TS | 0.0000005 × TS | 0.000001 × TS | 0.000001 × TS | 0.0000005 × TS |
Table 4.
Defining parameters for the linearized power curves used to calculate power production in the game.
Table 4.
Defining parameters for the linearized power curves used to calculate power production in the game.
| Turbine Rating [MW] | Cut-In [m/s] | Slope | Rated Speed [m/s] | Cut-Out [m/s] |
|---|---|---|---|---|
| 3 | 3 | 0.3 | 12 | 23 |
| 5 | 3 | 0.5 | 11 | 25 |
| 7 | 4 | 0.8 | 13 | 25 |
| 10 | 3 | 1.2 | 11 | 25 |
| 15 | 4 | 1 | 15 | 25 |
Table 5.
Vindby Support structure cost for different water depths in good quality soil [€ million].
| Water Depth [m] | Monopile | Gravity | Jacket | Tripod | Spar | Semi-Submersible | Tension Leg |
|---|---|---|---|---|---|---|---|
| 0 | 0.0 | 0.0 | 0.0 | 0.0 | 25.7 | 11.1 | 25.8 |
| 10 | 0.8 | 1.4 | 1.1 | 1.6 | 23.5 | 9.5 | 23.6 |
| 20 | 1.6 | 2.7 | 2.1 | 3.2 | 21.4 | 8.0 | 21.5 |
| 30 | 3.3 | 6.5 | 3.2 | 4.8 | 19.2 | 8.0 | 19.4 |
| 40 | 0.4 | 8.7 | 4.2 | 6.4 | 17.1 | 8.0 | 17.2 |
| 50 | 5.4 | 10.9 | 5.3 | 8.0 | 14.9 | 8.0 | 15.1 |
| 60 | 6.5 | 13.1 | 6.4 | 9.6 | 12.7 | 8.0 | 12.9 |
| 70 | 7.6 | 15.2 | 7.4 | 11.2 | 10.6 | 8.0 | 10.8 |
| 80 | 8.7 | 17.4 | 8.5 | 12.8 | 8.4 | 8.0 | 8.7 |
| 90 | 9.8 | 19.6 | 9.5 | 14.4 | 6.3 | 8.0 | 6.5 |
| 100 | 10.9 | 21.8 | 10.6 | 16.0 | 4.1 | 8.0 | 4.4 |
| 110 | 12.0 | 23.9 | 11.7 | 17.6 | 4.1 | 8.0 | 4.4 |
| 120 | 13.1 | 26.1 | 12.7 | 19.2 | 4.1 | 8.0 | 4.4 |
| 130 | 14.1 | 28.3 | 13.8 | 20.8 | 4.1 | 8.0 | 4.4 |
| 140 | 15.2 | 30.5 | 14.8 | 22.4 | 4.1 | 8.0 | 4.5 |
| 150 | 16.3 | 32.6 | 15.9 | 24.0 | 4.1 | 8.0 | 4.5 |
© 2019 by the authors. Licensee MDPI, Basel, Switzerland. This article is an open access article distributed under the terms and conditions of the Creative Commons Attribution (CC BY) license (http://creativecommons.org/licenses/by/4.0/).
Share and Cite
MDPI and ACS Style
Dornhelm, E.; Seyr, H.; Muskulus, M. Vindby—A Serious Offshore Wind Farm Design Game. Energies 2019, 12, 1499. https://doi.org/10.3390/en12081499
AMA Style
Dornhelm E, Seyr H, Muskulus M. Vindby—A Serious Offshore Wind Farm Design Game. Energies. 2019; 12(8):1499. https://doi.org/10.3390/en12081499
Chicago/Turabian StyleDornhelm, Esther, Helene Seyr, and Michael Muskulus. 2019. "Vindby—A Serious Offshore Wind Farm Design Game" Energies 12, no. 8: 1499. https://doi.org/10.3390/en12081499
Note that from the first issue of 2016, this journal uses article numbers instead of page numbers. See further details here.