1. Introduction
Electrical power systems consist of a large number of interconnected synchronous generators (SGs) operating in parallel, connected to transmission and distribution networks to supply large load centers. These machines are fundamental elements of power systems, and their condition affects network reliability and stability [
1]. The parallel operation of SGs presents several advantages such as the increase of supply reliability, the improvement of efficiency, and lower cost. However, it increases the complexity of the stability control of the SGs when a fault occurs [
2]. Thus, there is a growing interest in new technologies to improve SG protection and maintenance schemes [
3,
4,
5].
Among the maintenance philosophies that have been applied to SGs, condition-based maintenance (CBM) is highlighted. This type of maintenance is based on the continuous monitoring of a condition parameter in a machine (vibration, temperature, electrical signals, etc.) [
6]. CBM consists of the analysis of the monitored parameters to evaluate if certain indicators present signs of decreasing performance or incipient fault. Thus, the actual condition of the asset is evaluated, and it is possible to decide what and when the maintenance action must be done [
7].
In the context of CBM, electrical signature analysis (ESA) has been increasingly applied to rotating electric machines fault diagnostics. In ESA, the monitored parameters are the electrical signals of the machine in the frequency domain. This is performed by using a Fast Fourier Transform (FFT) algorithm and other signal processing procedures. The faults are detected and identified by analyzing fault patterns on voltage and current spectra, which are frequency components whose magnitudes vary when a fault happens. Moreover, faults can be detected at an early stage and the frequency components’ magnitudes are generally related to the fault severity. The main advantages of ESA are no intrusiveness, dependence on only electrical quantities, technical and economic viability, and possibility of obtaining fault patterns applicable for all types of wound rotor SGs [
6,
8,
9,
10].
There are several published works about ESA-based methodologies for fault detection in synchronous machines. ESA has been used mainly for detection of stator winding inter-turn short circuit [
11,
12,
13,
14,
15,
16], rotor winding inter-turn short circuit [
11,
13,
17,
18,
19,
20], air-gap eccentricity [
21,
22,
23,
24,
25], and rotating diode failure [
26,
27]. There are also works approaching various electrical and mechanical faults in SGs [
28].
Despite the increasing use of ESA in CBM, it is important to highlight that some particularities arise when this technique is applied to SGs. Firstly, the choice of signals to be analyzed must be considered, because both current and voltage are outputs of these machines. There is also an issue related to faults that coincide in the same fault pattern. For instance, the rotor rotation frequency fault pattern is indicative of rotor winding inter-turn short circuit and rotor mechanical faults [
9,
11,
13,
19,
29]. Thus, the analysis of only the rotation frequency components allows the detection of rotor problems. However, this is not sufficient to identify the type of fault (electrical or mechanical). There is also an issue related to two-pole type SGs. In these machines, the rotor rotation frequency matches the power line frequency. Therefore, the fault patterns and the power system harmonics match the same components. Thus, the ESA-based fault diagnostic can be obscured because of the SGs intrinsic harmonics or harmonics related to non-linear loads [
30,
31,
32,
33,
34]. Finally, in general, the works found in literature present ESA application to isolated SGs, both in a laboratory environment and in SGs onboard ships [
13,
15,
24]. However, large SGs are usually interconnected to power systems, so ESA should also be applied to SGs in this condition.
Given this scenario, this paper presents a study on fault diagnosis of SGs in bulk electric systems using ESA. Firstly, a methodology for SG fault detection using ESA is proposed, addressing ESA fault patterns and the mentioned peculiarities of this technique for fault detection in SGs. Then, as the main contribution of this work, case studies of fault detection using ESA in an in-service SG in a Brazilian hydroelectric power plant are presented. The results show the potential of ESA for condition monitoring of SGs interconnected to power systems and are valuable, since SGs in this context are concerned with monitoring and are subjected to diverse conditions of the bulk power system. As mentioned previously, other works usually present results in a laboratory environment with isolated SGs and controlled conditions, which do not fully depict the SGs in practical situations.
As a note, it is known that SGs conditions might include normal condition, oil-membrane oscillation, imbalance, no orderliness, short circuit, and so on. However, this work focuses on conditions covering healthy and faulty situations, including fault detection and identification. Moreover, it is worth noting that artificial intelligence-based methodologies have been increasingly applied to rotating machinery fault detection and condition monitoring nowadays [
35,
36,
37]. These techniques can be used in future works as auxiliary tools to complement the fault diagnosis by using the proposed methodology, being not in the scope of the present work.
The rest of the paper is divided as follows.
Section 2 presents the ESA background.
Section 3 presents ESA fault patterns for SGs.
Section 4 approaches the peculiarities of ESA application to SGs.
Section 5 presents the proposed methodology for fault detection in SGs in interconnected power systems.
Section 6 presents results of fault detection in SG in a power plant. Finally,
Section 7 presents the conclusions.
2. Electrical Signature Analysis Background
ESA consists of the frequency-domain representation, processing, and analysis of electrical signals and has been usually applied in electric machinery condition monitoring. In general, ESA comprises of an FFT (Fast Fourier Transform) algorithm to represent the time-domain signals in the shape of spectra, which are referred in this work as electrical signatures. ESA is based on the assumption that a significant change in a machine condition results in the change of its electrical signature. Moreover, there are specific frequency components whose magnitudes change in the presence of faults. These frequency components are related to the type and location of fault, being dependent on the power line frequency and structural characteristics of the motor or generator. Thus, it is possible to obtain a set of ESA fault patterns for fault detection and identification in electrical machines [
38]. Moreover, the fault patterns can be applicable to all types of wound rotor SGs.
The ESA techniques used in this work are current (CSA) and voltage signature analysis (VSA), and extended Park’s vector approach (EPVA), which will be explained in the next sections.
2.1. Current and Voltage Signatures
CSA and VSA consist purely of the frequency-domain analysis of the current and voltage signals from the machine stator. The electrical signatures are obtained through the application of FFT to voltage and current signals. FFT is an algorithm with the purpose of computing the Discrete Fourier Transform (DFT) in a faster way. Considering a list of complex numbers, the DFT transforms that into a list of coefficients of a finite combination of complex sinusoids. Each DFT component is given by [
39]:
where
m is the DFT index (harmonic order),
n is the time-domain index,
N is the number of samples,
Xm is the
mth DFT coefficient, and
xn is the time-domain list of equally-spaced complex samples.
FFT decomposition allows the determination of the magnitude and the phase of each frequency component of the electrical signal under analysis. As mentioned previously, these components can compose a set of fault patterns for machine diagnosis, and generally the magnitudes of these components increase according to the fault severity.
In practice, the spectral components’ magnitudes are usually presented normalized in relation to the fundamental component magnitude (line frequency), due to the changes of current in function of load. Moreover, the use of a logarithm scale (in general, dB) is common, because of the big difference between the magnitudes and the exponential characteristic of the evolution presented for several known faults [
7].
In general, the fault components are expressed in the frequency spectrum as:
where
fe is the fault frequency as it appears in the spectrum, considering the power line frequency modulation;
f1 is the power line frequency;
k is a positive integer value, indicating the harmonic order; and
fc is the specific fault characteristic frequency.
2.2. Extended Park’s Vector Approach
EPVA is a technique based on a quantitative analysis of the Park circle distortion, whose main characteristic is considering information of the three phases of electrical signals. It is specifically used as a fault indicator of stator electrical unbalance. A brief explanation of this technique is provided below [
12,
40].
The components of Park’s vector (
iD and
iQ) for a set of three phase balanced currents are computed by applying the Clarke transformation and given by:
where
iD and
iQ are the current components of Park’s vector in direct and quadrature axes, respectively; and
iA,
iB, and
iC are balanced line currents in phases
A,
B and
C, respectively.
When the conditions are ideal, the resultant Park circle is a perfect circle, whose center locates at the origin of the coordinates. Considering the wave shape parameters of the balanced line currents
A,
B and
C, it is obtained:
where
iM is the peak value of the line current;
ω is the angular frequency, in (rad/s);
θ is the initial phase angle, in (rad); and
t is the time variable.
When the conditions are not ideal, for instance, when an electrical unbalance is present, the Park circle presents some distortion. Thus, the currents contain direct and inverse sequence components, which can be represented as:
where
id is the maximum value of the direct sequence current;
ii is the maximum value of inverse sequence current;
θd is the initial phase angle of the direct sequence current, in (rad); and
γi is the initial phase angle of the inverse sequence current, in (rad). By substituting (5) in (3), it is obtained:
In order to obtain the resultant signal for analysis, the computation of the square of Park’s vector module is executed:
Finally, the FFT algorithm is applied to the square of the Park’s vector module. In the presence of electrical unbalance, the resulting spectrum contains a DC level and a component located at twice the power line frequency. This component is defined as the EPVA electrical unbalance fault pattern.
As a final comment, the procedure has been explained for current signals, but the same can be used for voltage signals.
3. ESA Fault Patterns for Synchronous Generators
This section presents ESA fault patterns for SGs that will be used in the proposed methodology of this work. These patterns are valid for different types of SGs and have been presented in the literature and proved experimentally [
41]. An observation is that both voltage (VSA or EPVA) and current (CSA or EPVA) signatures must be analyzed.
3.1. Rotor Winding Inter-Turn Short Circuit
SG rotor winding inter-turn short circuit fault presents the characteristics: increase of rotor current, an increase of winding temperature, distortion of voltage waveform, unusual vibration, and possibility of mechanical faults occurring.
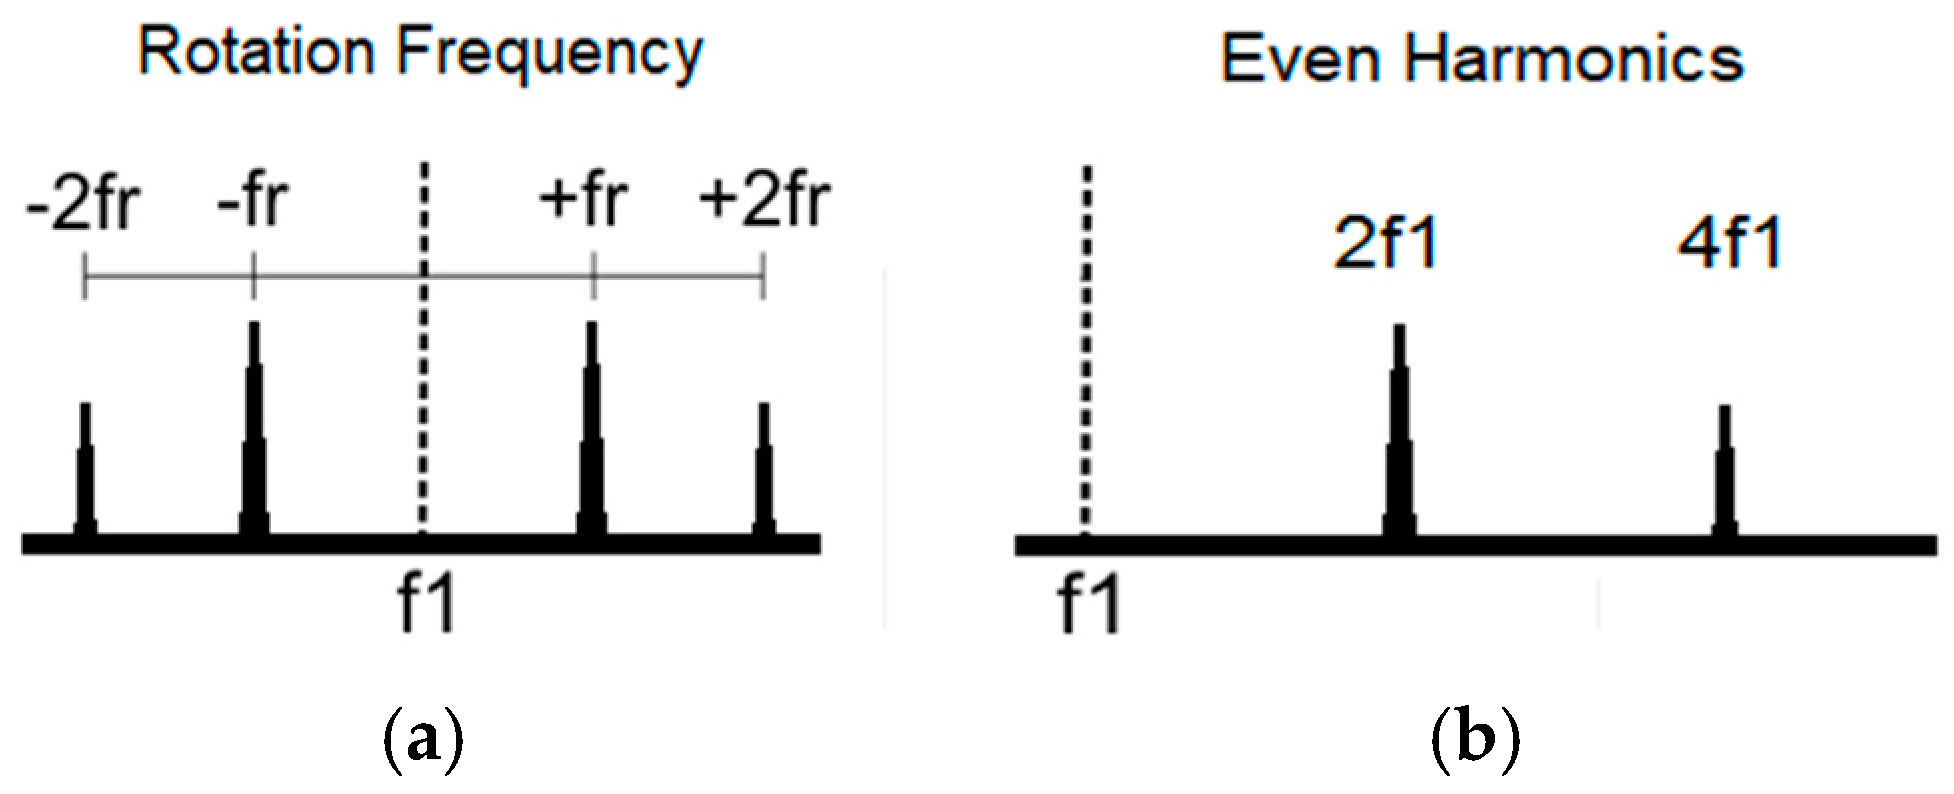
The proposed ESA fault patterns are rotor rotation frequency pattern and even harmonics on the electrical signature.
The rotor rotation frequency is defined by the monitoring of line frequency with sidebands in integer multiples of rotor rotation frequency. The rotor rotates at synchronous speed. Thus, the rotor rotation frequency is given by:
where
fr is the rotor rotation frequency,
f1 is the line frequency, and
P is the number of pole pairs. A note is that the expression “pole pairs” is used to refer to the “physical” number of pole pairs in the rotor of the SG and this is valid for all the times this expression appears in this paper. Thus, the rotation frequency pattern is given by [
6,
13,
19,
38]:
where
fpfr are the spectral components analyzed for SG rotor mechanical problems and
k is a positive integer.
Figure 1a illustrates the rotor rotation frequency, which must be analyzed on voltage and current signatures.
Another proposed fault pattern for this type of fault is the analysis of even harmonics (
fphp) in the electrical signature, which are given by [
13,
19,
33,
34]:
This pattern must be analyzed on voltage and current signatures and is illustrated in
Figure 1b.
3.2. Stator Winding Inter-Turn Short Circuit
Another type of fault that SGs can suffer is stator winding inter-turn short circuit, whose characteristics are: the emergence of pulsating currents and generation of rotating fields in the opposite direction of the original one.
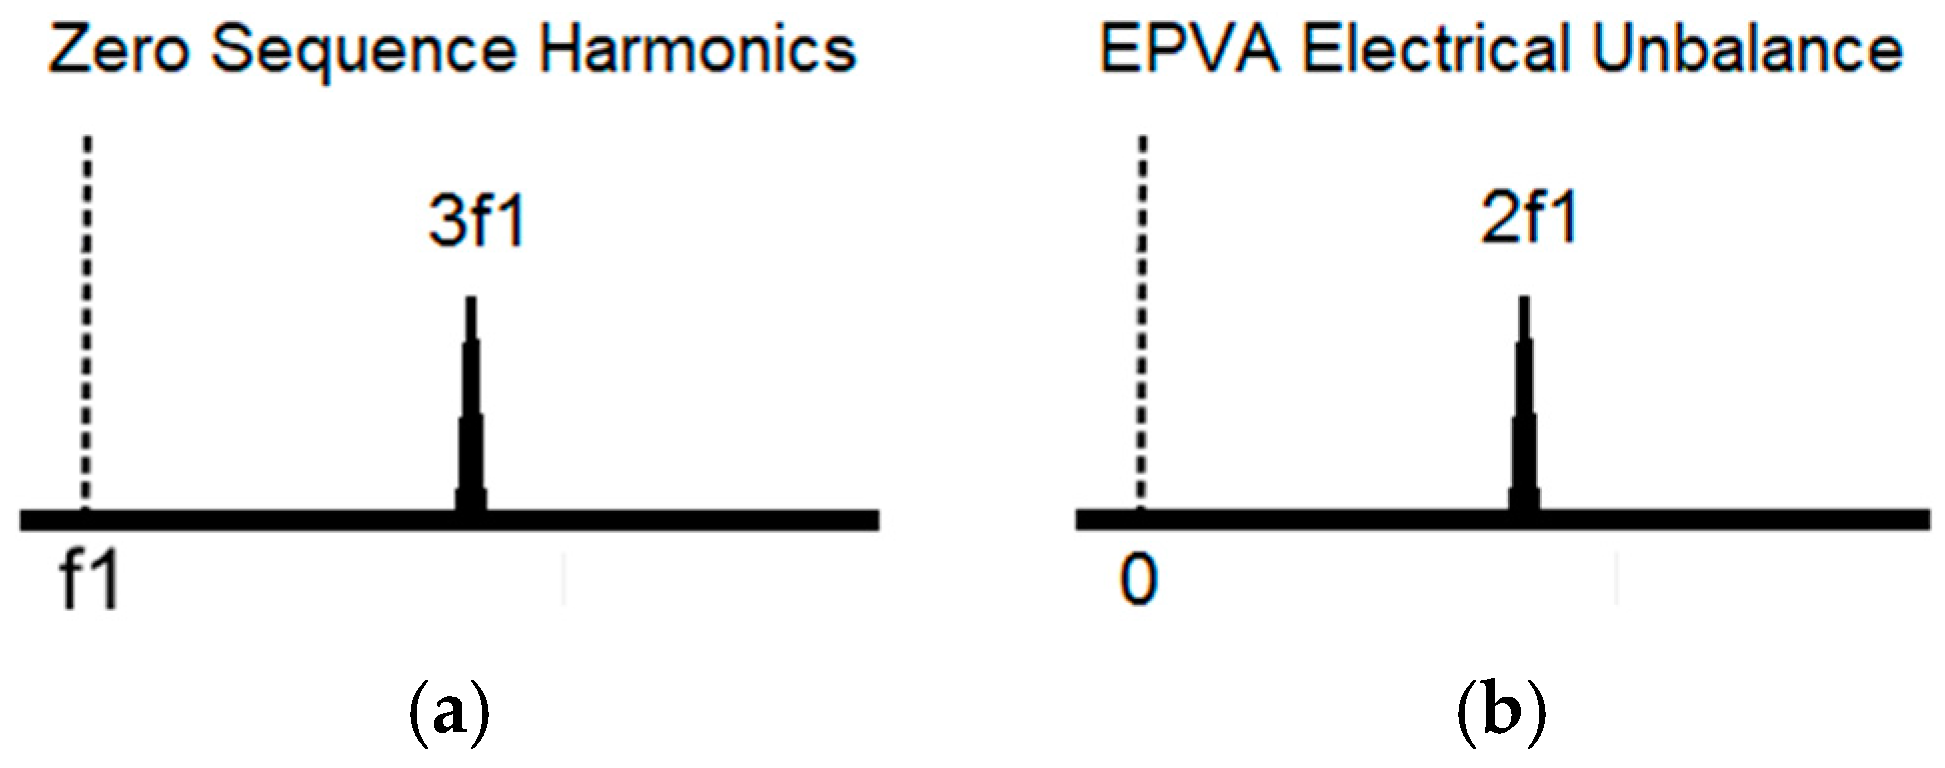
The proposed fault patterns for this fault are the zero sequence harmonics (mainly the third harmonic) in the electrical signature, and the EPVA electrical unbalance pattern [
12,
13].
The zero sequence harmonics fault pattern (
fphsz) is given by:
This fault pattern must be analyzed in voltage and current signatures and is illustrated in
Figure 2a.
The EPVA electrical unbalance pattern (
fepva) is defined as the component of twice the line frequency in the EPVA spectrum of voltage and current, being represented as:
Figure 2b illustrates this pattern, which must be analyzed on EPVA voltage and current signatures.
As a note, these patterns are also valid for other faults that result in stator electrical unbalance (phase-to-neutral short circuit, phase-to-phase short circuit, open circuit fault).
3.3. Rotor Mechanical Faults
Rotor mechanical faults include mechanical misalignment, mechanical unbalance, static airgap eccentricity, and dynamic airgap eccentricity. Some effects of these faults include: an increase in vibration, higher electromagnetic stress, an increase of unbalanced magnetic pull (UMP), increase of bear wear, and rotor and stator rubbing.
The fault pattern proposed for these faults is the rotor rotation frequency on voltage and current signatures, as illustrated in
Figure 1a, because these faults also cause an increase in the magnitude of this component [
25,
29,
38].
4. Peculiarities of Electrical Signature Analysis of Synchronous Generators
The last section presented ESA fault patterns for SGs. However, it is important to contextualize that ESA has been largely applied to fault detection of induction motors in an industrial environment and the application to SGs is more recent and entails some peculiarities. Thus, this section compiles some important issues related to ESA application to SGs condition monitoring.
4.1. Signal Analysis
The first peculiarity of ESA application to fault detection of SGs is related to the choice of signals to be analyzed because both voltages and currents are outputs of these machines. In the literature, ESA experts recommend to analyze the stator voltage and current signals. In the case of isolated SGs, the analysis should focus on the voltage signature (VSA and EPVA) and relate to the current signature (CSA and EPVA). If the component magnitude under analysis is greater in voltage than in current (in dB), one may suppose that there is an incipient fault in the SG. Otherwise, one may suppose that the incipient fault is in the load [
28].
These considerations are valid for isolated SGs. This work assumed that for SGs interconnected to power systems, the focus should be on current signature (CSA and EPVA). This because if an SG is connected to an infinite bus, then the system voltage would prevail over the SG generated voltage.
4.2. Discrimination of Mechanical and Electrical Rotor Faults on Fault Patterns
A second peculiarity is related to the discrimination of faults whose effects occur in the same fault pattern. As one may note, the rotor rotation frequency pattern is indicative of rotor mechanical problems, and rotor winding inter-turn short circuit [
11,
13,
19,
25,
29]. Thus, by analyzing only this fault pattern, it is possible to detect rotor problems, but not to distinguish if it is an electrical or a mechanical problem. In order to get a reliable fault diagnosis for SGs based on ESA, it would be necessary to separate the effects of electrical and mechanical faults in the rotation frequency components.
A methodology based on the analysis of symmetrical components to distinguish SG rotor faults has been proposed in [
9]. This approach focused on the first right sideband of the rotation frequency, presenting a theoretical analysis and experimental results. The cited work found that the rotor winding inter-turn short circuit fault caused the increase of positive (mainly), negative, and zero sequence magnitudes of the rotation frequency’s first right sideband. On the other hand, the rotor mechanical unbalance caused the increase only of the positive sequence magnitude of the rotation frequency’s first right sideband. Thus, these findings should be associated with the rotor rotation frequency fault pattern, to provide a better fault diagnosis using ESA.
4.3. Two-Pole Synchronous Generators
The SGs at hydroelectric power plants are usually built with a salient pole for two or more pole pairs (low-speed or hydrogenerators), and SGs at thermal and nuclear power plants are normally built with a non-salient pole for one or two pole pairs (high speed or turbogenerators) [
42]. As the proposed ESA methodology is applicable for both types of SGs, a last peculiarity emerges for the specific case of two-pole SGs. In this case, the rotation frequency is equal to the line frequency (fundamental frequency). Thus, the fault patterns match the harmonics of the fundamental frequency. The harmonics in an SG include the intrinsic harmonics due to the structural characteristics of the SGs and the magnetomotive force waveform, harmonics due to non-linear loads fed by the SG (they reflect in the SGs signals because of the armature reaction effect), and harmonics due to possible internal faults of the SGs (for instance, the second harmonic as indicative of rotor faults). In practice, even healthy machines may present even harmonics, and this can confuse the fault diagnosis when using ESA [
30,
31,
32,
33]. Even harmonics are indicative of rotor winding short circuit and the second harmonic matches the rotation frequency pattern’s first right sideband. For a correct fault diagnostic, it is necessary to do an in-depth study about the different harmonics in SG signals and the interactions among them.
A previous study [
34] on this issue concluded that the SG intrinsic even harmonics (due to possible internal asymmetry in the machine or mechanical misalignment condition) did not confuse the diagnosis of rotor winding inter-turn short circuit fault by using ESA. The cited work was substantiated by experimental results. However, for future works, it is important to perform experimental tests with non-linear loads at the SG output to analyze the effect of harmonics in ESA fault patterns and their influence on fault detection.
Finally, it is not the scope of this work to approach in depth each cited peculiarity. The main objective was to point them out and show how they have been approached. Moreover, the influence of saturation and power factor in SG fault detection is not addressed, being proposed for future works.
5. Proposed Methodology for Fault Diagnosis of SGs in Bulk Electric Systems
This section describes the proposed ESA-based methodology for condition monitoring of SGs, considering the ESA fault patterns and the SGs peculiarities presented in the last sections.
A system has been developed for SGs CBM based on ESA. The system includes two PS TTD-01 differential AC voltage transducers, 2.5% peak-to-peak error, used to measure two phase-to-phase voltages. Two TT 50-SD differential AC current transducers, 2.0% peak-to-peak error are used to measure two line-currents. The transducers are installed at the secondary side of the SGs voltage and current transformers, and are accessed through the panels of the generating units (GUs).
The transducers are connected to an acquisition system by National Instruments composed by the Ethernet cDaq-9181 carrier and the NI-9239 module for data acquisition. This system is provided with four channels for simultaneous signal acquisition, and the acquisitions are accomplished with 131072 points each one and 16.67 kHz sample frequency. The analog-to-digital converter resolution is 24 bits.
The acquisition system communicates with a personal computer through a signal analysis software (SAS) developed in C# to command the acquisitions and perform the signal analysis and the machine diagnosis. The set of fault patterns presented in (9)–(12), including the symmetrical components approach described previously, is implemented in the SAS. The SAS is the heart of the proposed system, being the part of the system where the fault patterns and rules presented in
Section 3 and
Section 4 are implemented to perform fault detection and identification, even for an SG connected to the grid.
The first step of the proposed methodology is the acquisition of the machine’s electrical signals. Once acquired, the signals are processed, the FFT algorithm is applied to get the signal spectral components, other signal processing techniques or post-processing analysis are performed, the database is fed with this information, and the SAS performs the analysis. Thus, the electrical signatures can be analyzed in a qualitative and quantitative way, especially considering the predefined fault patterns.
Figure 3 presents a schematic diagram of the described ESA-based methodology for SGs CBM.
The described process is performed continuously over time. The system can be programmed to acquire a number of signals in predefined time intervals, each day. Then, a database is created and continuously fed. The analysis for fault detection is performed considering the database stored from the system installation time until the moment of analysis. This is performed by analyzing the trend curves of the fault patterns magnitudes. Thus, it is possible to note any abnormal increase in a component magnitude and its evolution over time.
The analysis is accomplished by setting alarms for the fault pattern’s component’s magnitudes. The alarm levels are obtained empirically, according to maintenance specialist expertise. For means of complementation, the analysis can also be comparative. When there are data of the machine in a healthy condition (baseline), the analysis is comparative with the baseline condition. However, when the baseline is not available, and there are equal machines (of the same model and nameplate data) being monitored, the analysis can be comparative between the machines. In both cases, the selected data for analysis must be in the same operation range, considering the machine voltage and load level.
The SAS presents features so that the user can access screens with the fault pattern’s trend curves and spectrum of a selected electrical signal in order to perform an in-depth analysis. The SAS also provides a report containing the general condition of the SG, including a traffic light (red, yellow or green) indicating the condition regarding the monitored faults. This is automatically updated when the database receives a new signal acquisition, including the summary of the report, which can be accessed on the main screen of the SAS.
It is important to reinforce that the fault types are detected and identified considering the fault patterns and recommendations presented in the
Section 3 and
Section 4, and these fault patterns are comprehensive and include faults normally able to be detected in a predictive maintenance system. The approach of other faults in these systems can be proposed for future works. Finally, with the support of the described system, the decision to stop a machine or not due to indications from the electrical signature will be performed by the maintenance staff and requires some experience and knowledge of the process and the machine’s behavior history [
7].
6. Results of Fault Detection in In-Service SGs in Bulk Electric Systems by Using ESA
This section presents results of fault detection in in-service SGs in a bulk electric system by using ESA.
The developed methodology of SG CBM based on ESA has been applied to in-service generating units (GUs) of a Brazilian hydroelectric power plant called Goiandira. This power plant is located at Brazilian state of Goias and has two GUs (GU#1 and GU#2) with the following ratings: power = 15 MW, stator voltage = 13,800 V, stator current = 627.6 A, frequency = 60 Hz, 26 poles (salient-pole rotor), excitation voltage = 190 V, excitation current = 480 A, rotor rotation speed = 276.9 rpm.
Two types of faults were detected in this power plant by using the proposed ESA based methodology, as described as follows.
6.1. Early Stage of Stator Phase-to-Phase Short Circuit
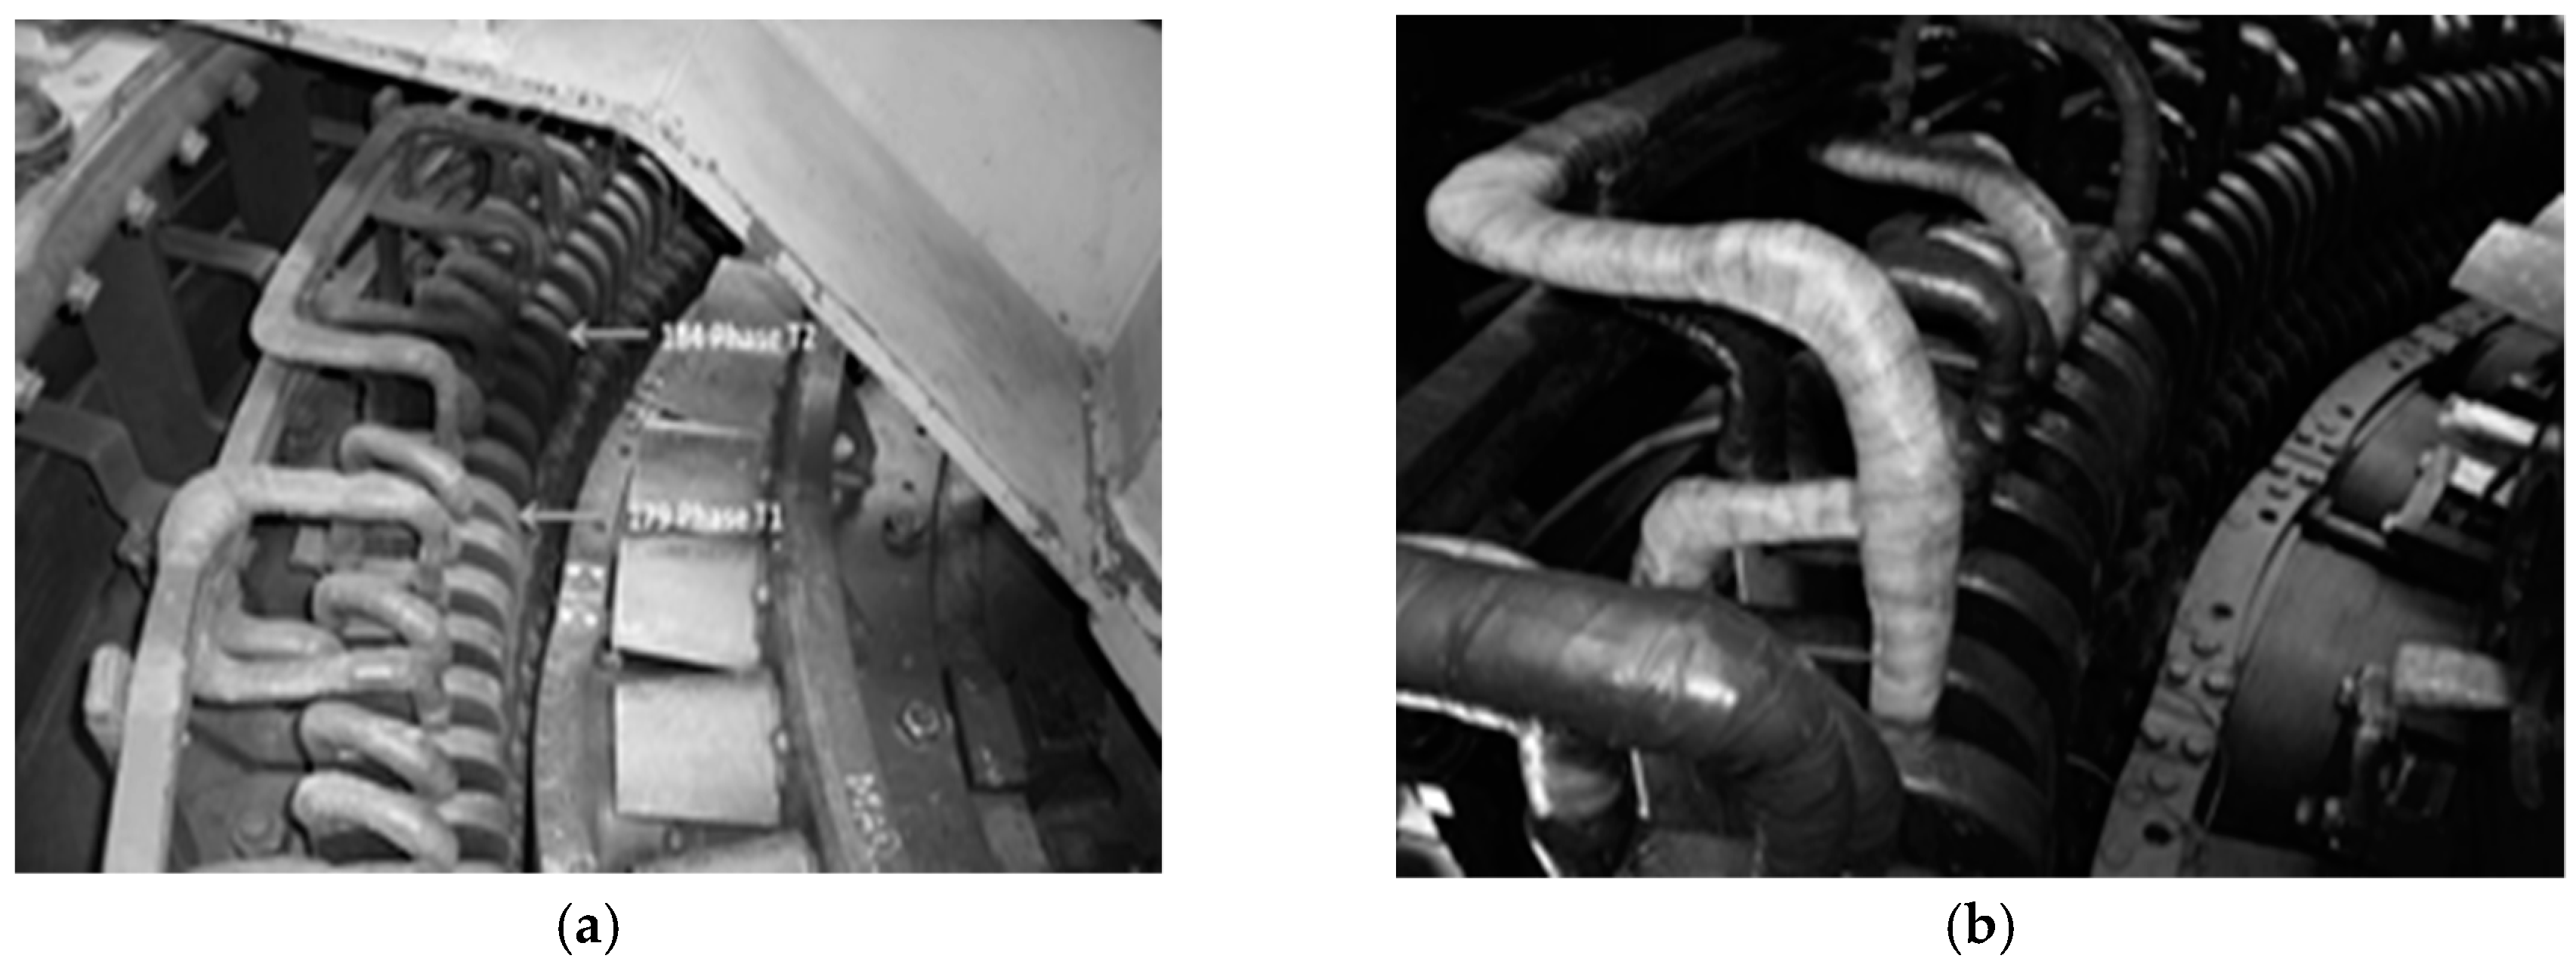
Firstly, the power plant personnel had reported that GU#1 presented a covered winding coil. This is because a short circuit had occurred between turns 179 of phase 1 and 184 of phase 2 (the level of severity had not been informed) and the solution adopted to mitigate the problem was the isolation of the stator coils, which caused stator electrical unbalance.
Figure 4 presents the part of the GU#1 stator winding where the fault happened. Thus, the electrical signatures were analyzed to search for fault indicators for this type of fault. The fault pattern of EPVA electrical unbalance, as described in (12), has been analyzed.
Here it is important to point out that as a data history of GU#1 and GU#2 before the fault was not available, the analysis was accomplished as a comparison between the two GUs, considering the database stored from the installation time until the analysis moment. As explained in the last section, the data used in this analysis must be in the same operation range, considering the load condition. The data of the GUs were selected in a range between 89.2% and 92.4% of the rated load, considering the current as reference, and the levels of voltage were similar between the GUs. As the GUs were in a similar level of operation, considering the load condition, the selected data were appropriate for an ESA comparative analysis.
Considering the current and voltage signals in the database and the EPVA computed for them by the SAS,
Figure 5 presents the trend curves of the EPVA electrical unbalance in voltage and current signatures of the GUs at Goiandira. For this analysis, the daily average of data has been considered, and this has also been performed for all the trend curves presented in this section. It can be noticed that, for both GUs, the voltage unbalance was about 0.4%. The current unbalance was between 0.5% and 1.5% for GU#2 and between 2.5% and 3.0% for GU#1. Thus, GU#1 presented a larger electrical unbalance at the EPVA current signature than GU#2. Thus, the fault indicator of the covered coil was detected in the EPVA electrical unbalance fault pattern.
In order to verify if the data sets of EPVA electrical unbalance of current signature of the GUs were statistically different and reinforce the ESA diagnosis effectiveness, a two-sample t-test has been performed [
43] using Minitab software. The data used for the hypothesis testing were the percentage values of electrical unbalance of current signals in the period of analysis.
Table 1 presents the results from the two-sample t-test for the fault pattern in analysis.
From
Table 1, it can be concluded that the data set of the EPVA electrical unbalance at current signature of GU#1 is statistically different from the corresponding data set of GU#2, because
p-value < 0.05. The estimated difference is that the mean of the component magnitudes of GU#1 is 1.1842% above the mean of the component magnitudes of GU#2. This result evidences the fault indicator of covered coil.
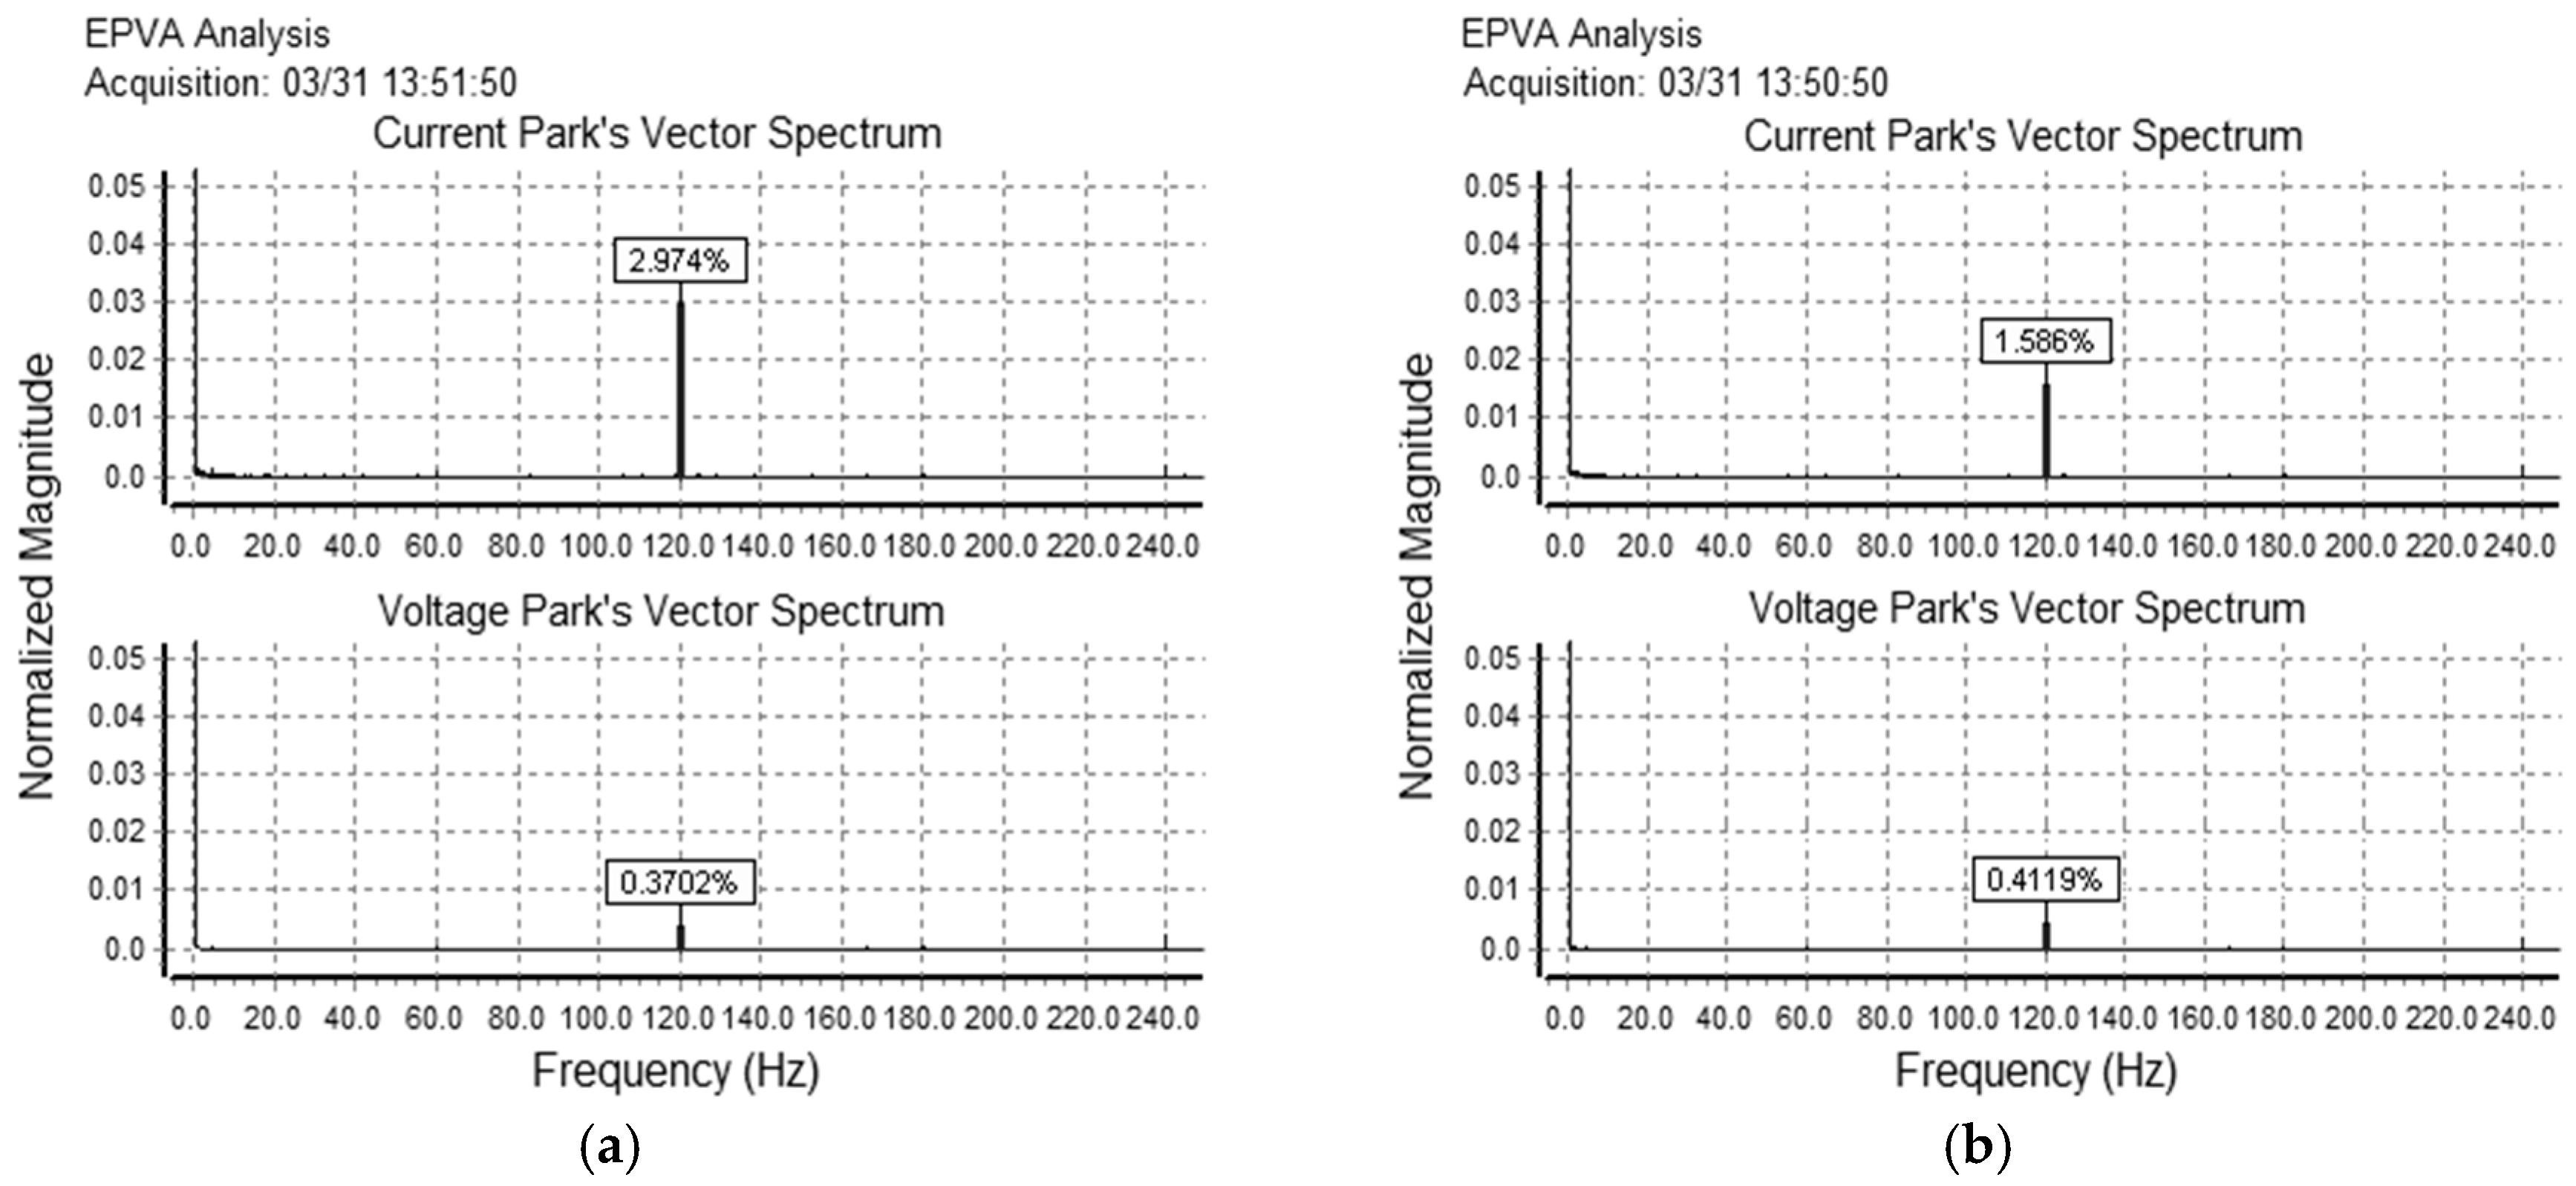
Figure 6 presents, for illustration purposes, examples of the EPVA electrical unbalance of current and voltage signatures of GUs #1 and #2 of Goiandira power plant. This was performed by choosing an arbitrary signal acquisition for each GU and considering the FFT computed by the SAS. The components are normalized in relation to the fundamental frequency magnitude. By comparing the spectra of
Figure 6a,b, one can notice a significant difference between the component magnitudes of GUs #1 and #2, mainly in the EPVA current signature, which evidences the fault indicator of covered coil.
6.2. Mechanical Misalignment
During the performed analysis, the rotation frequency fault pattern, as presented in (9), was also noteworthy. This fault pattern is indicative of rotor mechanical problems. For the purpose of analysis, the same current and voltage data selected in the last section have been considered in the present section.
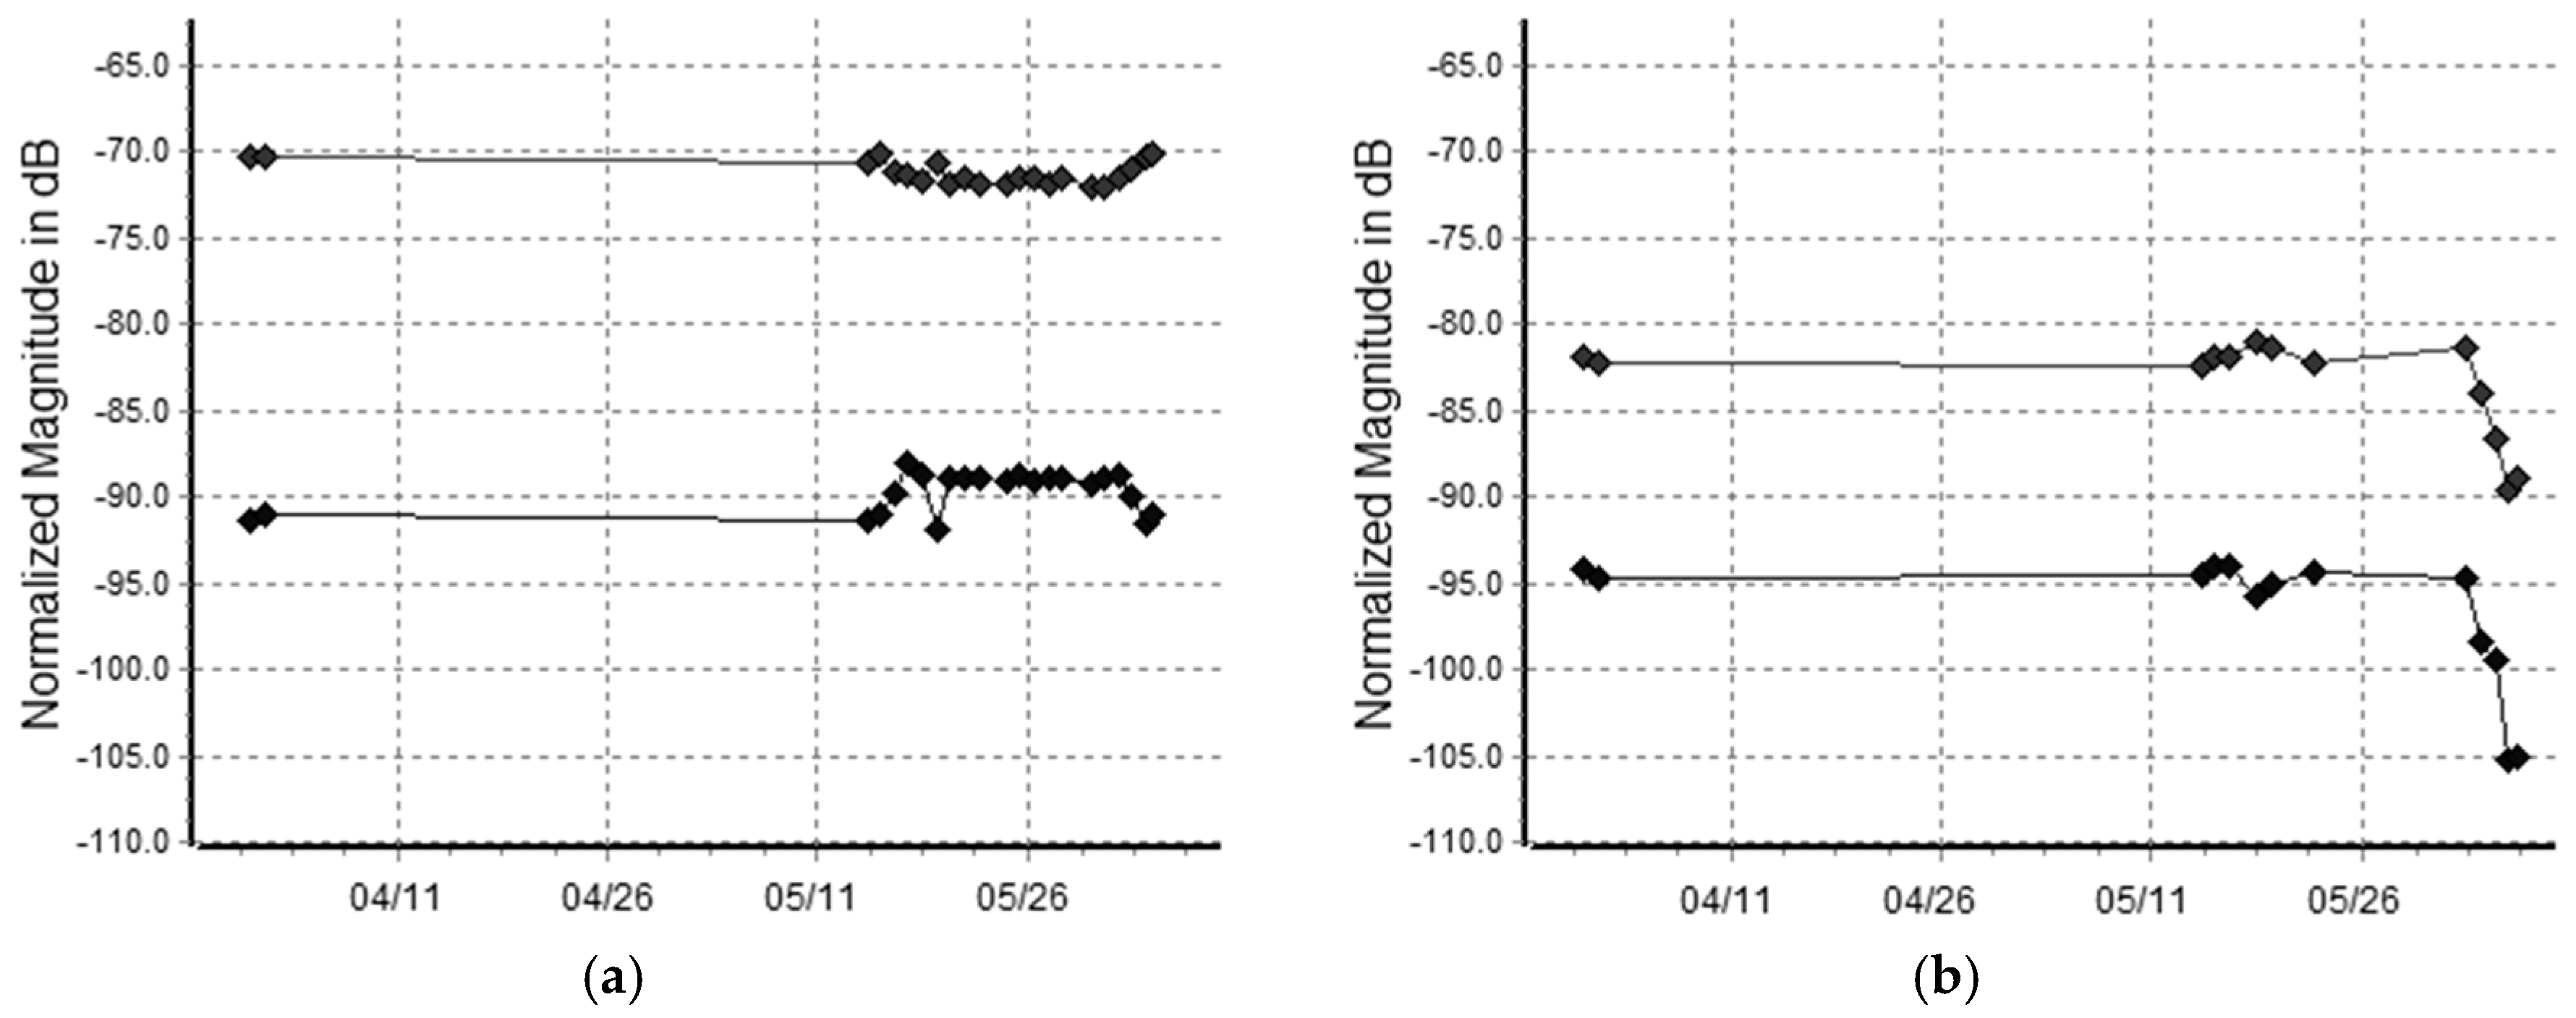
Considering the current and voltage signals in the database and the signatures computed by the SAS,
Figure 7 presents the trend curves of the rotation frequency of the voltage and current signatures of GUs at Goiandira power plant, considering the average level of the components. It can be noticed that the component’s magnitudes were about -90 dB for GU#1 and -95 dB for GU#2, for voltage signals. The component’s magnitudes were about -70 dB for GU#1 and -82 dB for GU#2, for current signals.
There is a significant difference between the rotation frequency component’s magnitudes of GU#1 and GU#2, mainly in current signature, and GU#1 presents higher magnitudes in relation to GU#2. This fault pattern is indicative of rotor winding inter-turn short circuit or rotor mechanical problems. After the analysis, the power plant personnel reported that GU#1 presented “dogleg” condition, which is an angular mechanical misalignment between the turbine shaft and the generator rotor shaft. Thus, the hypothesis raised by the analysis has been confirmed.
In order to verify if the data sets of rotation frequency of current signature of GUs were statistically different and reinforce the ESA diagnosis effectiveness, a two-sample t-test has been performed [
43] using Minitab software. The data used for the hypothesis testing were the rotation frequency component’s magnitudes in dB of current signals in the period of analysis.
Table 2 presents the results for the two-sample t-test for the fault pattern in question.
It can be concluded that the data set of the rotation frequency component’s magnitudes of GU#1 is statistically different from the corresponding data set of GU#2, because p-value < 0.05. The estimated difference is that the GU#1 component magnitudes mean is 12.165 dB above the mean of the component magnitudes of GU#2. This result provided evidence for the fault indicator of rotor mechanical misalignment.
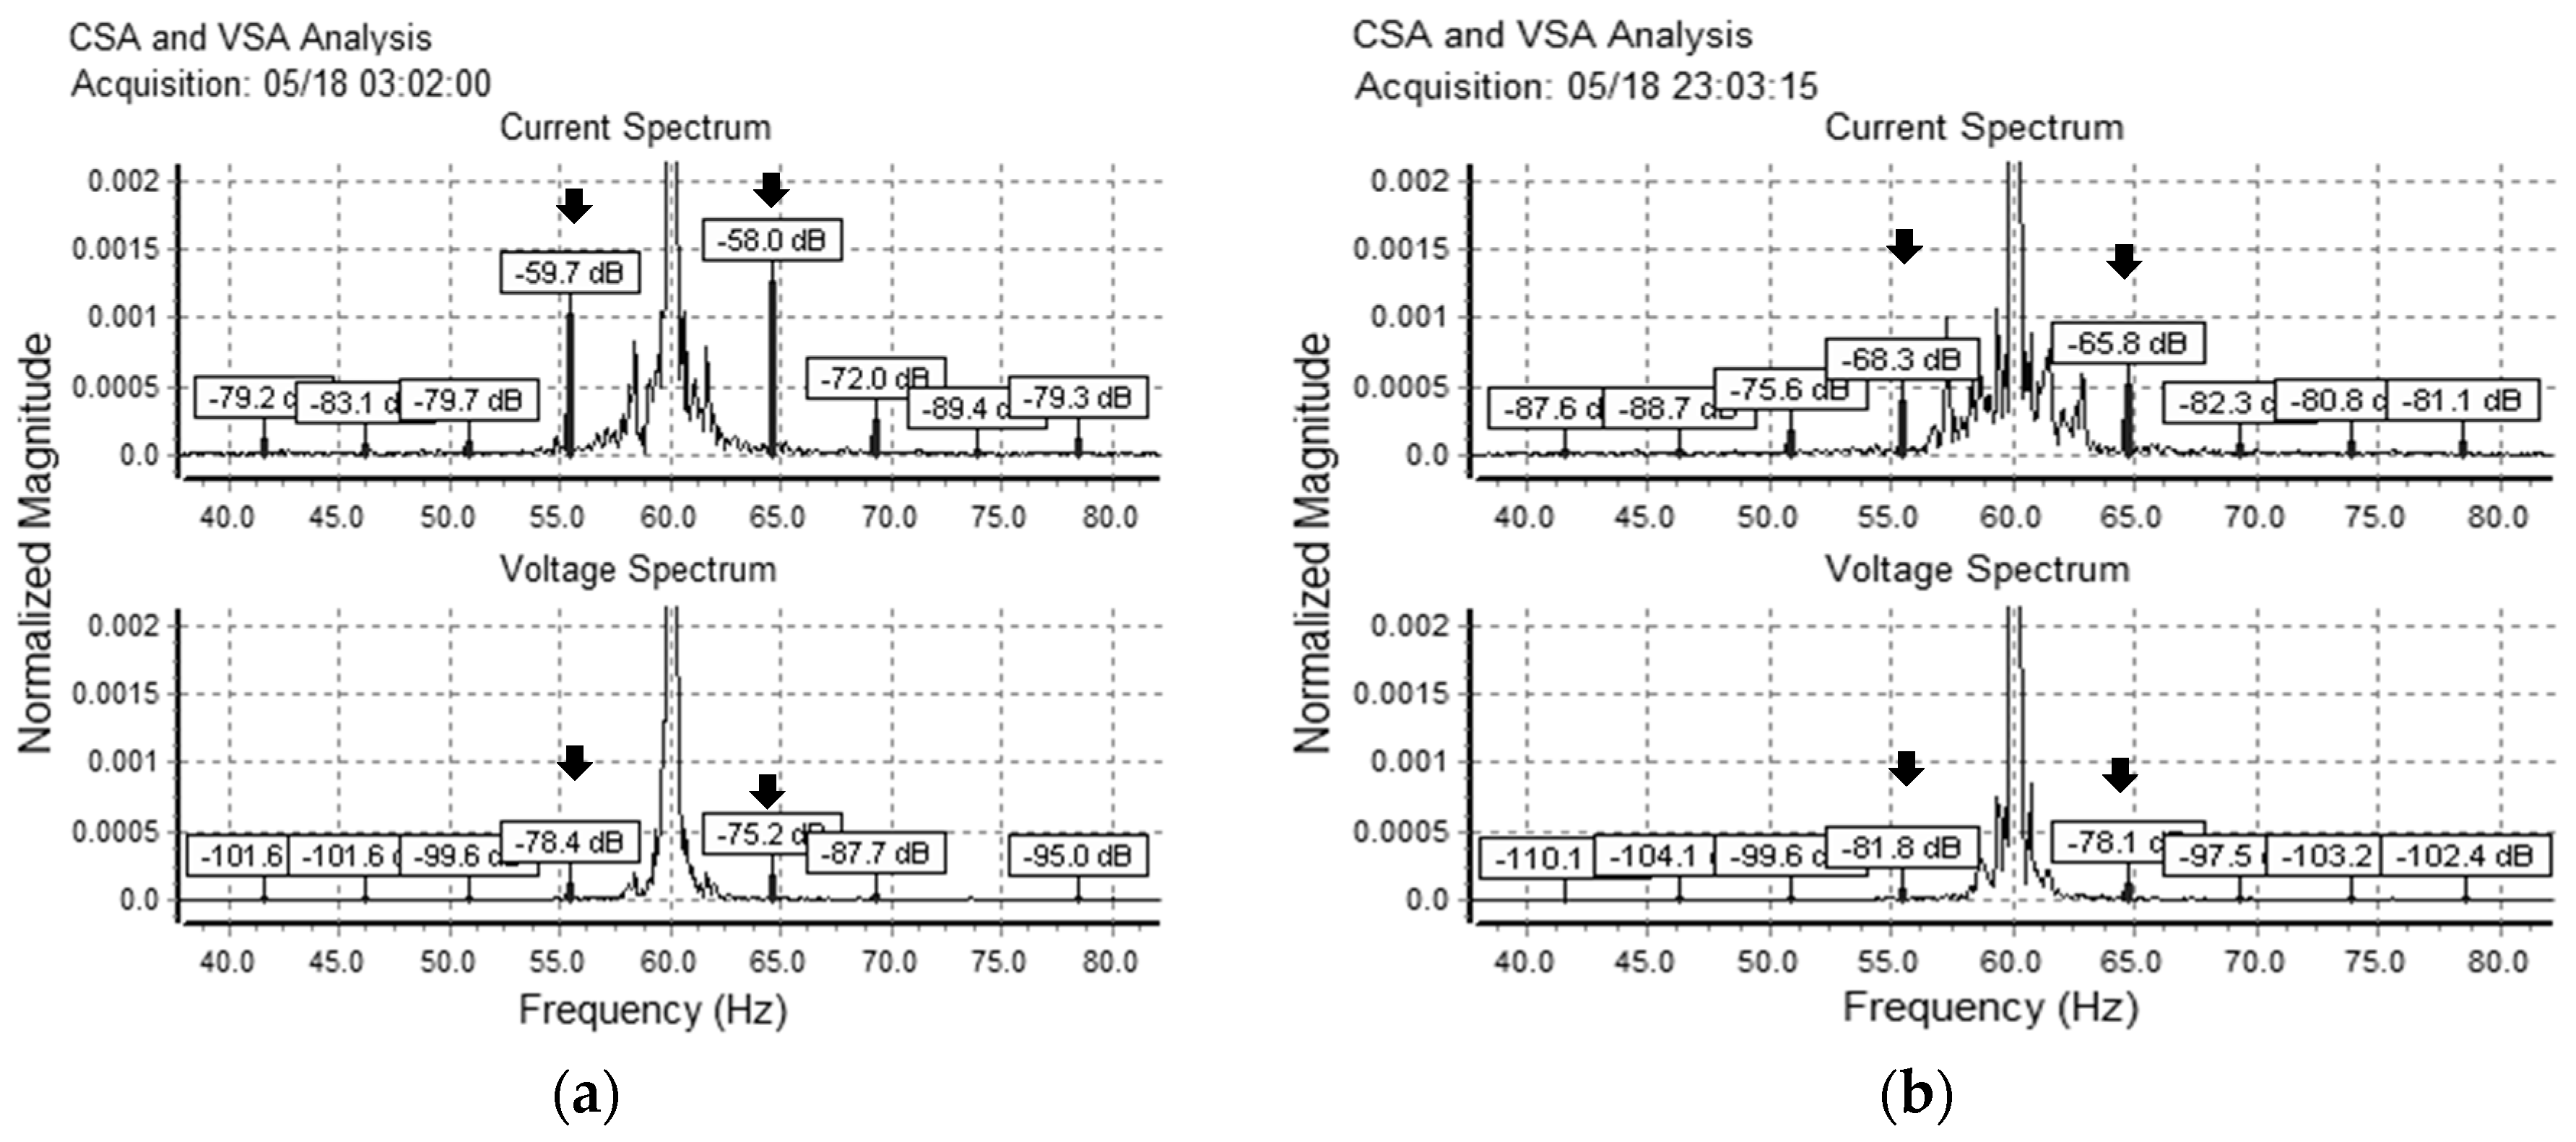
Figure 8 presents, for illustration purposes, examples of rotation frequency components of the current and voltage signatures of GU#1 and GU#2 at Goiandira power plant. These were signal acquisitions chosen arbitrarily to show the signatures computed by the SAS. There is a significant difference between the components of GU#1 and GU#2, mainly in current signature, and the component’s magnitudes of GU#1 are higher than GU#2. This is evidence of the fault indicator of rotor mechanical misalignment.
6.3. Final Remarks
It is important to reinforce that the proposed system can detect electrical and mechanical faults, including those presented in
Section 3. The current section has focused only on two types of faults (stator electrical unbalance and mechanical misalignment) because these were the faults detected in practice in the in-service SG in the monitored hydroelectric power plant. When working in a laboratory environment, it is possible to simulate different types of faults in a machine and get results covering all of them [
3]. However, when considering a power plant application, the studied types of faults will not always occur during the selected period of monitoring and analysis. Finally, the results obtained in a power plant are very valuable, because this environment is concerned with monitoring and is subjected to diverse conditions of bulk power system.
7. Conclusions
This paper has presented a study on ESA for condition monitoring of SGs in bulk electric systems. The paper has presented a methodology for SG predictive maintenance by using ESA and has also addressed peculiarities in the application of this technique to fault detection in wound rotor SGs. The main contribution of this work is the practical results of ESA for fault detection in an in-service SG connected to a power system.
The detected faults were an early stage of stator phase-to-phase short circuit, detected in the EPVA electrical unbalance pattern, and mechanical misalignment, detected in the rotation frequency pattern. The results show the potential of applying ESA to fault detection in SGs interconnected to a power system. Moreover, it has been shown that in this case, the emphasis of ESA must be on CSA. This is because the faults were more evident through the analysis of fault patterns in current signatures than in voltage signatures.
It may be proposed for future works to improve the automatisms and diagnostics of the system by using artificial intelligence techniques and expand the possible monitored conditions beyond fault detection and identification.

 ,
, 


