Analysis and Optimization of Exergy Flows inside a Transcritical CO2 Ejector for Refrigeration, Air Conditioning and Heat Pump Cycles


Department of Mechanical Engineering, Université de Sherbrooke, Sherbrooke, QC J1K2R1, Canada
*
Author to whom correspondence should be addressed.
Energies 2019, 12(9), 1686; https://doi.org/10.3390/en12091686
Submission received: 13 March 2019
/
Revised: 1 May 2019
/
Accepted: 2 May 2019
/
Published: 4 May 2019
(This article belongs to the Special Issue Refrigeration Systems and Applications 2019)
Abstract
:In this study, the exergy analysis of a CO2 (R744) two-phase ejector was performed using a 1D model for both single and double choking conditions. The impact of the back pressure on the exergy destruction and exergy efficiencies was presented to evaluate the exergy performance under different working conditions. The results of two exergy performance criteria (transiting exergy efficiency and Grassmann exergy efficiency) were compared for three modes of an ejector functioning: Double choking, single choking and at the critical point. The behavior of three thermodynamic metrics: Exergy produced, exergy consumed and exergy destruction were evaluated. An important result concerning the ejector’s design was the presence of a maximum value of transiting exergy efficiency around the critical point. The impact of the gas cooler and evaporator pressure variations on the different types of exergy, the irreversibilities and the ejector global performance were investigated for a transcritical CO2 ejector system. It was also shown that the transiting exergy flow had an important effect on the exergy analysis of the system and the Grassmann exergy efficiency was not an appropriate criterion to evaluate a transcritical CO2 ejector performance.
1. Introduction
Carbon dioxide (R744) is an appropriate substitution for synthetic refrigerants in refrigeration, air conditioning and heat pump systems due to its specific features. It is a natural refrigerant that is secure, available and inexpensive. It is non- flammable and non-toxic. It has low global warming potential (GWP) and no impact on the ozone layer. Therefore CO2 is a promising long-term refrigerant for several heating and cooling applications [1,2,3,4].
Furthermore, CO2 can operate in a transcritical cycle due to its low critical temperature. However, compared to a subcritical cycle, the transcritical CO2 cycle has lower thermodynamic performance owing to the large exergy destruction of an isenthalpic throttling process from a supercritical to a subcritical state [5]. Among different expansion work recovery devices, the ejector is proposed as a desirable device that enables the use of CO2 at high heat sink temperatures [6]. An ejector expansion device can replace the throttling valve to decrease the irreversibilities by recovering some part of the expansion work and enhance the cycle’s performance. It also increases the suction pressure of the compressor that results in reducing the compressor work. Gay [7] was the first to demonstrate the performance improvement of a transcritical CO2 cycle by a two-phase ejector.
The one-dimensional and homogeneous two-phase ejector model was first developed by Kornhauser [8] for an R12 refrigerant in the ejector expansion recovery cycle (EERC). The performance enhancement of CO2 ejector cycles compared to the basic expansion valve cycle have been extensively investigated [9,10,11,12,13,14]. Zhu et al. [9] experimentally investigated the performance of a transcritical CO2 ejector heat pump water heater system and reported a 10.3% coefficient of performance (COP) improvement over the corresponding basic cycle. Lucas and Koehler [10] obtained a COP improvement of 17% with maximum ejector efficiencies of 0.22 compared to the maximum COP of the conventional expansion valve cycle. Banasiak et al. [12] carried out an experimental and numerical investigation on a CO2 heat pump using an optimum ejector geometry and reported the maximum COP increase of 8% in their work compared to a conventional cycle. Boccardi et al. [13] experimentally evaluated the performance of a multi-ejector CO2 heat pump. An optimal multi-ejector configuration was obtained to maximize the COP. The improvement of COP and heating capacity was reported to be 13.8% and 20%, respectively, for the optimal case at investigated conditions. Elbel [14] observed COP and cooling capacity improvements by up to 7% and 8%, respectively, by adapting an ejector in a conventional cycle.
Although there are numerous literature reviews that present an ejector for CO2 expansion work recovery, most of the existing works are limited to investigate overall system performance and energy efficiency improvement. However, the evaluation of the second law of thermodynamics is useful to determine the amount and locations of the irreversibilities.
A thermodynamic comparison of the transcritical CO2 ejector cycle with expansion valve and turbine cycles has been presented by Sarkar [15]. He obtained a 9% exergy efficiency improvement by using an ejector over the usual valve for given operating conditions. Fangtian and Yitai [16] performed the evaluation of COP and exergy destruction for a transcritical CO2 ejector refrigeration system. An improvement of 30% in COP and a reduction of 25% in exergy destruction were obtained in their analysis compared to the conventional system. Deng et al. [17] reported that the ejector could decrease the total exergy destruction by 23% in a CO2 transcritical cycle compared to the basic cycle. Zhang and Tian [18] obtained a 45% increase in COP and 43% decrease in the ejector exergy destruction of a transcritical CO2 ejector refrigeration cycle compared to the basic cycle by an optimized suction nozzle pressure drop (SNPD). A comparative study of different transcritical CO2 ejector refrigeration cycles was performed under the same cooling capacity by Taslimi et al. [19]. The results showed that EERC has the highest COP and exergy efficiency compared to other cycles. It improves the COP and exergy efficiency by up to 23% and 24%, respectively, compared to the basic throttling cycle. The exergy analysis also implied that the major exergy destruction in EERC occurred in the evaporator (about 33% of the total exergy destruction of the cycle) followed by the compressor (25.5%) and the ejector (24.4%). The second law performance of EERC was investigated theoretically for a two-phase constant area ejector using CO2 by Ersoy and Bilir Sag [20]. The results indicated that the irreversibility of the ejector system can decrease by 39.1% compared to the basic system at given operating conditions. Gullo et al. [21] implemented an advanced exergy analysis to evaluate the thermodynamic performance of a conventional transcritical R744 booster supermarket refrigerating system at the outdoor temperature of 40 °C and proposed a multi-ejector CO2 system to improve the system performance. It was concluded that the total exergy destruction can be reduced by about 39% in comparison with the conventional booster system. Bai et al. [22] conducted an advanced exergy analysis to investigate the exergy performance of an ejector expansion transcritical CO2 refrigeration system. It was found that 43.44% of the total exergy destruction could be avoided by improving the system components. They also showed that the compressor had the largest exergy destruction followed by the ejector, evaporator and gas cooler.
An exergy analysis has been performed for a CO2 air-to-water heat pump using the multi ejector systems by Boccardi et al. [23]. They confirmed that the throttling irreversibilities can be reduced to 46% by adopting the ejector system. The maximum exergy efficiency improvement by 9% was also reported compared to the basic cycle.
Since the ejector is an important component affecting the thermodynamic performance of the refrigeration, air conditioning and heat pump cycle, the objective of this study is the exergy analysis of a two-phase ejector based on the transiting exergy evaluation. Following the concept of the transiting exergy first introduced by Brodyansky et al. [24], Sorin and Khenich [25] evaluated transiting flows for expansion and compression processes operating above, below and across the ambient temperature. Khennich et al. [26] evaluated the overall transit exergy efficiency as well as the efficiencies within different sections of a single phase ejector for R141b refrigerant.
To the authors’ best knowledge, no investigation has been reported yet on the use of the transiting exergy analysis in a CO2 two-phase ejector with the objective to obtain the effects of different operating conditions on the ejector irreversibilities. Figure 1 shows the performance curve of an ejector. The ejectors may work under double choking or single choking other than the critical point based on the operating conditions. The back pressure that gives the maximum entrainment ratio refers to the critical point. Under double choking conditions, both the primary and the secondary flows are choked and the entrainment ratio is constant while the back pressure decreases. Under single choking conditions, the secondary flow is not choked and the entrainment ratio decreases with increasing the back pressure [27]. In the present paper, first, the exergetic analysis of a CO2 two-phase ejector is carried out for the critical point as well as for single and double choking conditions and the effect of the back pressure on the amount of the exergy destruction and the values of two types of performance criteria, namely the transiting exergy efficiency and the Grassmann exergy efficiency, is investigated. This analysis helps to understand under which working conditions the ejector performs the best. Second, the effects of the operating conditions (gas cooler and evaporator pressure) are investigated on the exergy efficiency as well as exergy destruction of a two-phase ejector by comparing the transiting and conventional exergy definitions.
2. Theoretical Analysis
A two-phase ejector was used in a transcritical CO2 cycle to reduce the throttling irreversibilities and improve the cycle efficiency. Figure 2 shows the transcritical CO2 ejector cycle and its corresponding temperature-specific entropy diagram.
The schematic of an ejector is also shown in Figure 3. A typical ejector comprises a primary nozzle, a secondary nozzle, a mixing section and a diffuser. As shown in Figure 2, the stream at the subcritical state (point 1) is compressed to a supercritical state at high pressure and temperature (point 2). It then releases heat in the gas cooler. The high pressure steam (primary flow) at the gas cooler exit (point 3) expands in the primary nozzle of the ejector into a low pressure and high velocity (point 4). This low pressure entrains the secondary stream into the mixing chamber (point 5). Then two streams mix together (point 6) and the mixture is compressed through the diffuser (point 7) before entering the separator where the two-phase flow is divided to vapor and liquid portions. The vapor portion returns to the compressor while the liquid portion enters the evaporator after expanding through the throttling valve. The secondary stream absorbs heat in the evaporator before entering the ejector.
2.1. Thermodynamic Model
The detailed numerical model of a CO2 two-phase ejector model for both single choking and double chocking conditions can be found in the authors’ previous work [28]. The most important assumptions employed in the model are:
- Flow is one dimensional, steady state and adiabatic in the ejector;
- For two-phase flow, the homogeneous equilibrium model (HEM) is used;
- The thermodynamic and transport properties of CO2 is based on the real fluid properties;
- The stagnation conditions are assumed at inlets of the primary and secondary flows;
- The friction losses in the nozzles and the diffuser are taken in to account by constant polytropic efficiencies [29] (ηpol,p = 0.9, ηpol,s = 0.9, ηpol,d = 0.8);
- The friction losses in the mixing chamber are neglected, however, a wall friction coefficient is employed to calculate the pressure losses of the constant area part;
- Mass flux maximization criterion is used for choking at the nozzle throats instead of calculating the Mach number due to uncertainty and problematic sound velocity calculations in a two-phase flow;
- Both primary and secondary flows are choked in double choking condition;
- The secondary flow is not choked in single choking condition.
A new methodology was employed here to evaluate the exergy efficiency of a two-phase ejector based on the calculation of the transiting exergy through the ejector under different conditions. The ambient temperature was fixed to 20 °C for exergy calculation. A fixed geometry ejector was used to evaluate its exergy performance under different working conditions. The designed dimensions of the ejector were considered for the given operating conditions (Dth = 0.992 mm, Dmix = 2.11 mm, L5/Dmix = 7.344, Ad/Amix = 0.116) [28].
2.2. Transiting Thermo-Mechanical Exergy in a Two-Phase Ejector
An exergy efficiency definition was used for performance evaluation of a two-phase ejector based on the approach of transiting exergy, presented by Brodyansky et al. [24] that allows non-ambiguous evaluation of two thermodynamic important metrics: Exergy produced and exergy consumed.
where ∇ and Δ are exergy consumed and produced in the process, and are exergy flow rate at the inlet and outlet. It should be mentioned that different terminologies to represent the “exergy produced” and “exergy consumed” in the process are used by some authors. For example, Szargut et al. [31] used “exergy of useful products” vs. “feeding exergy”, Kotas [32] used “desired output” vs. “necessary input”; Tsatsaronis [33] and Bejan and Tsatsaronis [34] used “products” vs. “feed”.
The difference between the inlet and outlet exergies as well as between the exergy produced and the exergy consumed indicates the exergy destruction (D).
The input-output exergy efficiency, which was first proposed by Grassmann [35], is defined as follows:
The specific exergy in state k is calculated as:
The specific transiting exergy (etr) is the lowest exergy value of a material stream, which is defined by the pressure and temperature at the inlet and outlet of a system as well as by the ambient temperature T0 (in Kelvin). It is illustrated by the following equations:
These equations demonstrate that tr is obtained based on the minimum values of the pressure and velocity among the inlet and outlet but it varies for temperature depending on the processes operating in sub-ambient, above ambient or across the ambient temperature.
Let us illustrate the physical meaning of transiting exergy flow on the example of secondary gas flow through a section of an ejector. The Grassmann exergy diagram is presented in Figure 4. Gas enters the section under sub environmental conditions (Tin < T0), but leaves it with a temperature higher than environmental (Tout > T0); the pressure of the gas is reduced (Pout < Pin), but the velocity rises (uout > uin). The exergy values at the inlet and outlet of the section are defined by using the “dead” environmental state as a reference point characterized by the values (P0, T0, u0 = 0). According to Equation (7), the transiting exergy is defined by the values (Pout, T0, uin). Thus as illustrated by Figure 4 the transiting exergy is no more than a new reference point to evaluate the exergy consumed () and exergy produced (). Moreover, the subtraction of tr from the inlet and outlet exergy leads automatically and non-ambiguously to the definition of two terms of exergy consumption and two terms of exergy production. The exergy consumption () is the decrease in thermo-mechanical exergy due to the pressure drop from Pin to Pout and the temperature rise from (sub environmental level) to T0 at the condition of constant uin. The exergy production () is the increase in thermo-mechanical exergy due to the velocity rise from uin to uout and the temperature rise from T0 to Tout under the condition of constant pressure Pout. The numerical evaluation of exergy consumed and produced for two ejector flows is presented in the following section.
2.3. The Exergy Production and Consumption in a Two-Phase Ejector
In a two-phase ejector, the primary stream with high pressure (Pp0) and temperature (Tp0 > T0) expands through the primary nozzle and reaches a low pressure and high-velocity. This supersonic stream entrains the secondary stream at low pressure (Ps0) and temperature (Tp0 < T0) into the mixing section. Inside the mixing section, the two streams exchange momentums and energies and then the mixture compresses to a pressure higher than the secondary inlet pressure (Ps0 < Pd < Pp0) and (Ts0 < Td < T0 < Tp0). The ejector’s performance is defined by two parameters: The entrainment ratio (), which is the ability to entrain the secondary flow inside the ejector and the pressure ratio (), the ability to increase the secondary pressure. Figure 5 presents the specific exergy-enthalpy diagram for a two-phase ejector.
The e-h diagram shows the expansion of the primary flow and compression of the secondary flow in the ejector. The primary stream is expanded across T0 and the secondary stream is compressed at the sub-ambient condition. Equations (8) and (9) were therefore applied to calculate and .
The total exergies consumed and produced by the primary and secondary streams were evaluated by the following equations:
The exergy consumption and production are linked to both primary and secondary flows. The first term in Equation (10), is the decrease of the specific thermo-mechanical exergy due to the expansion process and the temperature drop of the primary flow. The second term, is the decrease of the specific thermal exergy of the secondary flow due to the temperature rise under sub-ambient conditions at constant pressure Ps0.
The first term of exergy produced, represents the increase of the specific thermal exergy due to the temperature drop of primary flow from T0 to Td under constant pressure Pd. The second term represents the increase in the mechanical exergy component of the secondary flow due to the pressure rise from Ps0 to Pd at constant temperature Td.
The main shortcoming of the Grassmann efficiency is the fact that it cannot reveal the real exergy consumption and production within the process. As an example, represents the exergy consumed due to the temperature rise in the sub-ambient area from Ts0 to Td. In fact, this is the partial cold destruction. It means that the cold produced in the evaporator of a refrigeration cycle is destroyed in the ejector. Due to an important transiting exergy flow, the Grassmann exergy efficiency “does not see” this phenomenon. Meanwhile, the transiting exergy definition allows discovering non-ambiguous calculation of exergy consumed and produced and prompts to find the way to recover the amount of the cold destroyed in the ejector.
3. Results and Discussion
The numerical model for the exergy evaluation of a CO2 two-phase ejector was presented using the Engineering Equation Solver (EES) software, which is used for the solution of non-linear equations with thermodynamic property functions. This exergy analysis helps to determine the irreversibilities and exergy efficiencies in a two-phase ejector especially when it does not work at its design condition.
3.1. Exergy Analysis of a Fixed Geometry CO2 Two-Phase Ejector
The calculated parameters for a CO2 two-phase ejector operating under single choking and double choking conditions, as well as its design condition, are listed in Table 1 [28].
The inlet pressures and temperatures of the primary and secondary flows remained constant for all cases (Pp0 = 10112 kPa, Tp0 = 39.3 °C, Ps0 = 3952 kPa, Ts0 = 5.5 °C) while the back pressure (diffuser outlet pressure) changed according to the ejector critical conditions.
The first row of Table 1 refers to the critical point of the ejector for a fixed geometry (base case). The second row refers to double choking conditions in which the back pressure is lower than the critical point while the inlet conditions are the same as their design values. The third row presents the single choking conditions in which ER reduces from its critical point (Pcrit) to maximum limited pressure (Plim; Figure 1).
The values of the numerical calculation for double chocking and single chocking conditions are shown in Table 2 and Table 3, respectively. The exergy destruction (D), Grassmann exergy efficiency (ηex,GR) and transiting exergy efficiency (ηex,tr) were calculated using equations (1–3). The first rows refer to the results for the base case (critical or design point).
The corresponding exergy produced and exergy consumed of a two-phase ejector were evaluated as well. The exergy analysis based on both transit and Grassmann definitions were also compared and the effect of the ejector’s back pressure on the exergy of a two-phase ejector was investigated.
Figure 6 also illustrates the variations of the exergy efficiencies and exergy destruction within the ejector for various back pressures including the critical point, single and double choking conditions.
According to Table 2 and Figure 6, when the back pressure decreased below the critical pressure, the exergy destruction of the ejector increased. The Grassmann exergy efficiency remained approximately constant. The value of ηex,GR remained in the range 0.9698–0.9749 (0.5%). While the transiting exergy efficiency (ηex,tr) decreased by about 5.2%, ηex,tr remained within the range 0.564–0.595. The minimum exergy destruction (0.34 kW) took place at the critical back pressure (4601 kPa).
The comparison of the Grassmann and transiting exergy efficiencies showed that ηex,tr calculated by Equation (1) was lower than the “optimistic” value given by the Grassmann exergy efficiency. This discrepancy was justified by the presence of transiting exergy flow (etr), which was neglected when using the Grassmann exergy efficiency. This important result indicates the influence of transiting exergy flow (etr) inside a two-phase ejector.
Another important result derived from the transiting exergy calculation revealed that the exergy produced (Equation (11)) increased by decreasing the back pressure while according to the Grassmann exergy definition, the outlet exergy of the ejector stayed almost constant. However, the increase in exergy production (Δ) was surpassed by the increase in exergy consumption (∇). As a result ηex,tr decreased.
Table 3 illustrates the variations of exergy destruction, ηex,tr and ηex,GR for various back pressures in single choking conditions. It may be observed that the transiting exergy efficiency increased slowly from 0.595 to 0.609 (about 2%) with increasing the back pressure from 4601 kPa (critical point) to 4730 kPa and then decreased to about 73% when the back pressures increased to 5313 kPa. The same justification as the previous part holds. Since both exergy consumed and exergy produced decreased by increasing the back pressure, the decrease in exergy consumption (∇) was surpassed by the decrease in exergy production (Δ), which resulted in reducing the exergy efficiency (ηex,tr).
The results also showed a minimum value for the exergy destruction. The exergy destruction decreased from its design value, 0.34 kW to 0.28 kW (17%) and then increased to the value of 0.36 kW (higher than that of the critical point) when the back pressure increased to a pressure close to its limited pressure (Plim) 5313 kPa. The comparison of the exergy destruction, (ηex,tr) and (ηex,GR) for three different cases (single choking, critical point and double choking) are presented in Figure 7. Two important observations can be made from these results. First is that the minimum value of ηexTR and maximum exergy destruction occurred at single choking mode at maximum pressure (Plim). The maximum value of ηex,tr was obtained at the ejector critical point although the exergy destruction was higher at this point compared to some cases of single choking mode.
It is important because the design of the ejectors are usually conducted according to the critical point conditions, which leads to a maximum in transiting exergy efficiency, not a minimum of exergy destruction. This is due to the fact that maximum value ηex,tr establishes an optimal trade-off between the realization of the ejector’s technical purpose (to achieve maximum compression for a given entrainment ratio) and exergy destruction. The second observation is that the Grassmann exergy efficiency did not change with the critical pressure variation, because of important transiting exergy flow. It means that ηex,GR was not the appropriate criterion to determine the exergy efficiency of a two-phase ejector.
3.2. The Comparison of Transiting and Conventional Exergy Evaluation in a Transcritical CO2 Ejector Cycle
In order to evaluate the effect of transiting exergy to analyze the exergy performance of a two-phase ejector in a cycle, the effects of different operating conditions in a transcritical CO2 heat pump cycle were investigated.
An ejector heat pump system simulation model developed in the authors’ previous work was used for exergy evaluation in this section [30].
As shown in Figure 6 and Figure 7, the ejector had the best performance at its critical conditions. Therefore it is very important that ejector works at its critical conditions. In this section, a transcritical CO2 cycle using a designed model of the ejector with adjustable throats was used to keep the ejector at its critical conditions (double choking). In this analysis, the simulation results were evaluated for different gas cooler and evaporator pressures. Inlet mass flow rates and temperatures of the external fluid for the gas cooler and evaporator were constant. The gas cooler pressure was in the range of 9000–11,500 kPa and the evaporator pressure was in the range of 2600–4000 kPa. The parameters used for the exergy analysis of the ejector cycle are given in Table 4.
3.2.1. The Effect of Gas Cooler Pressure on Exergy Efficiency and Exergy Destruction of the Ejector
The calculated parameters of a CO2 two-phase ejector operating for different gas cooler pressure are listed in Table 5.
Figure 8 depicts the variation of transiting and Grassmann exergy efficiency with the gas cooler pressure. Table 6 presents the important metrics of two exergy efficiency definitions.
As shown in Figure 8, there existed a maximum exergy efficiency corresponding to an optimum gas cooler pressure. The optimal gas cooler pressure was about 11,000 kPa, which was almost the same as that corresponding to the COP obtained in the authors’ previous work [30]. This result shows that the optimal design of a transcritical CO2 ejector cycle led to system performance improvement in terms of both the first and second laws of thermodynamics.
It was shown that both ejector exergy efficiencies increased when the gas cooler pressure was varied from 9000 kPa to 11,000 kPa. However, the transit exergy efficiency increased by up to 38.3% while the Grassmann exergy efficiency increased up to 0.85%. Moreover, exergy consumed decreased and exergy produced increased with increasing gas cooler pressure that resulted in an increase of transiting exergy efficiency.
3.2.2. The Effect of Evaporator Pressure on Exergy Efficiency and Exergy Destruction of the Ejector
Table 7 presents the calculated operating parameters of a CO2 two-phase ejector cycle for different evaporator pressure.
Figure 9 and Table 8 illustrate the variation of transiting and Grassmann exergy efficiency for various evaporator pressures.
It can be seen that the transiting exergy efficiency decreased significantly with an increase in evaporator pressure (about 87.8%) while the Grassmann exergy efficiency had a different trend. It decreased slowly at lower evaporator pressure (0.1%) and then increased when the evaporator pressure increased from 3000 kPa to 4000 kPa.
The same as previous results, the range of changes in Grassmann exergy efficiency was very small. However, the important result derived from this analysis dealt with the effect of transit exergy flow inside the ejector. The results showed that Grassmann exergy efficiency had a different trend as compared with transiting exergy efficiency. It can be seen in Table 8, both exergy consumed and exergy produced decreased while the transiting exergies increased as the evaporator pressure increased. However the decrease of exergy consumption (39.6%) was lower than the decrease in exergy production (90.5%), so the transiting exergy efficiency decreased. This result was expected since the ejector exergy destruction increases with the evaporator pressure.
However, according to Grassmann exergy efficiency definition, both inlet and outlet exergy increased by increasing evaporator pressure but the increase in inlet exergy was surpassed by the increase in outlet exergy, which increased Grassmann exergy efficiency.
The main reason for the different trend of exergy efficiencies was the presence of transiting exergy flow that was neglected when the Grassmann exergy efficiency was used. The results also showed that transiting exergy efficiency had a similar trend as the COP when the evaporator pressure increased [30].
4. Conclusions
An exergy analysis based on the transiting exergy was employed to evaluate the exergy destruction and exergy efficiency of a CO2 two-phase ejector at its critical point as well as under double choking and single choking conditions. The results were compared with the conventional Grassmann exergy analysis. This application provided the evaluation of exergy destruction as well as useful exergy production in the ejector. Two important thermodynamic metrics, exergy produced and exergy consumed were obtained for different ejector working conditions. It also provided the information regarding the transit exergy flows in a two-phase ejector that cannot be obtained through the conventional exergy analysis.
There was a compromise between exergy destruction and useful exergy produced in the ejector to indicate its performance, which cannot be derived from the Grassmann exergy analysis. The transiting exergy efficiency achieved the maximum value at the critical pressure corresponding to the critical point, it confirms a well-known heuristics, to design ejectors according to the conditions of the critical point. The impact of the gas cooler and evaporator pressures was investigated on ejector exergy efficiency in a transcritical CO2 cycle. The exergy efficiency had a different trend as a function of evaporator pressure when evaluated by the transiting or Grassmann exergy definition.
The established results showed that the transiting exergy flow had an important effect on the ejector exergy performance. On the contrary, the Grassmann exergy efficiency was not an appropriate criterion for the exergy evaluation of a two-phase ejector. The approach based on transiting exergy definition provided useful information, which can be used for the improvement of the ejector systems.
Future work would involve the investigation of the transiting exergy flow on advanced exergy analysis of a transcritical CO2 cycle.
Author Contributions
S.T.T., principal investigator, performed the numerical simulations of the ejector and heat pump system. M.S. proposed the concept of transiting exergy and supervised the findings of this work. S.P. provided technical and scientific assistance. All authors contributed to the final manuscript.
Funding
This research received no external funding.
Acknowledgments
This project is a part of the Collaborative Research and Development (CRD) Grants Program at “Université de Sherbrooke”. The authors acknowledge the support of the Natural Sciences and Engineering Research Council of Canada, Hydro-Québec, Rio Tinto Alcan and Canmet ENERGY Research Center of Natural Resources Canada (RDCPJ451917-13).
Conflicts of Interest
The authors declare no conflict of interest.
Nomenclature
| A | Cross section area, mm2 |
| D | Diameter, mm |
| Exergy rate, kW | |
| e | Specific exergy, kJ·kg−1 |
| ER | Entrainment ratio |
| h | Specific enthalpy, kJ·kg−1 |
| L | Length, m |
| Mass flow rate, kg·s−1 | |
| P | Pressure, kPa |
| Pd | Back pressure (discharge pressure), kPa |
| Pratio | Pressure ratio |
| s | Specific entropy, kJ·kg−1·K−1 |
| T | Temperature, °C |
| u | Mean axial velocity, m·s−1 |
| Greek symbols | |
| η | Efficiency |
| ∇ | Consumption |
| Δ | Production |
| Subscripts and superscripts | |
| 0 | Ambient state |
| crit | Critical |
| d | Diffuser outlet |
| ev | Evaporator |
| ei | Evaporator inlet |
| ex | Exergy |
| gc | Gas cooler |
| gi | Gas cooler inlet |
| in | Inlet |
| lim | Limiting |
| mix | Mixing |
| out | Outlet |
| p | Primary |
| pol | Polytropic |
| s | Secondary |
| ef | External fluid |
| th | Ejector’s throat |
| tr | Transiting |
| Abbreviations | |
| COP | Coefficient of performance |
| EERC | Ejector expansion recovery cycle |
| EES | Engineering equation solver |
| GWP | Global warming potential |
| HEM | Homogeneous equilibrium model |
| SNPD | Suction nozzle pressure drop |
References
- Kim, M.H.; Pettersen, J.; Bullard, C.W. Fundamental process and system design issues in CO2 vapor compression systems. Prog. Energy Combust. Sci. 2004, 30, 119–174. [Google Scholar] [CrossRef]
- Lorentzen, G. Revival of carbon dioxide as a refrigerant. Int. J. Refrig. 1994, 17, 292–301. [Google Scholar] [CrossRef]
- Gullo, P.; Hafner, A.; Banasiak, K. Transcritical R744 refrigeration systems for supermarket applications: Current status and future perspectives. Int. J. Refrig. 2018, 93, 269–310. [Google Scholar] [CrossRef]
- Austin, B.T.; Sumathy, K. Transcritical carbon dioxide heat pump systems: A review. Renew. Sustain. Energy Rev. 2011, 15, 4013–4029. [Google Scholar] [CrossRef]
- Fazelpour, F.; Morosuk, T. Exergoeconomic analysis of carbon dioxide transcritical refrigeration machines. Int. J. Refrig. 2014, 38, 128–139. [Google Scholar] [CrossRef]
- Elbel, S.; Lawrence, N. Review of recent developments in advanced ejector technology. Int. J. Refrig. 2016, 62, 1–18. [Google Scholar] [CrossRef]
- Gay, N.H. Refrigerating system. Google Patents, U.S. Patent No. 1,836,318, 15 December 1931. [Google Scholar]
- Kornhauser, A.A. The use of an ejector as a refrigerant expander. In Proceedings of the 1990 USNC/IIR—Purdue Refrigeration Conference, Purdue University, West Lafayette, IN, USA, 17–20 July 1990; pp. 10–19. [Google Scholar]
- Zhu, Y.; Huang, Y.; Li, C.; Zhang, F.; Jiang, P.X. Experimental investigation on the performance of transcritical CO2 ejector–expansion heat pump water heater system. Energy Convers. Manag. 2018, 167, 147–155. [Google Scholar] [CrossRef]
- Lucas, C.; Koehler, J. Experimental investigation of the COP improvement of a refrigeration cycle by use of an ejector. Int. J. Refrig. 2012, 35, 1595–1603. [Google Scholar] [CrossRef]
- He, Y.; Deng, J.; Zheng, L.; Zhang, Z. Performance optimization of a transcritical CO2 refrigeration system using a controlled ejector. Int. J. Refrig. 2017, 75, 250–261. [Google Scholar] [CrossRef]
- Banasiak, K.; Hafner, A.; Andresen, T. Experimental and numerical investigation of the influence of the two-phase ejector geometry on the performance of the R744 heat pump. Int. J. Refrig. 2012, 35, 1617–1625. [Google Scholar] [CrossRef]
- Boccardi, G.; Botticella, F.; Lillo, G.; Mastrullo, R.; Mauro, A.W.; Trinchieri, R. Experimental investigation on the performance of a transcritical CO2 heat pump with multi-ejector expansion system. Int. J. Refrig. 2017, 82, 389–400. [Google Scholar] [CrossRef]
- Elbel, S. Historical and present developments of ejector refrigeration systems with emphasis on transcritical carbon dioxide air-conditioning applications. Int. J. Refrig. 2011, 34, 1545–1561. [Google Scholar] [CrossRef]
- Sarkar, J. Optimization of ejector-expansion transcritical CO2 heat pump cycle. Energy 2008, 33, 1399–1406. [Google Scholar] [CrossRef]
- Fangtian, S.; Yitai, M. Thermodynamic analysis of transcritical CO2 refrigeration cycle with an ejector. Appl. Therm. Eng. 2011, 31, 1184–1189. [Google Scholar] [CrossRef]
- Deng, J.; Jiang, P.; Lu, T.; Lu, W. Particular characteristics of transcritical CO2 refrigeration cycle with an ejector. Appl. Therm. Eng. 2007, 27, 381–388. [Google Scholar] [CrossRef]
- Zhang, Z.; Tian, L. Effect of suction nozzle pressure drop on the performance of an ejector-expansion transcritical CO2 refrigeration cycle. Entropy 2014, 16, 4309–4321. [Google Scholar] [CrossRef]
- Taslimi Taleghani, S.; Sorin, M.; Poncet, S. Energy and exergy efficiencies of different configurations of the ejector-based CO2 refrigeration systems. Int. J. Energy Prod. Manag. 2018, 3, 22–33. [Google Scholar]
- Ersoy, H.K.; Bilir Sag, N. Performance characteristics of ejector expander transcritical CO2 refrigeration cycle. Proc. Inst. Mech. Eng. Part. J. Power Energy 2012, 226, 623–635. [Google Scholar] [CrossRef]
- Gullo, P.; Hafner, A.; Banasiak, K. Thermodynamic Performance Investigation of Commercial R744 Booster Refrigeration Plants Based on Advanced Exergy Analysis. Energies 2019, 12, 354. [Google Scholar] [CrossRef]
- Bai, T.; Yu, J.; Yan, G. Advanced exergy analyses of an ejector expansion transcritical CO2 refrigeration system. Energy Convers. Manag. 2016, 126, 850–861. [Google Scholar] [CrossRef]
- Boccardi, G.; Botticella, F.; Lillo, G.; Mastrullo, R.; Mauro, A.W.; Trinchieri, R. Thermodynamic Analysis of a Multi-Ejector, CO2, Air-To-Water Heat Pump System. Energy Procedia 2016, 101, 846–853. [Google Scholar] [CrossRef]
- Brodyansky, V.M.; Sorin, M.; Le Goff, P. The efficiency of industrial processes: Exergy analysis and optimization; Elsevier Science B. V.: Amsterdam, The Netherlands, 1994. [Google Scholar]
- Sorin, M.; Khennich, M. Exergy Flows Inside Expansion and Compression Devices Operating below and across Ambient Temperature. In Energy Systems and Environment; IntechOpen: London, UK, 2018. [Google Scholar]
- Khennich, M.; Sorin, M.; Galanis, N. Exergy flows inside a one phase ejector for refrigeration systems. Energies 2016, 9, 212. [Google Scholar] [CrossRef]
- Haghparast, P.; Sorin, M.V.; Nesreddine, H. The impact of internal ejector working characteristics and geometry on the performance of a refrigeration cycle. Energy 2018, 162, 728–743. [Google Scholar] [CrossRef]
- Taslimi Taleghani, S.; Sorin, M.; Poncet, S. Modeling of two-phase transcritical CO2 ejectors for on-design and off-design conditions. Int. J. Refrig. 2017, 87, 91–105. [Google Scholar] [CrossRef]
- Haghparast, P.; Sorin, M.; Nesreddine, H. Effects of component polytropic efficiencies on the dimensions of monophasic ejectors. Energy Convers. Manag. 2018, 162, 251–263. [Google Scholar] [CrossRef]
- Taslimi Taleghani, S.; Sorin, M.; Poncet, S.; Nesreddine, H. Performance investigation of a two-phase transcritical CO2 ejector heat pump system. Energy Convers. Manag. 2019, 185, 442–454. [Google Scholar] [CrossRef]
- Szargut, J.; Morris, D.R.; Steward, F.R. Exergy Analysis of Thermal, Chemical, and Metallurgical Processes; Hemisphere Publ. Corp: New York, NY, USA, 1988. [Google Scholar]
- Kotas, T.J. The Exergy Method of Thermal Plant Analysis, 2nd ed.; Krieger Publishing: Malabar, FL, USA, 1995. [Google Scholar]
- Tsatsaronis, G. Thermoeconomic analysis and optimization of energy systems. Prog. Energy Combust. Sci. 1993, 19, 227–257. [Google Scholar] [CrossRef]
- Bejan, A.; Tsatsaronis, G. Thermal Design and Optimization; John Wiley & Sons: New York, NY, USA, 1996. [Google Scholar]
- Grassmann, P. Towards the general definition of efficiency (in German). Chem. Ing. Tech. 1950, 22, 77–80. [Google Scholar] [CrossRef]
Figure 1.
Critical mode of an ejector [28].
Figure 1.
Critical mode of an ejector [28].
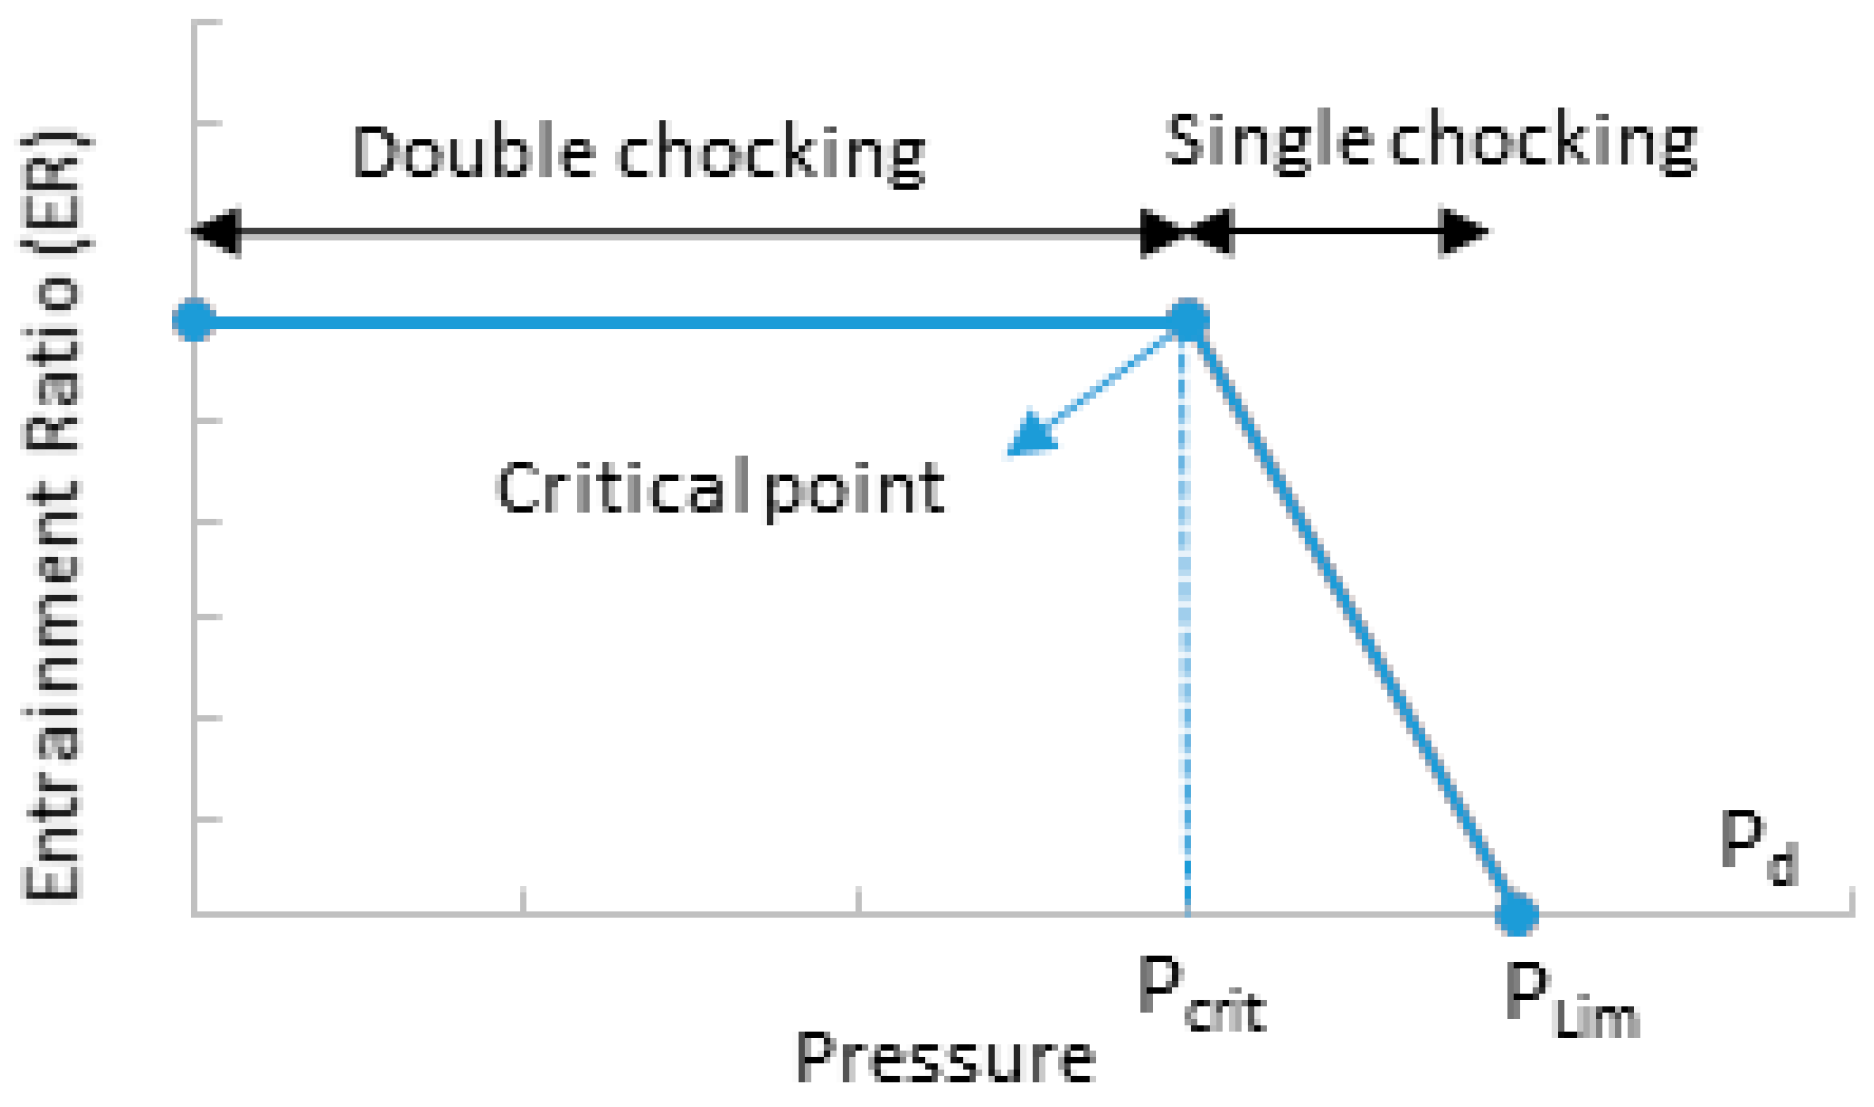
Figure 2.
(a) Schematic of a transcritical CO2 ejector cycle and (b) the corresponding temperature-specific entropy diagram [30].
Figure 2.
(a) Schematic of a transcritical CO2 ejector cycle and (b) the corresponding temperature-specific entropy diagram [30].

Figure 3.
Schematic of an ejector with relevant notations [30].
Figure 3.
Schematic of an ejector with relevant notations [30].

Figure 4.
Grassmann diagram with transiting exergy.

Figure 5.
The exergy-enthalpy diagram for expansion and compression processes of a transcritical CO2 ejector.
Figure 5.
The exergy-enthalpy diagram for expansion and compression processes of a transcritical CO2 ejector.

Figure 6.
Variations of exergy destruction; transiting exergy efficiency and Grassmann exergy efficiency of the ejector with back pressure.
Figure 6.
Variations of exergy destruction; transiting exergy efficiency and Grassmann exergy efficiency of the ejector with back pressure.

Figure 7.
Exergy destruction, transiting exergy efficiency and Grassmann exergy efficiency of the ejector for different conditions: (a) Single choking; (b) critical point and (c) double choking.
Figure 7.
Exergy destruction, transiting exergy efficiency and Grassmann exergy efficiency of the ejector for different conditions: (a) Single choking; (b) critical point and (c) double choking.

Figure 8.
Comparison of two exergy efficiencies as a function of the gas cooler pressure.

Figure 9.
Comparison of two exergy efficiencies as a function of the evaporator pressure.


Table 1.
Calculated parameters of a CO2 two-phase ejector for different operating conditions.
| States | Pd (kPa) | Td (˚C) | Pratio | ER | |||
|---|---|---|---|---|---|---|---|
| Base case: (critical point) (Pd = Pcr) | 4601 | 10.88 | 0.0423 | 0.0240 | 0.0663 | 1.164 | 0.568 |
| Double chocking (Pd < Pcr) | 4580 | 10.61 | 0.0423 | 0.0240 | 0.0663 | 1.159 | 0.568 |
| 4520 | 10.08 | 0.0423 | 0.0240 | 0.0663 | 1.144 | 0.568 | |
| 4480 | 9.718 | 0.0423 | 0.0240 | 0.0663 | 1.134 | 0.568 | |
| 4420 | 9.162 | 0.0423 | 0.0240 | 0.0663 | 1.118 | 0.568 | |
| Single choking (Pd > Pcr) | 4730 | 12.01 | 0.0423 | 0.0228 | 0.0650 | 1.197 | 0.539 |
| 4811 | 12.7 | 0.0423 | 0.0211 | 0.0633 | 1.217 | 0.499 | |
| 4939 | 13.77 | 0.0423 | 0.0172 | 0.0595 | 1.250 | 0.407 | |
| 5002 | 14.3 | 0.0423 | 0.0148 | 0.0571 | 1.266 | 0.351 | |
| 5097 | 15.08 | 0.0423 | 0.0108 | 0.0531 | 1.290 | 0.256 | |
| 5198 | 15.89 | 0.0423 | 0.0064 | 0.0486 | 1.315 | 0.151 | |
| 5313 | 16.82 | 0.0423 | 0.0009 | 0.0431 | 1.344 | 0.021 |
Table 2.
Exergy metrics of a two-phase ejector for different back pressures at double choking conditions (Pd < Pcr).
Table 2.
Exergy metrics of a two-phase ejector for different back pressures at double choking conditions (Pd < Pcr).
| Transiting Exergy Calculation | Grassmann Exergy Calculation | |||||||
|---|---|---|---|---|---|---|---|---|
| Back Pressure (Pd, kPa) | Exergy consumed (∇, kW) | Exergy Produced (Δ, kW) | Exergy destruction (D, kW) | Transiting Exergy (tr, kW) | Exergy Efficiency (ηex,tr) | Exergy Efficiency (ηex,GR) | Inlet Exergy (in, kW) | Outlet Exergy (out, kW) |
| 4601 | 0.839 | 0.4998 | 0.34 | 12.718 | 0.595 | 0.975 | 13.56 | 13.22 |
| 4580 | 0.852 | 0.507 | 0.346 | 12.705 | 0.594 | 0.975 | 13.56 | 13.21 |
| 4520 | 0.885 | 0.52 | 0.365 | 12.673 | 0.587 | 0.973 | 13.56 | 13.19 |
| 4480 | 0.907 | 0.522 | 0.385 | 12.65 | 0.576 | 0.972 | 13.56 | 13.17 |
| 4420 | 0.941 | 0.53 | 0.41 | 12.617 | 0.564 | 0.97 | 13.56 | 13.15 |
Table 3.
Exergy metrics of a two-phase ejector for different back pressures and entrainment ratios at single choking conditions (Pd Pcr).
Table 3.
Exergy metrics of a two-phase ejector for different back pressures and entrainment ratios at single choking conditions (Pd Pcr).
| Transit Exergy Calculation | Grassmann Exergy Calculation | |||||||
|---|---|---|---|---|---|---|---|---|
| Back Pressure (Pd, kPa) | Exergy consumed (∇, kW) | Exergy Produced (Δ, kW) | Exergy destruction (D, kW) | Transiting Exergy (tr, kW) | Exergy Efficiency (ηex,tr) | Exergy Efficiency (ηex,GR) | Inlet Exergy (in, kW) | Outlet Exergy (out, kW) |
| 4601 | 0.839 | 0.5 | 0.34 | 12.718 | 0.595 | 0.975 | 13.56 | 13.22 |
| 4730 | 0.763 | 0.465 | 0.298 | 12.551 | 0.609 | 0.978 | 13.31 | 13.02 |
| 4811 | 0.711 | 0.426 | 0.285 | 12.276 | 0.599 | 0.978 | 12.99 | 12.7 |
| 4939 | 0.629 | 0.348 | 0.281 | 11.618 | 0.553 | 0.977 | 12.25 | 11.97 |
| 5002 | 0.59 | 0.297 | 0.293 | 11.2 | 0.504 | 0.975 | 11.79 | 11.5 |
| 5097 | 0.533 | 0.229 | 0.305 | 10.495 | 0.429 | 0.972 | 11.03 | 10.72 |
| 5198 | 0.479 | 0.155 | 0.324 | 9.693 | 0.324 | 0.968 | 10.17 | 9.848 |
| 5313 | 0.425 | 0.069 | 0.356 | 8.699 | 0.162 | 0.961 | 9.123 | 8.768 |
Table 4.
Parameters used for the cycle simulation [30].
Table 4.
Parameters used for the cycle simulation [30].
| Parameter | Value | Parameter | Value |
|---|---|---|---|
| Pgc, kPa | 9000–11,500 | Dth, mm | 1.1–2.6 |
| Tgi,ef, °C | 27.39 | Dmix, mm | 4 |
| , kg·s−1 | 0.117 | L5/Dmix | 8 |
| Pev, kPa | 2600–4000 | Amix/Ad | 0.2 |
| Tei,ef, °C | 18.04 | Agc, m2 | 2.199 |
| , kg·s−1 | 0.764 | Aev, m2 | 1.935 |
Table 5.
Calculated parameters of a CO2 two-phase ejector for different gas cooler pressures.
| Pp (kPa) | Tp (°C) | Ps (kPa) | Ts (°C) | Pd (kPa) | Td (°C) | ||
|---|---|---|---|---|---|---|---|
| 0.162 | 0.047 | 9000 | 40.53 | 2780.36 | 27.05 | 4189.78 | 7.13 |
| 0.152 | 0.052 | 9500 | 41.63 | 2780.36 | 26.92 | 4067.96 | 5.96 |
| 0.139 | 0.056 | 10,000 | 41.23 | 2780.36 | 26.82 | 3882.57 | 4.14 |
| 0.123 | 0.059 | 10,622 | 38.08 | 2780.36 | 26.66 | 3650.25 | 1.76 |
| 0.107 | 0.059 | 11,000 | 33.18 | 2780.36 | 26.62 | 3405.96 | −0.86 |
| 0.091 | 0.056 | 11,500 | 26.57 | 2780.36 | 26.62 | 3141.83 | −3.86 |
Table 6.
Exergy metrics of CO2 two-phase ejector for different gas cooler pressure.
| Transit Exergy Calculation | Grassmann Exergy Calculation | ||||||||
|---|---|---|---|---|---|---|---|---|---|
| Gas cooler pressure | Exergy consumed | Exergy produced | Primary transiting Exergy | Secondary transiting Exergy | Transit exergy efficiency | Exergy destruction | Grassmann Exergy efficiency | Inlet exergy | Outlet exergy |
| (Pgc, kPa) | (∇, kW) | (Δ, kW) | (tr,p, kW) | (tr,s, kW) | (ηex,tr) | (D, kW) | (ηex,GR) | (in, kW) | (out, kW) |
| 9000 | 3.206 | 1.447 | 31.354 | 8.196 | 0.451 | 1.758 | 0.959 | 42.756 | 40.997 |
| 9500 | 3.195 | 1.588 | 29.228 | 9.041 | 0.497 | 1.607 | 0.961 | 41.464 | 39.856 |
| 10,000 | 3.135 | 1.711 | 26.375 | 9.777 | 0.546 | 1.424 | 0.964 | 39.287 | 37.863 |
| 10,622 | 3.019 | 1.820 | 22.969 | 10.398 | 0.603 | 1.199 | 0.967 | 36.386 | 35.186 |
| 11,000 | 2.915 | 1.819 | 19.814 | 10.296 | 0.624 | 1.095 | 0.967 | 33.025 | 31.930 |
| 11,500 | 2.791 | 1.746 | 16.481 | 9.741 | 0.625 | 1.046 | 0.964 | 29.013 | 27.968 |
Table 7.
Calculated parameters of a CO2 two-phase ejector for different evaporator pressures.
| Pp (kPa) | Tp (°C) | Ps (kPa) | Ts (°C) | Pd (kPa) | Td (°C) | ||
|---|---|---|---|---|---|---|---|
| 0.126 | 0.054 | 10,000 | 39.66 | 2648.58 | 26.86 | 3658.91 | 1.85 |
| 0.139 | 0.056 | 10,000 | 41.23 | 2780.36 | 26.82 | 3882.57 | 4.14 |
| 0.168 | 0.058 | 10,000 | 43.57 | 3045.77 | 26.70 | 4358.38 | 8.70 |
| 0.229 | 0.059 | 10,000 | 46.08 | 3485.04 | 26.70 | 5239.97 | 16.23 |
| 0.297 | 0.058 | 10,000 | 47.05 | 3969.42 | 26.70 | 6001.80 | 21.99 |
Table 8.
Exergy metrics of CO2 two-phase ejector for different evaporator pressures.
| Transit Exergy Calculation | Grassmann Exergy Calculation | ||||||||
|---|---|---|---|---|---|---|---|---|---|
| Evaporator pressure | Exergy consumed | Exergy produced | Primary transiting Exergy | Secondary transiting Exergy | Transit exergy efficiency | Exergy Destruction | Grassmann Exergy efficiency | Inlet exergy | Outlet exergy |
| (Pgc, kPa) | (∇, kW) | (Δ, kW) | (tr,p, kW) | (tr,s, kW) | (ηex,tr) | (D, kW) | (ηex,GR) | (in, kW) | (out, kW) |
| 2648.58 | 3.090 | 1.806 | 23.667 | 9.383 | 0.584 | 1.285 | 0.965 | 36.140 | 34.855 |
| 2780.36 | 3.135 | 1.711 | 26.375 | 9.777 | 0.546 | 1.424 | 0.964 | 39.287 | 37.863 |
| 3045.77 | 3.198 | 1.510 | 32.641 | 10.415 | 0.472 | 1.688 | 0.964 | 46.254 | 44.566 |
| 3485.04 | 3.177 | 1.163 | 46.184 | 10.924 | 0.366 | 2.014 | 0.967 | 60.285 | 58.271 |
| 3969.42 | 2.354 | 0.166 | 61.658 | 11.146 | 0.071 | 2.188 | 0.971 | 75.158 | 72.970 |
© 2019 by the authors. Licensee MDPI, Basel, Switzerland. This article is an open access article distributed under the terms and conditions of the Creative Commons Attribution (CC BY) license (http://creativecommons.org/licenses/by/4.0/).
Share and Cite
MDPI and ACS Style
Taslimi Taleghani, S.; Sorin, M.; Poncet, S. Analysis and Optimization of Exergy Flows inside a Transcritical CO2 Ejector for Refrigeration, Air Conditioning and Heat Pump Cycles. Energies 2019, 12, 1686. https://doi.org/10.3390/en12091686
AMA Style
Taslimi Taleghani S, Sorin M, Poncet S. Analysis and Optimization of Exergy Flows inside a Transcritical CO2 Ejector for Refrigeration, Air Conditioning and Heat Pump Cycles. Energies. 2019; 12(9):1686. https://doi.org/10.3390/en12091686
Chicago/Turabian StyleTaslimi Taleghani, Sahar, Mikhail Sorin, and Sébastien Poncet. 2019. "Analysis and Optimization of Exergy Flows inside a Transcritical CO2 Ejector for Refrigeration, Air Conditioning and Heat Pump Cycles" Energies 12, no. 9: 1686. https://doi.org/10.3390/en12091686
Note that from the first issue of 2016, this journal uses article numbers instead of page numbers. See further details here.