A Study of the Effects of Enhanced Uniformity Control of Greenhouse Environment Variables on Crop Growth

1
Department of Mechanical Engineering, Graduate School of Yeungnam University, 280, Daehak-Ro, Gyeongsan 38541, Korea
2
Department of Mechanical Engineering, Yeungnam University, 280, Daehak-Ro, Gyeongsan 38541, Korea
3
Korea Institute of Energy Research, 152, Gajeong-ro, Yuseong-gu, Daejeon 34129, Korea
*
Authors to whom correspondence should be addressed.
Energies 2019, 12(9), 1749; https://doi.org/10.3390/en12091749
Submission received: 4 April 2019
/
Revised: 28 April 2019
/
Accepted: 6 May 2019
/
Published: 9 May 2019
(This article belongs to the Special Issue Energy Performance and Indoor Climate Analysis in Buildings)
Abstract
:In order to ensure high crop yield and good quality in greenhouse horticulture, the major environment control variables, such as temperature, humidity, and CO2 concentration, etc., need to be controlled properly, in order to reduce harmful effects on crop growth by minimizing the fluctuation of the thermal condition. Even though a hot water-based heating system is evidently superior to a hot air-based heating system, in terms of the thermally stable condition or energy saving, a hot air-based heating system has occupied the domestic market due to its economic efficiency from an initial investment cost saving. However, the intrinsic drawbacks of a hot air-based heating system, being more frequent variation of thermal variables and an inordinate disturbance on crops due to its convective heat delivery nature, are believed to be the main reasons for the insufficient crop yield and/or the quality deterioration. In addition, the current thermal environment monitoring system in a greenhouse, in which a sole sensor node usually covers a large part of cultivating area, seems to have a profound need of improvement in order to resolve those problems, in that the assumption of thermal uniform condition, which is adequate for a sole sensor node system, cannot be ensured in some cases. In this study, the qualitative concept of the new control variable—the degree of uniformity—is suggested as an indicator to seek ways of enhancing the crop yield and its quality based on the multiple sensor nodes system with a wireless sensor network. In contrast to a conventional monitoring system, for which a newly suggested concept of qualitative variable cannot be estimated at all, the multiple sensor nodes-based thermal monitoring system can provide more accurate and precise sensing, which enables the degree of uniformity to be checked in real-time and thus more precise control becomes possible as a consequence. From the analysis of the results of the experiment and simulation, it is found that the crops in plastic vinyl houses can be exposed to a serious level of non-uniform thermal condition. For instance, the temperature difference in the longitudinal and widthwise direction is 3.0 °C and 6.5 °C, respectively for the case of 75 × 8 m dimension greenhouse during a typical winter season, and it can be hypothesized that this level of non-uniformity might cause considerable damage to crop growth. In this paper, several variants of control systems, within the framework of the multiple sensor nodes system, is proposed to provide a more thermally-stable cultivating environment and the experimental verification is carried out for different scales of test greenhouses. The results showed that a simple change of heating mode (i.e., from a hot air- to a hot water-based heating system) can bring about a significant improvement for the non-uniformity of temperature (more or less 80%), and an additional countermeasure, with local heat flux control, can lead to a supplementary cut of non-uniformity up to 90%. Among the several variants of local heat flux control systems, the hydraulic proportional mass flow control valve system was proven to represent the best performance, and it can be hypothesized that the newly suggested qualitative variable—the degree of uniformity—with the multiple sensor nodes system can be a good alternative for seeking enhanced cultivating performance, being higher crop yield and better quality along with energy cost saving.
1. Introduction
As the effects of climate change are becoming persistently serious, it is reported that we will need 50% more energy, 40% more water, and 35% more food, which is in reference to the statistics that a population of about 8.3 billion will be attained by 2030 [1,2] and that the food system will consume more or less 30% of the final energy use, along with the current trend of natural resource exploitation and the corresponding greenhouse gas (GHG) emission increase by the same rate [3]. However, overcoming the shortage of water and securing a fat supply of food will come down to an energy problem, since production of fresh water and food also require a substantial amount of energy; and the consequent additional production of heat and power with fossil fuels to cope with the aforementioned energy problems can lead to the extra emission of greenhouse gases, thus making the situation of climate change worse. In the long run, the conventional mass production-based outdoor culture becomes inappropriate to deal with the huge risk of the security of food supply caused by climate change, and a transition from the conventional outdoor culture into greenhouse horticulture, in the form of smart or sustainable farms, is needed for ensuring food security [4,5,6].
As greenhouse horticulture is getting more attention as one of the appropriate measures to resolve food security problems in the era of climate change, the market is expected to expand rapidly around the globe at an impressive CAGR (compound annual growth rate) of approximately 19% by between 2017 and 2022 [7,8]. This can be understood as being a distinctive indicator of the relevant market reflecting the awareness about the crisis created by climate change, and, furthermore, that greenhouse horticulture is the right endeavor to overcome the potential risk of reliable food supply capability. In South Korea, it is also not difficult to see the effects of climate change in the cultivation environment, not to mention in ordinary life, in that the suitable region for crop growth, or fruits, has been rapidly changing according to the change of the annual average temperature in the region, and tropical foods even are starting to substitute the conventional ones out of necessity. In addition, greenhouse horticulture, including the concept of smart farming, is rapidly expanding in the market, with the recognition of the potential threat in terms of food supply security as mentioned above [9]; however, small-scale versions of greenhouse the horticulture model, like a plastic vinyl house, still hold a 99% majority in the market [10,11,12].
Although a large-scale greenhouse with a glass skin is expected to enjoy the advantages of economy of scale, to some extent, the strong market share of the traditional small-scale plastic vinyl house model will be managed for the time being, due to the advantage of the relatively cheap facility capital costs and public acceptability in the agricultural area. It is interesting to note that the majority of the greenhouse horticulture market is still comprised of the plastic vinyl house type model (99%), whereas the glass greenhouse type model has been stagnant or has only had some increase in their market share, but remain within 1% at the moment in South Korea [12,13,14].
Along with the rapid annual growth rate of greenhouse horticulture in the era of climate change, the relevant market for the multi-variable control of the environment system for greenhouse horticulture is expected to repeat its high growth rate, and one can notice, without difficulty, that slightly different features have been manifested in each product, of the various cultivating control systems, in the market of greenhouse horticulture. However, what all systems have in common is the quantitative control of the variables of temperature, humidity, CO2 concentration, and light intensity, via auxiliary light source, etc., in order to provide comfortable growth conditions for the crops inside the greenhouse, and, so far, a quite satisfactory accomplishment in terms of improved productivity and enhanced quality has been achieved [15,16,17,18,19]. However, there is still large room for improvement, especially to cope with increasingly harsh environments from climate change.
In conventional greenhouse environment control systems, regardless of the types of greenhouse or the scale of it, the energy cost represents the major share of total operating costs. For example, at present in South Korea, it usually forms about 30% to 35% among the whole operating cost annual, in the case of plastic vinyl houses, and a little bit higher portion, about 40%, in the case of a large-scale glass-type greenhouse [20,21,22].
In addition, a variety of researches and developments for improving crop yield and its quality, or reducing the energy consumption, have been carried out consistently to ensure cost competitiveness in the market. The optimal value of the thermal variables for successful greenhouse cultivation of tomato has been reviewed [23], and it has been pointed out that sustainable greenhouse production requires the integration of information and management strategies, as well as excellent understanding of the influencing microclimate parameters, which does not seem to be accomplished properly with the current sensing platform of a limited number of sensor nodes to cover a wide range of cultivating areas. Various types of controller techniques, such as proportional integral (PI) control, fuzzy logic control, artificial neural network control, and adaptive neuro-fuzzy control have also been developed and tested in the field [24,25,26,27]. Numerous simulation models and tools for a greenhouse such as TRNSYS, HORTICERN, MICGREEN, and HORTITRANS have been developed to describe and analyze the microclimate of a greenhouse in which a static, dynamic, or intermediate model are included [28]. For example, greenhouse building energy simulation and relevant sub-model development have been extensively carried out to estimate the energy load and corresponding cost management using a versatile dynamic building energy simulation software, of TRNSYS, where the annual time-varying energy load prediction for a greenhouse, the renewable energy resources, and various energy saving techniques can be simulated for single- or multi-zone buildings [29,30,31]. Furthermore, a computational fluid dynamics technique, for which a detailed spatial distribution of the fluid dynamic and thermal variables are provided, is being applied to greenhouse microclimate simulation to increase understanding of the detailed mechanisms, causes, or effects of the applied systems [32,33].
It is also quite surprising to recognize that it occurs even though the lowest electricity price rate is applied to the energy facilities, which is operated by using electricity such as a heat pump, electricity boiler, etc., in the agricultural sector in South Korea. It can be supposed that, in some ways, such a low rate electricity price system could lead to the thoughtless waste of energy, or, on the other hand, that there is a large opportunity for energy consumption reduction by adopting the proper energy efficient measures that are commonly used in other sectors, such as residential or industrial sectors. One thing we know it will do is that the energy cost will continue its upward movement in the forthcoming years of climate change, because the persistent pressure to reduce GHG emission at the national scale, in order to implement the Paris Agreement on climate change, will be reflected in the prices of energy, in the form of taxation, etc., to achieve the final goals of GHG emission reduction in each sector. The portion of electricity usage in the agricultural area of South Korea is about 4% [34] at present, but it is indicated that the transition from fossil fuel to electricity to produce the energy for cultivation has been rapidly realized recently. Moreover, the rapid expansion of the greenhouse horticulture market along with the new concept of smart farming, which is estimated to grow at an impressive compound annual growth rate (CAGR) of approximately 19% by 2020 [7], will certainly work to change or withdraw the current policy of the low rate electricity price policy in the agricultural sector in due time. In that sense, the development of the proper measures or solutions to enable the reduction of energy consumption in operating the greenhouse has become increasingly critical, in order to survive in the forthcoming era of climate change and to secure sustainable business circumstances, and, subsequently, to have a connected ring between energy savings and crop productivity improvement by providing more comfortable thermal conditions.
In this study, a qualitative concept of a new control variable—the degree of uniformity—is proposed as a main control variable for seeking ways to save energy, to enhance the productivity and the quality of crops simultaneously. In order to accomplish the above goals, an increased number of sensors are installed, based on the wireless sensor network, to monitor the status of uniformity more accurately compared to the conventional monitoring system, whereby a sole sensor node is used for wide range of cultivating areas. It was fully verified that the hot water system is superior to the hot air supplying system (which is dominant in the market due to its low level of initial capital cost and ease of control), in that it is more stable, has little fluctuation of thermal variables, and provides comfortable thermal conditions, due to the natural convection or radiative heat transfer mode that can be attained via the hot water pipe system. From the elaborate analysis of the experiment data, it was deduced that the simple change of heating mode, from the convective heat transfer to the radiative one, provides a serious enhancement of the degree of uniformity inside a greenhouse, about more than 80%. Additionally, three systems of local heat flux variation control measures were tested, along with the precise sensor nodes network of multiple wireless sensors based on the hot water system. Among the counter measures of local heat flux variation, based on the hot water-based heating system, the one with hydraulic proportional mass flow control valve showed the best performance and was evidenced to be beneficial by managing the degree of uniformity in many ways. Furthermore, the newly suggested qualitative variable of the degree of uniformity was believed to be a good indicator, and deserved to be a good control variable to provide a better greenhouse thermal environment for ensuring the enhanced productivity and quality of the crops. This new measure to exert active control over the local heat flux, with the hydraulic proportional mass flow control valve, was able to aid a supplementary reduction of non-uniformity up to 90% effectively. In the following, the experiment conditions and corresponding control system configurations are described in detail and various technical aspects of enhanced degree of uniformity, for the main environment variables on energy saving and the productivity improvement, is assessed in detail.
2. Experimental Verification
2.1. Specification of test Greenhouses and Control Measures
In this study, the experimental verification for the newly proposed control concept, the degree of uniformity, and the several corresponding control measures based on the hot water-based heating system were carried out for two different scales of test greenhouses. In order to seek the best performing measure for thermal environment control, several variants of control measures were implemented and tested for each greenhouse. The several variants of adopted control measures based on hot water supply are summarized in Table 1, and the different dynamic features for the applied measures are described in the following. The experimental verification for the all variants of control measures were not carried out in the same test beds of a greenhouse due to several reasons, and the variant of pump on–off by the beds, which was designed to seek a degree of freedom on heat supply by a bed in contrast to the simultaneous supply to all beds, was applied on both test greenhouse. The dimension of the first greenhouse test bed (greenhouse A) was 70 × 8.3 m of area and the inside volume was about 2146 m3. The other experiment greenhouse test bed (greenhouse B) had the dimensions of heating areas of 25 × 6 m, and volume of 400 m3, which was relatively smaller to the first one. The thermal and air conditioning environment of the greenhouses were controlled mainly with the side window and skylight operation, and an auxiliary roof fan and hot air-based heating system, etc., was equipped, as used for an original greenhouse. The hot water-based heating system was newly installed for this experimental verification and somewhat different heat supplying configurations were adopted for each test greenhouse in terms of hot water temperature management, which is to be mentioned briefly later.
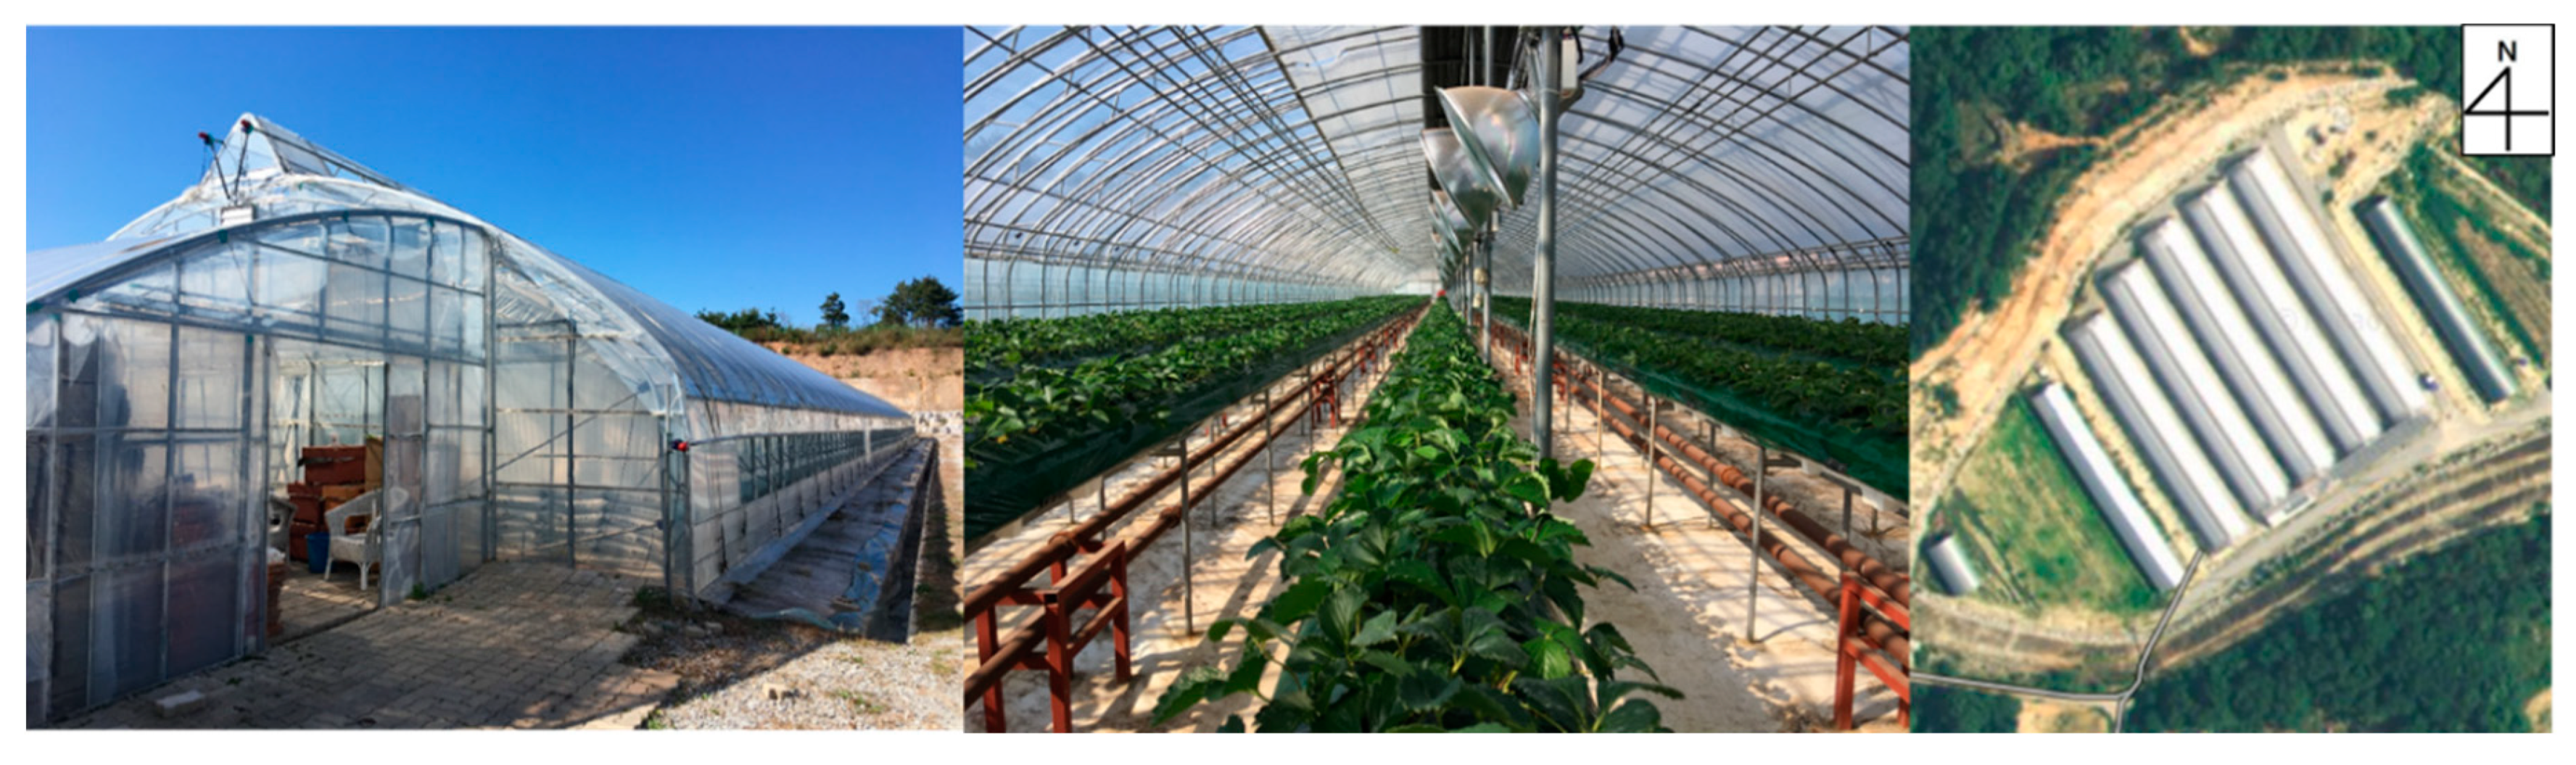
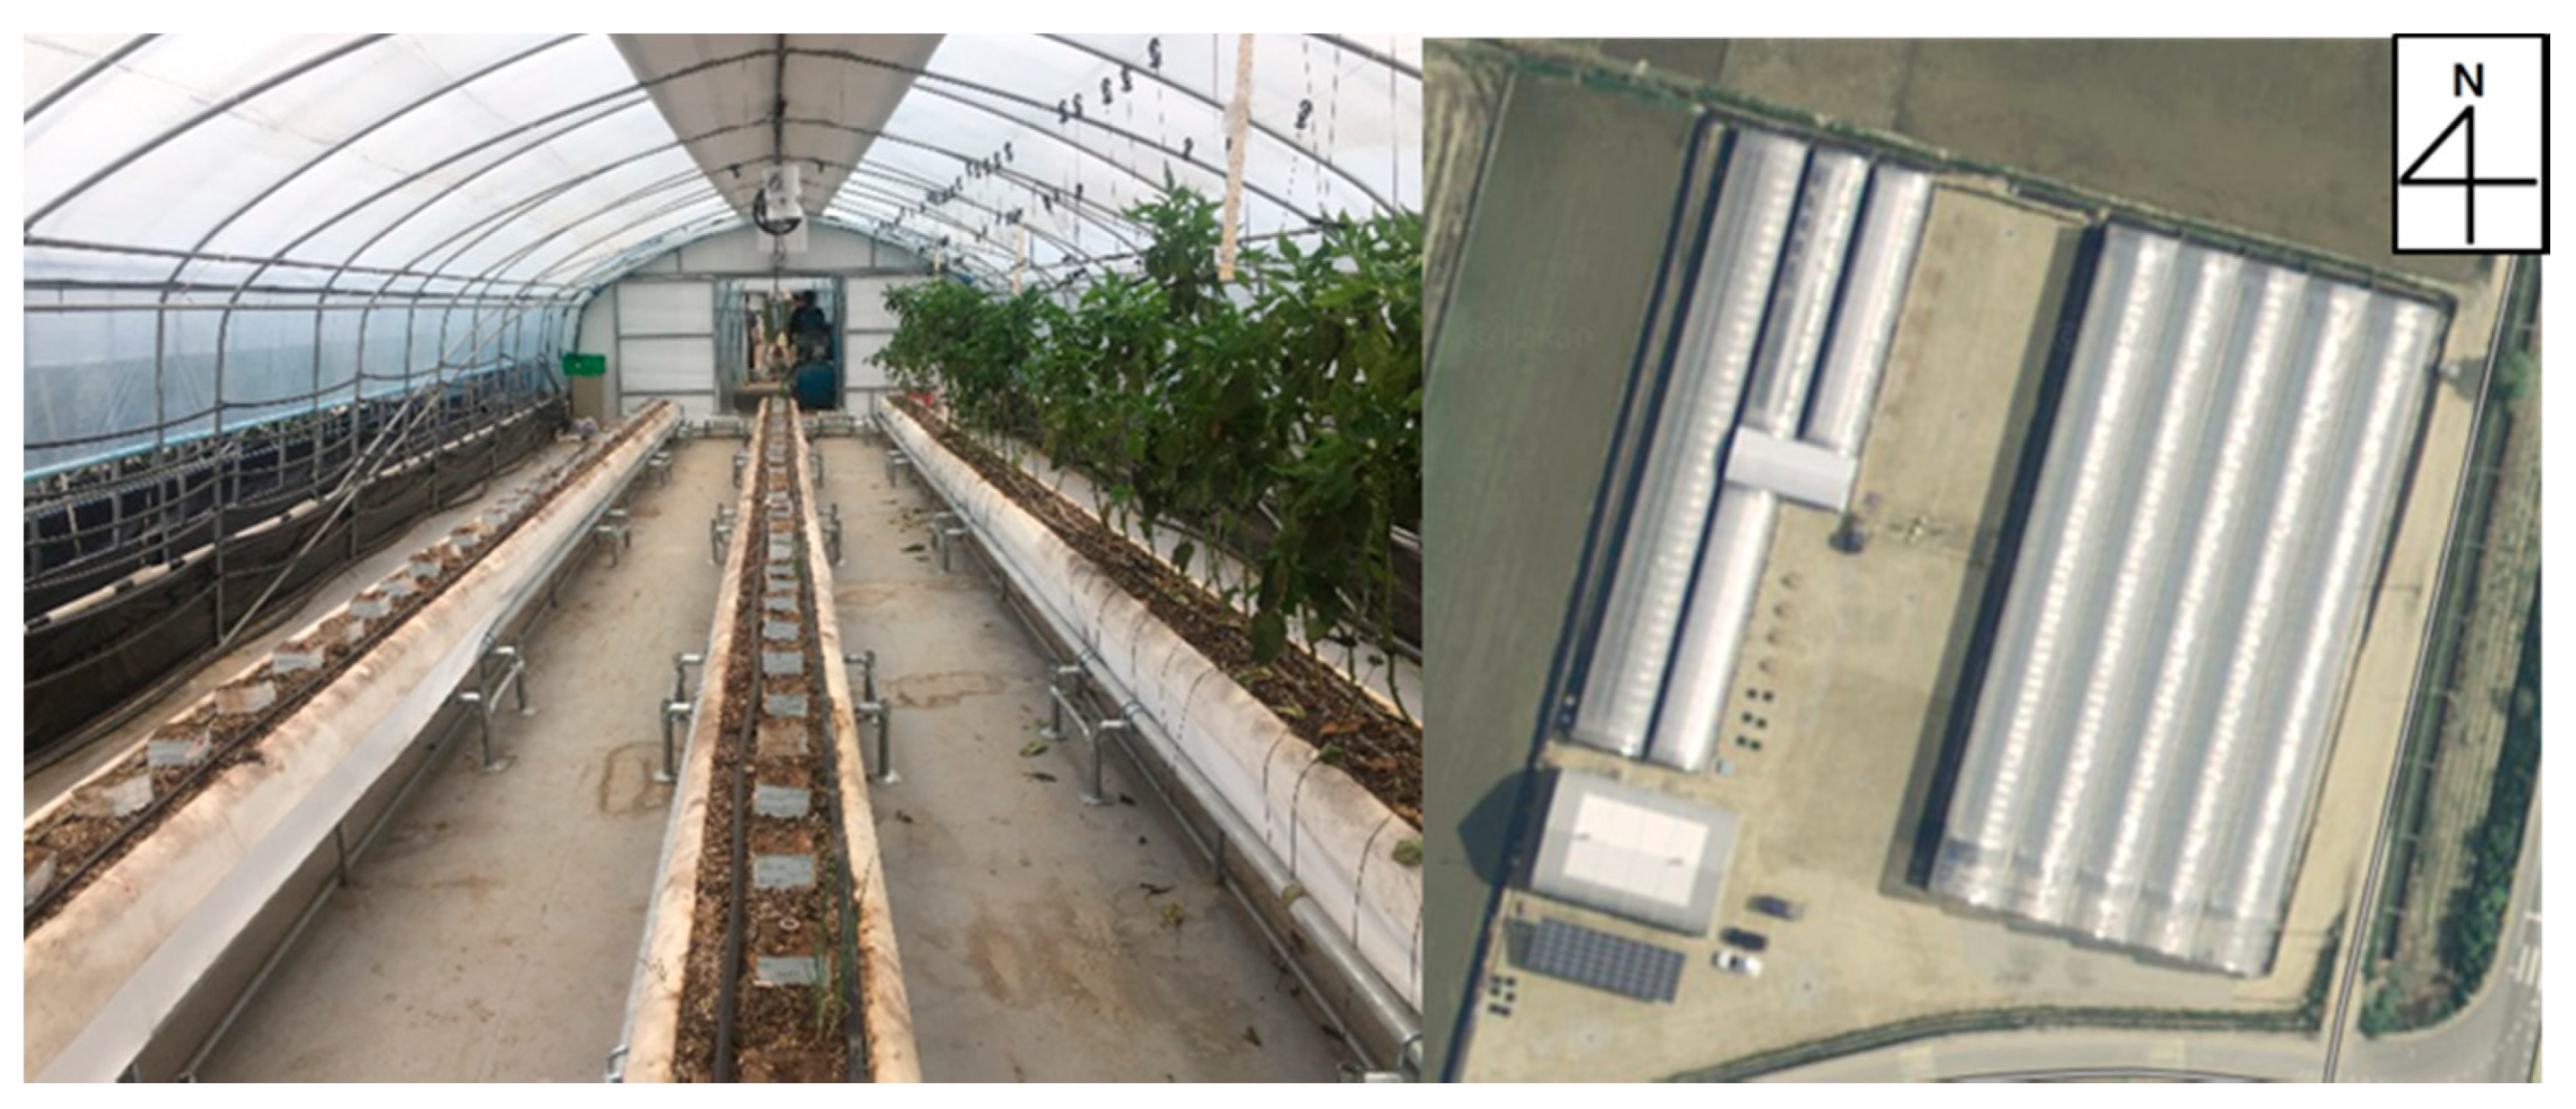
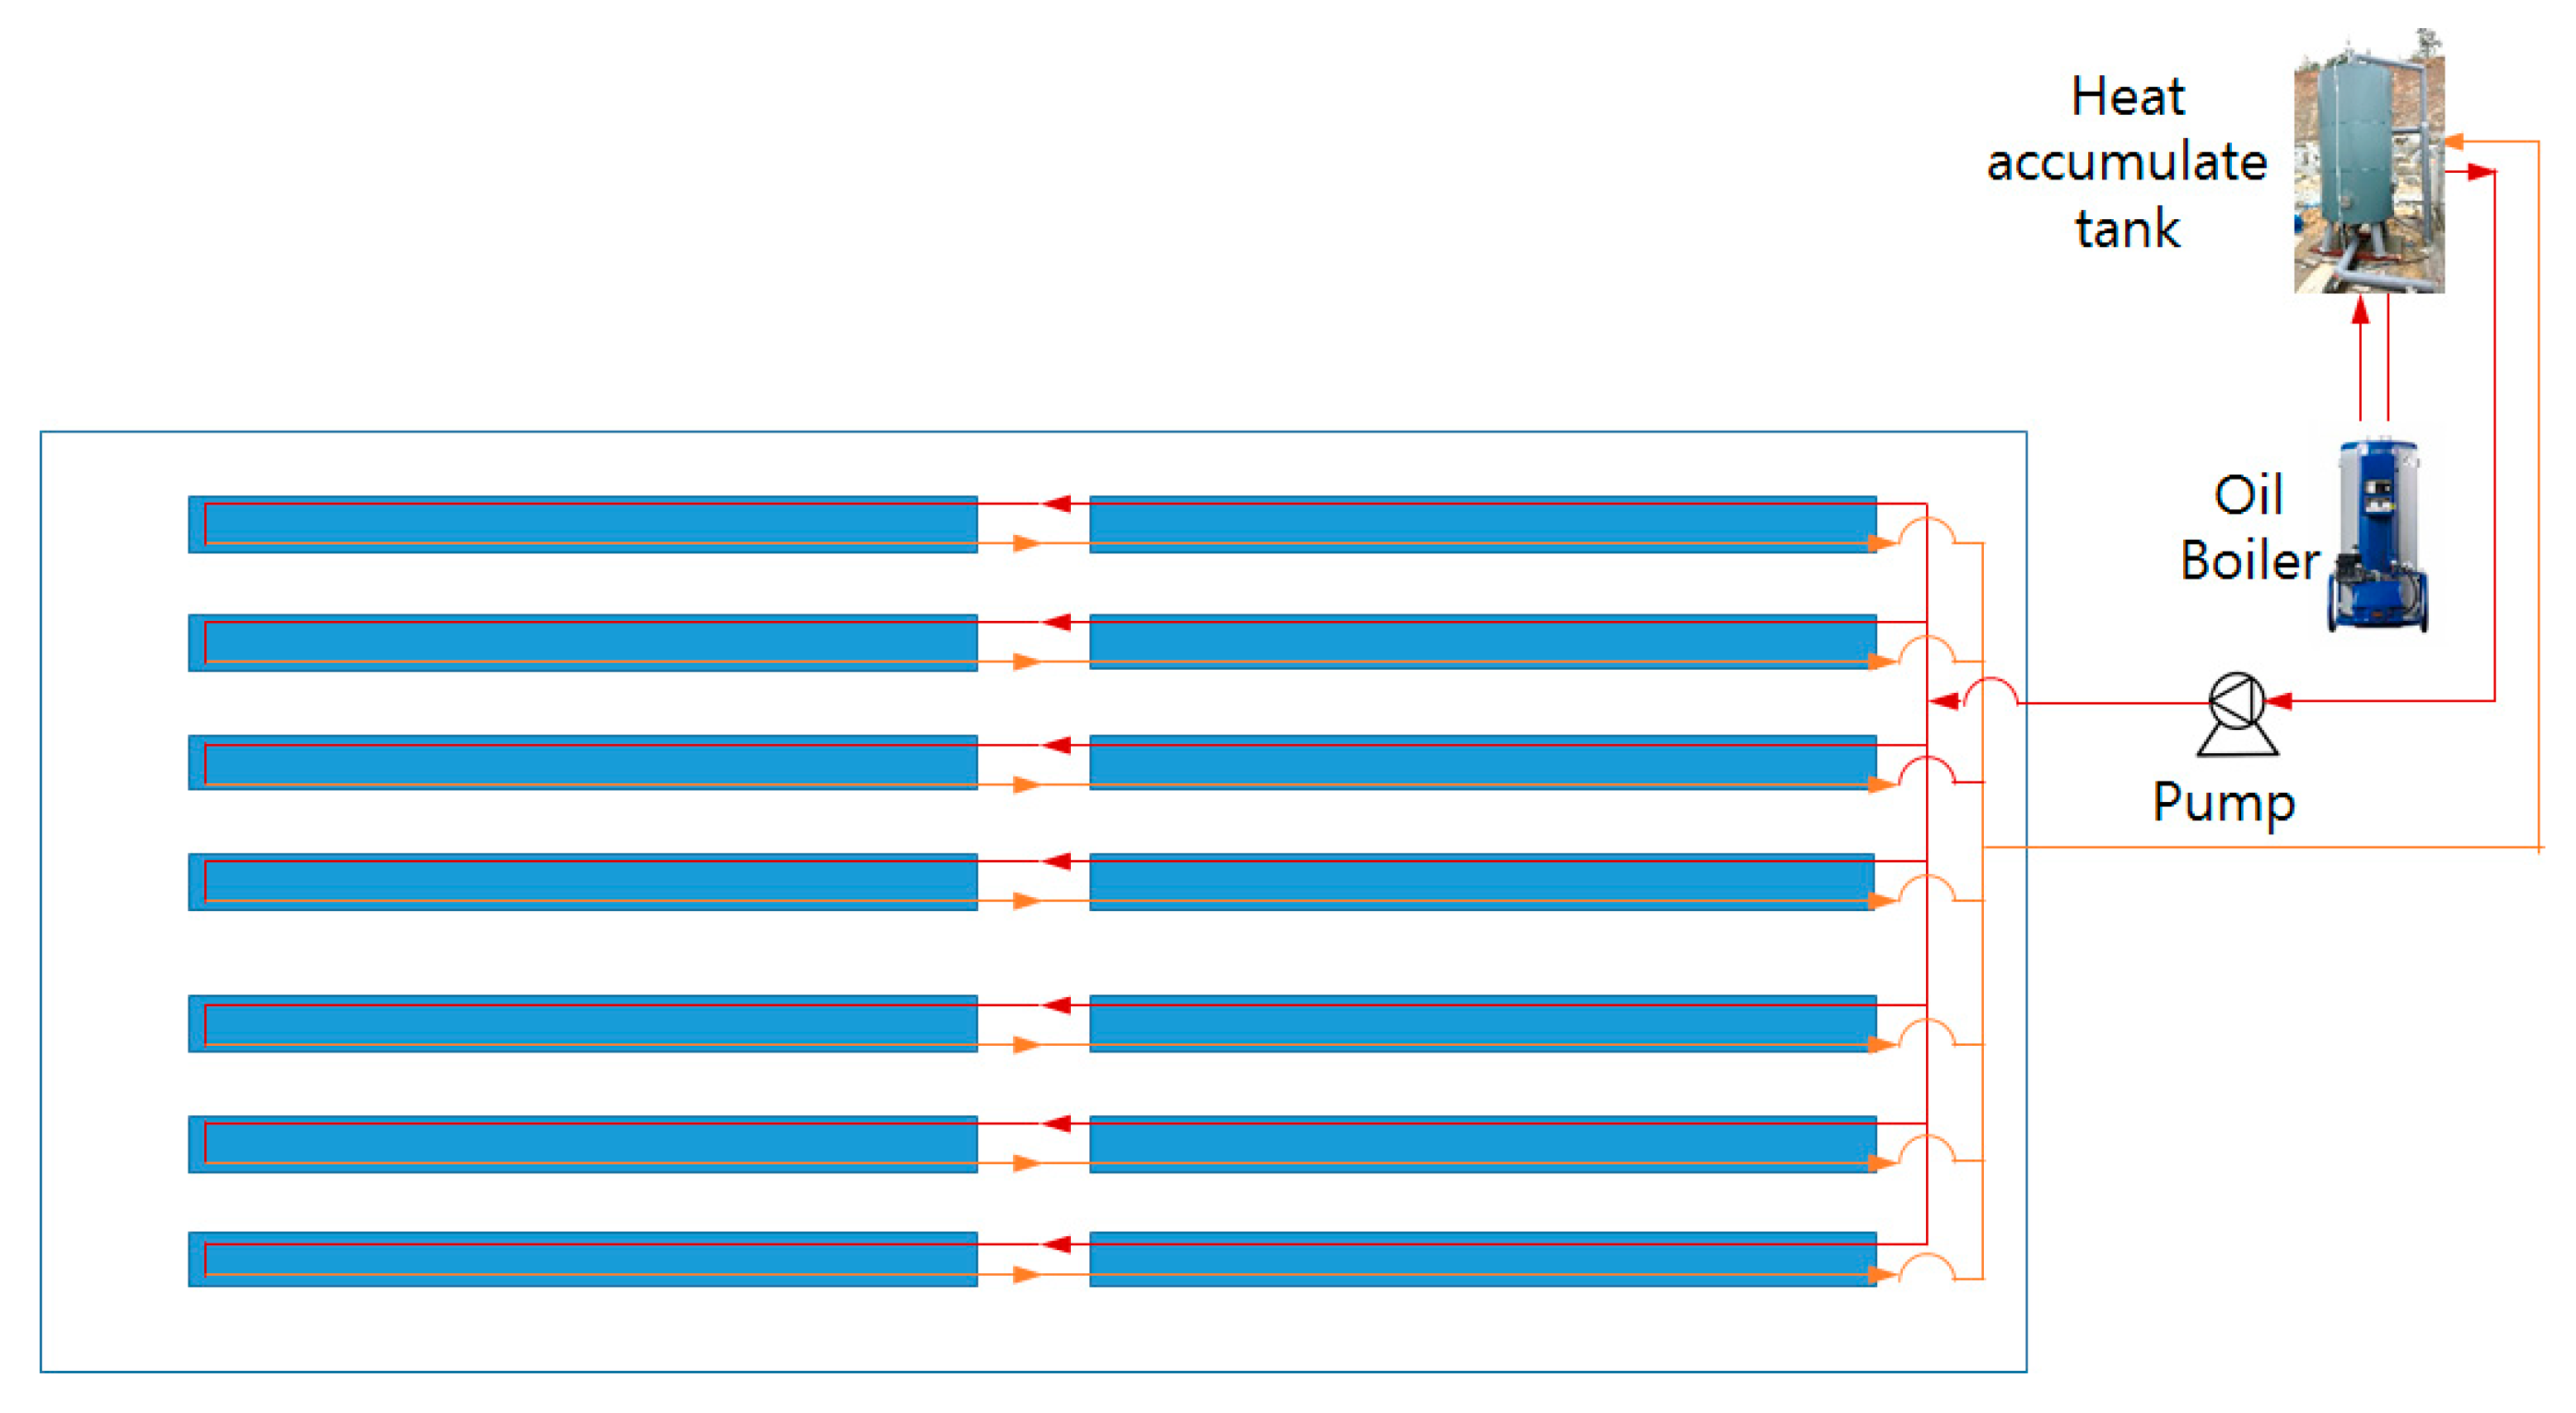
Figure 1 and Figure 2 show the view of both greenhouses and one can easily recognize the difference of scales between each test greenhouse. The greenhouse for Case 1 is located in the coastal area of the east sea with the values for longitude and latitude of 37°50′56.2″ N 128°51′10.5″ E and the annual average temperature was about 13.1 °C and the highest and lowest annual average temperature was 17.5 and 9.2 °C. The greenhouse for Case 2 is located in the central part of the Korean peninsula with the values for longitude and latitude of 36°34′19.1″ N 127°19′16.9″ E. The annual average temperature was 13 °C, but the highest and lowest one is 25.6 °C in August and –1 °C in January and the orientation is shown in Figure 1 and Figure 2, respectively. It is necessary to note that the experiment verification for the former greenhouse was performed in real cultivating operation conditions, but the latter one was done in test operating conditions. The strawberry was grown in the former greenhouse and the indoor temperature is managed to be kept more or less 10 °C on average, not less than 4~5 °C in the worst case during winter, to prevent abrupt deterioration of crop quality, not to mention of its productivity [35,36]. In the conventional heating system, a hot air-based heating system, automatic heating fan control, and the on-and-off control algorithm had been in operation based on a sensor, which is located in the center of the greenhouse. In the newly installed hot water-based heating system, the oil boiler-based heat accumulator was installed so as to supply hot water via the main pipes of the supply and return headers, for which the sub-pipe system was connected to each bed in order to enable the same inlet temperature to be supplied to each bed, as shown in Figure 3, which is definitely beneficial to enhance the degree of temperature uniformity inside the greenhouse, as compared to other possible variants of pipe systems, for which one pipe system is connected to the accumulator directly without the headers, experiencing temperature drop along the pipe as it is passes through several beds, resulting in a different overall heat flux for each bed.
The mass flow rate into each sub-pipe system, from the header, was controlled by a large pump to provide the same flow rate condition along with the same inlet temperature, denoted by the simultaneous supply method, A2 in Table 1, and settled to be controlled proportional to the temperature difference between the set point and the real-time monitored averaged temperature value of the greenhouse. Along with the variable mass flow rate control, the hot water temperature of the heat accumulator is also managed to be varied according to the outdoor temperature change. The colder the outdoor temperature, the higher the heat accumulator hot water temperature becomes.
At the design stage, of the heating pipe network inside of the greenhouse, it is important to determine the proper size of the pipe to ensure enough surface area to cover the maximum heating load (e.g., on the coldest day during winter) [37]. In this case, the size of pipe was set up as shown in Table 2, with the aid of auxiliary calculation results by the greenhouse heat load simulator, securing 60,000 Kcal/h heating capability to prevent crops from freezing during the experiment in winter. From the experiment, it was shown that the simple substitution from a hot air-based heating system to a hot water-based heating system, including the extra sub-pipe network, can lead to an outstanding enhancement of the degree of uniformity inside of the greenhouse, which will be mentioned in detail later. In addition to this control measure, an additional one, A3 in Table 1, for which each bed mass flow rate can be controlled independently by adopting a solenoid valve, open and closed, at the inlet of the auxiliary hot water supplying system in each bed. As one can conceive with ease, the thermal condition for each bed is not in the same situation, for example, the bed located near the side wall is to be exposed to more severe thermal conditions, by the infiltration of cold outdoor air and the thermal diffusion, with a higher temperature gradient, near the greenhouse skin, than the bed in center. In that sense, the same amount of hot water with the same inlet temperature for each bed, like A2 in Table 1, may not be an optimal control measure from the view point of managing the degree of uniformity close to a desired level, and more enhancement can be achieved by increasing the level of freedom for each bed in supplying heat flux. In this second control measure of hot water supply in the greenhouse, the on-and-off type of mass flow control to each bed, the execution of it is designed to be determined by the information from the multiple sensor nodes, which is also newly installed in the test greenhouse. In the experiment, the representative value for each bed, the averaged value calculated with several sensing data near the bed, is calculated in each time step of control, by several minutes. Additionally, the current level of temperature difference between the target and the representative value on each bed is referred to in order to determine whether to open or close the solenoid valve, to supply more heat or not, in each bed. This control measure, A3, with the aid of the multiple sensor nodes monitoring system has been proven to be quite effective in enhancing the degree of uniformity inside of the greenhouse against the counter measure A2.
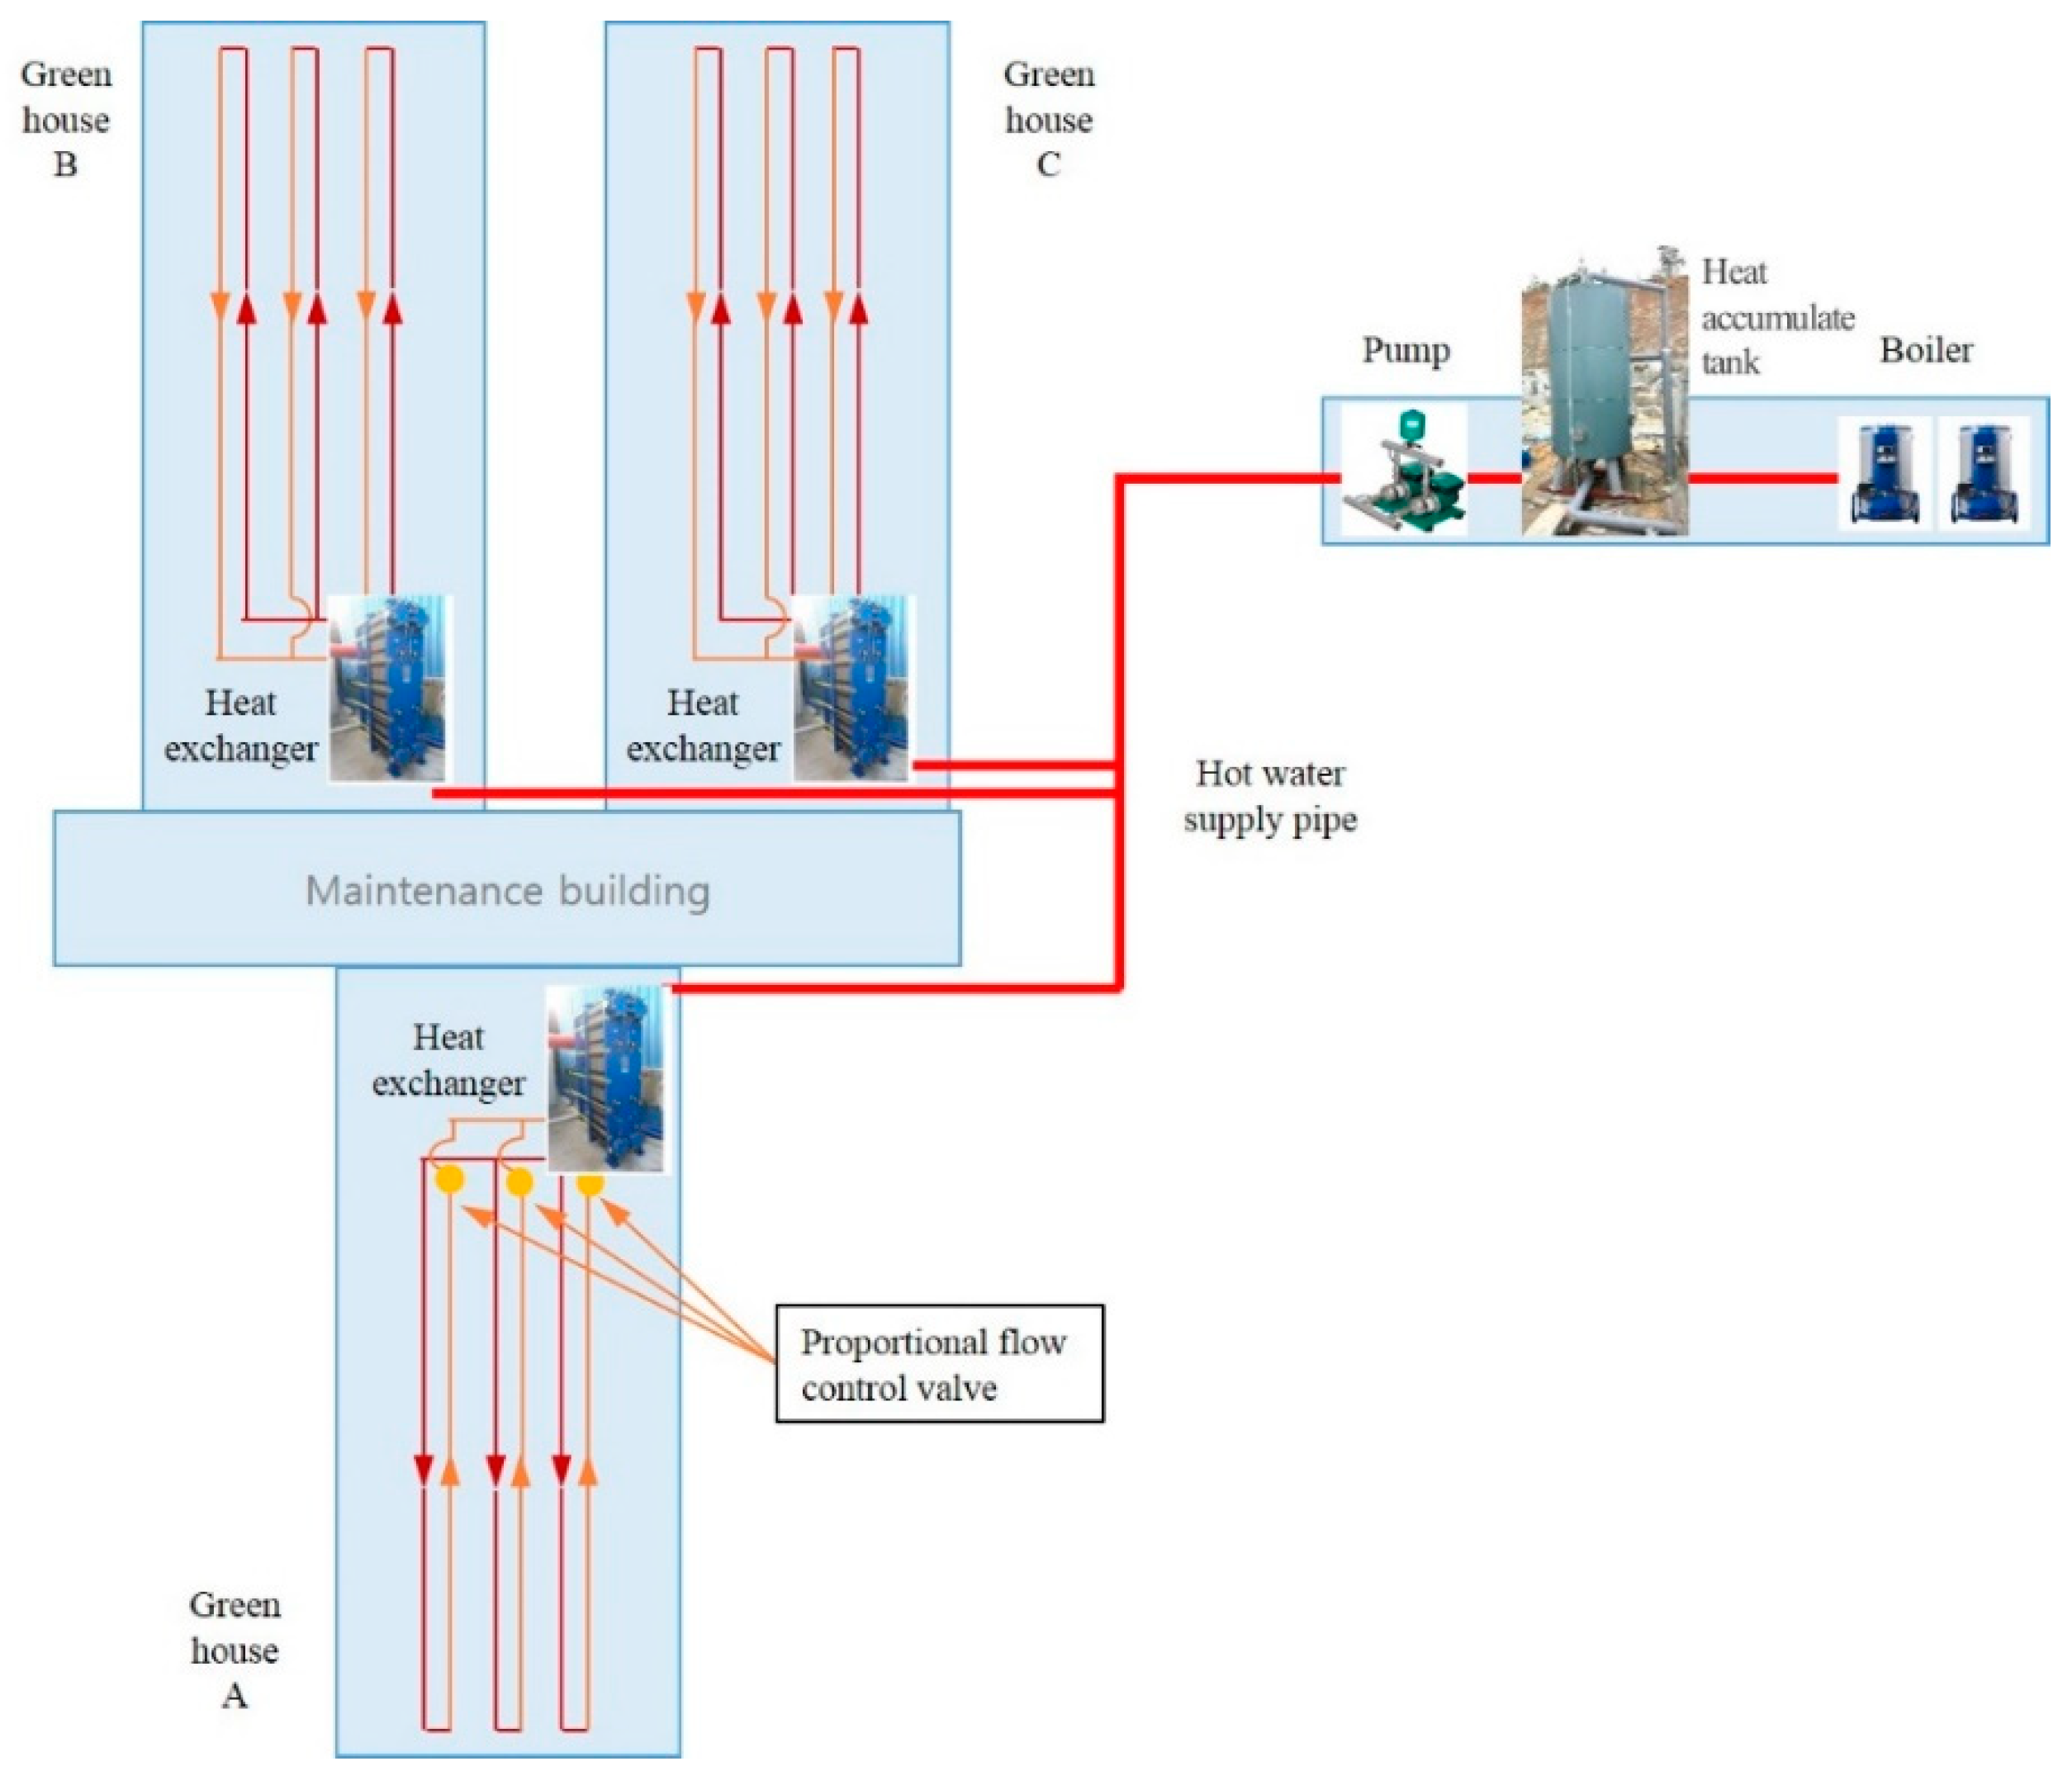
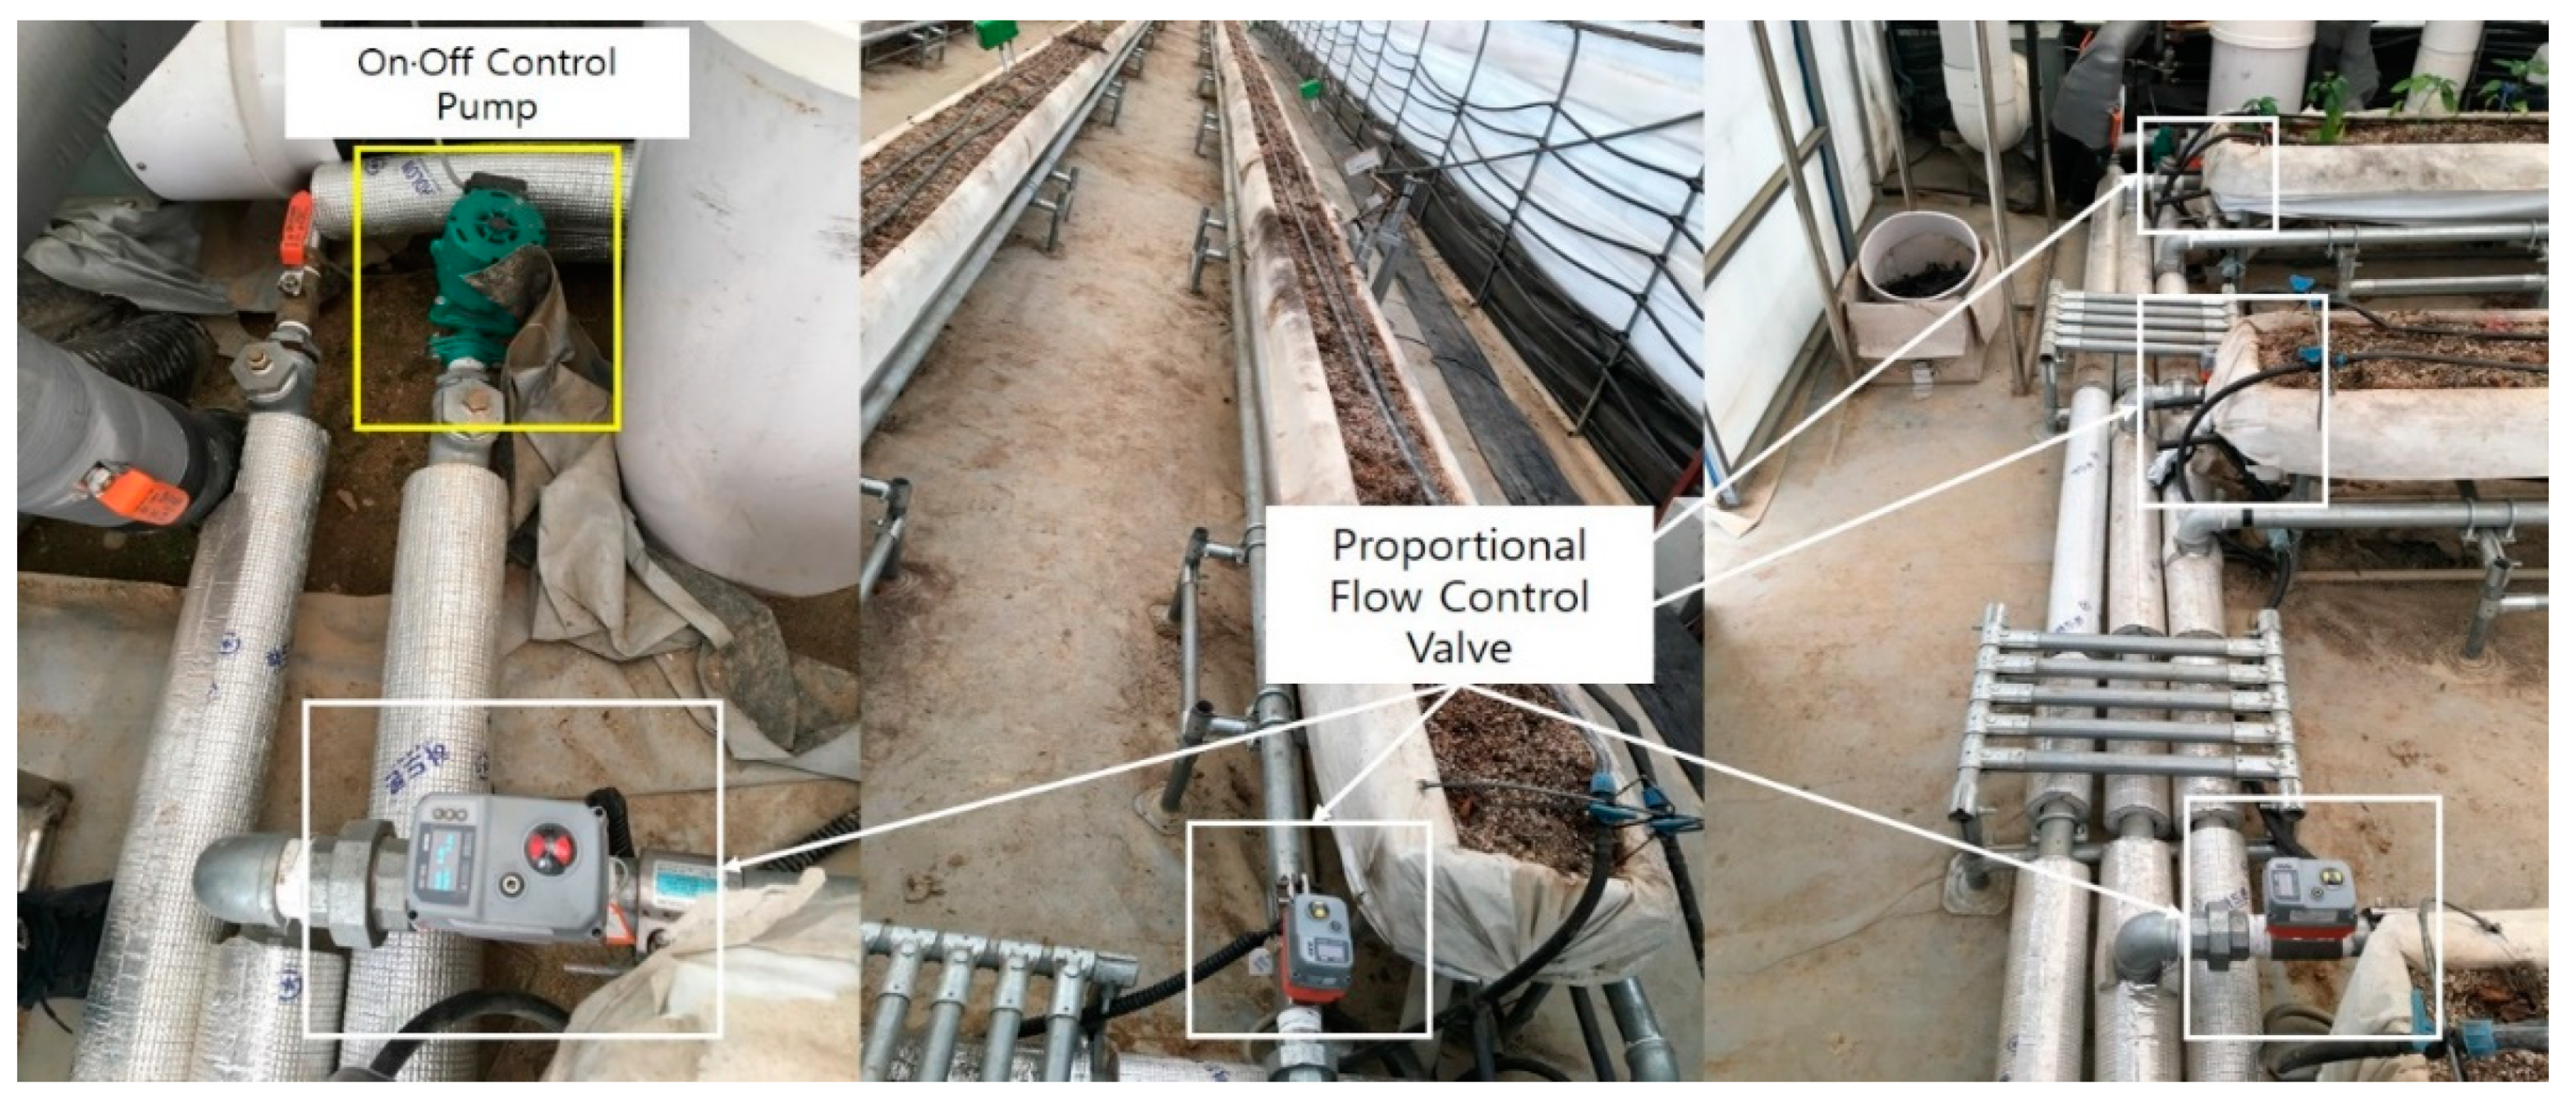
Figure 4 shows another pipe system configuration for experimental test greenhouse B in this study. It is noted that three individual greenhouses are connected via the main hot water supply and return pipe networks, for which a compact heat exchanger was installed to control the inlet temperature supplied to the hot water header for each building. The main test facility of the wireless multiple sensor nodes system and the physical control one, such as a hydraulic proportional mass flow control valve, was installed in greenhouse A, as shown in Figure 4. An additional control measure of a hydraulic proportional mass flow control valve was adopted to seek an enhanced result of control precision, and, as a consequence, the reactive time to reach to target point, not to mention of the degree of uniformity. At the inlet point of the supply sub-pipe for each bed, a hydraulic proportional mass flow control valve plays the role of controlling the rate of mass flow into each bed according to the monitored data from multiple sensor nodes. It means that the heat release in each bed can be managed independently, unlike the case of the former greenhouse, A2 and A3 in Table 1, in which the same mass flow rate is induced simultaneously for each bed, with the same inlet temperature of hot water, or independently for each bed (i.e., the mass flow variation is not applicable in A2 and A3). In real operating condition, it is observed that the bed near the side wall of the greenhouse needs more heat flux to make the local temperature of the bed the same with that of the bed in the center (i.e., securing the degree of uniformity of the thermal environment). In other words, the same amount of heat flux in each bed, as in the case of the former greenhouse experiment A2 and A3, might cause a heat imbalance again, which would hinder the degree of uniformity from being enhanced above a certain level. Along with this heat release independent control measure, with variable mass flow control for test greenhouse (Case 2 B2, B3), the on-and-off control measure was tested too in test greenhouse B, B1, in order to make an assessment on the effects of greenhouse scale on the adopted control measures, and it will be described in detail in the following. In the case of B2, it had linear logic for opening heat supply control valve. Logic will control the valve opening by a value between 4 and 20 mA with a gradient of 4. The temperature is adjusted with a deviation of ±2 °C from the set temperature. B3 has the same control logic as B2, but B3 calculated the valve opening value with current temperature measured data and the previous one. This averaging logic control of the values was a role for the valve in order to prevent sudden changes. The specification of installed pump and proportional valve is given in Table 3.
2.2. Specification for the Monitoring System of Multiple Sensor Nodes
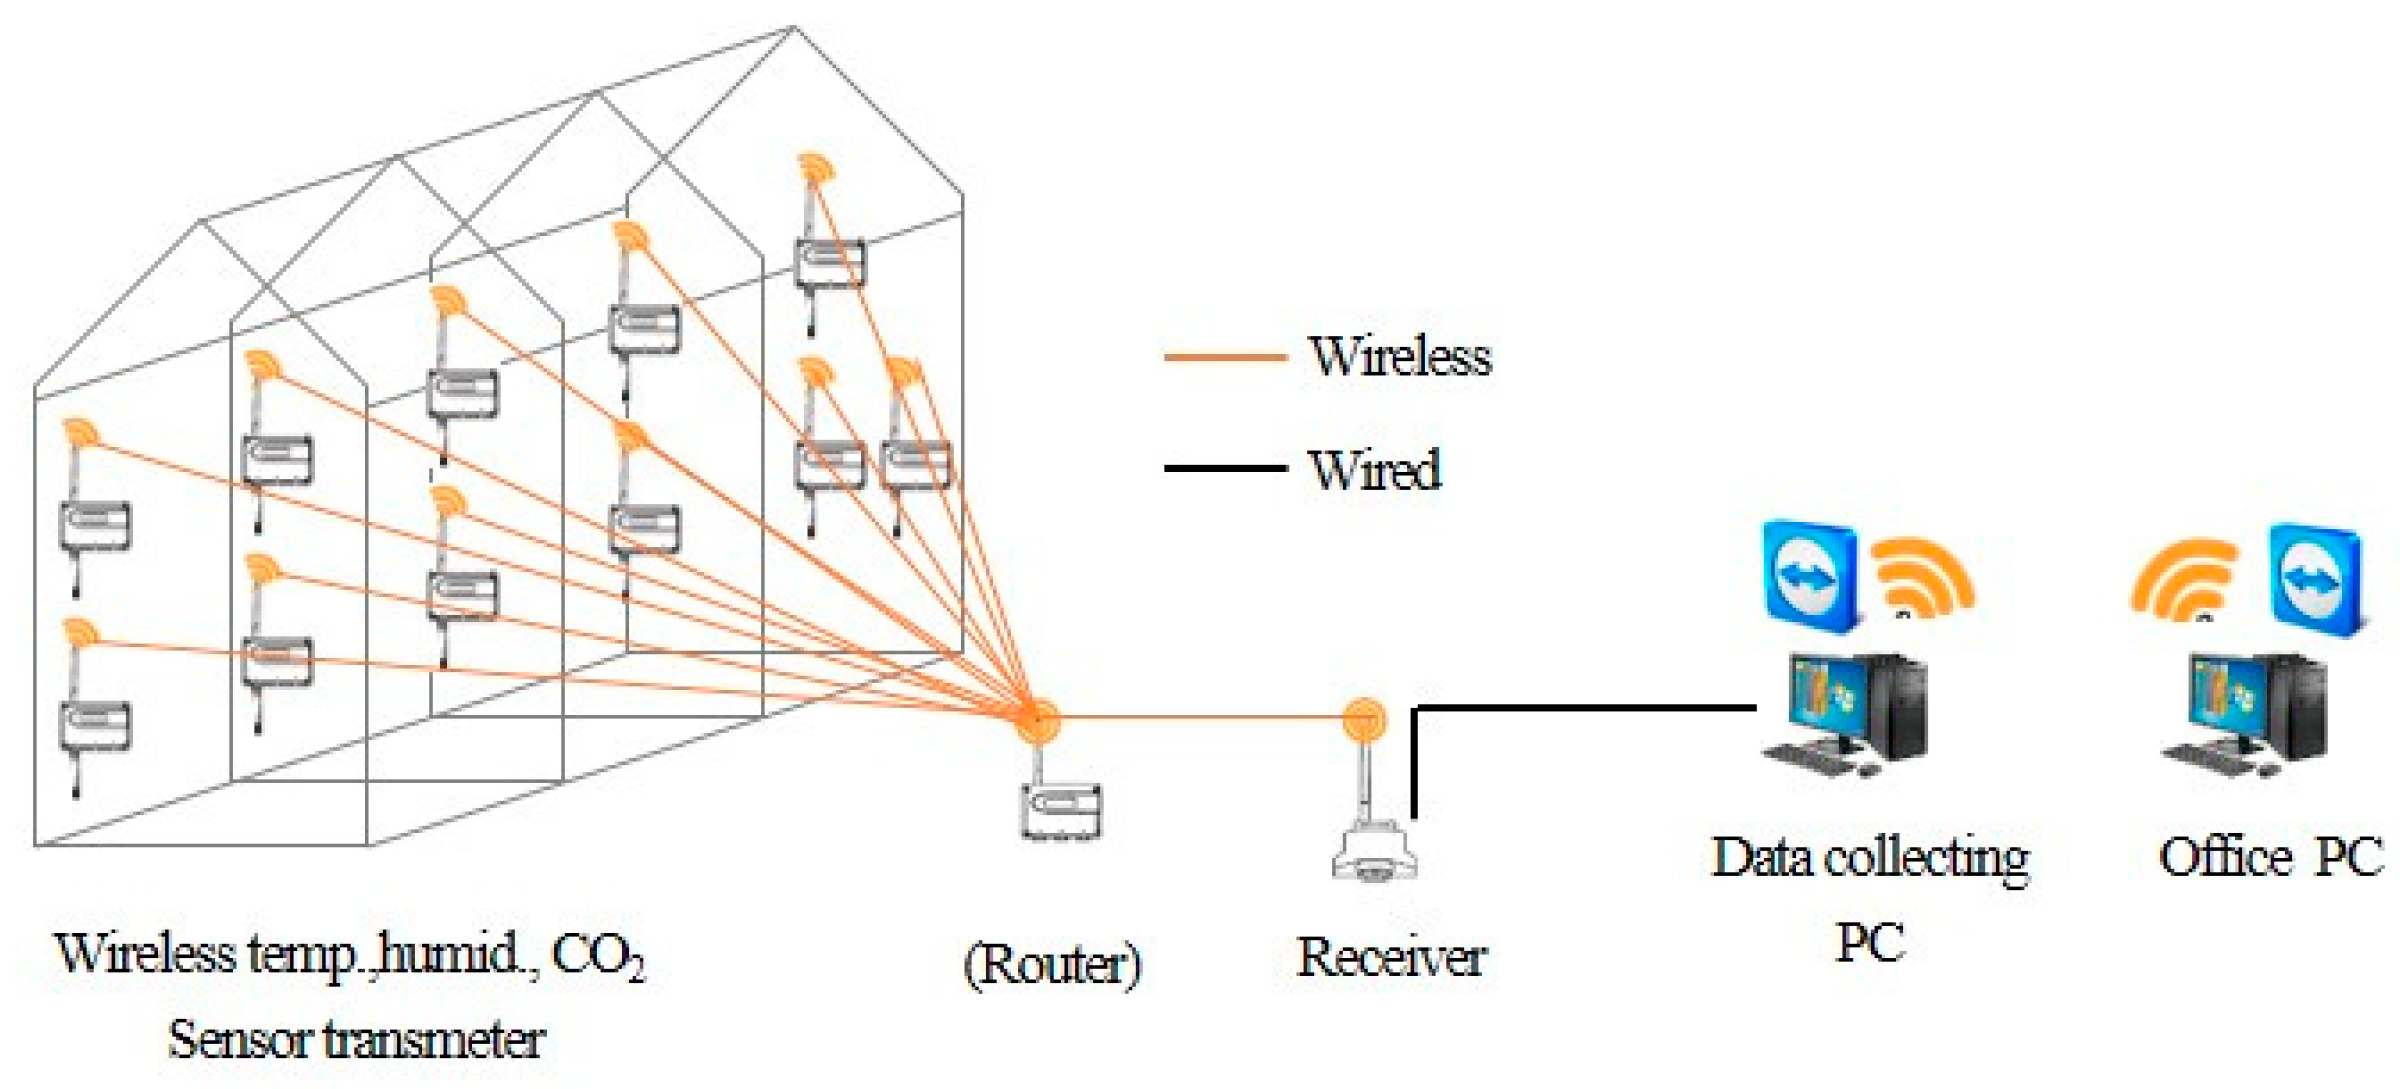
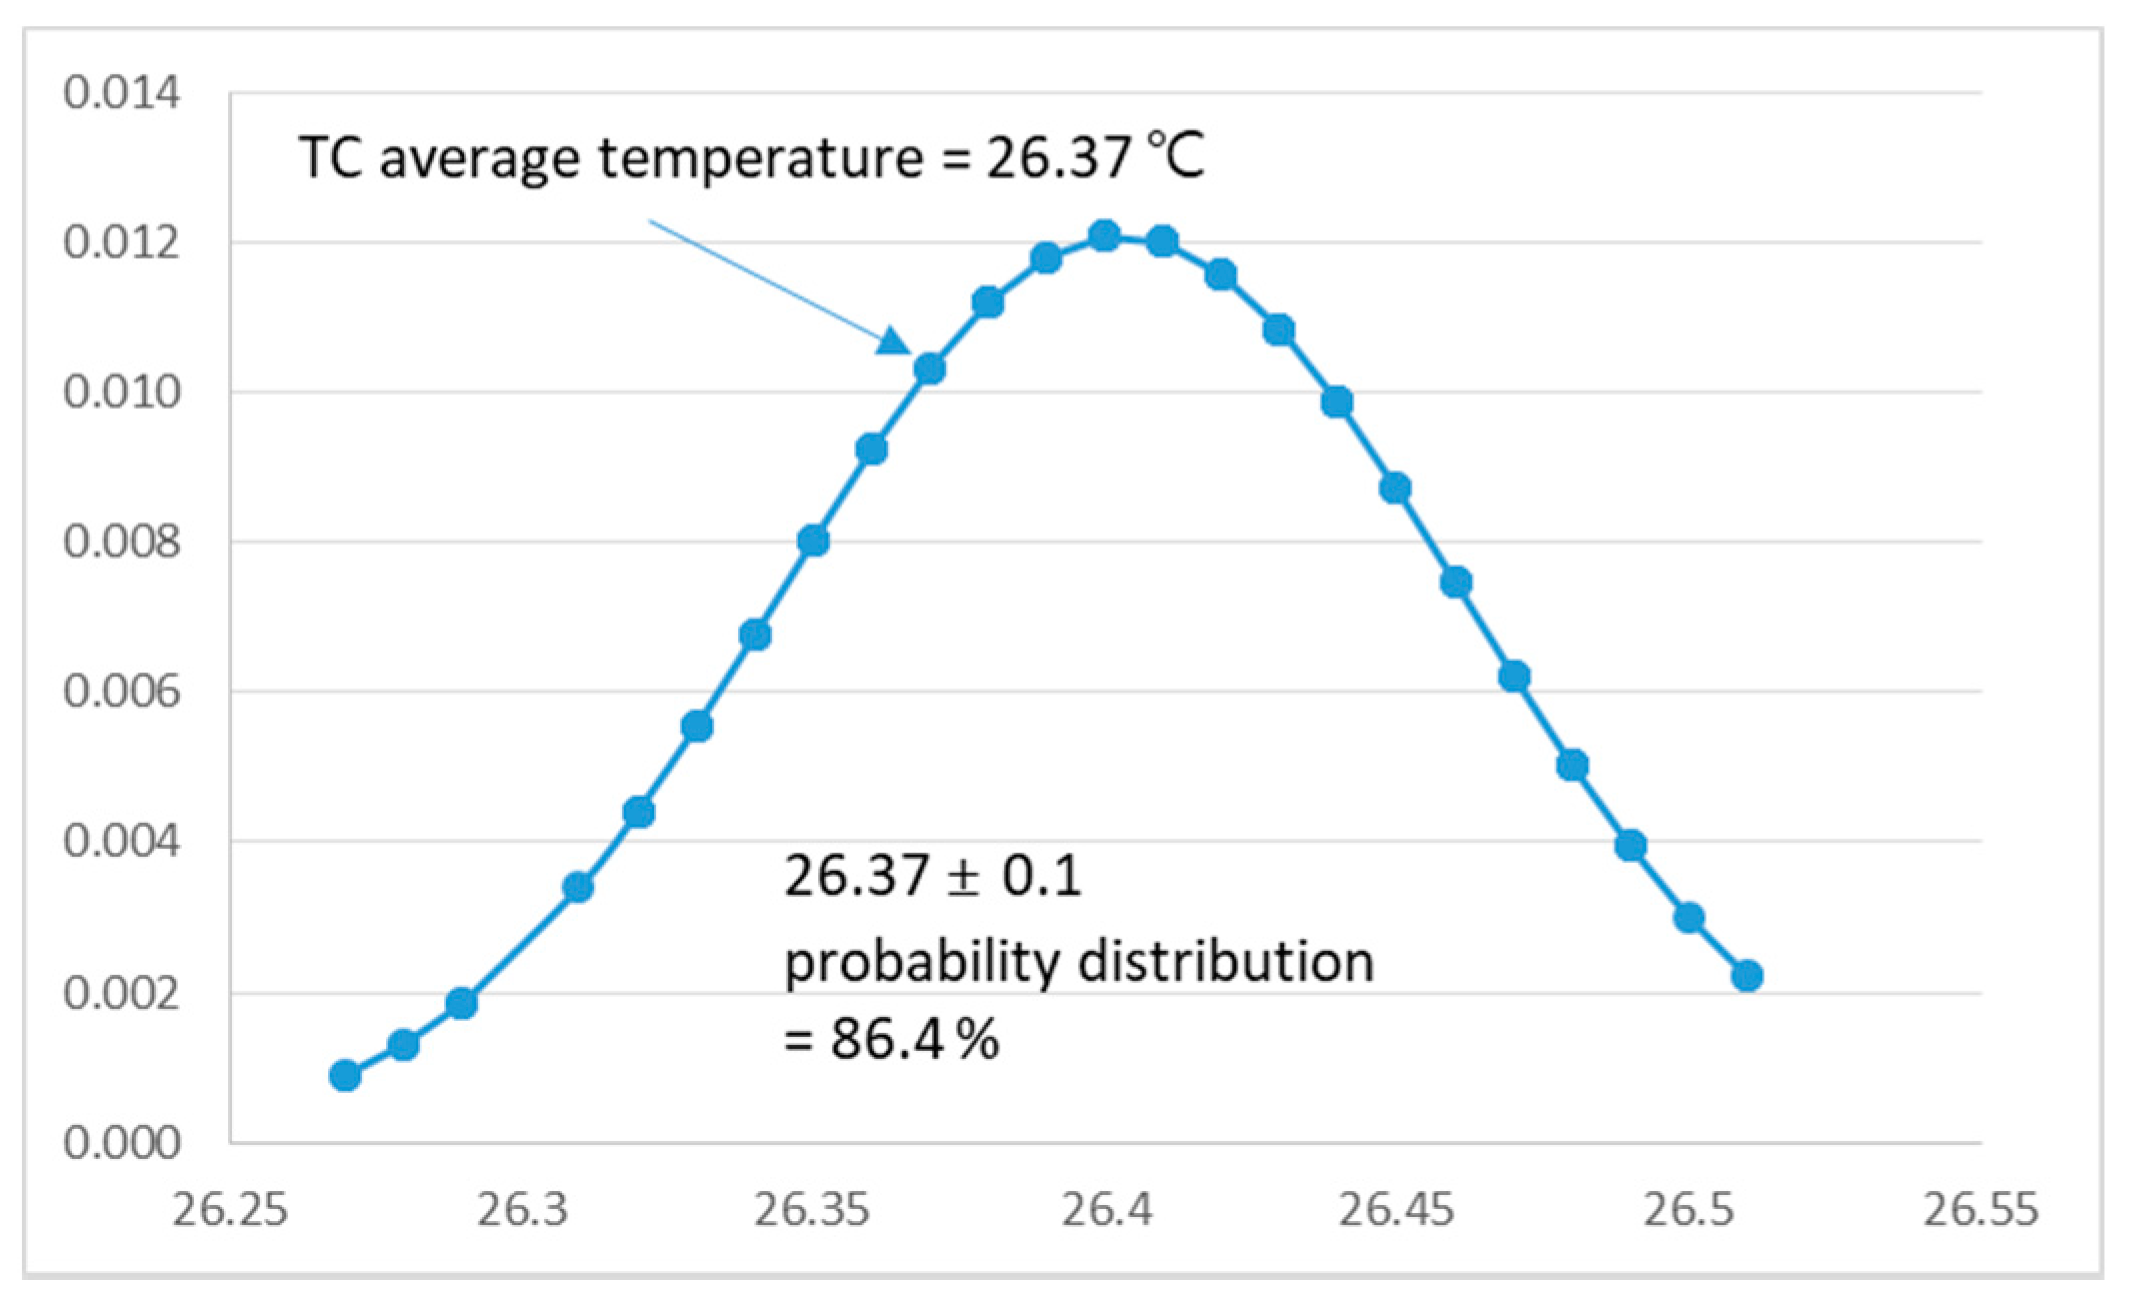
Unlike the conventional multi-variable control of the greenhouse environment system, for which the operating condition monitoring for the large volume of a greenhouse tends to be covered by a sensor node, a multiple sensor nodes system is introduced in this study to overcome the drawback of the current cost optimized system, in order to seek for a precise monitoring system [38] in which the operating environment inside a greenhouse can be monitored more accurately, resulting in more precise environment control measures becoming applicable, as introduced in this study. The conceptual diagram for the multi-sensor nodes system adopted in this study is shown in Figure 5. From the view point of precise thermal environment control, with which one can expect a significant enhancement crop productivity and quality, a precise data monitoring system with multiple nodes, a sort of volumetric data, could be said to be a prerequisite for accomplishing it. Although the additional cost for installing a multiple sensor nodes system, instead of the previous cheap and simple monitoring system, might cause an economic matter in terms of a proper pay-back period, the expected ripple effects of primary energy saving, productivity increase, and quality enhancement, etc., by introducing precise control measures supported by the volumetric data for thermal variables, is worth considering properly. As shown in Figure 5, the sensor module can measure relative humidity with ±2% Relative humidity (RH) accuracy, temperature range from −40 °C to 80 °C with ±0.1 °C accuracy and CO2 range from 400 to 2000 ppm with ±50 ppm accuracy [39]. To ensure reliability, five random sensors were placed in a box and temperature data were measured during every minute of a half hour. As shown in Figure 6, more than 86% of data is distributed in the 0.1 °C range from the average temperature. The precision of the sensor can be regarded as being reliable enough for temperature measurement in the greenhouse. As for the error analysis for the measurement data, it is assumed that the measurement data is within the precision of the sensor provided by the manufacturer, and the data with abnormal behavior was excluded in the analysis process.
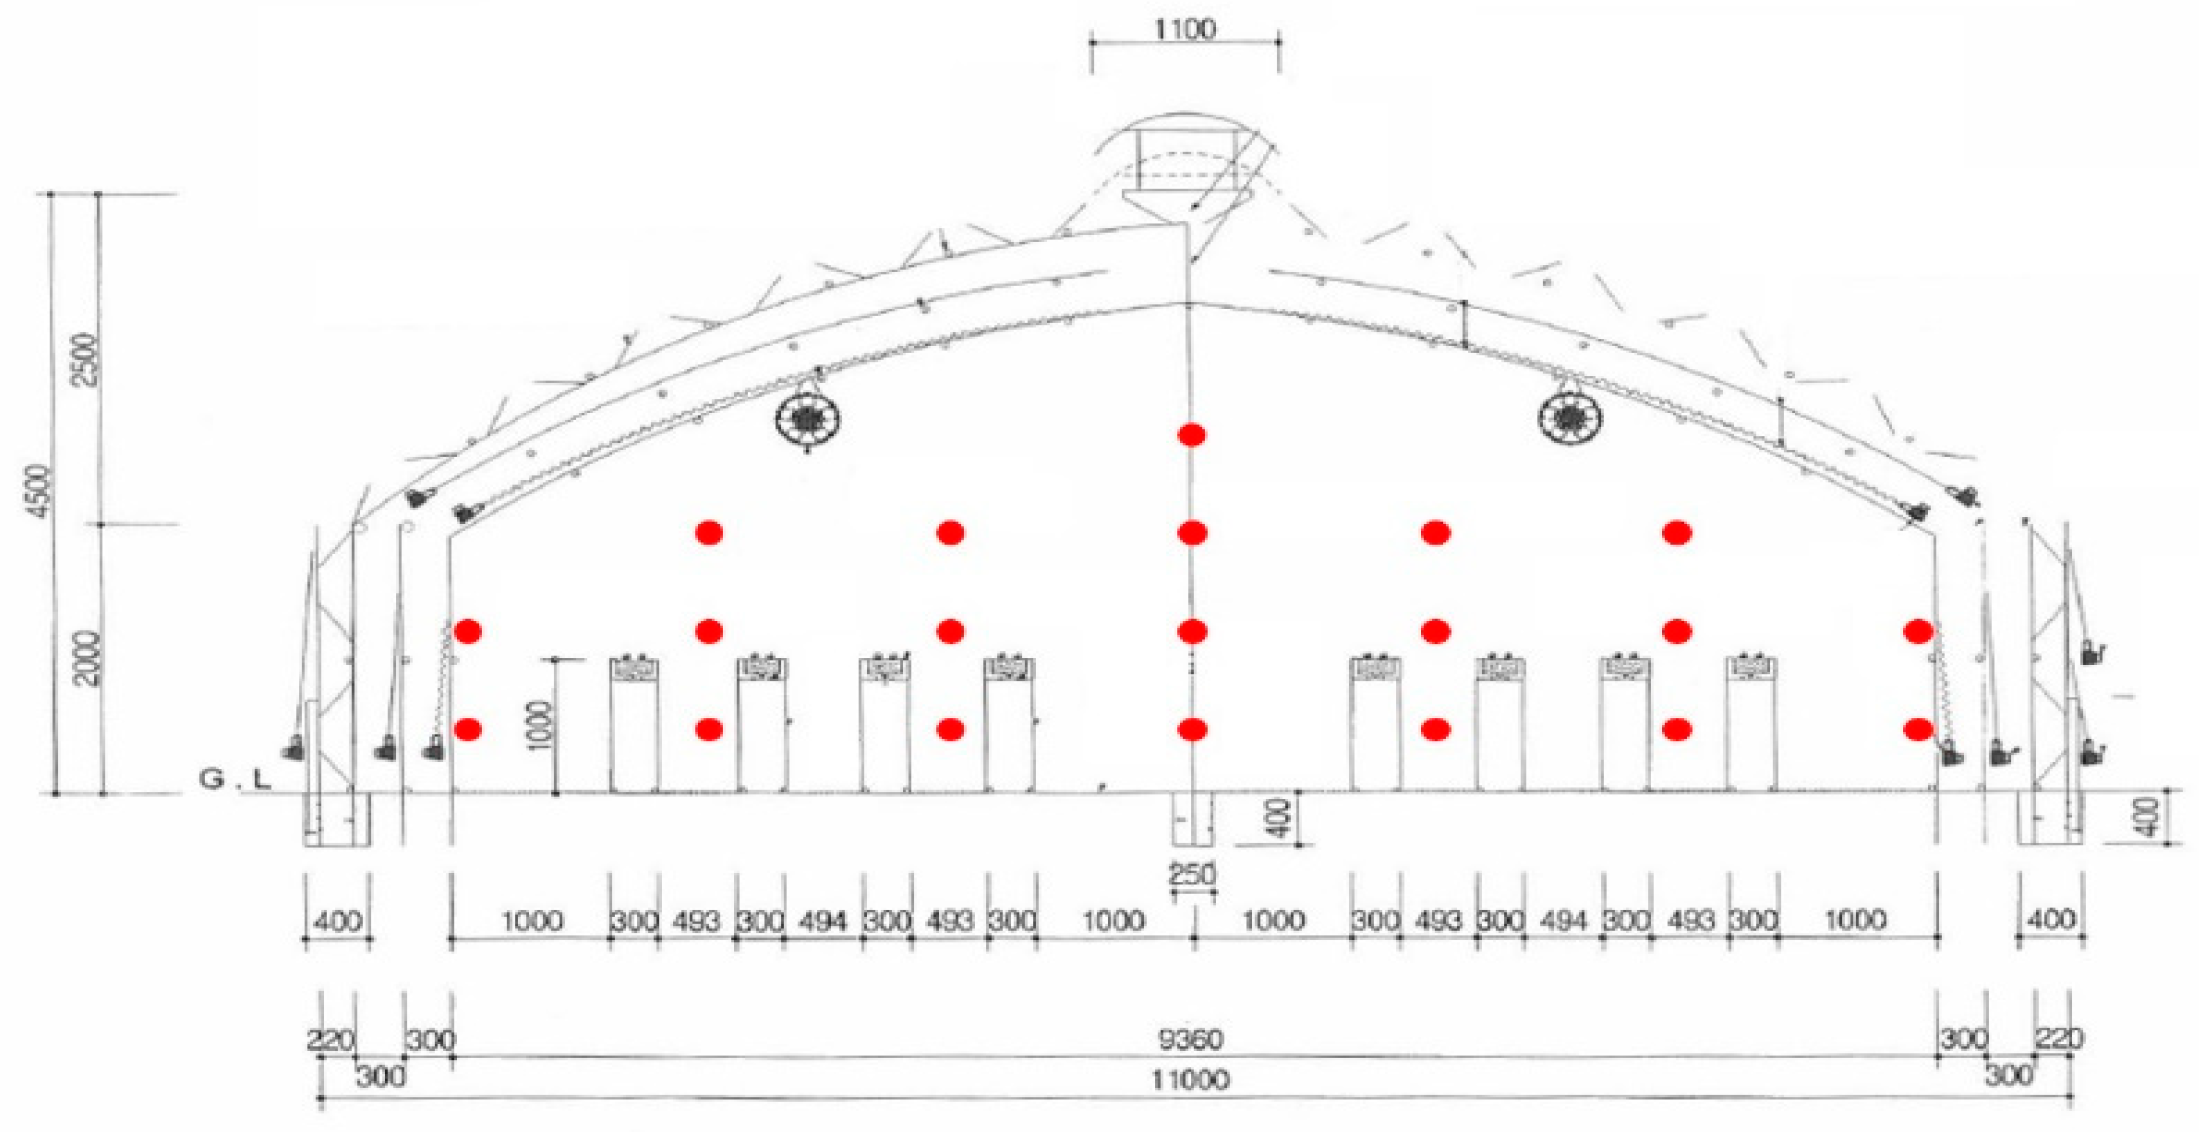
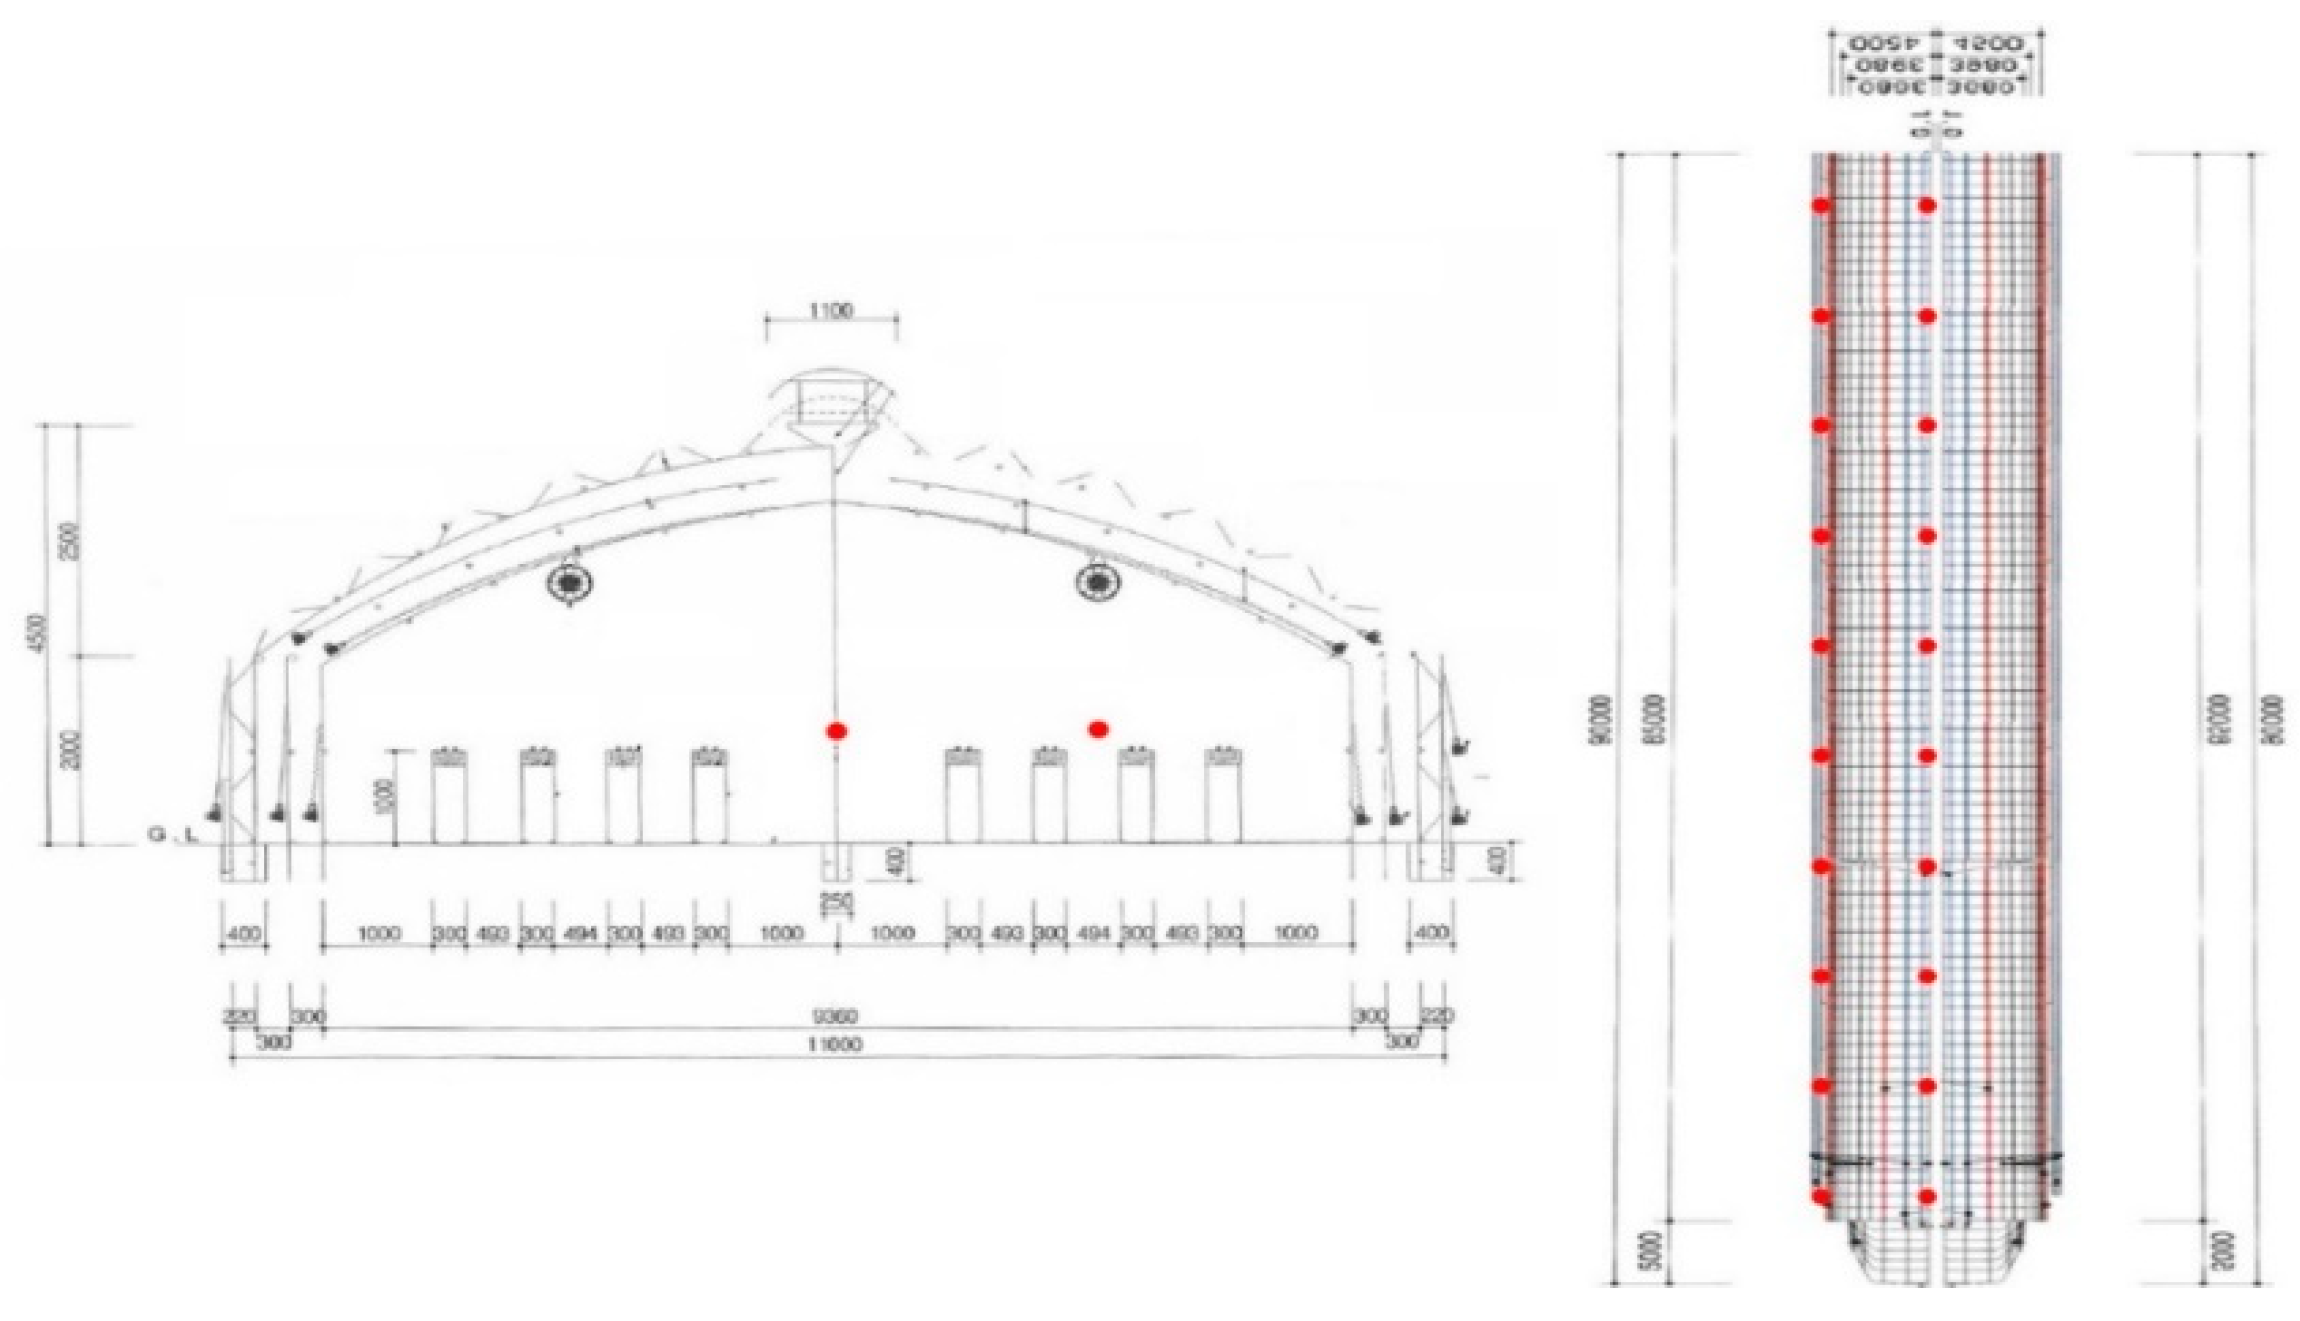
A total of twenty sensor modules were installed for the experiment and the arrangement of the sensor nodes inside of the test greenhouse were reshuffled and adapted for the experiment purpose. For example, as shown in Figure 7 and Figure 8, the sensor modules are arranged to cover the one sectional area of the greenhouse to monitor the variation of the thermal variables in real-time, which was applied in the experiment of test greenhouse A, or they are re-arranged in the longitudinal direction to investigate the variation in that direction, for test greenhouse B. In case of a test greenhouse A, the whole control volume of the test building, about 2000 m3, is covered by a sensor node in the center under the assumption that the thermal variables were in uniform condition or had a minor deviation from the value of monitored data.
However, with the multiple sensor nodes system, it can be reduced up to 100 m3, a twentieth of its original volume so as to substantially improve the level of preciseness for the control. Besides, the multi-points information from the sensor nodes enables the newly proposed control measures or algorithms to be realized successfully. Another benefit with the introduction of multiple sensor nodes system, as in this study, is the reduced risk of malfunction of the thermal control system with the error value from a sensor node, due to the breakdown of the sensor itself, or of data missing during the communications, which is supposed to give rise to substantial damage in crop growth. More detailed description of the monitoring or sensor system in terms of telecommunication aspects is omitted here for the sake of simplicity. The time frequency for measuring the data can be adjusted according to the situation, by seconds, or by minutes, but in this study the measured data were collected every 10 min, as it was noticed that the thermal environments did not seriously vary within the scale of several minutes.
3. Results and Discussion
3.1. Comparison of Thermal Environment by Heat Supplying Systems (Hot Air vs. Hot Water)
As for the thermal environment control, the representative independent variable for the greenhouse was definitely the inner temperature, since the relative humidity was also a function of the temperature. The qualitative behavior of the temperature and the humidity according to the heat supply systems could be hypothesized to be similar, although the behavior of the humidity according to the thermal condition variation inside of the greenhouse did not exactly match with that of temperature, due to several aspects that should be considered further, such as different diffusivity, the effect of plant respiration, etc. The effects of heat supply systems on other main variables, such as humidity or gas concentrations, will be analyzed in a follow-up study later, thus the present analysis focused on the temperature distribution and variation primarily.
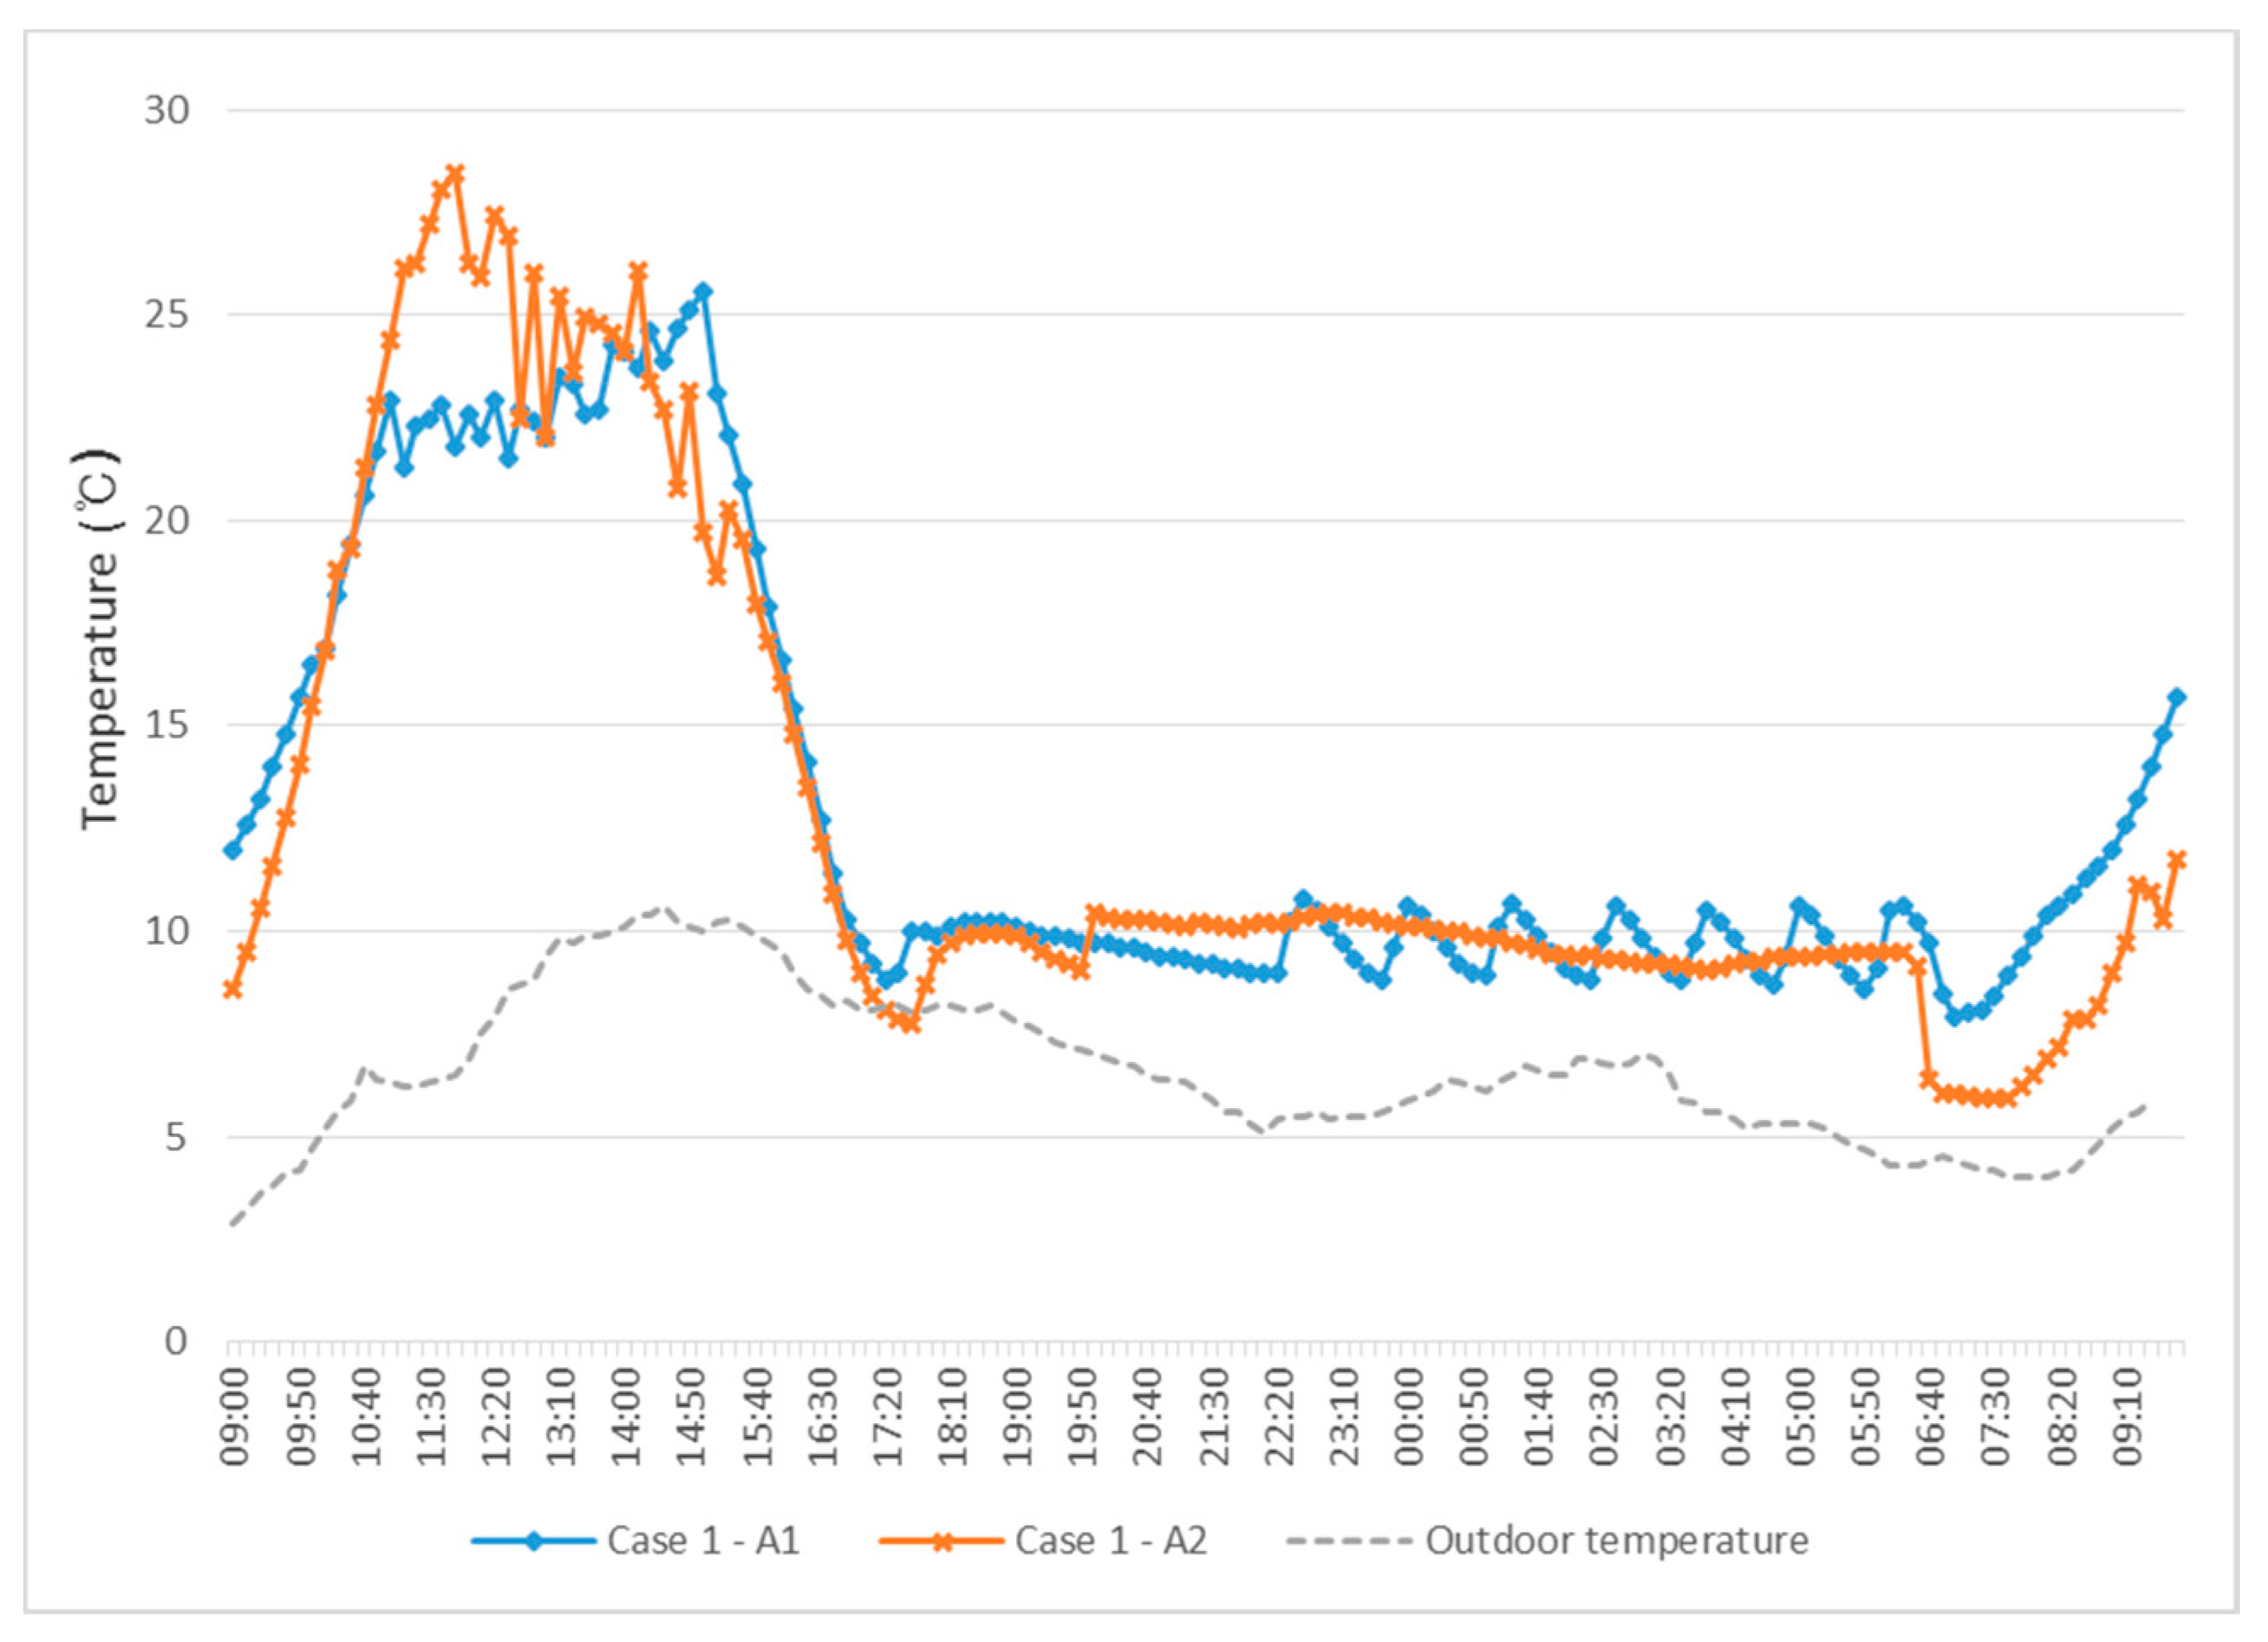
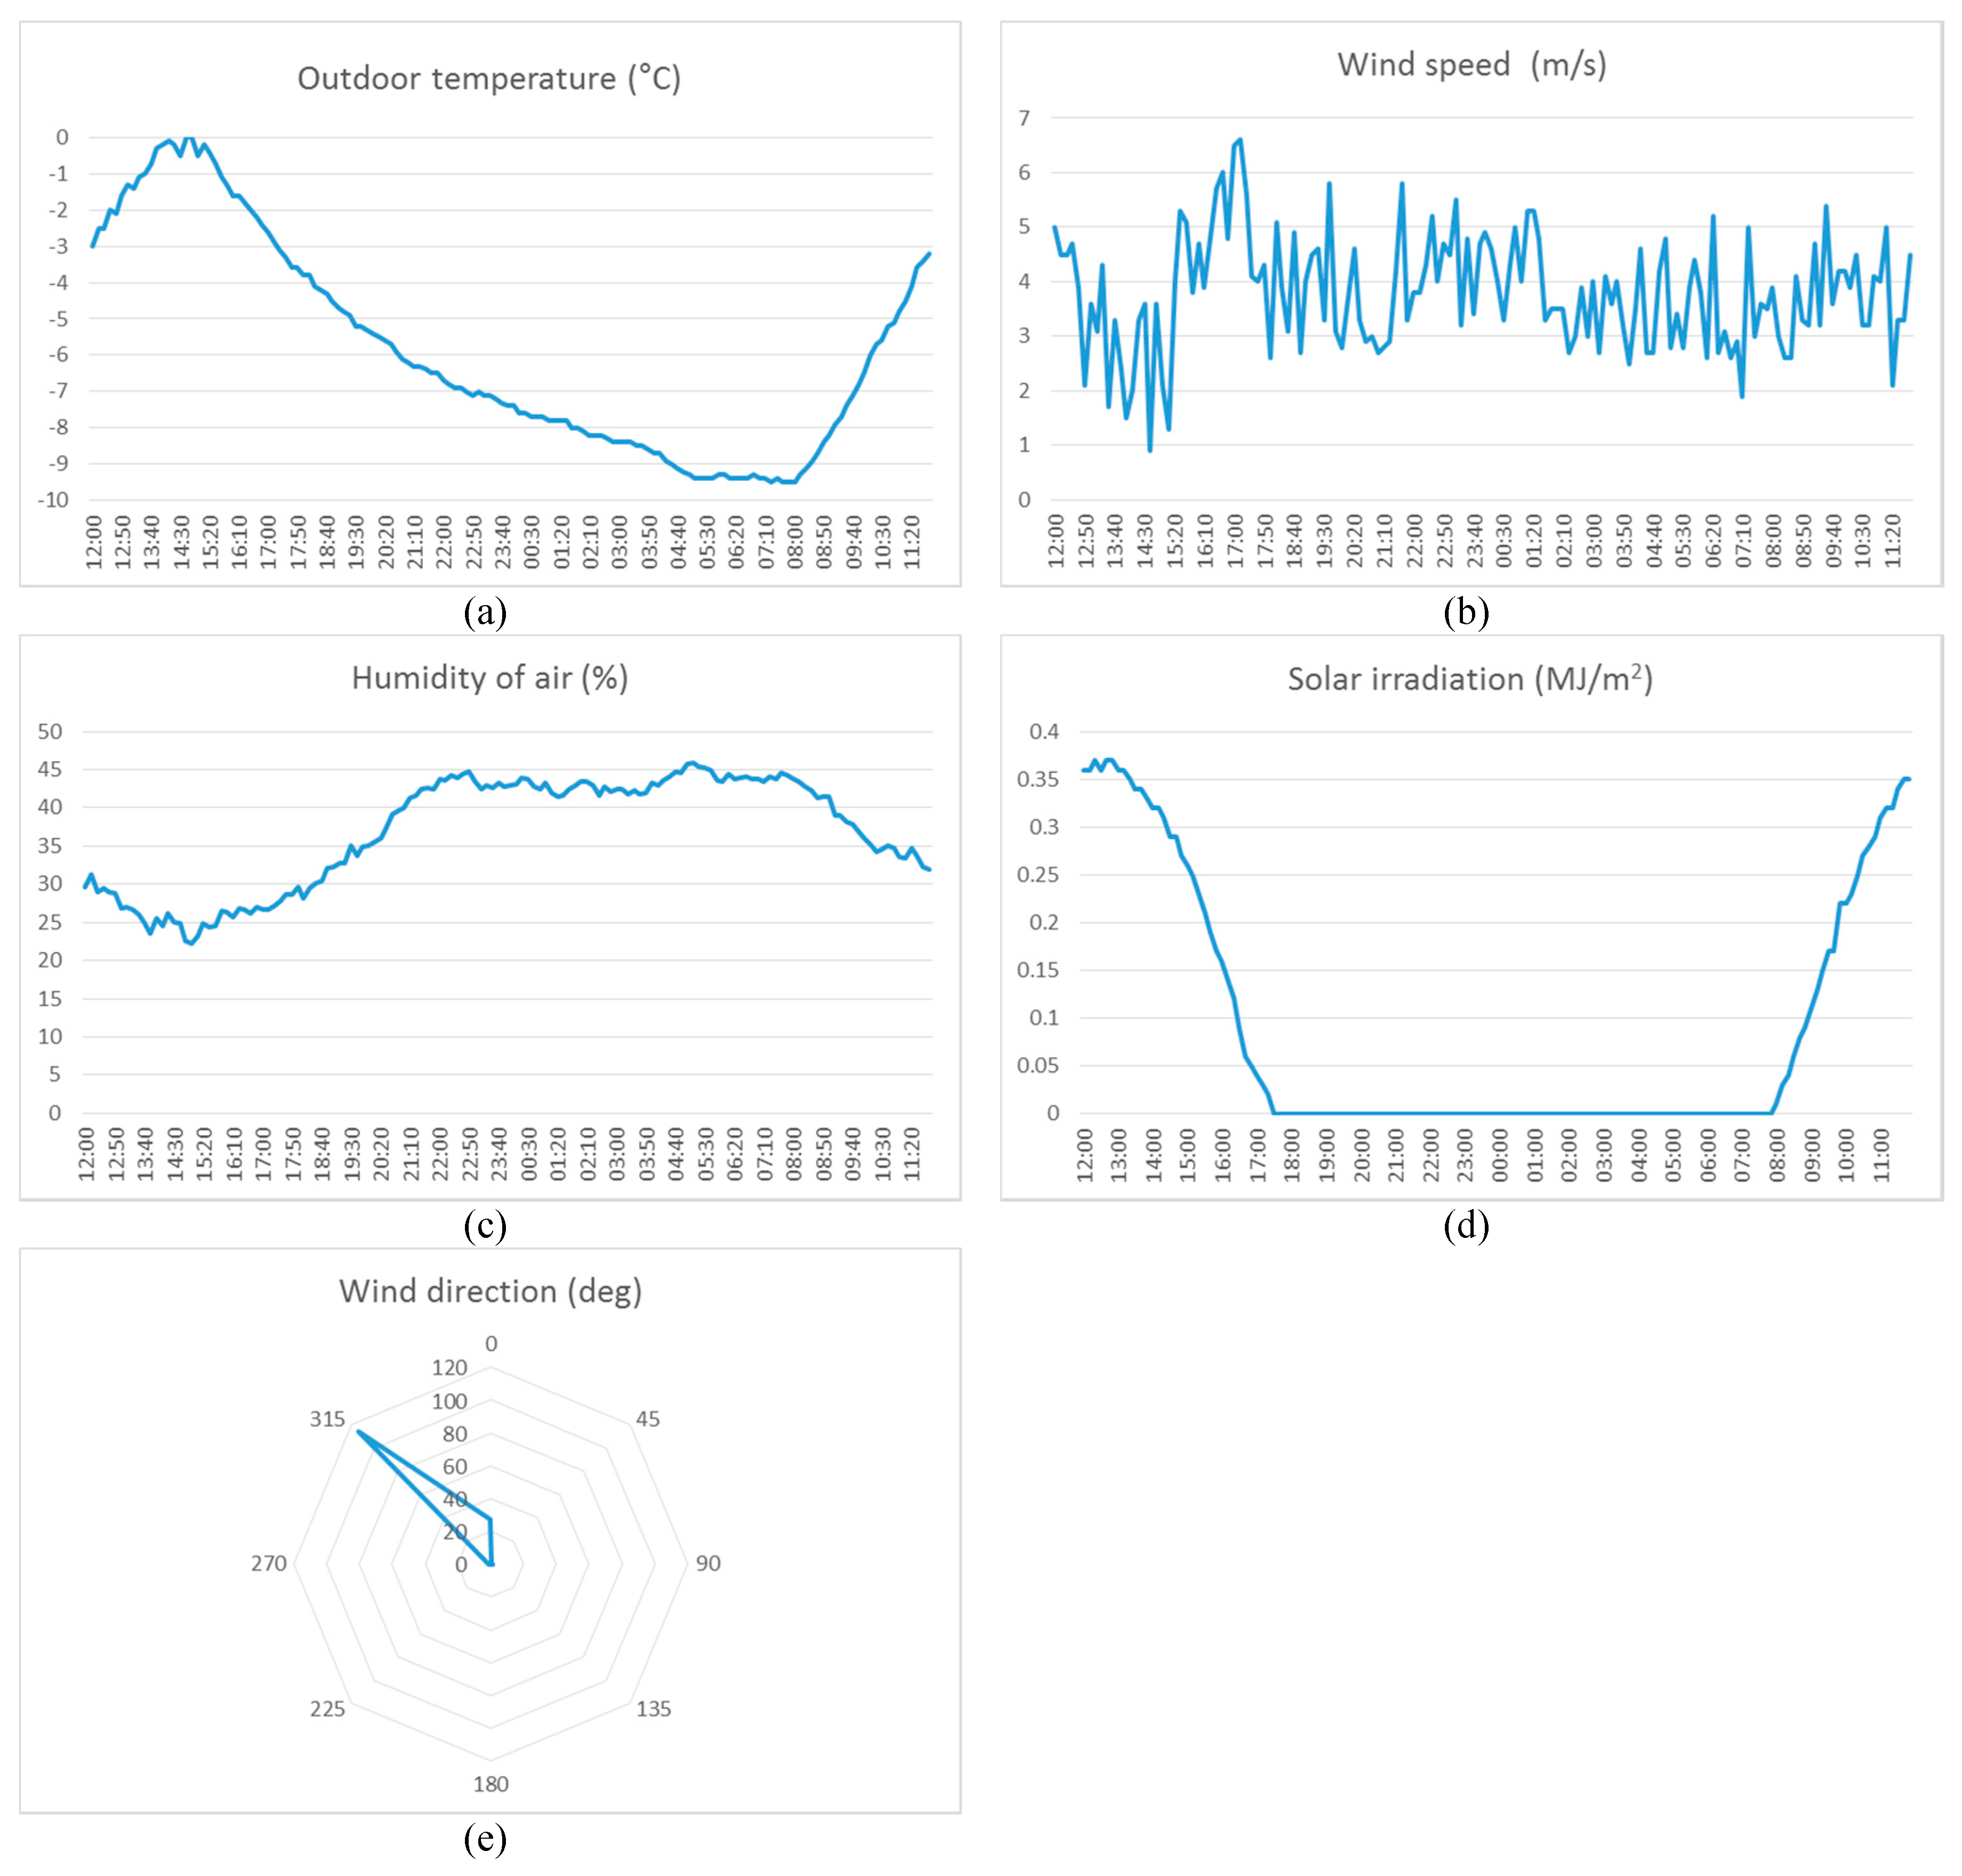
Figure 9 shows the comparison of the profiles of the temperature with different heat supply systems (i.e., hot air and hot water) in test greenhouse A. One can observe that quite different thermal behaviors were created by the different heat supply systems during the night and the dawn, in that a more comfortable thermal condition was provided by the hot water supply system, in contrast to the hot air one, for which frequent oscillating patterns during the period appeared, and the temperature difference was approximately 3~4 °C. It was evident that a large variation or disturbance of the thermal variable can exert a bad influence on crop growth, which could eventually lead to a productivity decrease and potentially lower the quality of the crop. The data for a hot air system was monitored for another building of test greenhouse A, for which a sensor node was implemented in the center of the greenhouse as usual. On the contrary, the data for a hot water-based heating system was monitored from multiple sensor nodes, 20 sensor nodes in this case, and the data in Figure 9 denote the average value of those data from multiple sensor nodes. For Case 1, experimentation was carried out on the same day, and the average ambient air temperature was −5.8 °C, the highest and lowest temperature was −9.5 and 0 °C, respectively. Average wind speed was 3.8 m/s. Average humidity of air was 36.9%, as shown in Figure 10. The raw data of hot air- and hot water-based heating supply are shown in Figure 11. For the case of hot air, the temperature changed drastically compared to the hot water system, since the hot air blower frequently repeats the on-and-off operation. On the other hand, with the hot water system, the fluctuation of it was not distinctively observed. However, the maximum temperature gap between the data for different sensing positions was nearly 5 °C, which means that there is still room for improvement in terms of the degree of uniformity by adopting additional measures, such as a varying local heat flux for each bed.
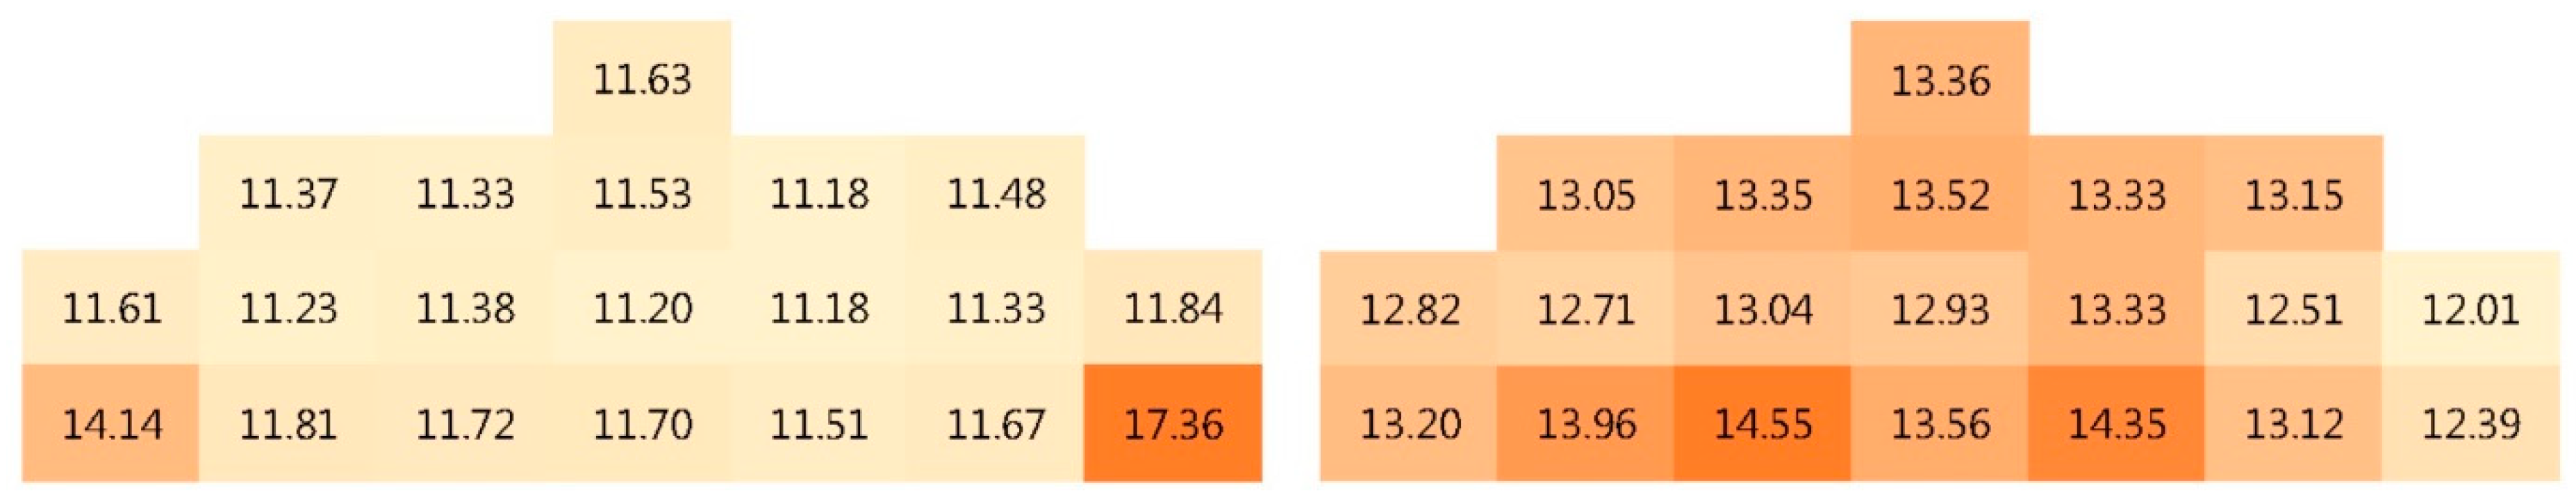
In Figure 12, the temperature distribution on a specific plane of the greenhouses, in the center position of the building, by the heat supplying systems is compared for the assessment of the degree of uniformity. In the case of the conventional monitoring system with a sensor node in the center, it is shown that the representative temperature of 11.2 °C and the maximum temperature difference in the plane, with the lower right corner one of 17.4 °C and left corner one of 14.1 °C, is about 6 and 3 °C, respectively. In contrast, the multi sensor node-based average temperature in the hot water system is about 13.2 °C and the maximum temperature difference is estimated to be less than 1.33 °C at the lower center of the plane, coinciding with the position of the heat source, and the heating pipe under a bed. This certainly does have a variety of implications on greenhouse thermal condition management for providing a more favorable environment that seeks a high productivity and quality of the crop. Firstly, from the view point of securing a uniform crop quality, to enable increased profit on the market, the large difference of thermal variability in a control volume, regardless of whether it is in the longitudinal or widthwise direction, is certainly not a desired operating condition, thus it needs to be avoided as far as possible. In that sense, the conventional, and widely installed and operated, hot air-based heating system is, then, not the best, or optimal, heating solution at all for ensuring, or seeking, better economic profits.
In Figure 13, the patterns of temperature change for different types of heating systems based on the experiment data are shown as time passed. The hot air ejected from the successive hole on the plastic vinyl tube in the longitudinal direction, which is located on both sides of the greenhouse, is convected upward, mixing with the relatively lower temperature air in order to heat up the whole volume of the greenhouse eventually. The hot air supply system has the benefit of a quick response in relation to reaching the target temperature of the internal air of the greenhouse, but the area of a high temperature spot is unavoidable due to the intrinsic feature of the forced convection-based heat delivery mechanism. Additionally, when the hot air supply stops due to the signal that the center temperature from a sensor has reached a set temperature, the heat flux into the greenhouse is not sustained further any more by the stop of hot air supply, which means that the continuous heat loss via the greenhouse skin and the infiltration of cold outdoor air via the gap make the inside temperature drop rapidly again, as shown in Figure 9. In contrast, the natural convection, or somewhat radiative heat transfer mechanism of a hot water-based heating system can provide a continuous or unwearying heating, which can be executed moderately, as compared to the forced convective mode of a hot air system, via the large area of heat ejection pipe under the bed. Unlike the hot air-based heating system, the hot water one can be said to be beneficial in that the hot water that remains inside of the heating pipe can emit the heat continuously to compensate for the heat loss from a greenhouse, even after the pump operation is stopped by the controller. Secondly, it can also be conceived that the current thermal management control system, that relies on a single sensor node, can cause serious results in terms of productivity or crop quality decrease and, more seriously, a substantial damage of the whole cultivation due to disease by mold or bacteria, which can be initiated by condensation on a product. For example, when the greenhouse is controlled by referring to only the sensor data of a sole sensor node with the hot air system, the multi-variable control system cannot recognize the observed large temperature difference in a target control volume—the building of a greenhouse—at all (specifically during the night in winter), and thus does not take any action to alleviate the large temperature difference under the assumption that the inside temperature is uniform or within the range of minor differences. The possibility of this situation of danger can be significantly reduced with the simple substitution of the heating system into a hot water-based heating system. For example, in the ripening stage of thermal management for a strawberry, the temperature inside of a greenhouse is desired to be in a chilled temperature range, around 5~7 °C, in order to secure higher sugar content; the heating system is often not triggered until drops below 4 °C. It is expected that, in this case of operation, the local temperature difference would become large, especially between the beds located in the center and those by the side walls, so in a certain cold day of a winter, the crops in a side bed would likely be suffering from being exposed to a cold air condition below 4 °C without being recognized by a control system. If this type of exposure or condition occurs often or for a certain period of time, it would surely lead to undesirable consequences (e.g., damage by diseases).
During the day, the thermal condition in the greenhouse can be highly asymmetric due to the effects of solar irradiation. However, during the night, when the experiment was performed, the non-uniformity due to the solar irradiation is greatly reduced. Moreover, since the windows are almost closed during the experiment at night for heating, the effect of wind blowing outside of the greenhouse is assumed to be marginal, even though a strong and continuous wind condition might cause an asymmetric thermal condition inside a greenhouse. In this study, the experiment with sensors in the longitudinal direction were configured to set all sensors located on one side of the greenhouse in order to increase the measurement resolution, under the assumption that the effect due to wind is too marginal to suppose a symmetric thermal condition. Figure 13 shows the symmetrical result, to some extent, of temperature in the greenhouse during the heating experiment period, except for the values for both side corners. However, it was considered that the level of asymmetry is not significant to sacrifice the high resolution of data in the longitudinal direction by installing the sensors on both side.
From the analysis of the results of the experimental verification and the promoted understanding of the different features of the heating systems with the volumetric data for the thermal variables, it can be concluded that the introduction of a new concept of control variable, of a thermal condition for a greenhouse, might be beneficial in various aspects, such as productivity and quality enhancement, or risk management to prevent disease outbreak preemptively, by providing a more uniform thermal environment. In this study, the variable of the degree of uniformity of temperature is newly introduced as a main control variable to a greenhouse, and the effects of the adopted heating systems or the counter control measures on the variable is assessed as follows.
The degree of uniformity of the temperature inside of a greenhouse can be defined by the following equation.
denotes the degree of uniformity, is a local temperature of a sensor at a certain measuring point, and is the average temperature of the whole measured points. The definition of the degree of uniformity of the thermal variable, temperature in this case, means the degree of dispersion of the temperature from the average value, and it is only available when the multiple sensor nodes-based monitoring system is implemented to be able to provide lots of data in real-time. From the view point of thermal environment control in the real field, this new concept of a thermal condition control variable—the degree of uniformity—can bring about substantial benefits for several aspects that have been described above. The estimation, or calculation, of the variable based on the monitored data from lots of sensor nodes in real-time is to be done with ease and it can be estimated that an evolution from a pointwise, one-dimensional control to a volumetric, three-dimensional control can be attained with more precise control algorithms, which can be realized with this multiple sensor nodes platform, in other words, more rigorous or precise real-time monitoring about the status of crop growth and more precise control of thermal environment can be accomplished, with which a substantial improvement of crop production and quality can also be pursued.
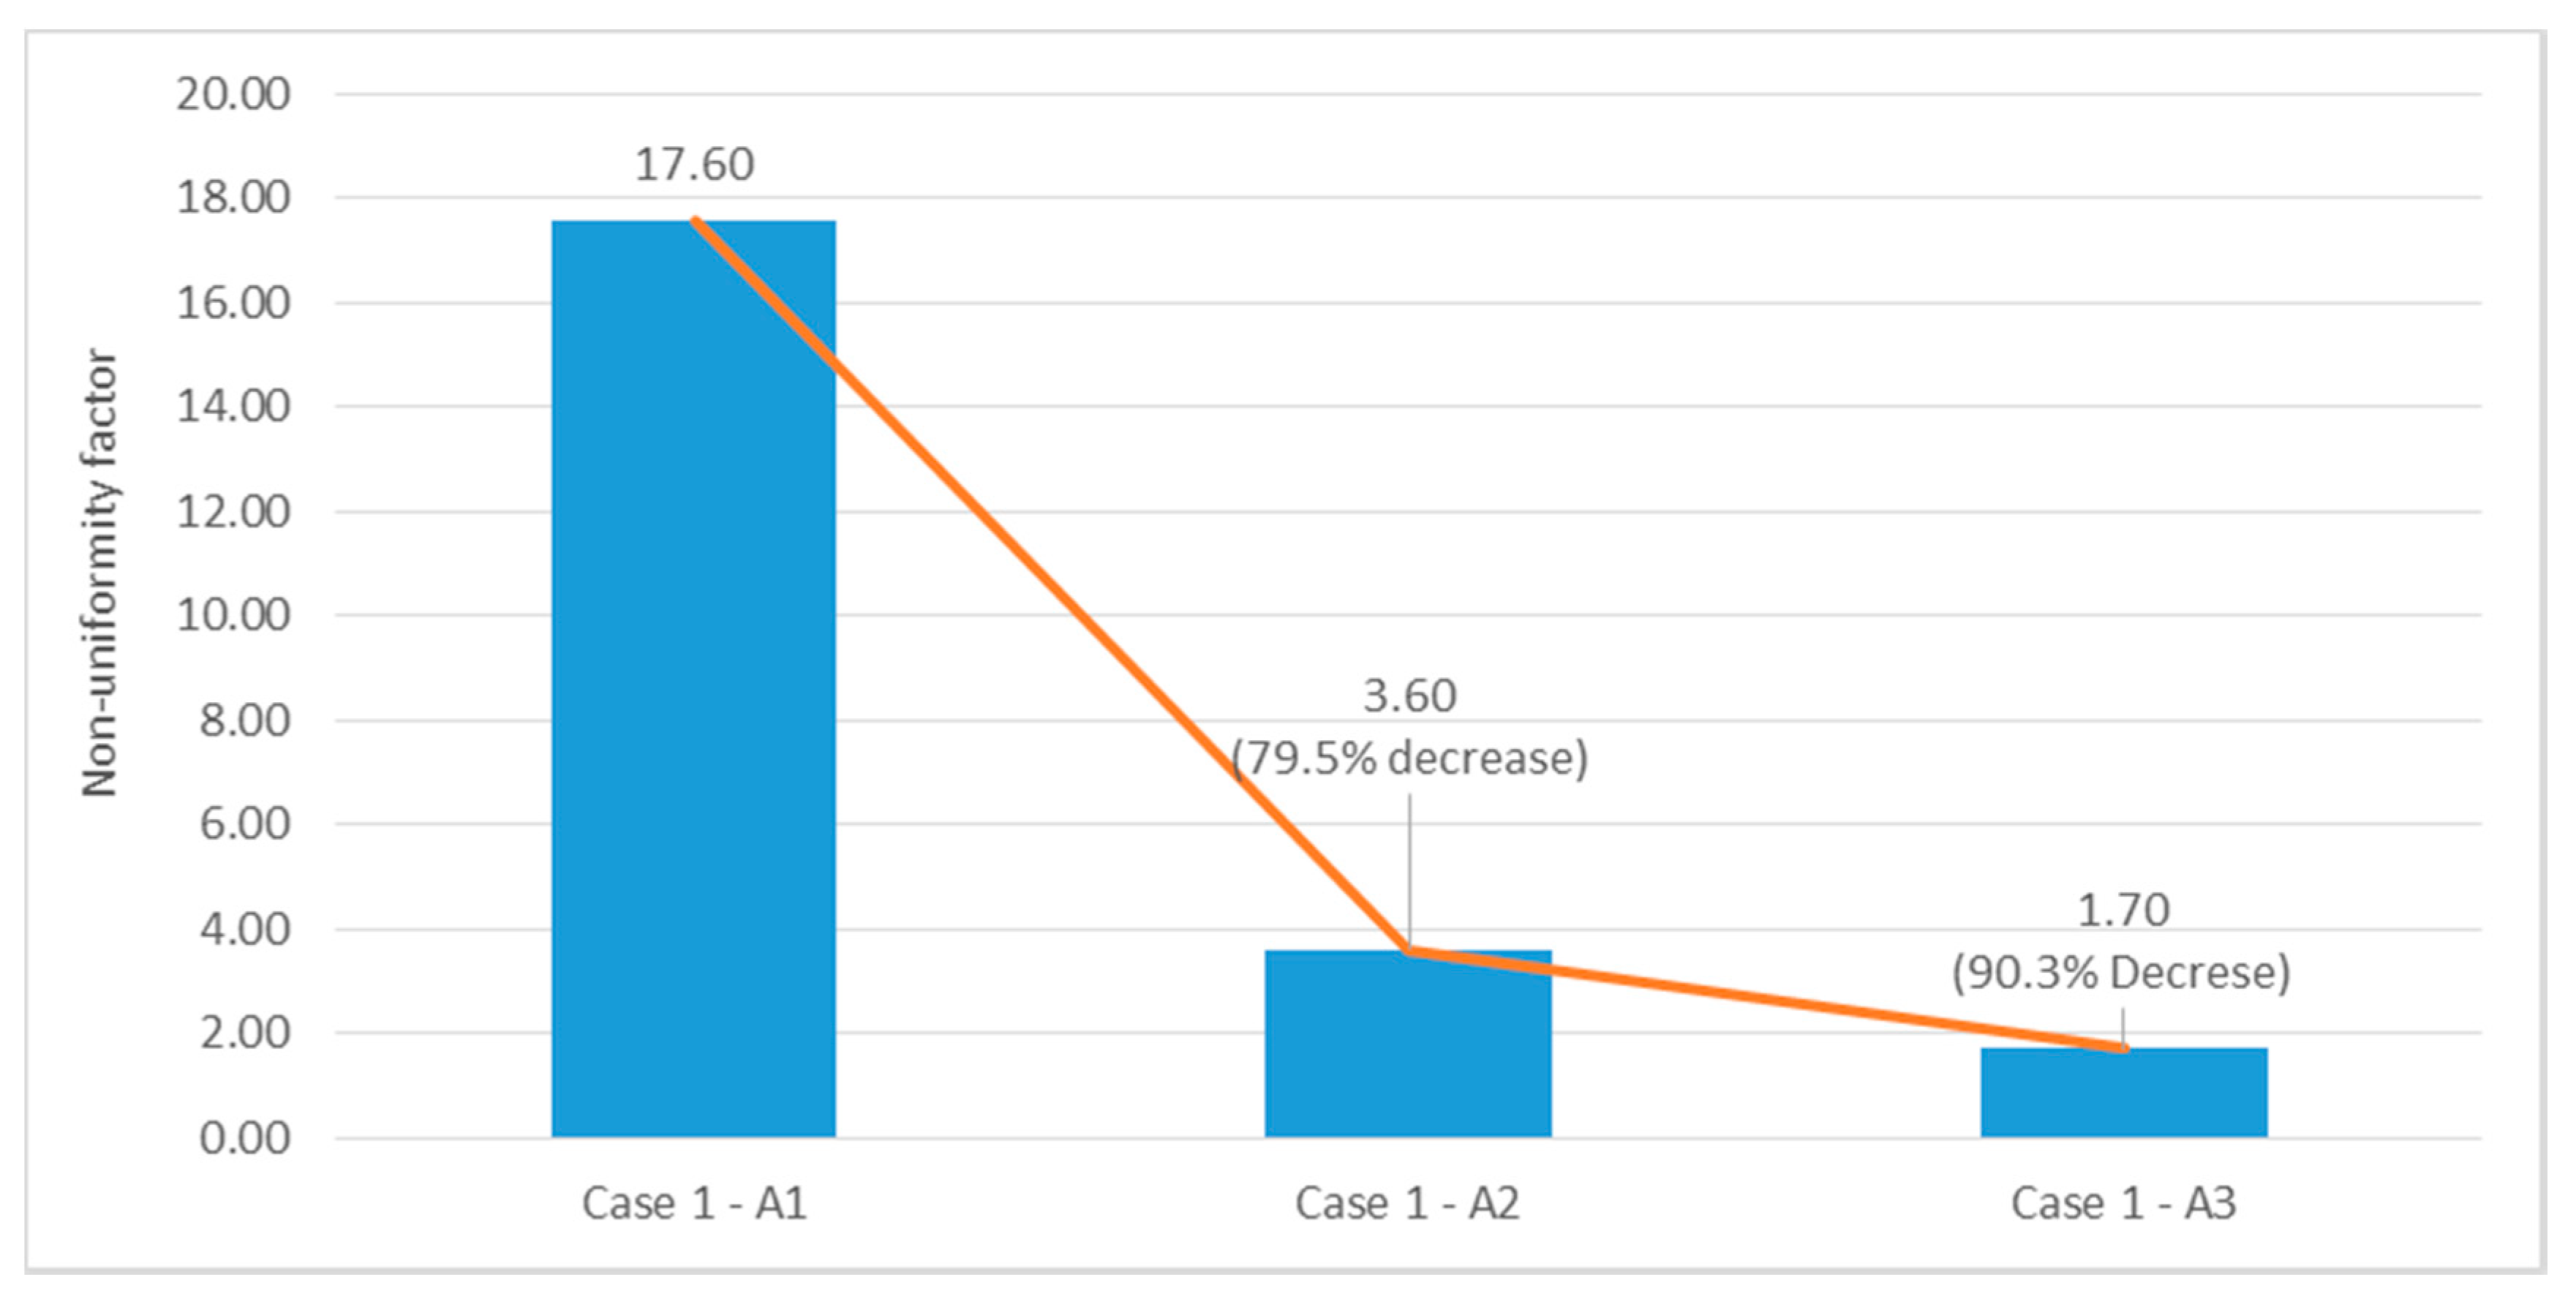
Figure 14 shows the comparison of the degree of uniformity according to different heating systems and the control measures of hot water supply on the beds as in Table 1 (A1, A2, and A3). It represents the values of the degree of uniformity in the longitudinal direction of a greenhouse, as shown in Figure 8, and it is shown in Figure 14 that the degree of uniformity for a hot air-based heating system is worse than the others as expected, and it can be substantially improved by the simple substitution into a hot water system, about 80% decrease of its non-uniformity. The additional control measure of independent heat supply by the bed can also improve another 10%, resulting in the value decrease of a tenth. It is also interesting to note that the temperature difference in the longitudinal direction for a typical winter day at night is more or less 3.0 °C, between the center and the end of the greenhouse, in the conventional hot air-based heating system, on the other hand, within more or less 0.5 and 0.35 in case of the hot water-based heating system based on control measures of A2 and A3 as shown in Table 4. This aspect of serious non-uniformity that is supposed to be prevailing in the current thermal environment control system relying on a sensor node monitoring system has long been ignored or overlooked implicitly, and there is substantial room for enhancement of greenhouse horticulture with the adoption of this newly proposed concept of precise control measures based on volumetric sensing data; however, the level of the improvement potential needs to be investigated further for a variety of crops’ thermal environments, not to mention of the types of greenhouse and the scale, etc.
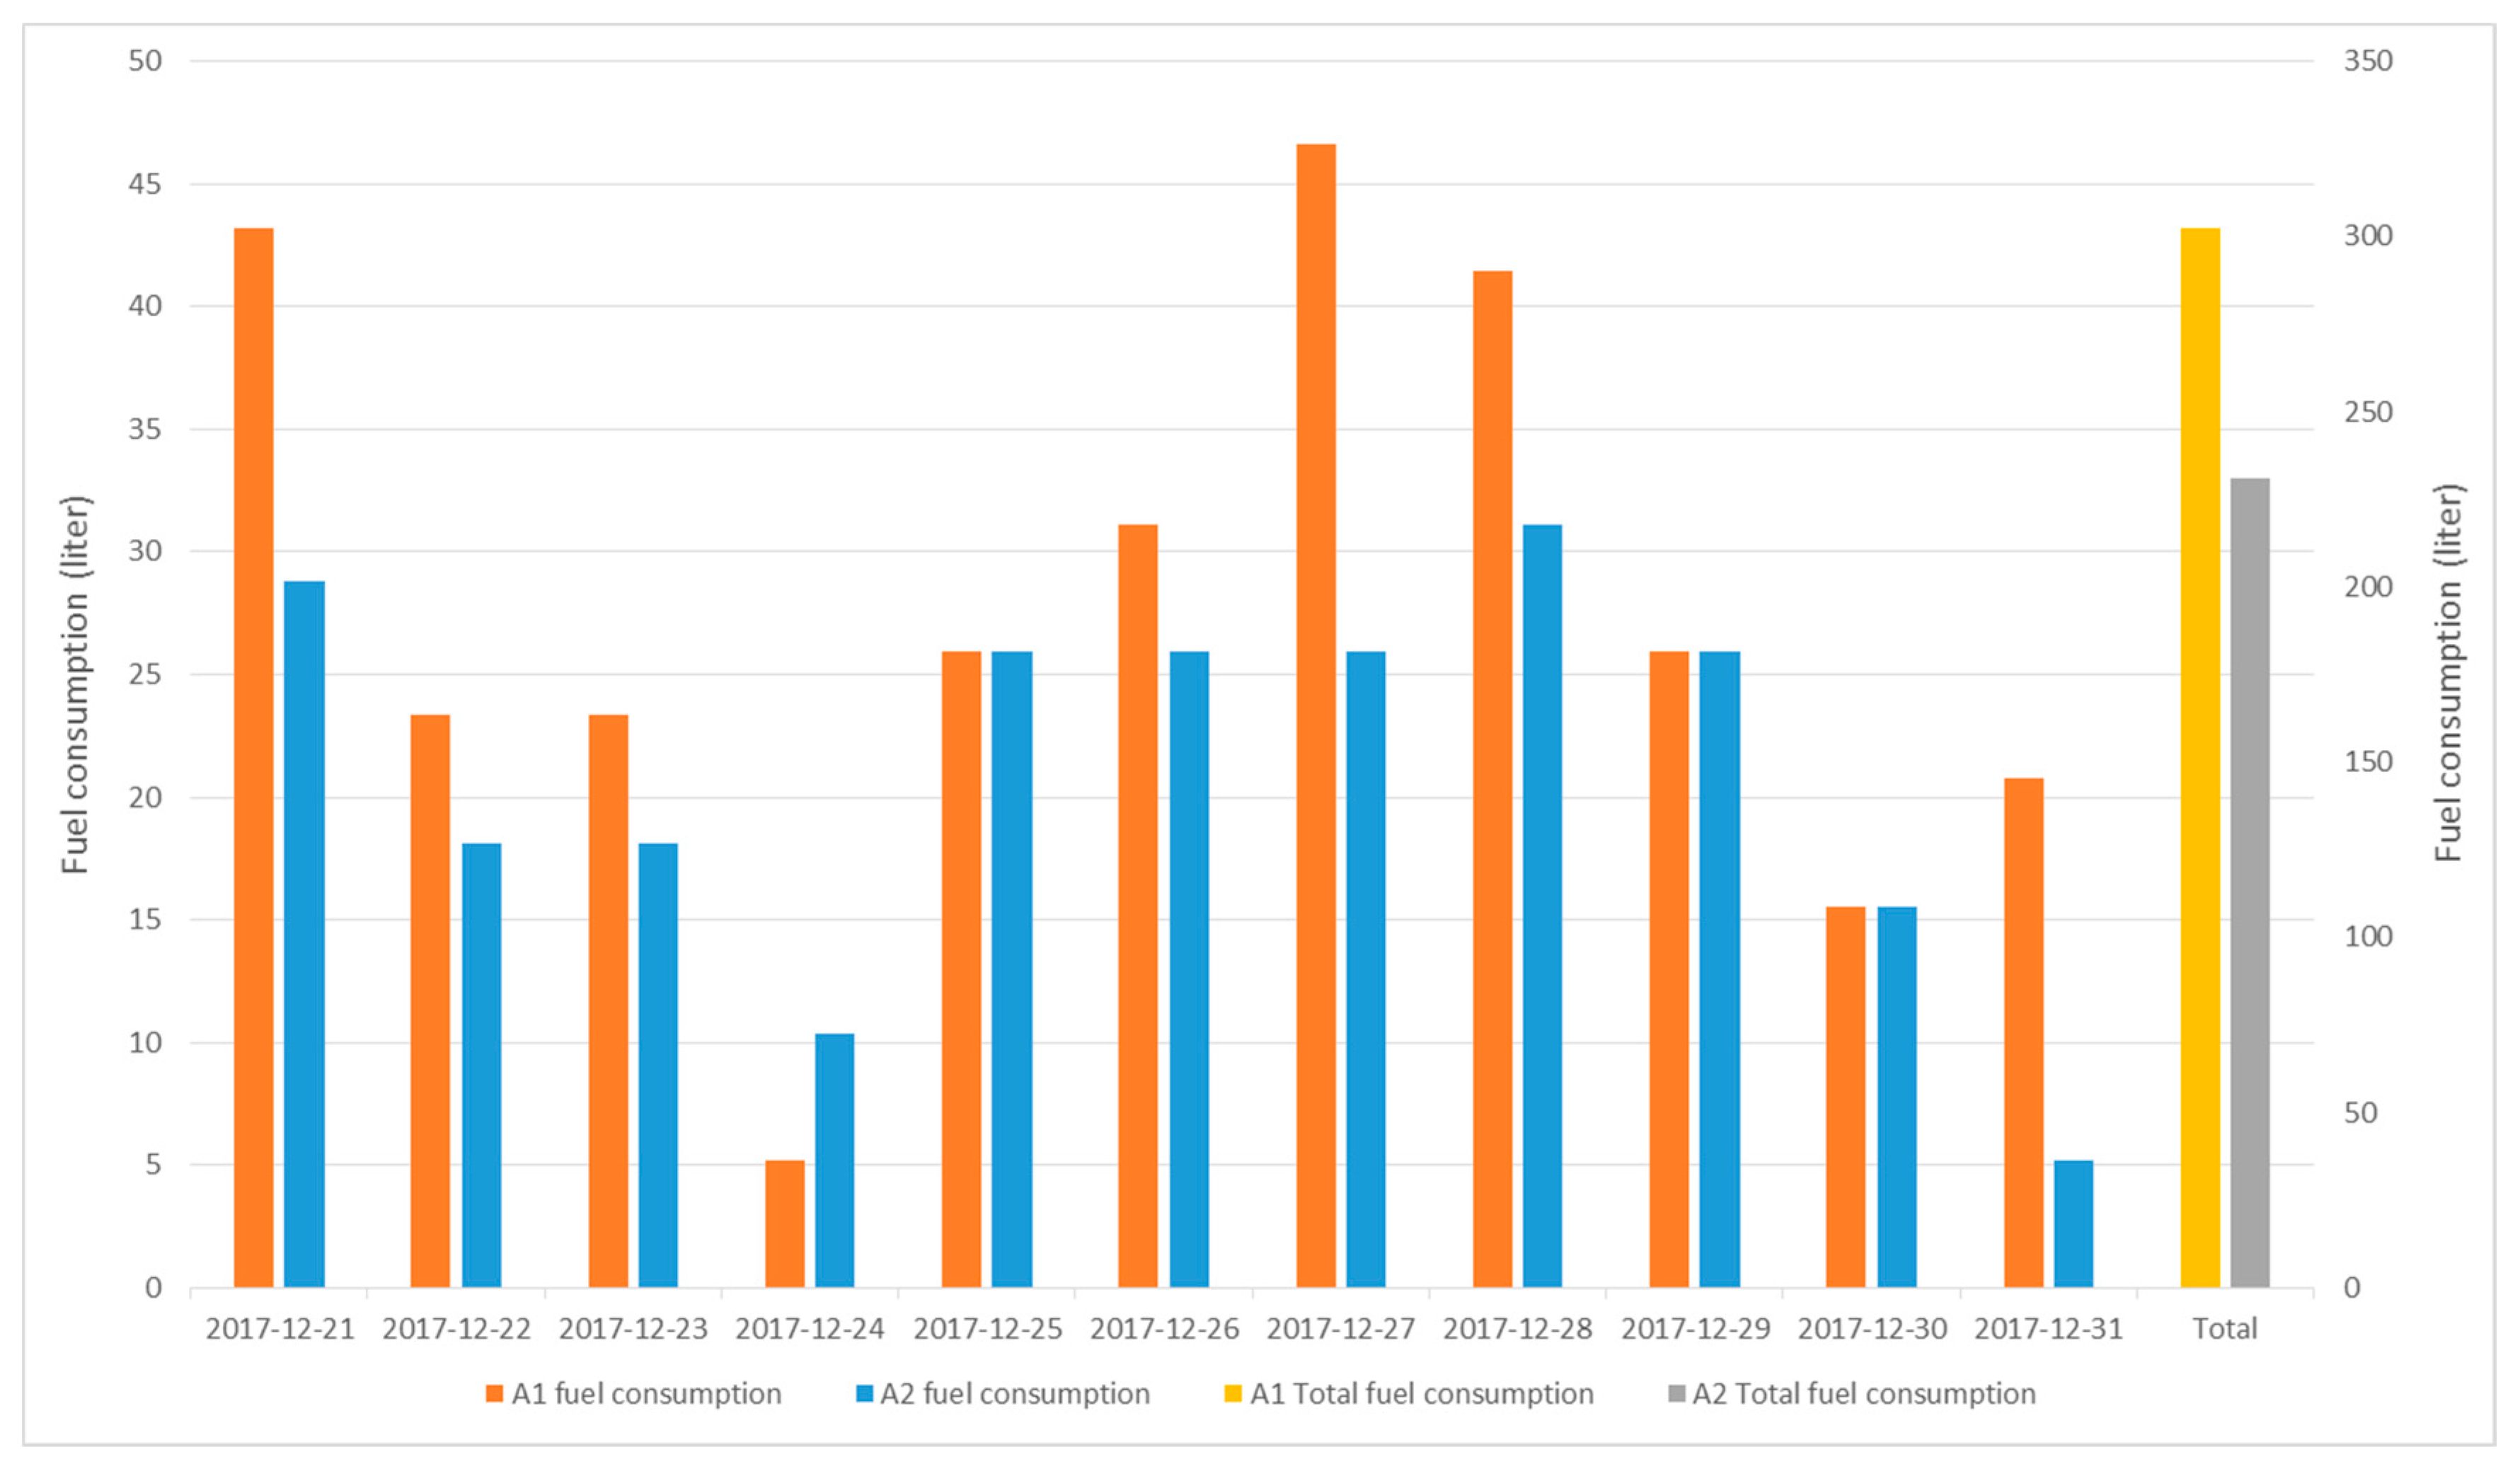
Figure 15 shows the comparison for the fuel consumption of the heating systems; hot air- and hot water-based heating systems. The measurement of fuel consumption was performed for 11 days in a typical winter period, which was from 21 December to 31 December 2017. The comparison shows that the fuel consumption of A2 hot water-based heating decreased by about 30% compared to A1 hot air-based heating.
Although the accurate measurement for the crop yield for the different buildings of a test greenhouse with different heating systems was not performed, it was approximately estimated that around a 30% crop yield increase was accomplished by providing a more stable thermal condition, with the concept of qualitative control in the real crop cultivating condition of the test greenhouse A (Case 1).
3.2. Comparison of Thermal Environment by Variants of Control Measures (Hydraulic Mass Flow Control)
In the previous experiment for test greenhouse A, the concept of a new control variable with the multiple sensor nodes system—the degree of uniformity—was introduced and the effects on it by the heating systems and, further, the enhancement of the variable along with the additional mass flow rate control by a bed was verified experimentally. In this section, a new measure to be able to increase the degree of freedom in controlling heat flux in each bed is proposed and its effects on the degree of uniformity is assessed, and the experimental verification of it is described in detail. In comparison with test greenhouse A, where the inlet temperature into the inner pipe network of the greenhouse was determined from the operating status of a heat accumulator connected to the oil boiler, the inlet temperature into each building of the test greenhouse B could be controlled with a more reliable manner via the heat exchanger located in each building, in that the secondary loop of hot water was decoupled from the main loop for which the heat accumulator was connected, as shown in Figure 4 (i.e., the inlet temperature into each building’s heat supply pipe could be adjusted and controlled with relatively less variation compared to the test greenhouse A (Case 1). In addition to that, a hydraulic proportional mass flow control valve is also adopted at the inlet of each bed of the building, by which the mass flow rate into the heat emitting pipe for each bed can be adjusted in an appropriate manner, in order to be able to control the amount of heat flux for each bed, as shown in Figure 16. Since the drastic effects of the hot water-based heating system, compared to the hot air one, on the degree of uniformity is quite straightforward, as proven in the previous experiment, it is not to be considered hear any more. Instead, several control measures, as shown in Table 1, for improving the resolution of uniformity, that can be adopted to the hot water-based heating system, was investigated for test greenhouse B for the comparison of the performances. In this experimental verification for greenhouse B, along with the previously mentioned control measure A3, two new control algorithms are applied with the adoption of hydraulic proportional mass flow control valve. Furthermore, it differs in that the opening rate of the valve is proportional to the temperature difference between the set value of temperature, the target value for each bed, and the averaged value of temperature for each bed in the case of B2. As for the case of B3, the opening rate of the valve is not determined with the data for a current time step, and the opening rate of the valve for the previous step is also referred to in determining the new value of the opening rate of the valve (i.e., the arithmetic mean value is finally applied for the current step in this study even though more various weight average methods can be considered, which might be studied in further study).
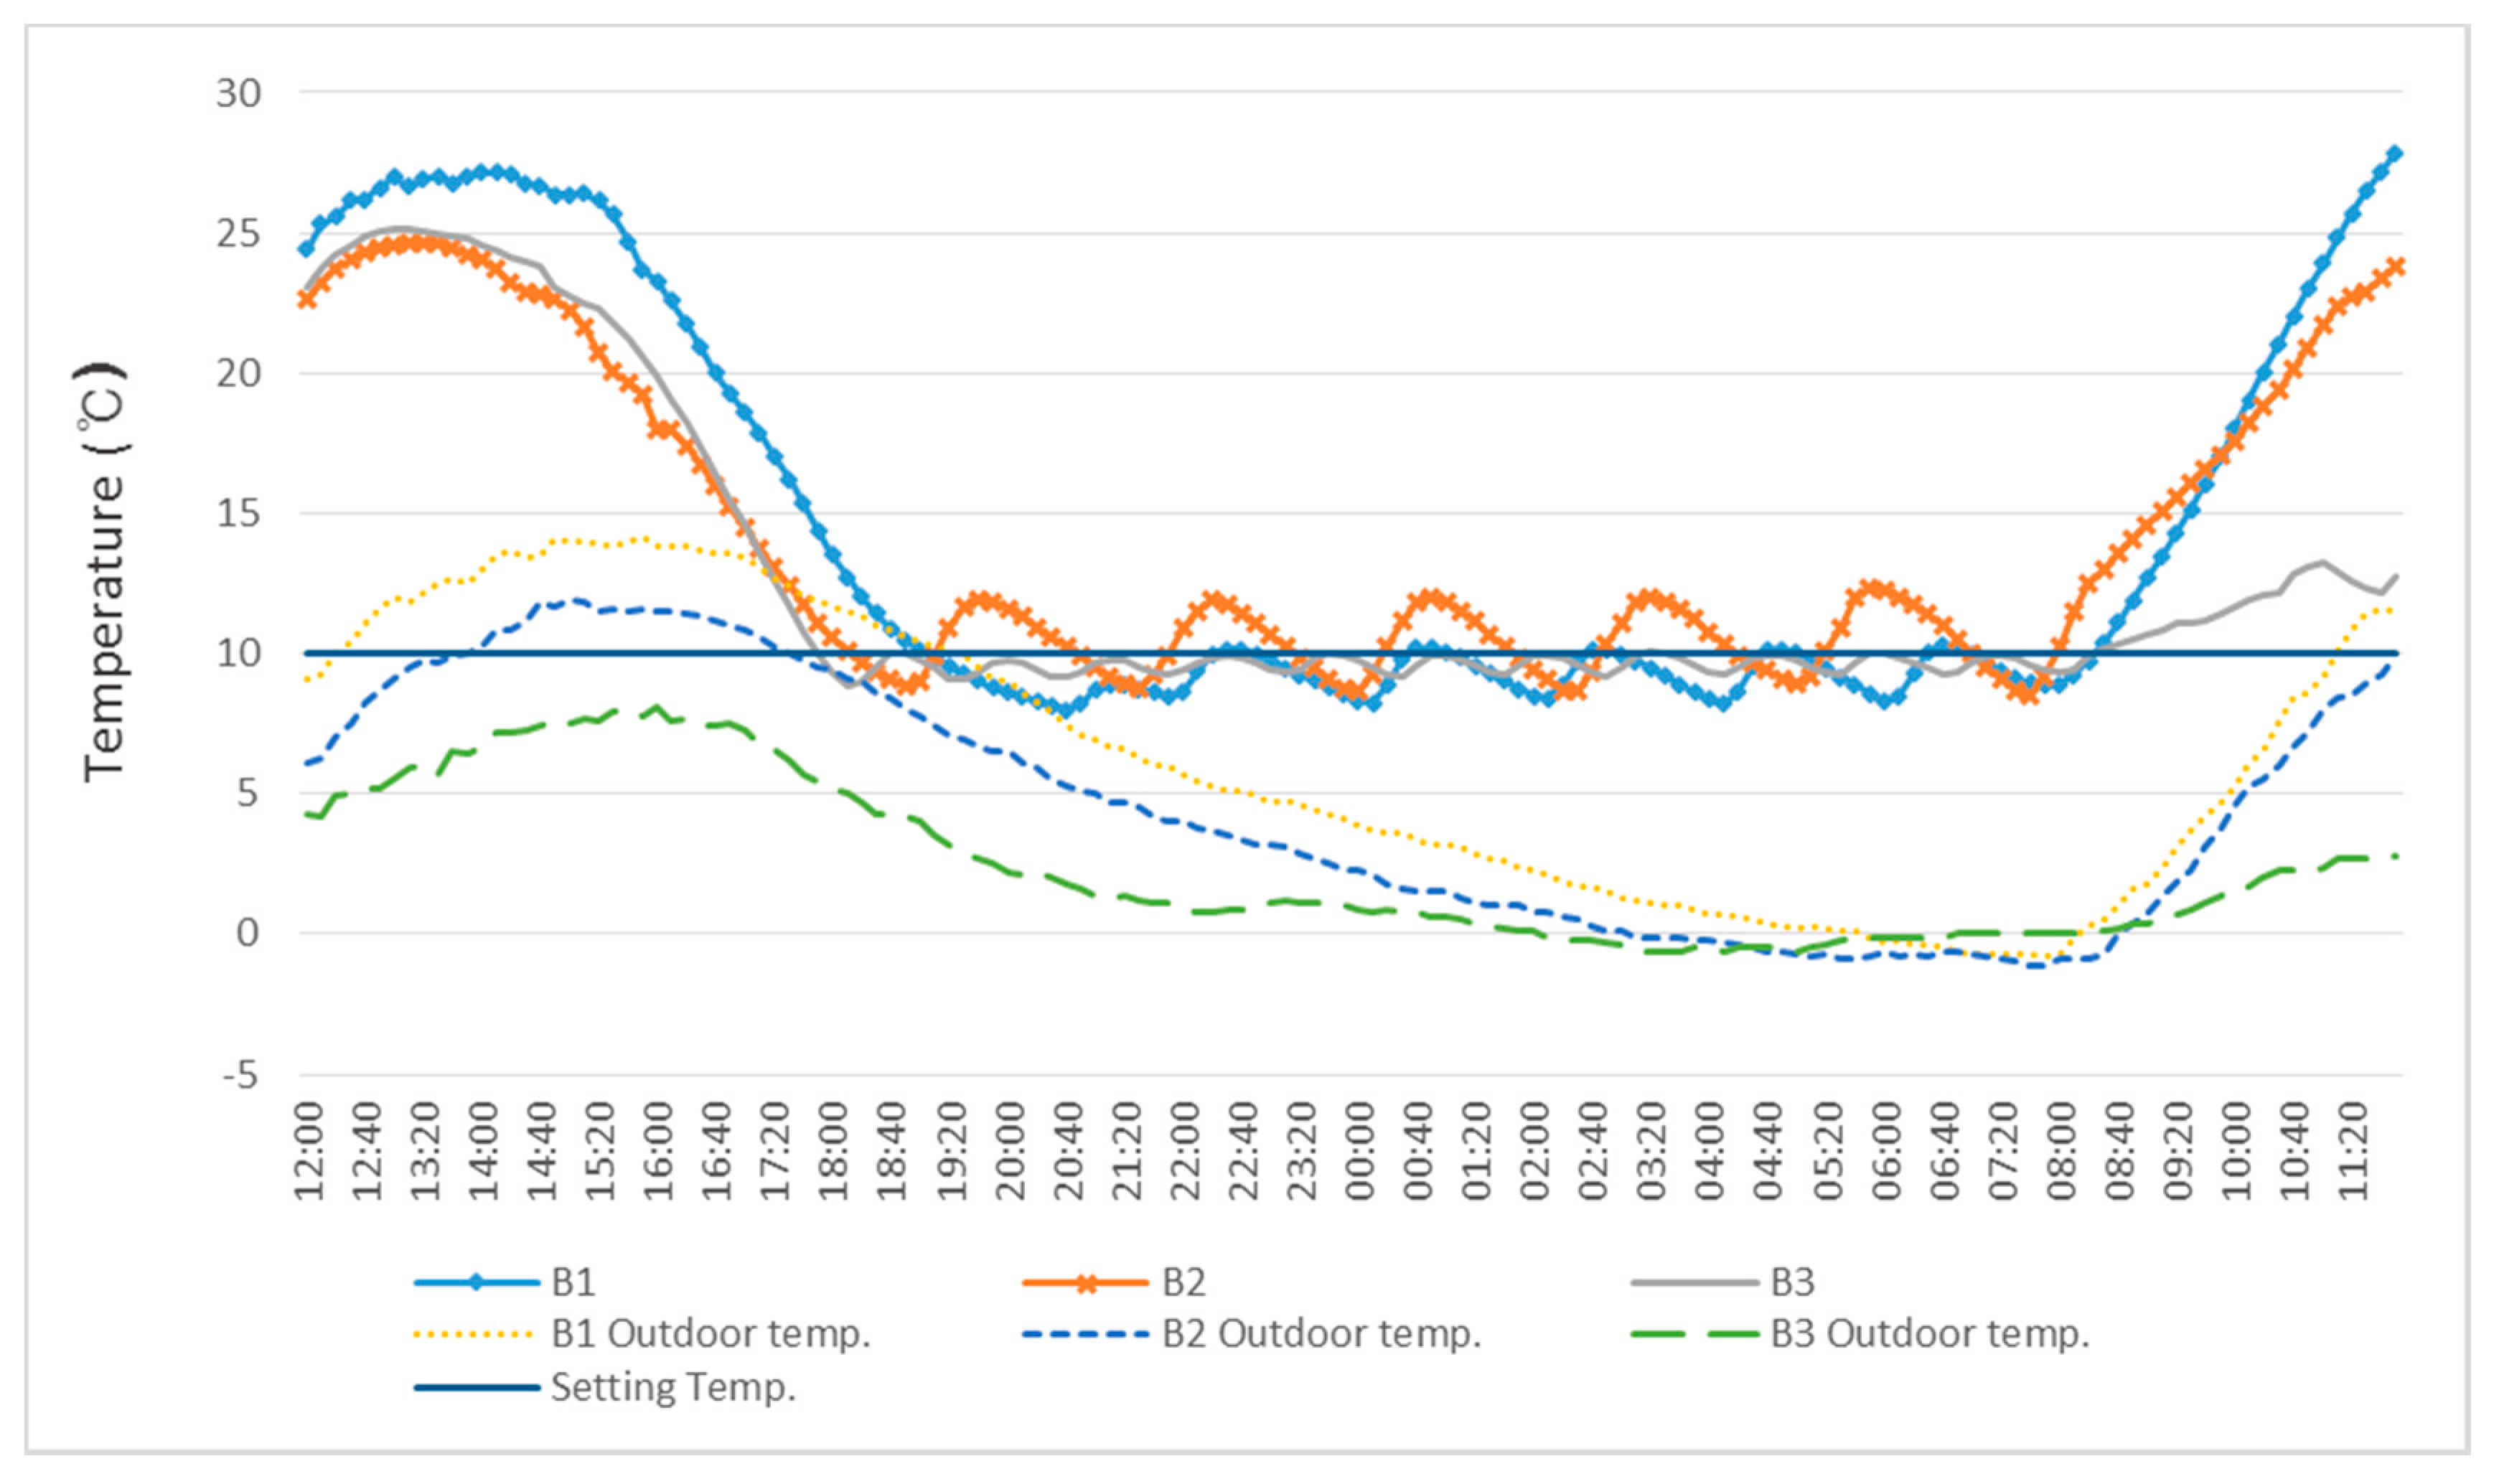
Figure 17 shows the experimental test results of temperature profiles inside of test greenhouse B according to the applied variants of control measures. The experiments were conducted for three days, and the ambient air data are shown in Figure 18. In the results, at first it is observed that the temperature profile over time is oscillating, to some extent, regardless of the applied measures, which differs from that of it in the case of test greenhouse A. It is supposedly caused by the small heat capacity of greenhouse B (i.e., a relatively large surface to volume ratio) due to the small-scale of the greenhouse. The performance of each variants of control measures shows that B3 in Table 1 provided the best temperature control feature, in that the deviation from the set temperature, 10 °C, is the smallest, among the other variants, to be able to provide a more comfortable thermal environment to the crop. In contrast, the simple on-and-off pump control for each bed without regulating the rate of mass flow, B1 in Table 1, tends not to be able to meet the target temperature, although the fluctuation is smaller than the case with the variant of B2, linear mass flow rate control algorithm.
The measured temperature data of different control measures, B1–B3, for Case 2 are shown in Figure 19. It is clearly observed that more stable thermal conditions can be managed with B3 control algorithm, in that the temperature at various measured points remained within a range of ±0.5 °C (i.e., the degree of uniformity was highly improved), although the inflection point of temperature over time was adversely increased due to the more rapid response for the temperature gradient variation.
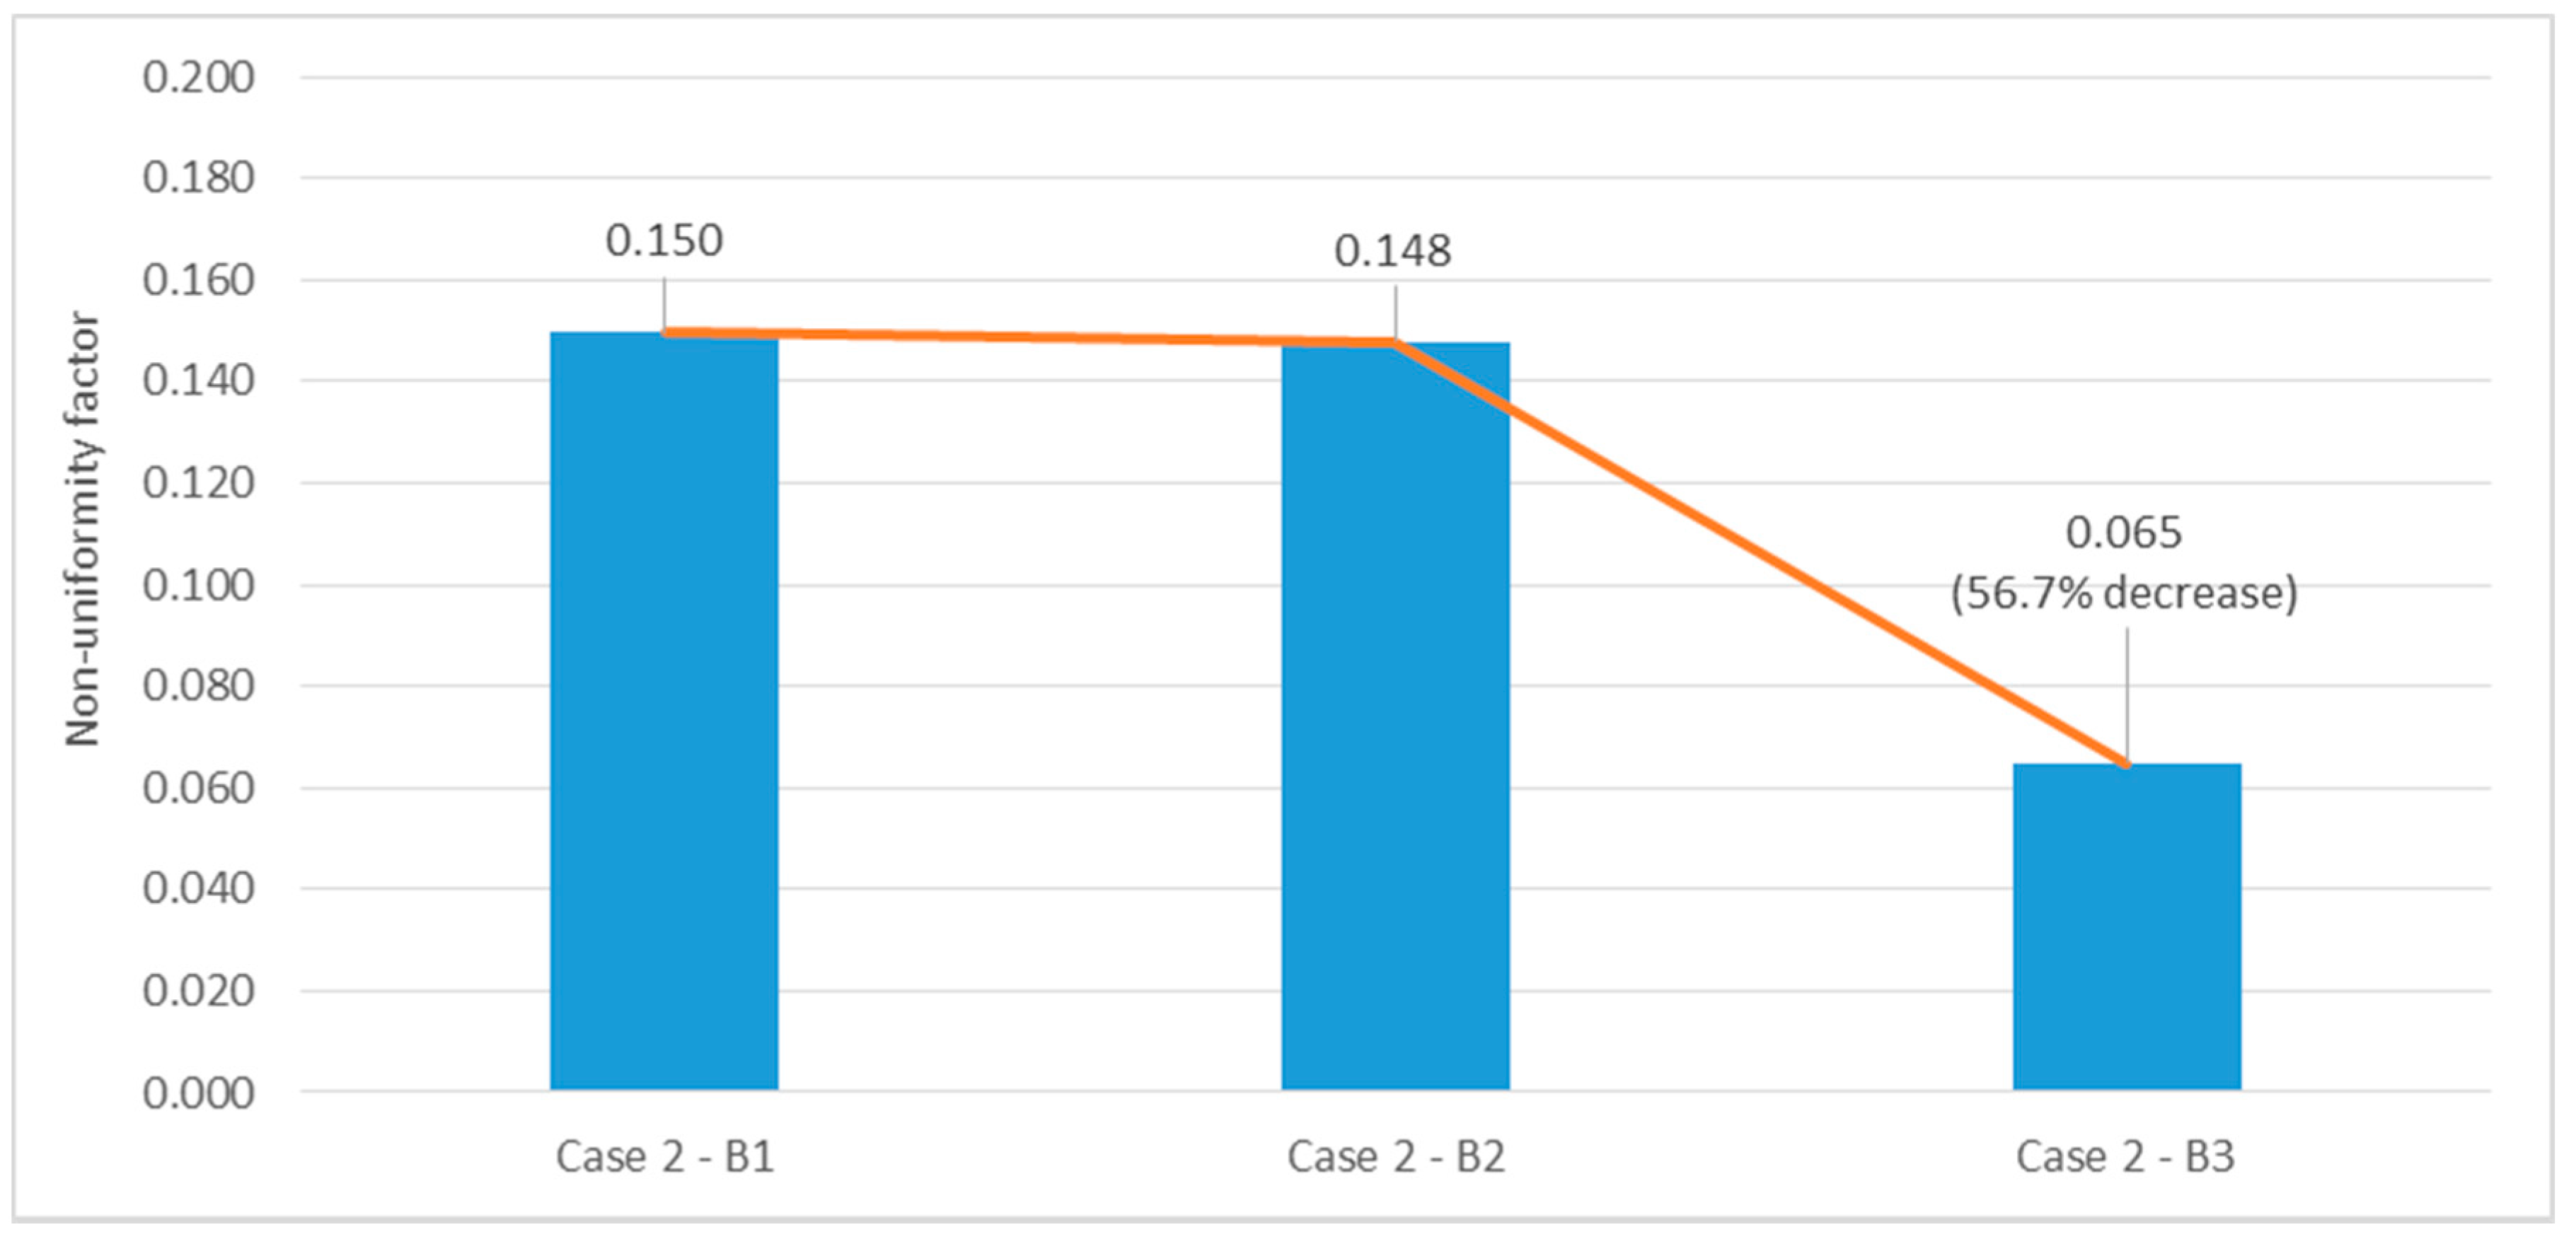
The measurement data for the temperature variation in case of on-and-off pump control, B1, and the variants using proportional valve control, B2 and B3, is given in Table 5. It can be highlighted that the variant of B3, with referring to the data of the previous time step, induced more peaks but the fluctuation from its mean value is half to that of simple on-and-off control, B1, and one third to that of another variant of B2. From the result, it can be understood that the abrupt change of mass flow rate into the heat ejection pipe is not favorable for securing a more comfortable thermal environment, in terms of meeting the set value or the fluctuation, etc. In that sense, the adjusted control algorithm of B3, with gradual change of hot water supply into the heat ejection pipe, can be hypothesized to be the best or optimal control algorithm at present. However, more extensive or rigorous investigation for a variety of test cases is certainly required in order to draw a general conclusion, and will be carried out in further study. With regard to the enhancement of the degree of uniformity by the variants of the control measures, it is summarized in Figure 20. As mentioned above, the value for the hot air-based heating system is excluded for simplicity, and the comparison reveals that an unattractive improvement of the degree of uniformity can be attained just by introducing hydraulic mass flow valve control. Therefore, more elaborate control algorithms need to be adopted, as in the case of B3, where the previous time step opening rate was also referred to in order to determine the current time step of the rate having an effect, to aid an abrupt change of heat flux being avoided. The new control algorithm of B3, referring to the previous value of the opening rate of the valve, is able to accomplish a certain level of enhancement of the degree of uniformity inside the greenhouse, more or less 55% compared to the value of B1 or B2. From the analysis of the experimental verifications, it can be concluded that B3 shows the best performance in terms of tracing the target temperature and providing a more favorable thermal condition with a higher degree of uniformity.
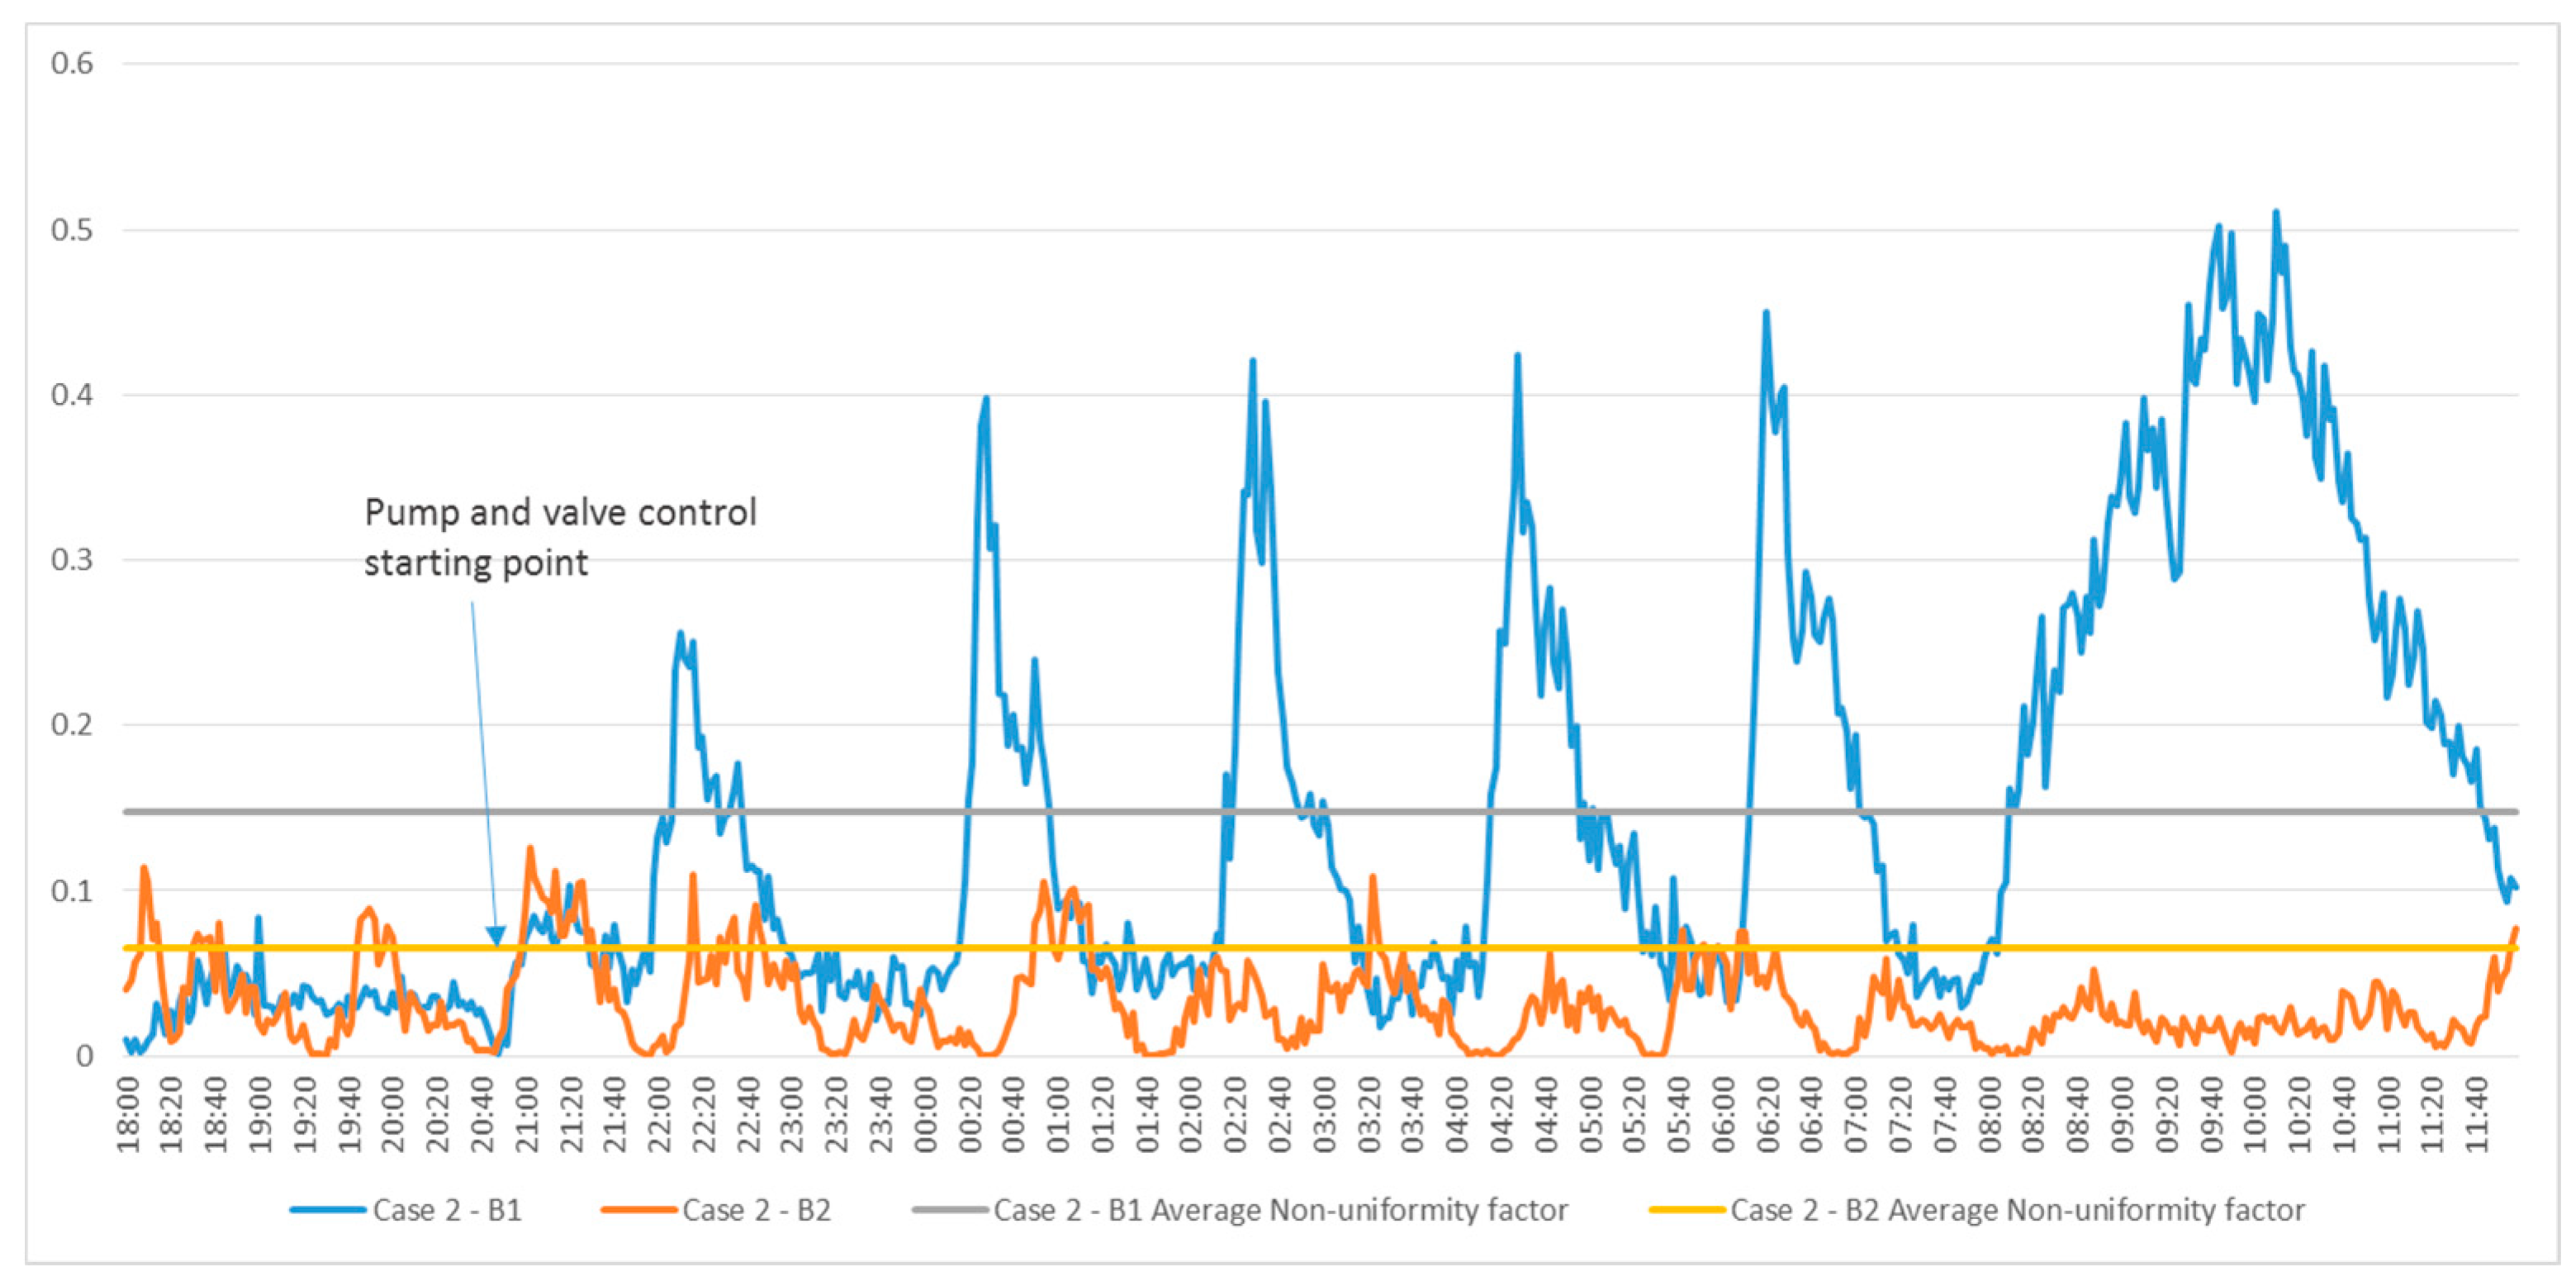
In Figure 21, the time variation of the degree of uniformity for two different control measures (i.e., B1 and B3) is compared and it shows that the instantaneous difference of it can be larger than that for the averaged value. It also implies that the newly proposed control variable—the degree of uniformity—is quite adequate for securing a more comfortable thermal environment for greenhouse horticulture, and it becomes more powerful when it is utilized as a real control variable in managing the transient thermal operating conditions for which the support of volumetric thermal variables data from a multiple sensor nodes system is positively necessary, as shown in this study.
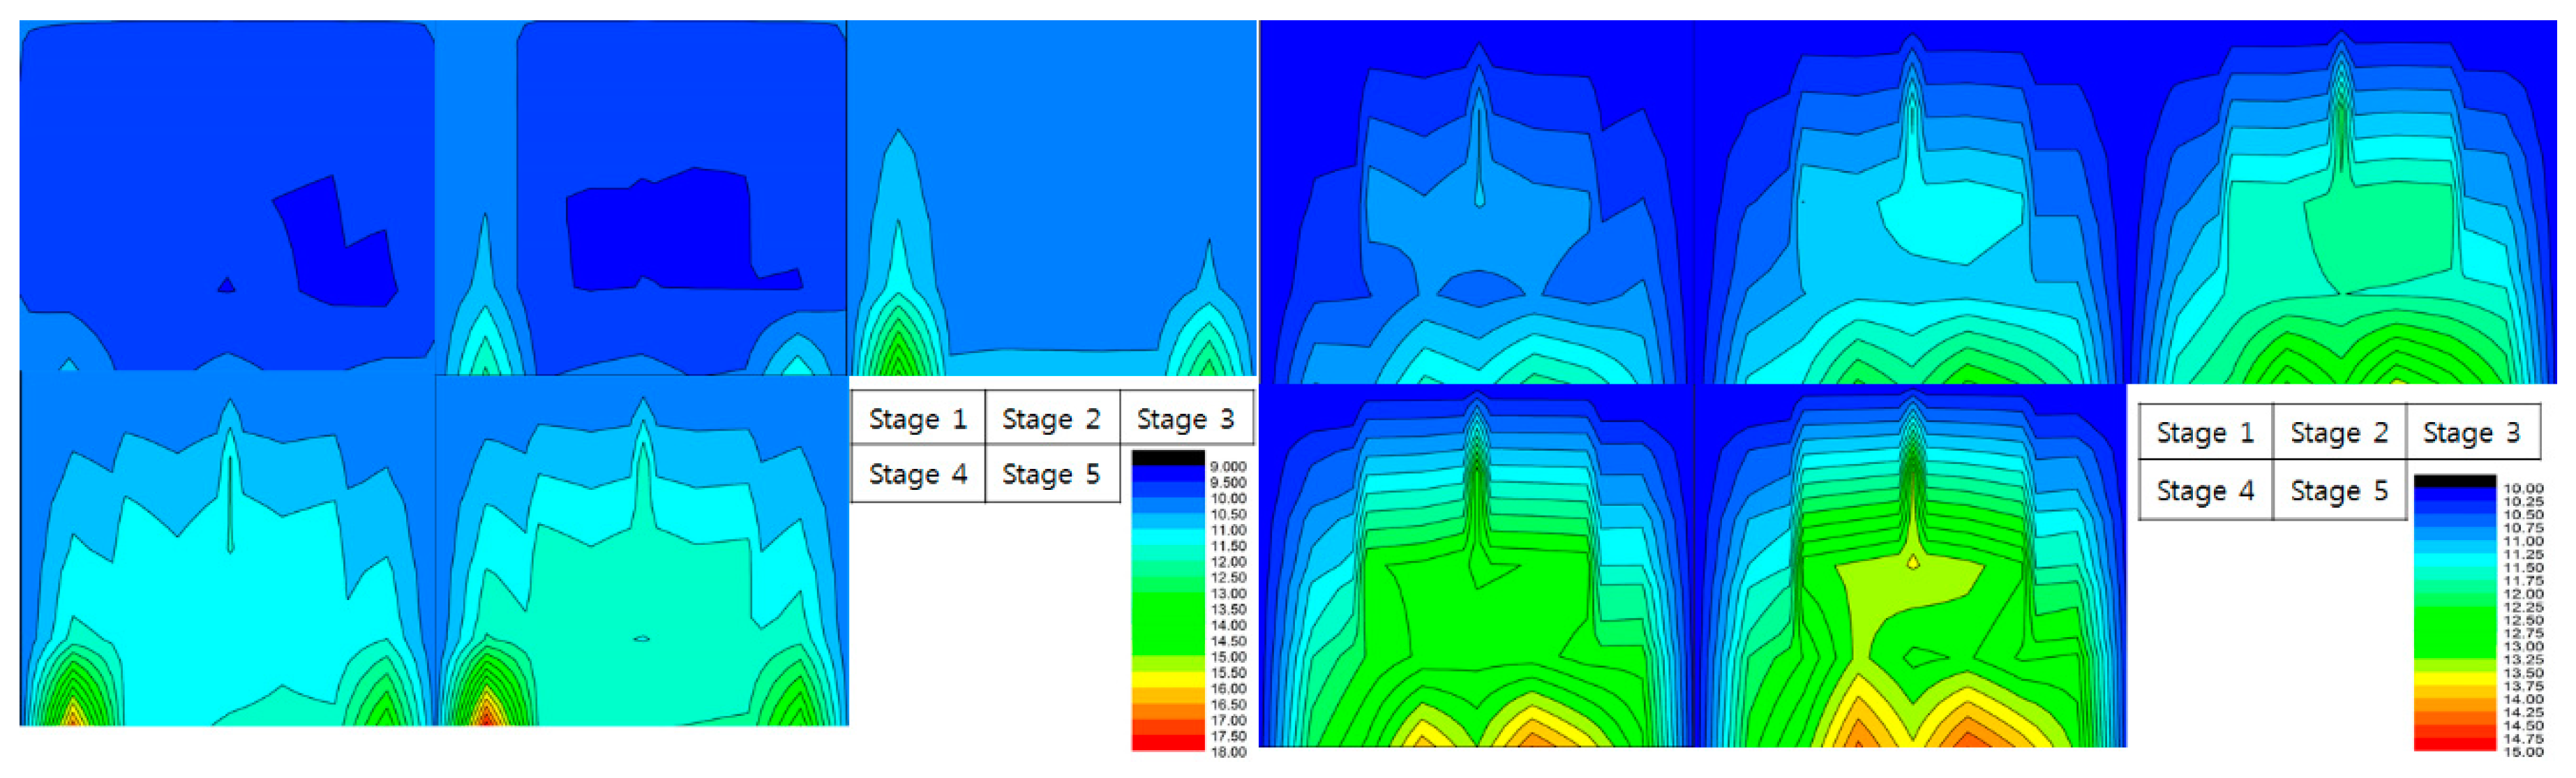
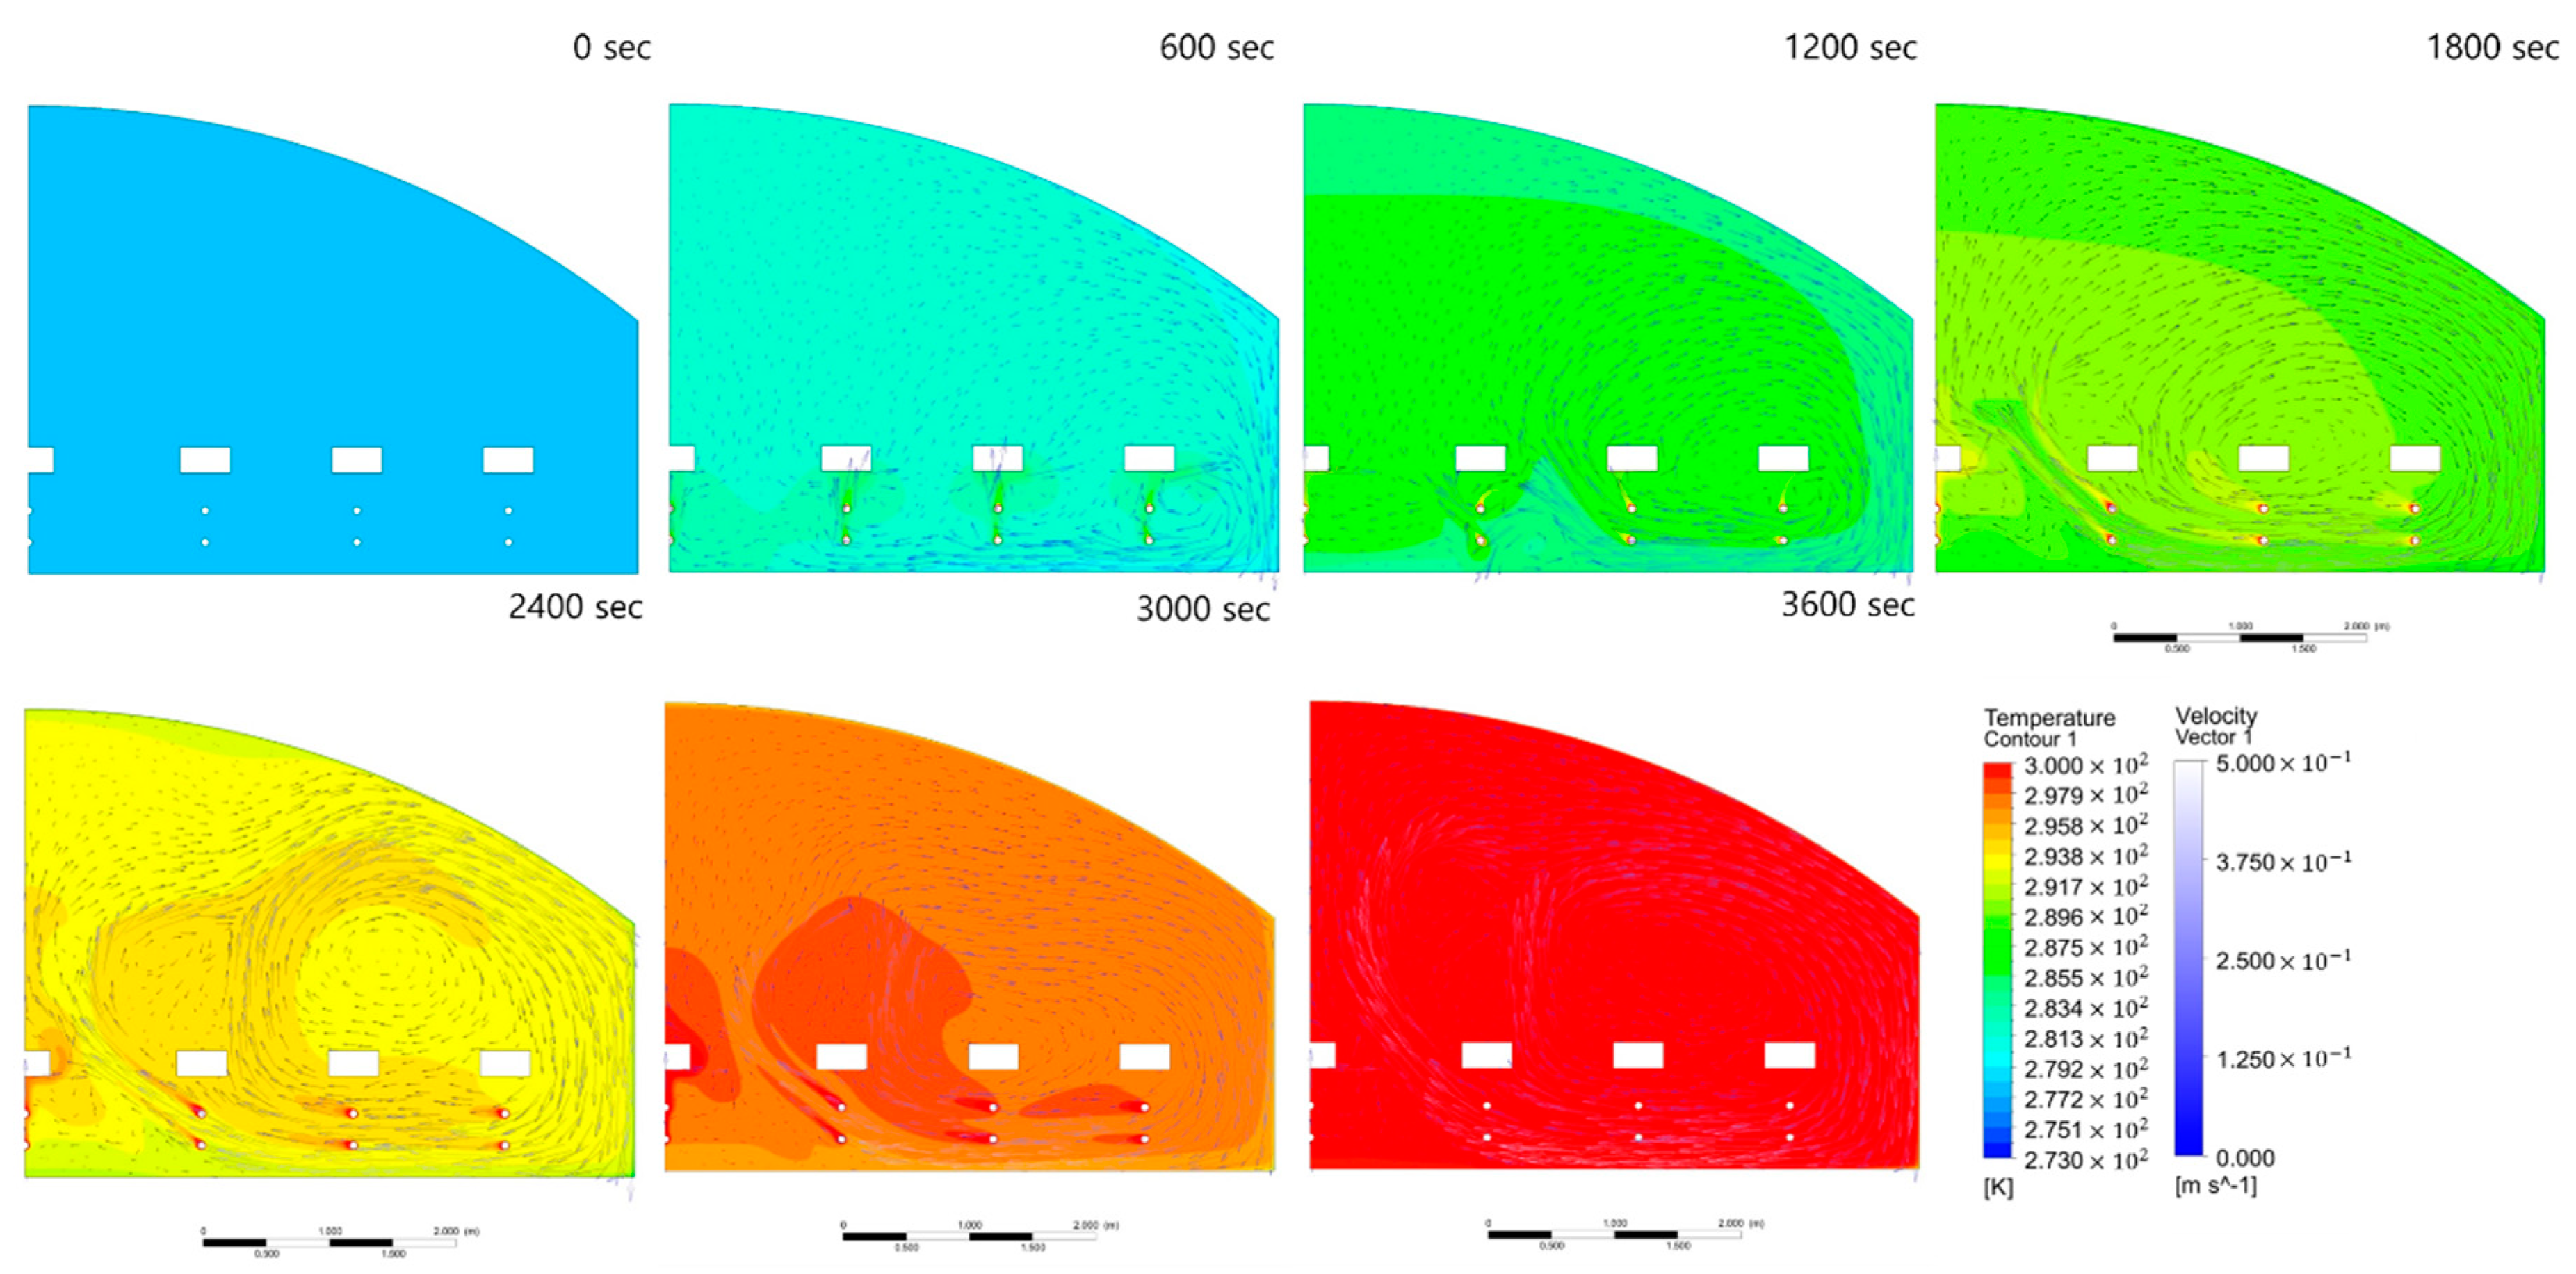
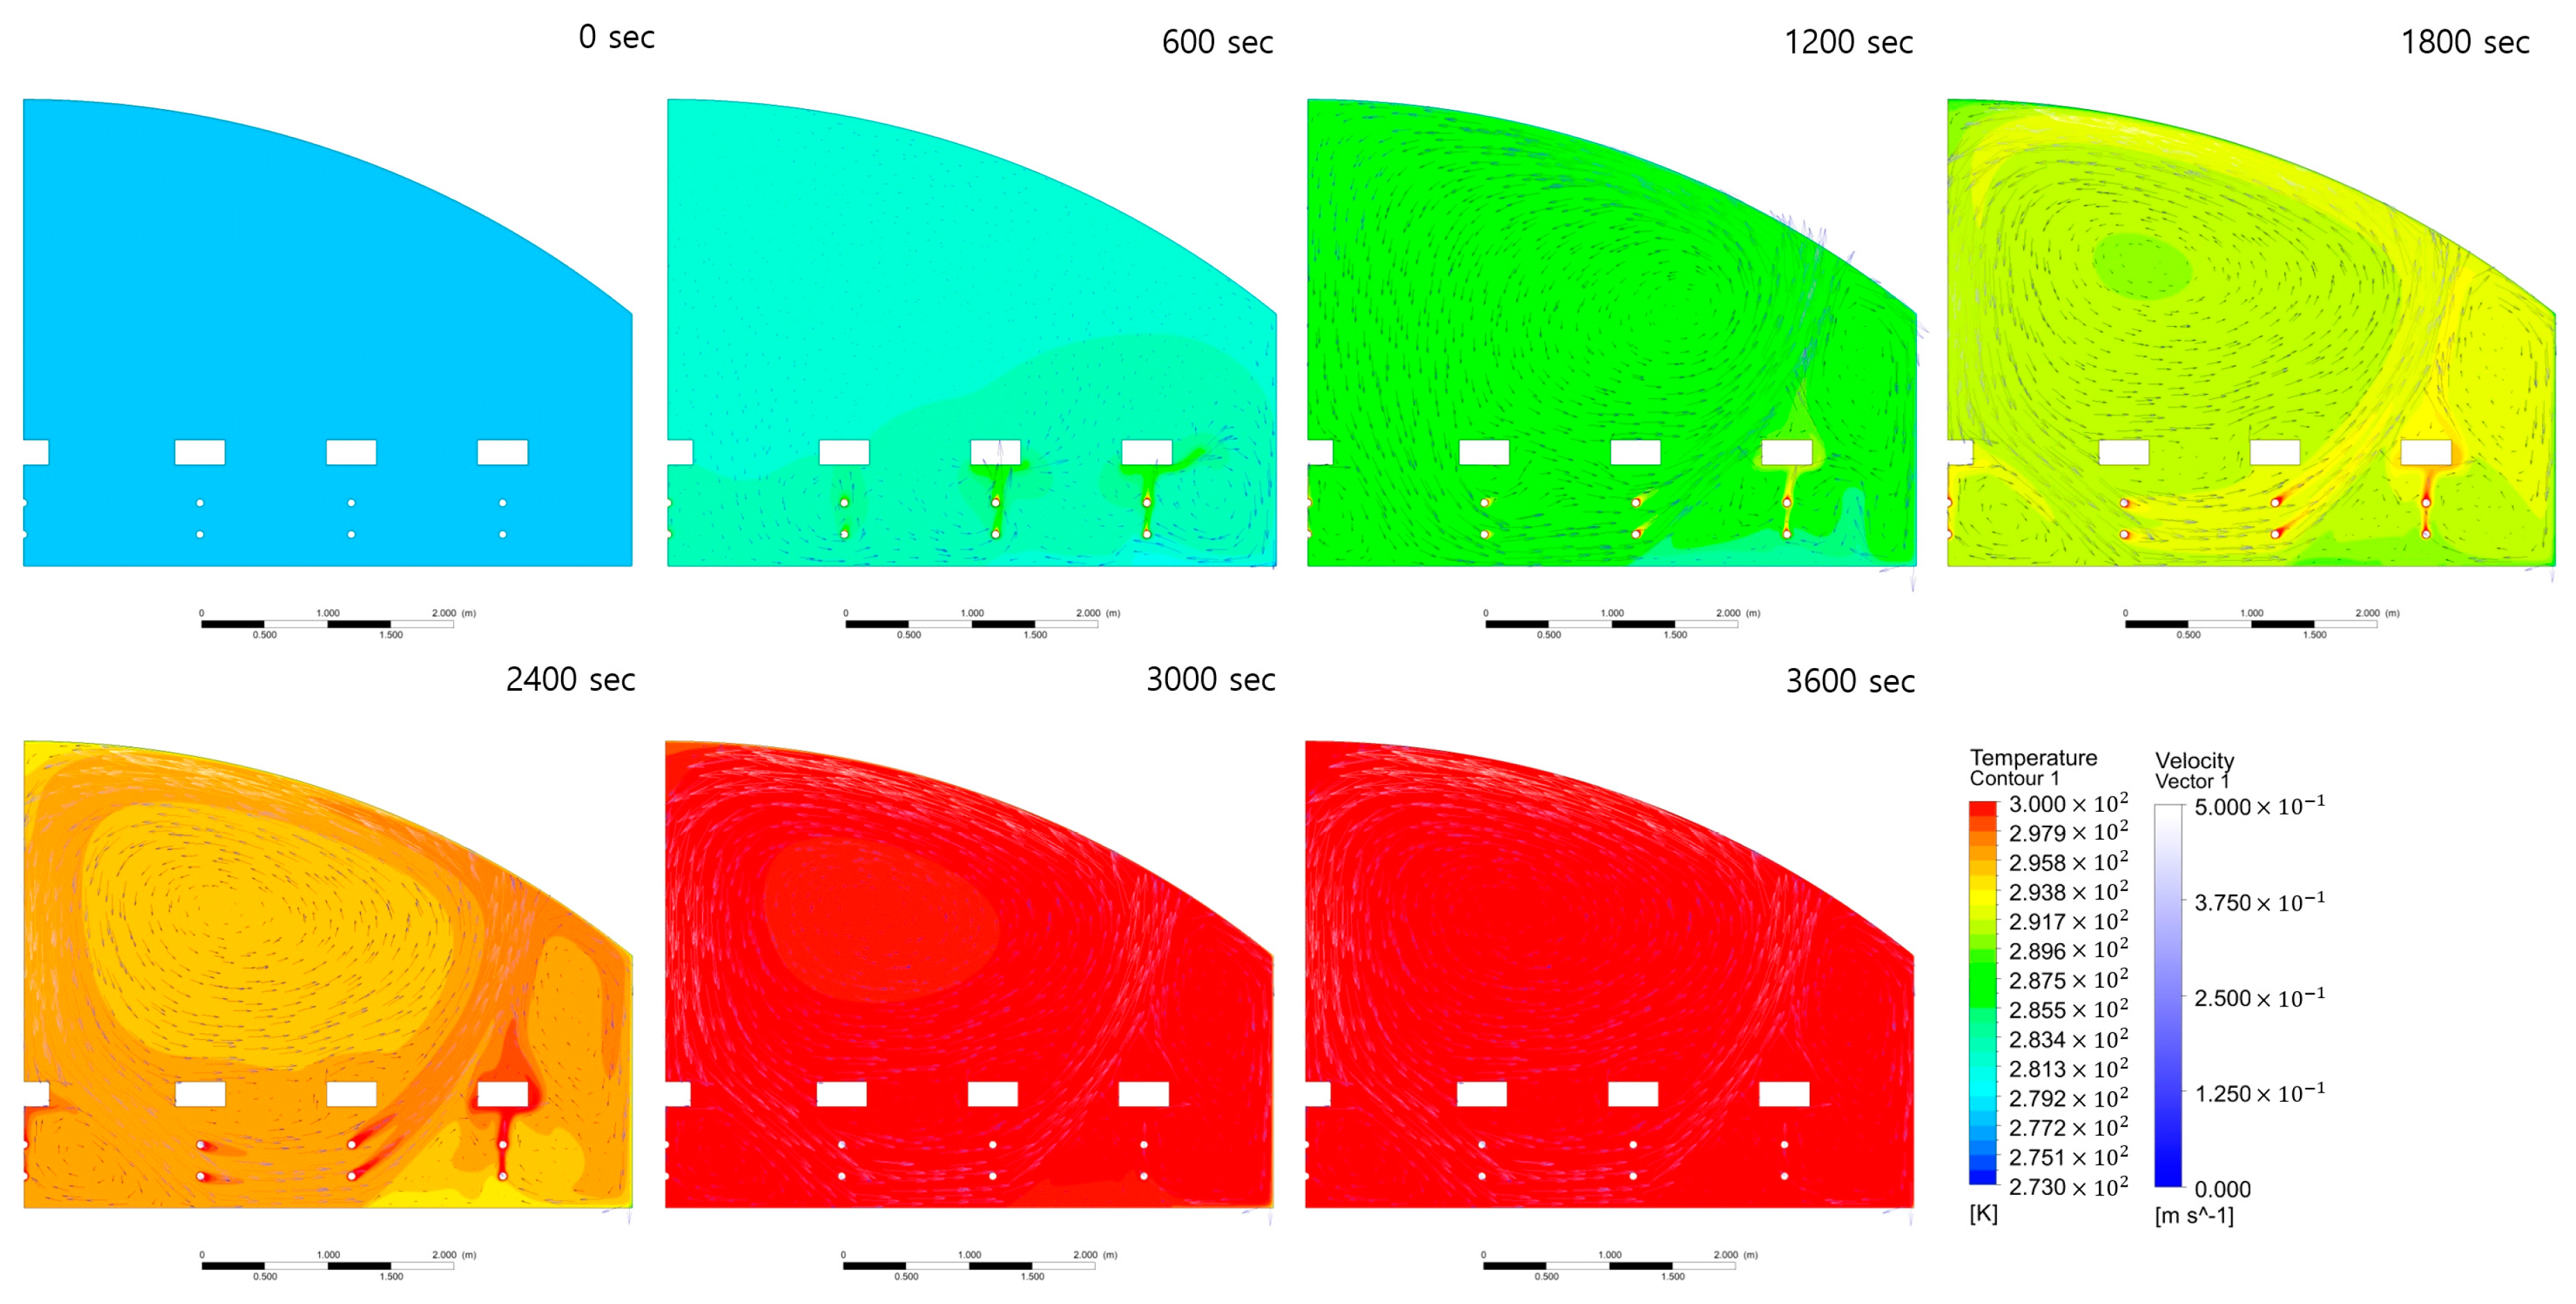
In order to make an assessment for the energy saving mechanism with the adoption of varying heat flux control for each bed, a computational fluid dynamics (CFD) simulation has been performed using commercial software of FLUENT, and the results are compared in Figure 22 and Figure 23. The simulation was conducted for the condition of the same amount of heat flux supply for both cases. It is worthy to note that the total amount of heat supplied to a greenhouse is the same, but the thermodynamic or fluid dynamic phenomena, including the degree of uniformity, are shown to be quite different according to the variation of the local heat flux to each bed. As for the varying heat flux for each bed, it was adjusted to be increasing as it approached the side walls. It is interesting to note that the varying heat flux operating control can shorten the time to the reach target temperature inside a greenhouse, as shown in Figure 23, by about 600 s, and the air flow pattern differs in that different heat flux controls lead to a counter clockwise tumble flow pattern, with an additional clockwise one at the side wall. On the other hand, for the case of the same heat flux control for each bed, a wide and single clockwise tumble flow pattern is observed. From the comparison, it can be hypothesized that the temperature non-uniformity is mainly caused by the chilled air due to the heat loss by cold outside air infiltration at the side wall, which is convected into the central part of the greenhouse. However, when more heat flux was imposed on the bed near the side wall, a kind of thermal barrier forms to prevent the cold air from being penetrated easily into the central part. However, more rigorous CFD simulations for a variety of operating conditions, including the three-dimensional effect, are highly desired to be performed in further study.
4. Conclusions
In this study, the new concept of qualitative control variable, the degree of uniformity, is proposed for seeking enhanced cultivating performance, being higher crop yield and better quality. A more precise sensing or monitoring system with higher spatial resolution is introduced with the multiple sensor nodes system based on a wireless sensor network, instead of the conventional monitoring system with a sole sensor node to cover a large cultivating area, for which the proposed qualitative control variable—the degree of uniformity—cannot be estimated appropriately.
It is found out that there is a big difference in the degree of uniformity by the different heating systems—a hot air-based heating system and a hot water-based heating system—for the test cases of a greenhouse. A simple substitution for a hot water-based heating system can make a significant improvement to the degree of uniformity, more or less 80%, by providing more thermally stable conditions with less temperature fluctuation. This improved level of uniformity with the hot water-based heating system is due largely to the change of the dominant heat transfer mode, from the forced convective heat transfer to the radiative or natural convective one, and the continuous supply of local heat flux by the hot water, that remains in the pipe even after the set temperature is achieved, seems to contribute to form a thermally-stable condition to some extent. The additional counter measure to control the local heat flux independently for each bed is able provide a supplementary reduction of non-uniformity up to 90%, effectively, as compared to the equal heat flux for each bed. It is worthy to note that this local heat flux control can be effectively executed only when the state of local thermal condition—the degree of uniformity in this study—is informed properly by the multiple sensor nodes system. Among the variants of counter measures of local heat flux variation for the hot water-based heating system, the hydraulic proportional mass flow control valve, with two-step average value, showed the best performance, with the additional reduction of its non-uniformity to half of the level for other variants of local heat flux variation. It can be highlighted that it was also verified that the thermally stable condition inside a greenhouse, with the concept of a qualitative variable and corresponding control—the degree of uniformity—can also bring about the energy cost reduction along with the crop yield improvement, about 30%, simultaneously, in this study. It means that the provision of a more stable thermal condition (i.e., higher level of thermal uniformity) is quite crucial in order to secure economic benefits in greenhouse horticulture, by attaining an enhanced crop yield and reduced energy costs simultaneously.
In summary, the new concept of qualitative control variable—the degree of uniformity—is proposed and its behavior and dynamic features according to the control of the variants of counter measures in a greenhouse has been investigated experimentally with the auxiliary simulation approach, using precise sensing data from a multiple sensor nodes system. The improved stable thermal environment in a greenhouse is proven to be beneficial, in that one can attain both crop yield improvement and energy cost reduction simultaneously, to be able to compensate for the initial investment cost increase from installing a hot water-based heating pipe system and multiple sensors, etc. In further study, the behavior and characteristics for other main control variables, such as a humidity and CO2 concentration, is to be investigated, and the effects of this approach on real crop yield improvement, including quality of the crop, will also be verified from a demonstration in real cultivating conditions.
Author Contributions
Conceptualization, M.C. and Y.-H.I.; Methodology, K.-Y.S.; Validation, C.K.L., S.-W.Y. and Y.-H.I.; Formal Analysis, C.K.L. and S.-W.Y.; Writing-Original Draft Preparation, C.K.L.; Writing-Review & Editing, K.-Y.S. and Y.-H.I.; Supervision, M.C. and Y.-H.I.
Funding
This work was supported by the National Research Council of Science & Technology (NST) grant by the Korea government (MSIP) (No. CRC-15-01-KIST).
Conflicts of Interest
The authors declare no conflict of interest.
References
- Kim, Y.J. Agricultural and Rural Energy Policies in Major Countries. World Agric. 2015, 182, 1–13. [Google Scholar]
- National Intelligence Council. Global Trends 2030: Alternative Worlds; National Intelligence Council: Washington, DC, USA, 2012; pp. 31–35.
- Laso, J.; Hoehn, D.; Margallo, M.; García-Herrero, I.; Batlle-Bayer, L.; Bala, A.; Fullana-i-Palmer, P.; Vázquez-Rowe, I.; Irabien, A.; Aldaco, R. Assessing Energy and Environmental Efficiency of the Spanish Agri-Food System Using the LCA/DEA Methodology. Energies 2018, 11, 3395. [Google Scholar] [CrossRef]
- Djojodihardjo, H.; Ahmad, D. Opportunities and Challenges for Climate-Smart Agriculture. In Proceedings of the 3rd International Conference on Natural Resource Management (NRM ’15), New Delhi, India, 10–13 February 2015. [Google Scholar]
- Jeong, E.M.; Lee, U.Y. Research Report R614-2 Energy Utilization in Agricultural Sector; Korea Rural Economic Institute: Seoul, Korea, 2010; pp. 5–12. [Google Scholar]
- Kim, Y.J.; Park, S.H.; Han, H.S.; Park, Y.K. Research Report R740 Status of Energy Utilization in Agriculture, Rural, and Policies; Korea Rural Economic Institute: Seoul, Korea, 2014; pp. 19–29, 59–74. [Google Scholar]
- Marketing Report—Global Smart Greenhouse Market 2016–2020. Available online: https://www.businesswire.com/news/home/20161007005274/en/Smart-City-Market-Grow-Tremendously-CAGR-Close (accessed on 3 August 2018).
- Kim, Y.H. Smart Farm & Smart Water Management; Korea Rural Community Corporation-Rural Research Institute: Seoul, Korea, 2018. [Google Scholar]
- Kim, B.R. Smart Farm—The Convergence of Agriculture and ICT, Convergence Weekly TIP; Convergence Research Policy Center: Seoul, Korea, 2016; pp. 6–9. [Google Scholar]
- Kang, C.Y.; Seo, D.S. Research Report—A Study on the Development of the Horticultural Production Materials Industry; Korea Rural Economic Institute: Seoul, Korea, 2015; pp. 13–14. [Google Scholar]
- Choi, B.O.; Jeong, E.M.; Kim, D.K.; Shin, Y.S.; Kim, H.S. Research Report—A Study on the Improvement of the System and Development Plan for the Horticultural Industry; Korea Rural Economic Institute: Seoul, Korea, 2017; pp. 11–16. [Google Scholar]
- Stallen, M.; van Ulffen, R. Greenhouse Sector Study South Korea; Final Report; Ministry of Agriculture, Nature and Food Quality: Wageningen, The Netherland, 2006.
- Choi, S.; Hinkle, A.F. Korea’s Controlled Horticulture; USDA Foreign Agricultural Service Gain Report; USDA: Washington, DC, USA, 2018.
- Park, H.M. The Present Situation of Horticultural Industry and Policy Implications; Korea Society for Horticulture Science: Seoul, Korea, 2016; Volume 34, p. 37. [Google Scholar]
- Jiaqiang, Y.; Yulong, J.; Jian, G. An Intelligent Greenhouse Control System. Telkomnika 2013, 11, 4627–4632. [Google Scholar] [CrossRef]
- Nicolosi, G.; Volpe, R.; Messineo, A. An Innovative Adaptive Control System to Regulate Microclimatic Conditions in a Greenhouse. Energies 2017, 10, 722. [Google Scholar] [CrossRef]
- Su, Y.; Xu, L.; Goodman, E.D. Greenhouse Climate Fuzzy Adaptive Control Considering Energy Saving. Int. J. Control Autom. Syst. 2017, 15, 1936–1948. [Google Scholar] [CrossRef]
- Castilla, N.; Montero, J.I. Environmental Control and Crop Production in Mediterranean Greenhouses. Acta Hortic. 2008, 797, 25–36. [Google Scholar] [CrossRef]
- Baeza, E.J.; Stanghellini, C.; Castilla, N. Protected Cultivation in Europe. Acta Hortic. 2013, 987, 11–27. [Google Scholar] [CrossRef]
- Kang, S.; Kang, Y.; Paek, Y.; Kim, Y.; Kim, Y. Analysis of Energy Consumption in Agricultural Facilities. In Proceedings of the Korean Society for New and Renewable Energy Conference, Seoul, Korea, 23 February 2017; p. 293. [Google Scholar]
- Choi, C.K.; Park, J.S.; Park, S.Y.; Bae, H.H.; Lee, N.R. Research Report—An Analysis of Management Situation for the Major Greenhouse Horticultural Crops in Types of Heating Facilities; Rural Development Administration: Suwon, Korea, 2014; pp. 8–28. [Google Scholar]
- Korea Energy Economics Institute. 2014 Energy Consumption Survey; Korea Energy Economics Institute: Seoul, Korea, 2015; pp. 125–130. [Google Scholar]
- Man, H.C.; Thorp, K.R.; Shamshiri, R.R.; Ahmad, D.; Taheri, S.; Jones, J.W. Review of optimum temperature, humidity, and vapour pressure deficit for microclimate evaluation and control in greenhouse cultivation of tomato: A review. Int. Agrophys. 2018, 32, 287–302. [Google Scholar] [CrossRef]
- Atia, D.M.; El-Madany, H.T. Analysis and design of greenhouse temperature control using adaptive neuro-fuzzy inference system-NC-ND license (http://creativecommons.org/licenses/by-nc-nd/4.0/). J. Electr. Syst. Inf. Technol. 2017, 4, 34–48. [Google Scholar] [CrossRef]
- Trigui, M.; Barrington, S.; Gauthier, L. A Strategy for Greenhouse Climate Control, Part I: Model Development. J. Agric. Eng. Res. 2001, 78, 407–413. [Google Scholar] [CrossRef]
- Javadi Kia, P.; Tabatabaee Far, A.; Omid, M.; Alimardani, R.; Naderloo, L. Intelligent Control Based Fuzzy Logic for Automation of Greenhouse Irrigation System and Evaluation in Relation to Conventional Systems. World Appl. Sci. J. 2009, 6, 16–23. [Google Scholar]
- Radojević, N.; Kostadinović, D.; Vlajković, H.; Veg, E. Microclimate control in greenhouses. FME Trans. 2014, 42, 167–171. [Google Scholar] [CrossRef] [Green Version]
- Sethi, V.P.; Sumathy, K.; Lee, C.; Pal, D.S. Thermal modeling aspects of solar greenhouse microclimate control: A review on heating technologies. Sol. Energy 2013, 96, 56–82. [Google Scholar] [CrossRef]
- Vadiee, A.; Martin, V. Energy analysis and thermoeconomic assessment of the closed greenhouse - The largest commercial solar building. Appl. Energy 2013, 102, 1256–1266. [Google Scholar] [CrossRef]
- Rasheed, A.; Lee, J.W.; Lee, H.W. A Review of Greenhouse Energy Management by Using Building Energy Simulation. Prot. Hortic. Plant Fact. 2016, 24, 317–325. [Google Scholar] [CrossRef]
- Ha, T.; Lee, I.B.; Kwon, K.S.; Hong, S.W. Computation and field experiment validation of greenhouse energy load using building energy simulation model. Int. J. Agric. Biol. Eng. 2016, 8, 116–127. [Google Scholar] [CrossRef]
- Tadj, N.; Nahal, M.A.; Draoui, B.; Constantinos, K. CFD simulation of heating greenhouse using a perforated polyethylene ducts. Int. J. Eng. Syst. Model. Simul. 2017, 9, 3. [Google Scholar] [CrossRef]
- Couto, N.; Rouboa, A.; Monteiro, E.; Viera, J. Computational Fluid Dynamics Analysis of Greenhouses with Artificial Heat Tube. World J. Mech. 2012, 02, 181–187. [Google Scholar] [CrossRef]
- Korean Electric Power Corporation. Statics of Electric Power in Korea; Korean Electric Power Corporation: Seoul, Korea, 2018. [Google Scholar]
- Gupta, M.J.; Chandra, P. Effect of greenhouse design parameters on conservation of energy for greenhouse environmental control. Energy 2002, 27, 777–794. [Google Scholar] [CrossRef]
- Spanomitsios, G.K. Temperature Control and Energy Conservation in a Plastic Greenhouse. J. Agric. Eng. Res. 2001, 80, 251–259. [Google Scholar] [CrossRef]
- Shen, Y.; Wei, R.; Xu, L. Energy Consumption Prediction of a Greenhouse and Optimization of Daily Average Temperature. Energies 2018, 11, 65. [Google Scholar] [CrossRef]
- Pawlowski, A.; Guzman, J.L.; Rodríguez, F.; Berenguel, M.; Sánchez, J.; Dormido, S. Simulation of Greenhouse Climate Monitoring and Control with Wireless Sensor Network and Event-Based Control. Sensors 2009, 9, 232–252. [Google Scholar] [CrossRef] [PubMed] [Green Version]
- E+E Elektronik. Available online: https://www.epluse.com/ko/products/humidity-instruments/wireless-sensors-1/ee244/ (accessed on 27 March 2017).
Figure 1.
The view of experimental test greenhouse A (Case 1).

Figure 2.
The view of experimental test greenhouse B (Case 2).

Figure 3.
Schematic diagram of hot water supply heating system for Case 1 (greenhouse A).

Figure 4.
Schematic diagram of hot water supply heating system for Case 2.

Figure 5.
Schematic for greenhouse indoor environmental data collecting system.

Figure 6.
Normal distribution of sensor data graph.

Figure 7.
Twenty sensing points in one plane (temperature/humidity/CO2).

Figure 8.
Twenty sensing points in longitudinal direction (temperature/humidity/CO2).

Figure 9.
Temperature profiles of greenhouse A for different heat supply systems, A1 and A2 in Table 2.
Figure 9.
Temperature profiles of greenhouse A for different heat supply systems, A1 and A2 in Table 2.

Figure 10.
The climatic data from the experimental day of Case 1. (a) Outdoor temperature; (b) Wind speed; (c) Humidity of air; (d) Solar irradiation; (e) Wind direction.
Figure 10.
The climatic data from the experimental day of Case 1. (a) Outdoor temperature; (b) Wind speed; (c) Humidity of air; (d) Solar irradiation; (e) Wind direction.

Figure 11.
Raw temperature data of Case 1. (a) Hot air based system temperature; (b) Hot water based system temperature.
Figure 11.
Raw temperature data of Case 1. (a) Hot air based system temperature; (b) Hot water based system temperature.

Figure 12.
Temperature distribution of Case 1 (A1) and Case 1 (A2) (heating stage).

Figure 13.
Temperature changes due to time variation in Case 1 (A1) and Case 1 (A2).

Figure 14.
Comparison of the degree of uniformity by the variants of control measures (Case 1).

Figure 15.
Comparison of the fuel consumption of Case 1 (A1 and A2).

Figure 16.
Images of the pump and valves installation for heating control in greenhouse B (Case 2).

Figure 17.
Profiles of temperature variation by the variants of control measures (Case 2).

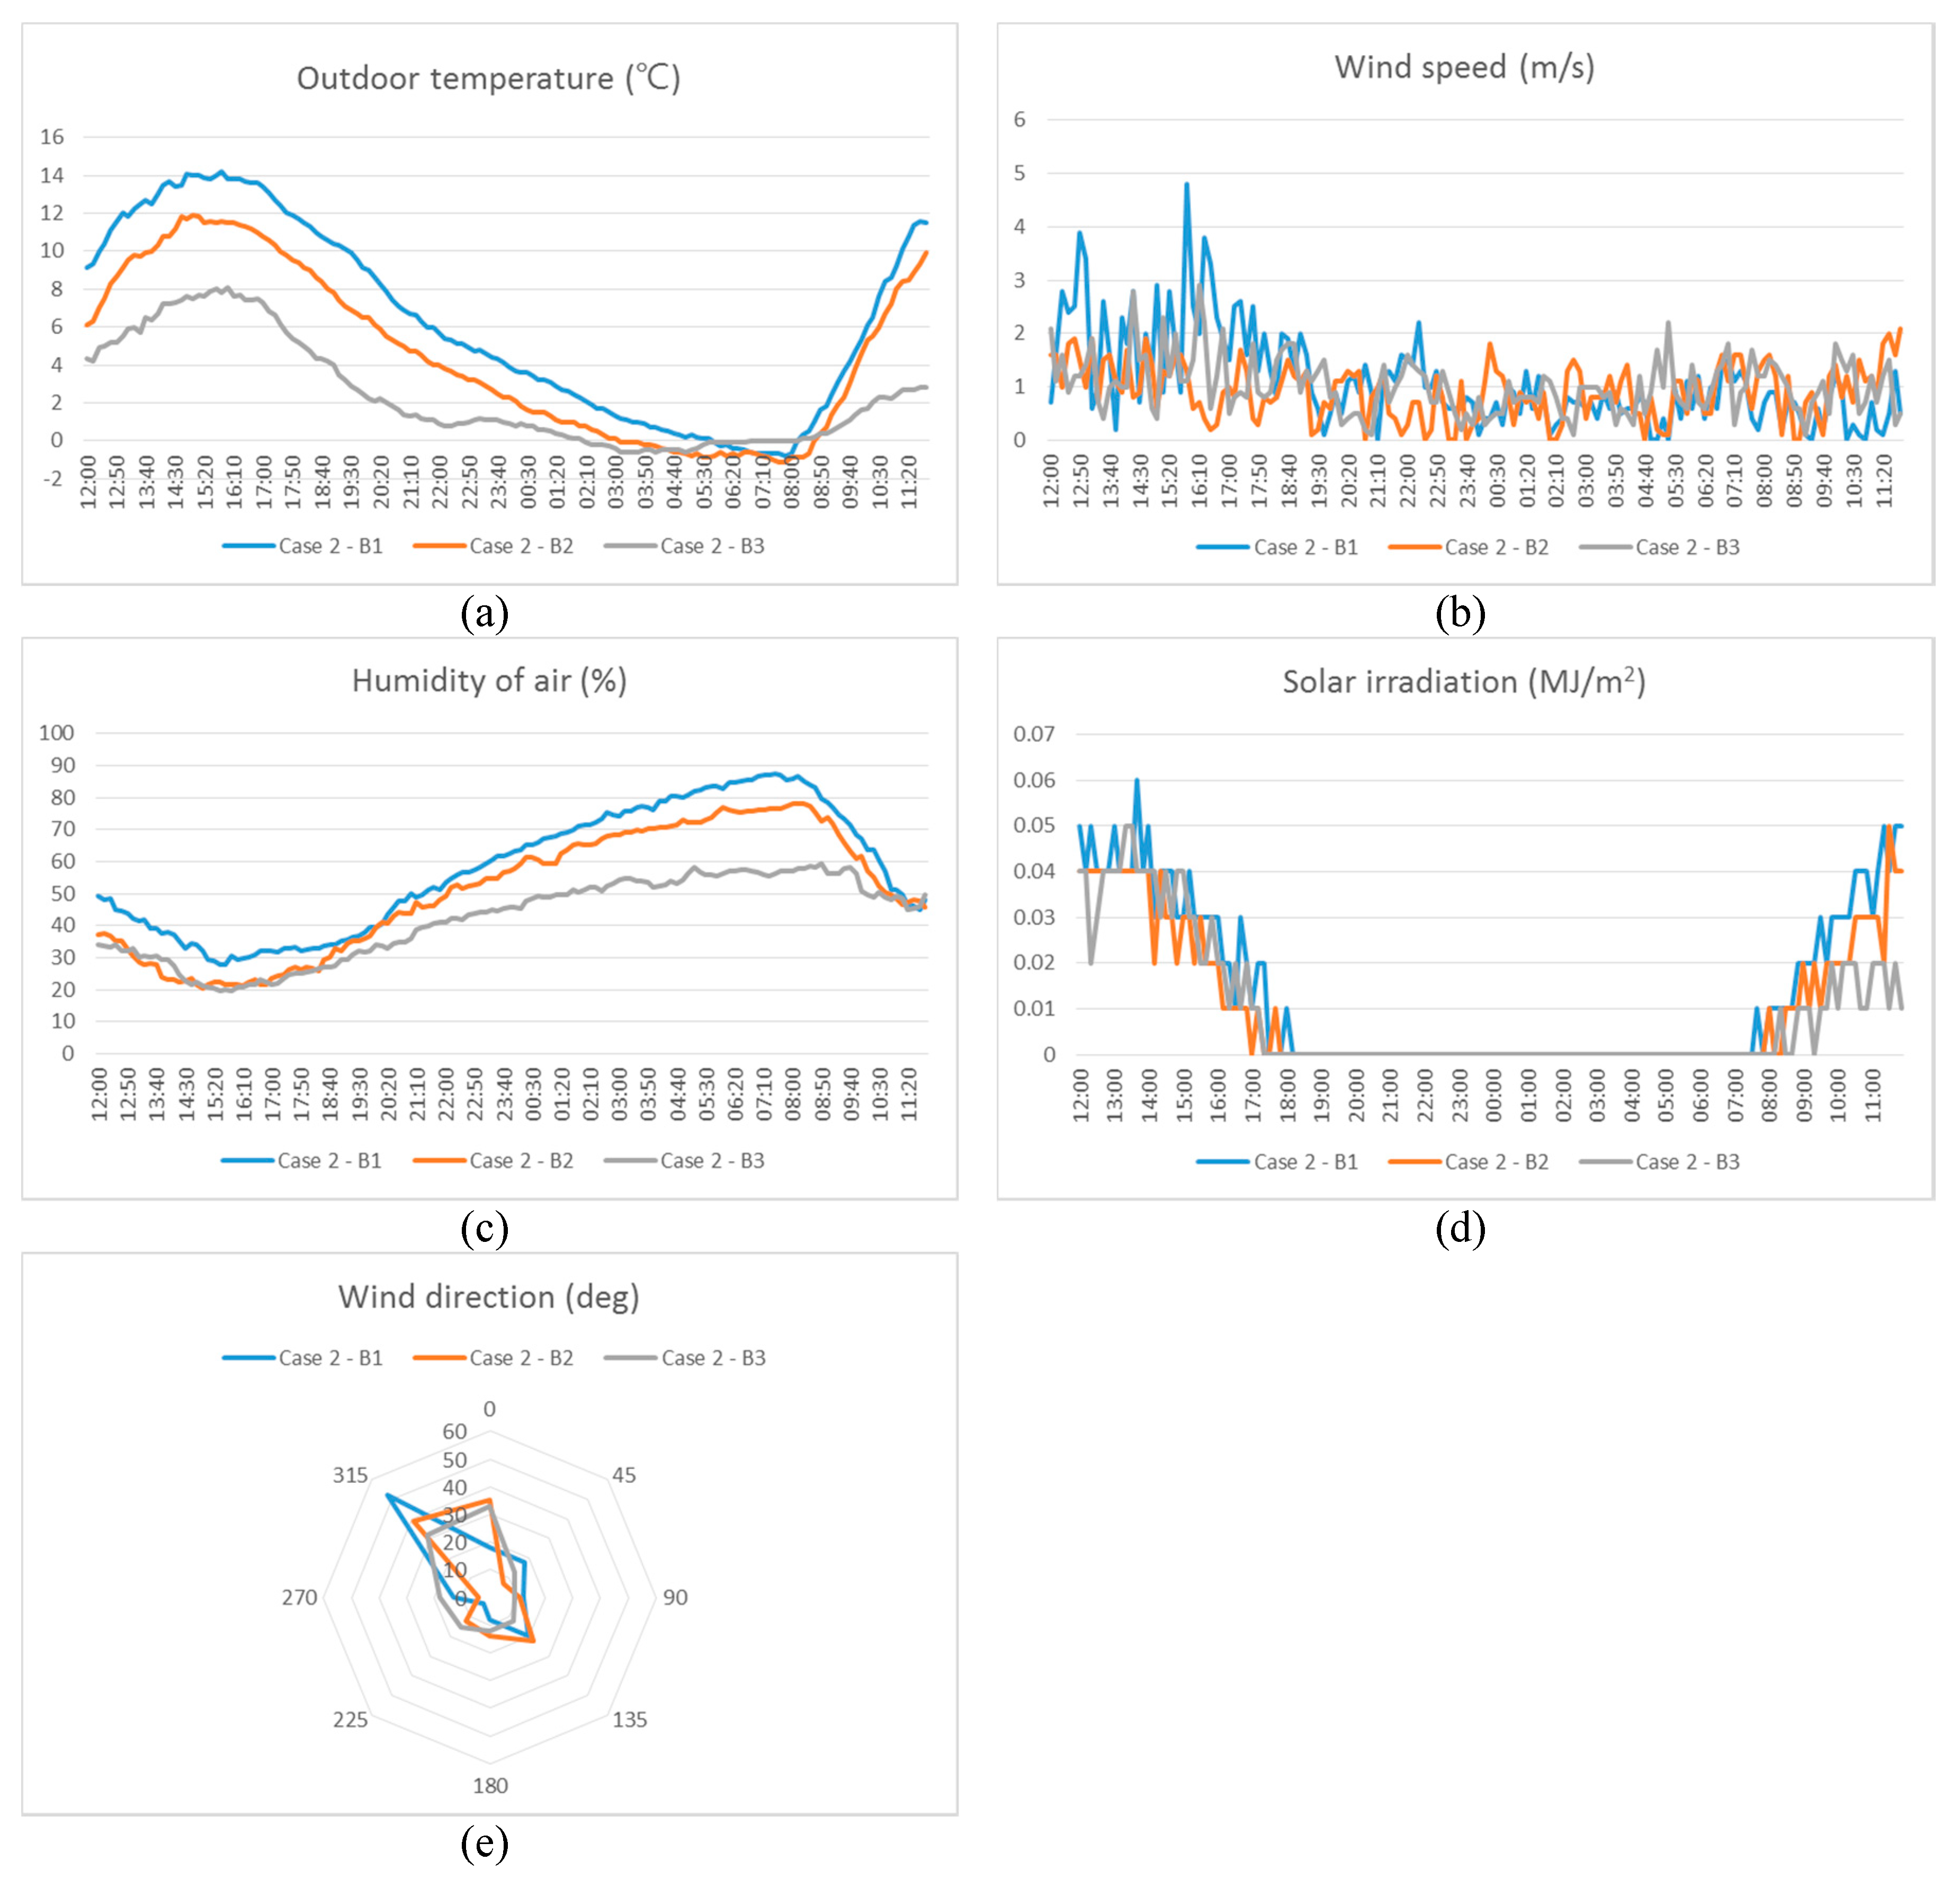
Figure 18.
The climatic data of the experimental day of Case 1. (a) Outdoor temperature; (b) Wind speed; (c) Humidity of air; (d) Solar irradiation; (e) Wind direction.
Figure 18.
The climatic data of the experimental day of Case 1. (a) Outdoor temperature; (b) Wind speed; (c) Humidity of air; (d) Solar irradiation; (e) Wind direction.

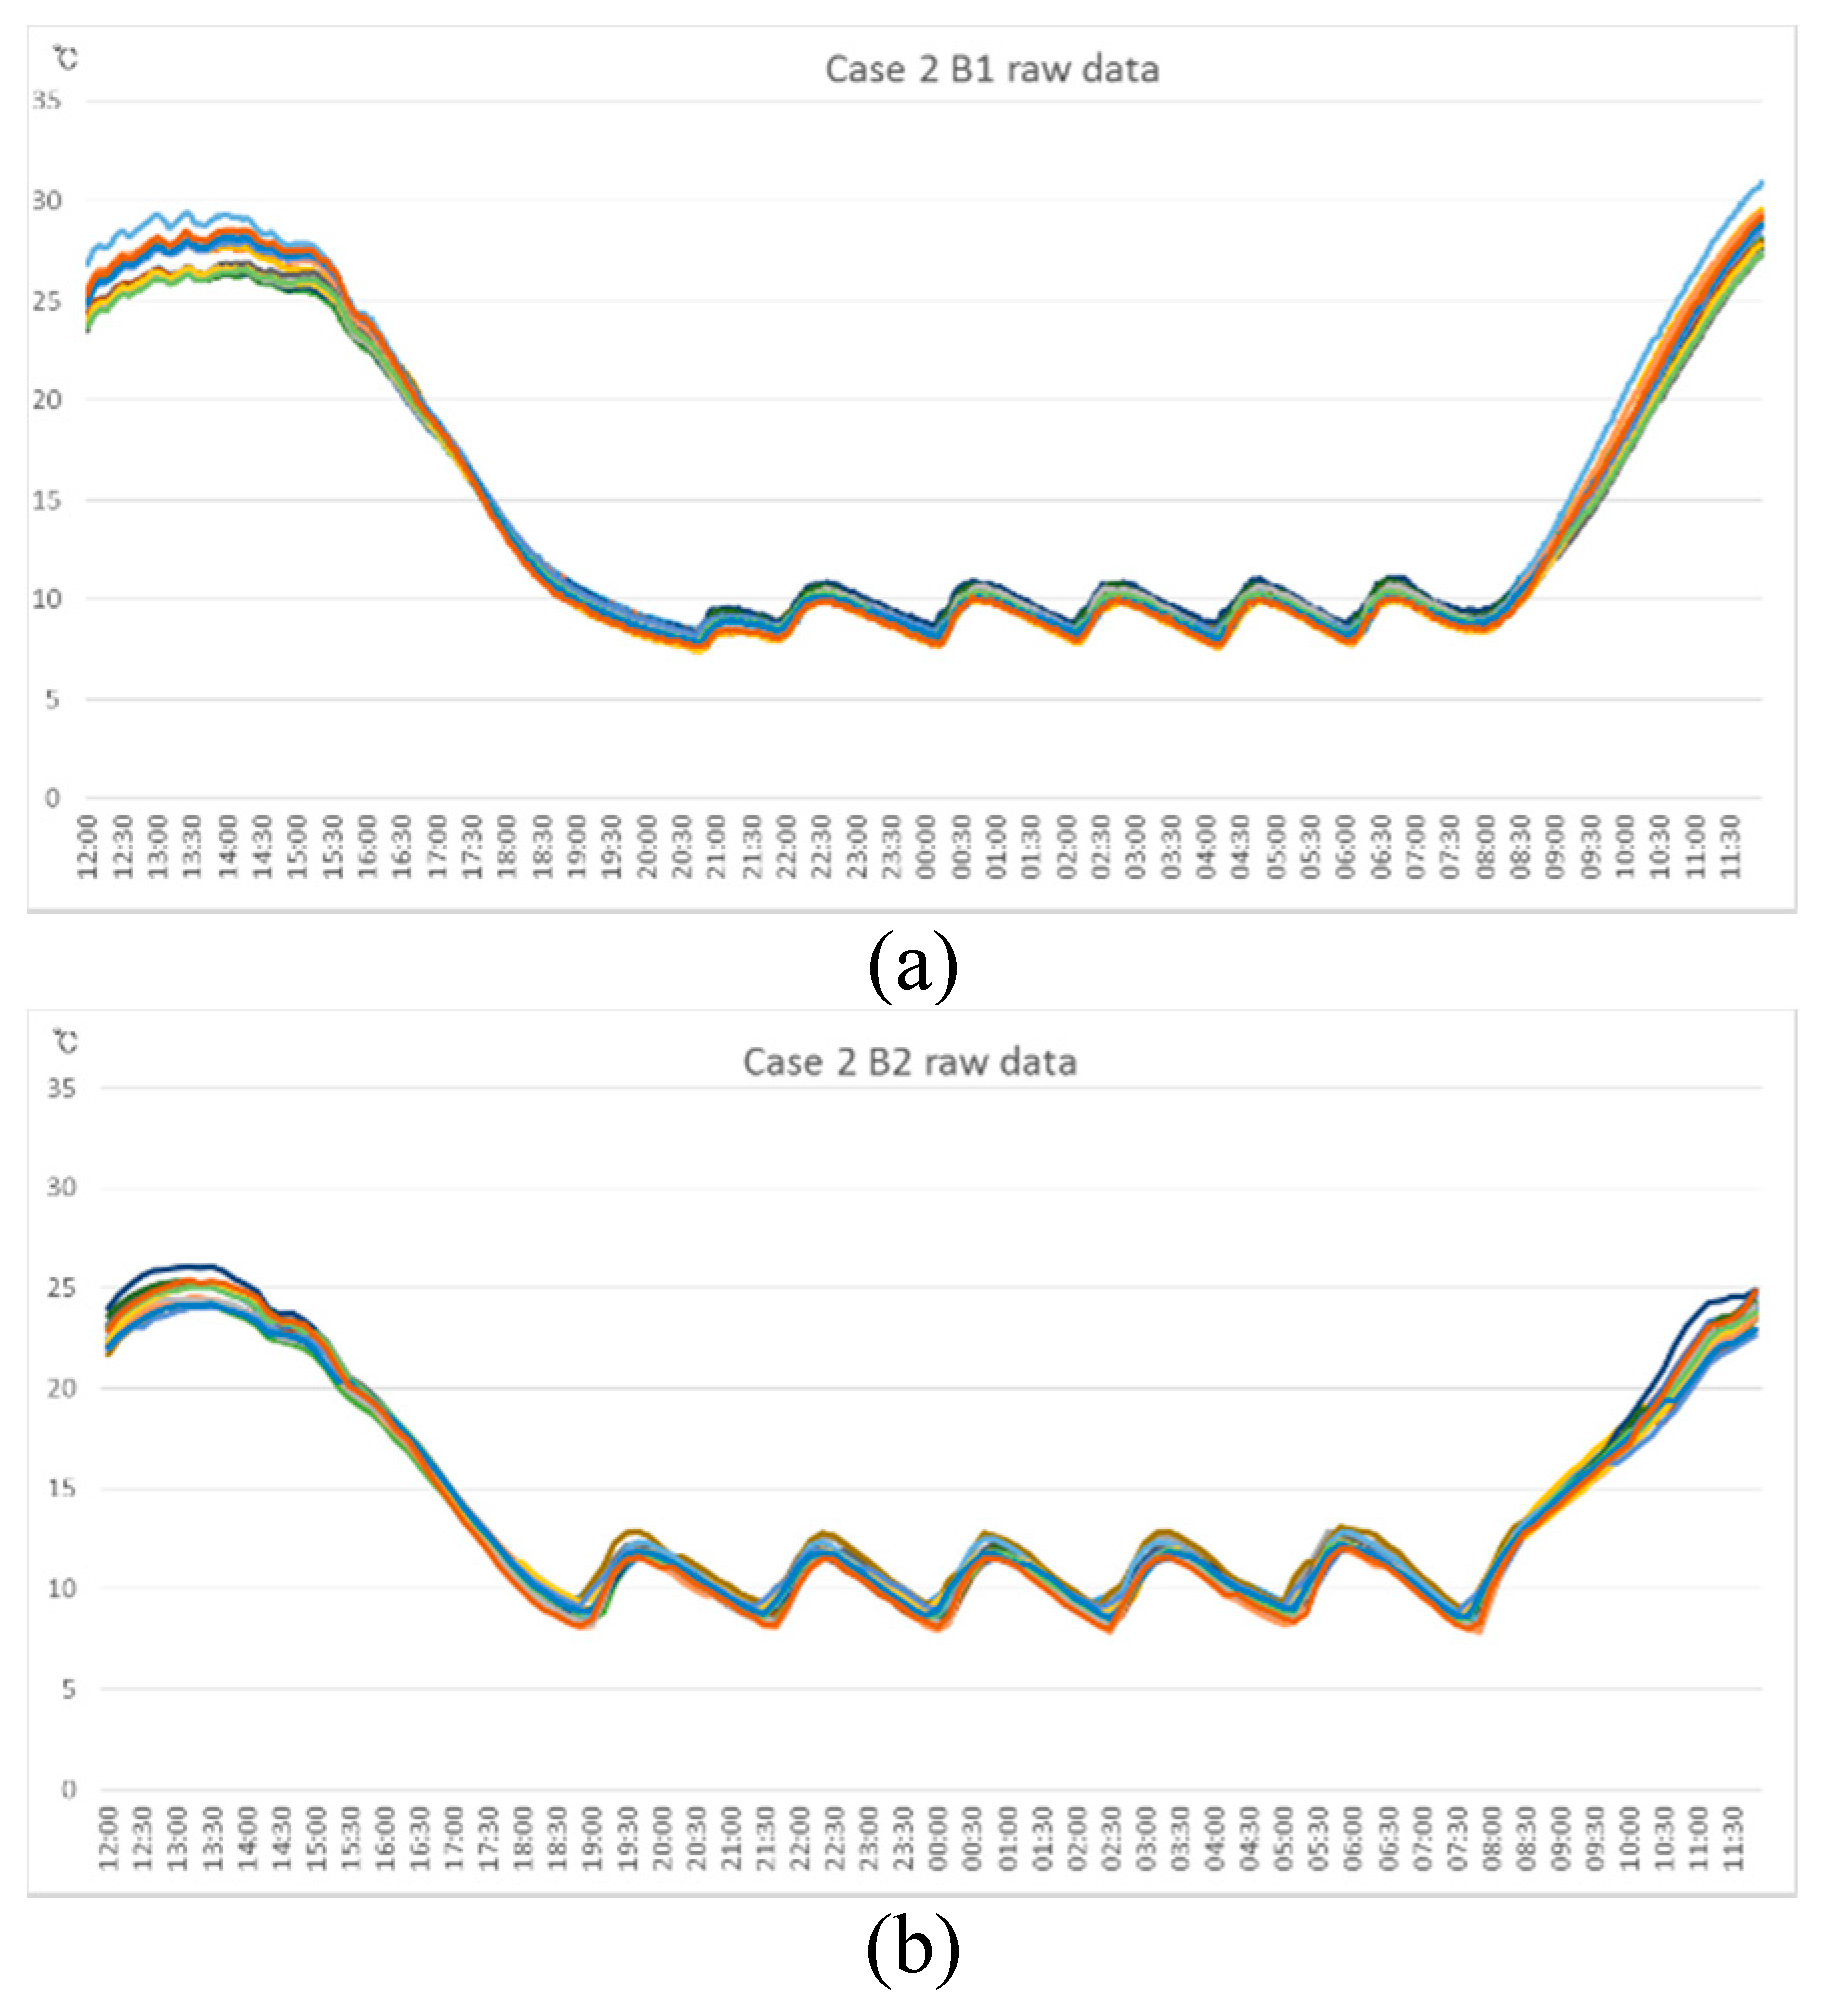
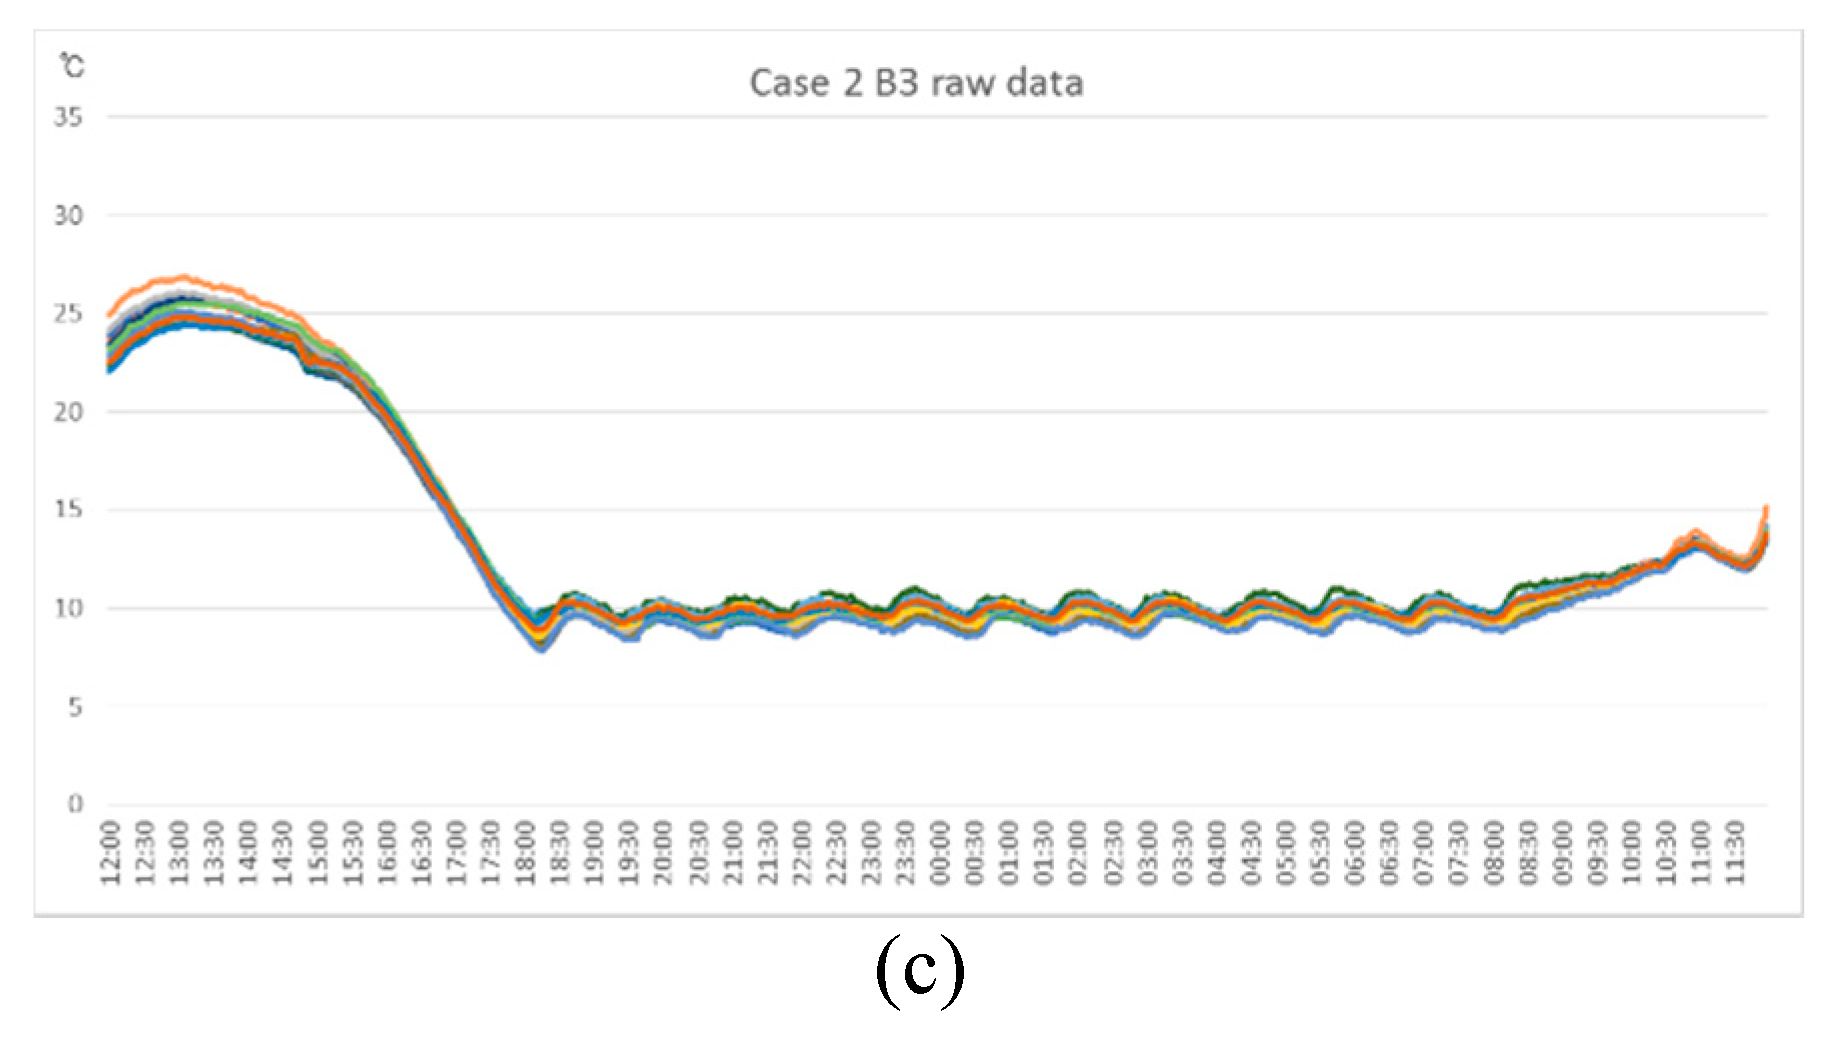
Figure 19.
Temperature measured data of different control measures of Case 2. (a) B1; (b) B2; (c) B3.
Figure 19.
Temperature measured data of different control measures of Case 2. (a) B1; (b) B2; (c) B3.


Figure 20.
Comparison of the degree of uniformity by the variants of control measures (Case 2).

Figure 21.
Comparison of the variation for the degree of uniformity for the variants of control measures of B1 and B3 (Case 2).
Figure 21.
Comparison of the variation for the degree of uniformity for the variants of control measures of B1 and B3 (Case 2).

Figure 22.
Temperature and air velocity distribution for the case of same heat flux for all beds.

Figure 23.
Temperature and air velocity distribution for the case of varying heat flux for each bed.
Figure 23.
Temperature and air velocity distribution for the case of varying heat flux for each bed.


Table 1.
Clarification of the variants of control measures for test cases.
| Case 1 (Greenhouse A) | Case 2 (Greenhouse B) | ||
|---|---|---|---|
| A1 | Hot air | B1 | Hot water (pump on–off by bed) |
| A2 | Hot water (simultaneous supply) | B2 | Hot water (valve con. 1, linear control) |
| A3 | Hot water (pump on–off by bed) | B3 | Hot water (valve con. 2, two step avg. control) |
Table 2.
Sub-pipe specification of Case 1 and 2.
| Case 1 | Case 2 | |
|---|---|---|
| Pipe outer diameter and thickness | 60.5/3.91 mm | 42.7/3.58 mm |
| Total pipe length | 70 m × 7 line ×2 supply and return = 980 m | 23 m × 3 line × 2 supply and return = 138 m |
| Total area of heat radiation | 186 m2 | 19 m2 |
Table 3.
Specification of installed pump and proportional valve.
| Item | Specification |
|---|---|
| Pump Wilo PBI-D 803 MA | AC 3 phase motor pump 1.85 kW, 6.9 A, 60 Hz, 220 V, 220 L/min |
| Proportional Valve HSH–FLO DN32 2 Way SS304 | DC 24 V, 15 W Control signal: 4–20 mA (0–10 v/0–20 mA) |
Table 4.
Greenhouse temperature difference by location by the variants of control measures (Case 1).
Table 4.
Greenhouse temperature difference by location by the variants of control measures (Case 1).
| Temperature Difference (°C) | Case 1 – A1 | Case 1 – A2 | Case 1 – A3 |
|---|---|---|---|
| Front-Rear | 0.22 | 0.52 | 0.53 |
| Mid-Front | 2.97 | 0.55 | 0.36 |
| Mid-Rear | 2.75 | 0.03 | −0.17 |
Table 5.
Maximum and minimum temperature data by the variants of control measures (Case 2).
| Case 2 – B1 | Case 2 – B2 | Case 2 – B3 | |||||||
|---|---|---|---|---|---|---|---|---|---|
| Max. Temp | Min. Temp | Temp. diff | Max. Temp | Min. Temp | Temp. diff | Max. Temp | Min. Temp | Temp. diff | |
| 1st | 10.4 | 7.9 | 2.5 | 11.9 | 9.0 | 2.9 | 10.2 | 8.7 | 1.5 |
| 2nd | 10.4 | 8.1 | 2.3 | 11.9 | 8.8 | 3.1 | 10.1 | 9.0 | 1.1 |
| 3rd | 10.3 | 8.3 | 2.0 | 12.0 | 8.7 | 3.3 | 9.9 | 9.1 | 0.8 |
| 4th | 10.4 | 8.1 | 2.3 | 12.0 | 8.7 | 3.3 | 10.0 | 9.2 | 0.8 |
| 5th | 10.5 | 8.2 | 2.3 | 12.3 | 8.9 | 3.4 | 10.1 | 9.2 | 0.9 |
| 6th | 10.3 | 8.8 | 1.5 | 10.1 | 9.2 | 0.9 | |||
| 7th | 10.0 | 9.2 | 0.8 | ||||||
| 8th | 10.2 | 9.1 | 1.1 | ||||||
| 9th | 10.2 | 9.2 | 1.0 | ||||||
| 10th | 10.1 | 9.2 | 0.9 | ||||||
| 11th | 10.1 | 9.2 | 0.9 | ||||||
| 12th | 10.0 | 9.3 | 0.7 | ||||||
| Avg. | 10.4 | 8.2 | 2.2 | 12.0 | 8.8 | 3.2 | 10.1 | 9.1 | 1.0 |
© 2019 by the authors. Licensee MDPI, Basel, Switzerland. This article is an open access article distributed under the terms and conditions of the Creative Commons Attribution (CC BY) license (http://creativecommons.org/licenses/by/4.0/).
Share and Cite
MDPI and ACS Style
Lee, C.K.; Chung, M.; Shin, K.-Y.; Im, Y.-H.; Yoon, S.-W. A Study of the Effects of Enhanced Uniformity Control of Greenhouse Environment Variables on Crop Growth. Energies 2019, 12, 1749. https://doi.org/10.3390/en12091749
AMA Style
Lee CK, Chung M, Shin K-Y, Im Y-H, Yoon S-W. A Study of the Effects of Enhanced Uniformity Control of Greenhouse Environment Variables on Crop Growth. Energies. 2019; 12(9):1749. https://doi.org/10.3390/en12091749
Chicago/Turabian StyleLee, Chan Kyu, Mo Chung, Ki-Yeol Shin, Yong-Hoon Im, and Si-Won Yoon. 2019. "A Study of the Effects of Enhanced Uniformity Control of Greenhouse Environment Variables on Crop Growth" Energies 12, no. 9: 1749. https://doi.org/10.3390/en12091749
Note that from the first issue of 2016, this journal uses article numbers instead of page numbers. See further details here.