Article

Experimental Investigation of Ventilation Performance of Different Air Distribution Systems in an Office Environment—Heating Mode

Department of Building Engineering, Energy Systems and Sustainability Science, University of Gävle, 801 76 Gävle, Sweden
*
Author to whom correspondence should be addressed.
Energies 2019, 12(10), 1835; https://doi.org/10.3390/en12101835
Submission received: 30 April 2019 / Revised: 9 May 2019 / Accepted: 12 May 2019 / Published: 15 May 2019
(This article belongs to the Special Issue Energy Performance and Indoor Climate Analysis in Buildings)

Abstract

:
A vital requirement for all-air ventilation systems are their functionality to operate both in cooling and heating mode. This article experimentally investigates two newly designed air distribution systems, corner impinging jet (CIJV) and hybrid displacement ventilation (HDV) in comparison against a mixing type air distribution system. These three different systems are examined and compared to one another to evaluate their performance based on local thermal comfort and ventilation effectiveness when operating in heating mode. The evaluated test room is an office environment with two workstations. One of the office walls, which has three windows, faces a cold climate chamber. The results show that CIJV and HDV perform similar to a mixing ventilation in terms of ventilation effectiveness close to the workstations. As for local thermal comfort evaluation, the results show a small advantage for CIJV in the occupied zone. Comparing C2-CIJV to C2-CMV the average draught rate (DR) in the occupied zone is 0.3% for C2-CIJV and 5.3% for C2-CMV with the highest difference reaching as high as 10% at the height of 1.7 m. The results indicate that these systems can perform as well as mixing ventilation when used in offices that require moderate heating. The results also show that downdraught from the windows greatly impacts on the overall airflow and temperature pattern in the room.

1. Introduction

Ventilation is one of the core systems that has a large impact on thermal comfort and indoor air quality (IAQ) in buildings. The design and implementation of air distribution systems require careful consideration, not only in terms of providing a good indoor environment, but also to be energy efficient. On top of these requirements the ventilation system needs to operate adequately both during cold and warm seasons.
One common air distribution system is called mixing ventilation (MV). This system is characterized by supplying air at high velocity into the room with the intended purpose of mixing the fresh supply air with the room air. This type of ventilation supply inlet is usually located high, close to the ceiling in the unoccupied area of the room. MV also creates a highly uniform vertical temperature field [1,2] which can result in slightly lower ventilation effectiveness when compared to other systems, e.g., impinging jet ventilation (IJV) and displacement ventilation (DV) [3,4,5].
DV and IJV are usually categorized as stratified ventilation systems when utilized in cooling mode [6,7,8]. The air from a DV supply device enters the room at a relatively low speed and at low height close to the floor when used for cooling. When entering the room, the fresh air will fall to the floor and continue flowing outward until it encounters a heat source. It will then start to heat up and start rising due to buoyancy effects, moving upwards to the upper parts of the room [9,10]. IJV works similarly in that respect but it uses impinging air jet with relatively high velocity and momentum which is discharged downwards close to a wall section at a distance from the floor area. IJV has been classified by several researchers as a hybrid system [10,11,12] in that it combines the positive effects of both MV and DV to overcome the shortcomings of the DV system, e.g., the limitation in covering the entire floor area due to the low momentum. Another downside of DV is the difficulty of utilizing the system during cold season when heating is required [6,7,8].
Most of the research around these ventilation systems has been conducted for cooling mode in a hot climate [13,14,15]. However, it is interesting to evaluate the IJV system when heating is required in a cold climate. Very few studies have been done to examine the ventilation performance of the IJV system when it operates in heating mode. Some researchers have stated that IJV can be used for heating due to its high momentum [9,16].
In a numerical study done by Ye et al. [17] they compared MV and IJV in order to evaluate the energy performance when used for heating in a large space with a high ceiling. Their results showed that IJV required less energy than MV for heating fresh air and re-circulating the return air. However, the fan power required more energy than MV. Adding these energy demands, the total heating energy usage for IJV was lower than that for MV. They concluded that the heating load index could be reduced by around 9–25 W/m2 when the outdoor air temperature was in the range of −5 to 12 °C. Another study [18] also concluded that IJV is more energy efficient than MV in heating mode. This study was carried out in a climate chamber 3.0 (L) x 3.6 (W) x 2.6 (H) m which was placed in a laboratory space. It is worth mentioning that this study also included intermittent opening of a door that caused cold outside air to invade the heating space. One interesting observation in these two studies [17,18] was that MV created greater thermal stratification than IJV, which is the opposite of when these systems are used in cooling mode [11,19].
There have not been many studies conducted to evaluate typical ventilation systems for heating mode. Some of these studies have been focused on building optimization and control system which also included the control of the air handling unit [20,21,22]. Others have evaluated specific supply devices, such as stratum ventilation used for heating [23] or a low-temperature all-air heating system in an office cubicle that was equipped with an active supply device on the ceiling [24].
Due to the novelty of this research and to the authors’ best knowledge there has not been any experimental research carried out to evaluate multiple IJV devices places in the corners of an office room for heating mode.
In a recent study Ameen et al. [19] evaluated and compared three different ventilation systems, corner impinging jet ventilation (CIJV), corner mixing ventilation (CMV) and DV. They evaluated heat removal effectiveness, local thermal comfort and indoor air quality in a mock-up medium-sized office room. The office contained two workstations, each with one mannequin and one piece of equipment. Nine different cases were examined with varying supply rates and heat sources. The results from this research showed that overall CIJV performed slightly better than the other two ventilation systems and there was a possibility of reducing the total energy usage. However, this research was conducted for summer cases, i.e., the systems were only evaluated for cooling mode.
The overall objective of this study is to continue the research done by Ameen et al. [19] and evaluate the same three types of air distribution systems for heating mode, i.e., winter conditions. The supply device for the DV evaluated in that study was a modified version that provided slightly higher supply velocity compared to traditional DV systems. This DV system is called hybrid displacement ventilation (HDV) in this study. These three different systems will be examined and compared to one another to evaluate their performance based on local thermal comfort and ventilation effectiveness in order to make an overall evaluation of their usability for both cooling and heating.

2. Theory and Mathematical Models

This section provides a brief overview and explanation of the key definitions of indoor climate indices which are used in this study. Since this study is a continuation of the experimental work done by Ameen et al. [19], a more in-depth explanation of these definitions can be found in that article.
According to ISO 7730 [25], draught rate (DR) describes the discomfort a person experiences due to unwanted cooling of the human body. This index is a function of air temperature, air velocity and turbulent intensity and predicts the percentage of dissatisfied due to draft. Another index, the percentage dissatisfied (PD), is related to the local discomfort due to high vertical air temperature between head and ankle. In this study the temperature difference, ∆T0.1–1.1 is used which is between ankle level (0.1 m) and neck level for a seated person (1.1 m).
Temperature effectiveness ( ε T ) [24] is an index that can be used to evaluate how effective space heating is in a space or location for heating mode. This is defined by
ε T = ( T i T o ) ( T i T ¯ 0.1 , 0.6 , 1.1 )   ,
where T i is the supply air temperature, T ¯ 0.1 , 0.6 , 1.1 is the arithmetic mean air temperature of the heights 0.1, 0.6 and 1.1 m and T o is the outlet air temperature. If ε T > 1, this indicates that the temperature in the occupied zone is higher than the outlet. If ε T < 1, this indicates that the temperature in the occupied zone is lower than the outlet which means lower utilization of the heat from the ventilation system to the occupied zone. For a perfect mixing ventilation system ε T = 1. This index is different from the one used in the cooling mode article [19] in that it can be used for heating mode.
The evaluation of ventilation effectiveness can be done in several ways. Two commonly used indexes related to IAQ are air exchange effectiveness (AEE) and air change effectiveness (ACE) [26,27,28]. The guidelines in ASHRAE Standard 129-1997 [26] require measuring ACE in 25% of the workstations or measuring a minimum of ten locations throughout the evaluated space. Another way to calculate AEE is to make measurements at the exhaust location. These indexes have been utilized by many researchers for evaluating indoor environments using different tracer gas techniques [29,30,31].
Inlet Archimedes number (Ari) [32,33] is a measure of the relative importance of buoyant and inertia forces. Ari is important in building airflows because it combines two important ventilation design parameters, supply air velocity and room temperature difference.

3. Experimental Set-Up

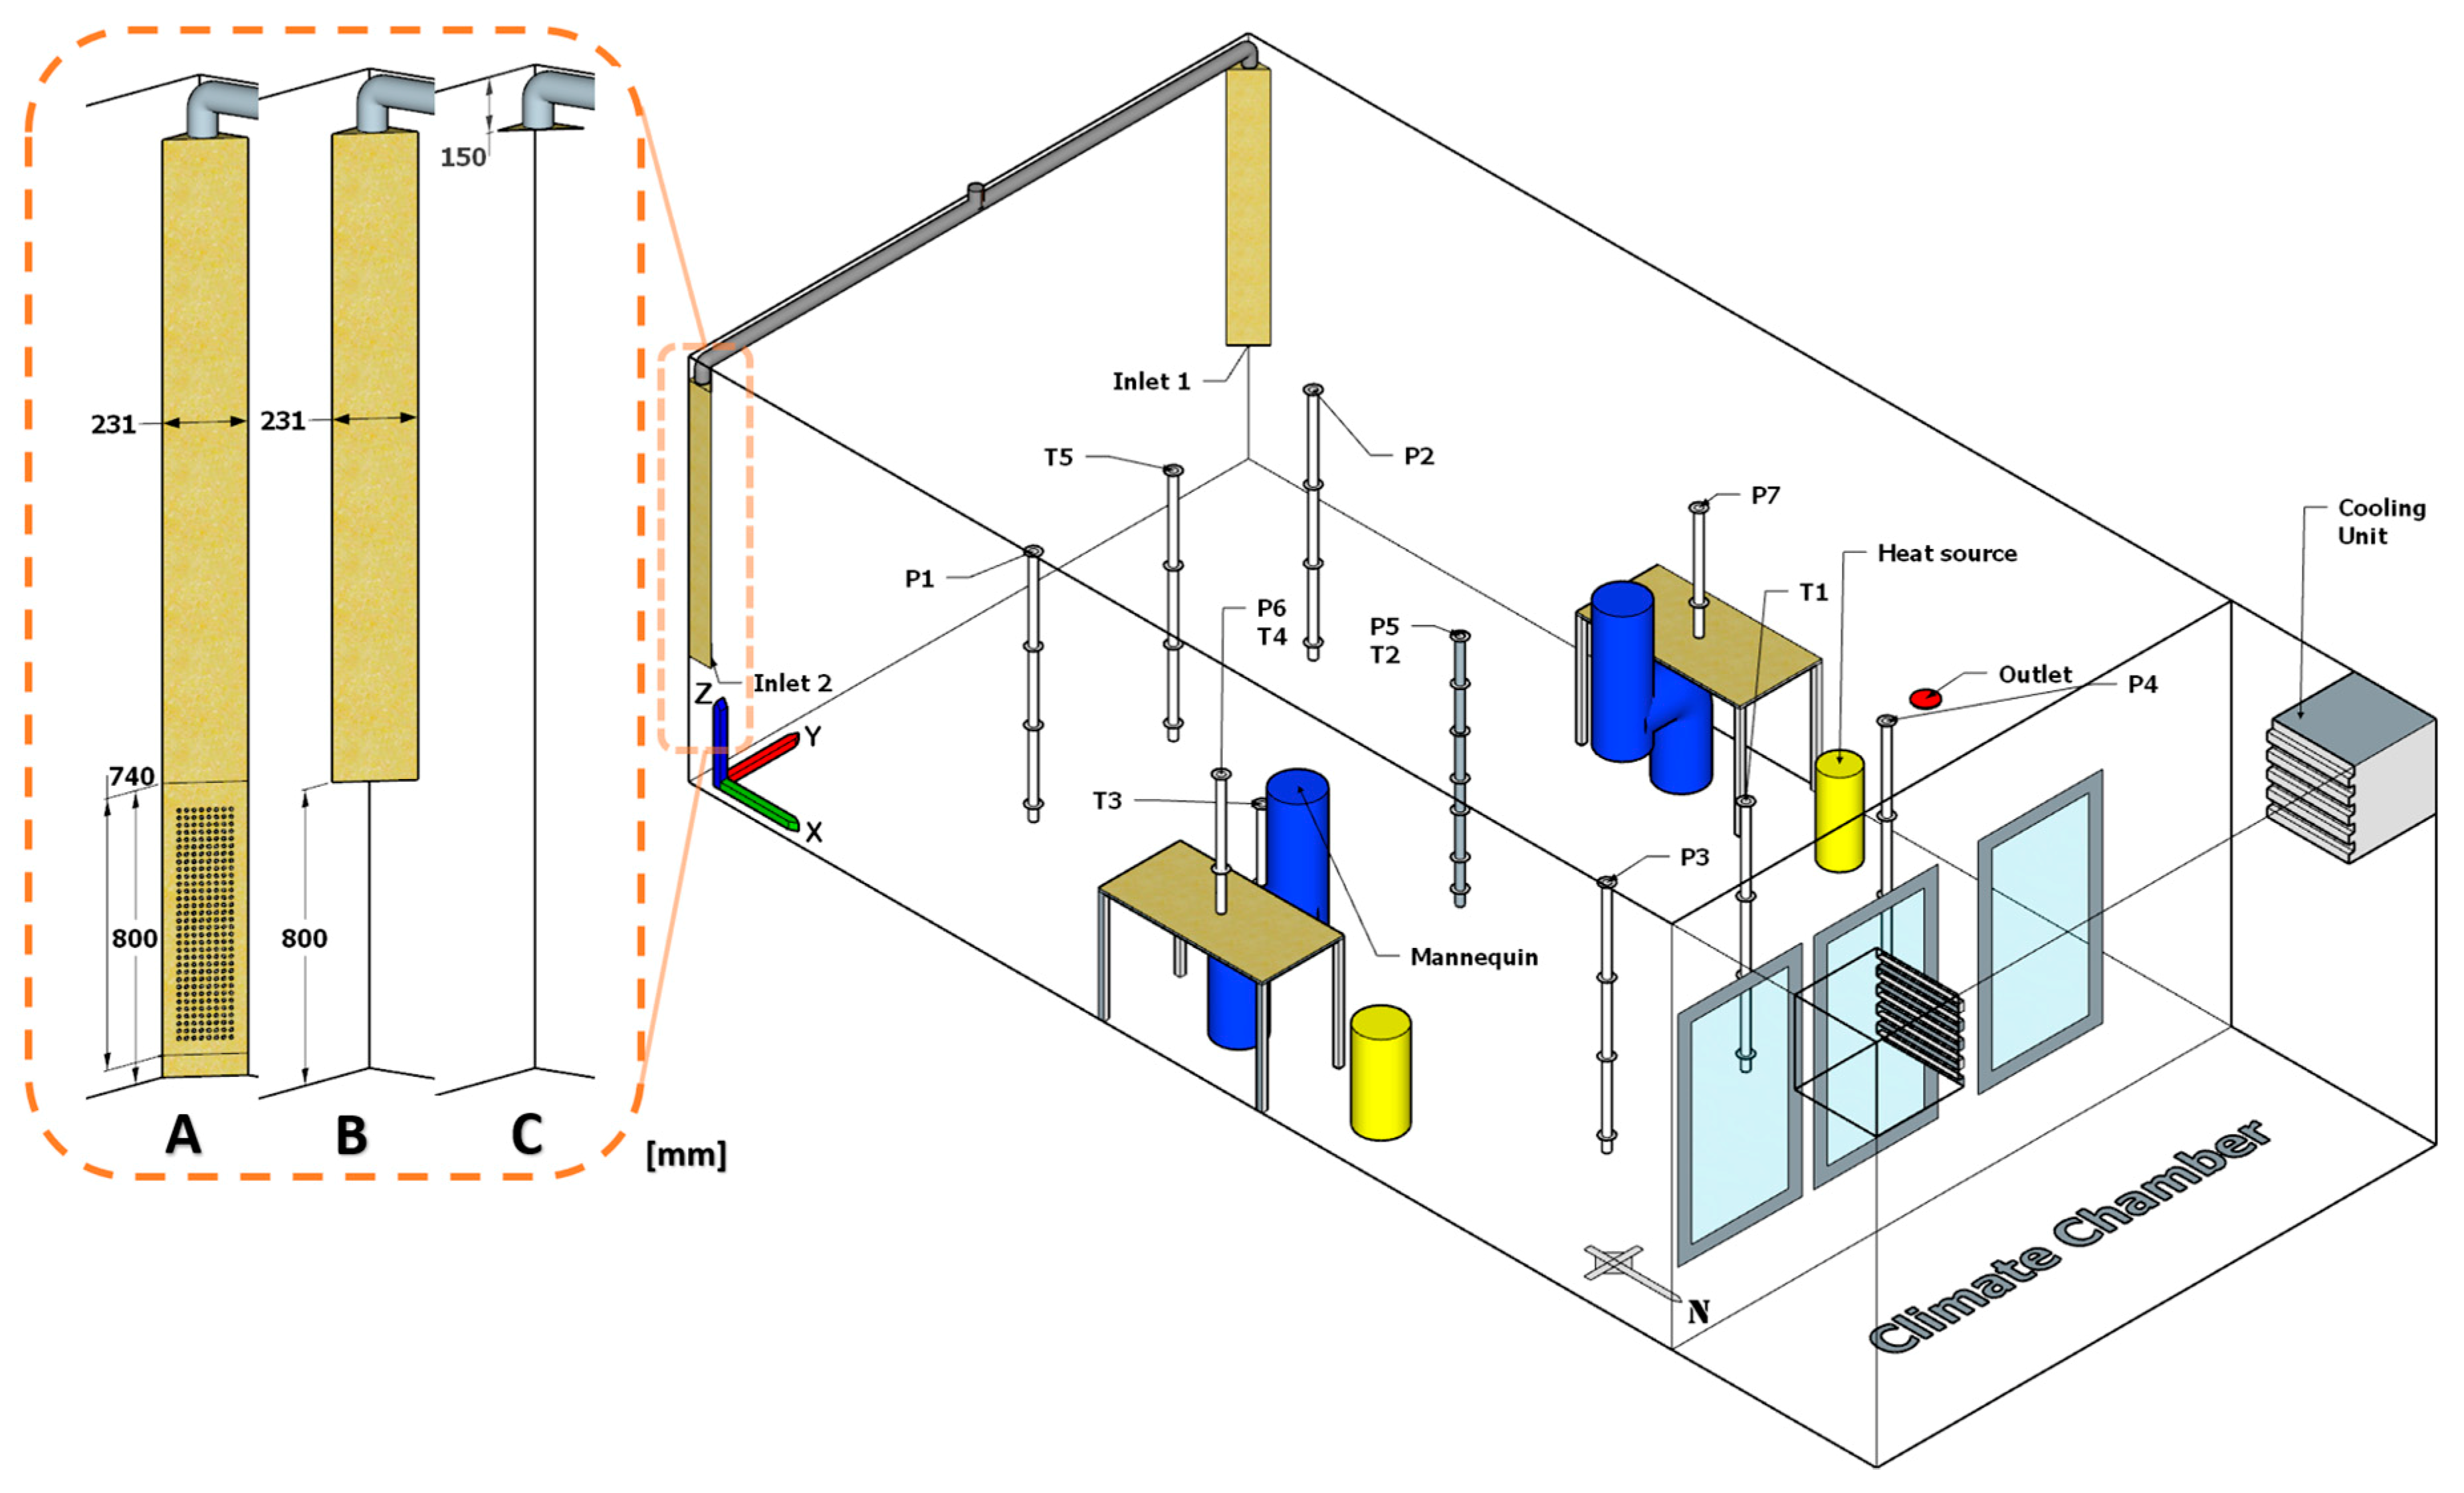
This study was conducted in a room 7.2 (L) × 4.1 (W) × 2.67 (H) m. The room resembled a medium-sized open-plan office space with three interior walls and one exterior wall. A climate chamber was built up in connection to the exterior wall of the test room as shown in Figure 1. For an in-depth description of the office wall materials, design setup, supply device dimensions, measuring equipment, etc. see [19].
Six cases were studied which are listed in Table 1. The primary supply air was maintained between 25.1–25.2 °C for C1 cases and 24.8 °C for C2 cases. It is important to mention that the comparisons were done in a non-dimensional form for all cases.
The wall facing the climate chamber contained three windows. The size of each window was 1.61 m × 0.91 m with a frame to glass ratio of 31.7%. Single pane windows were used with a total U-value of 4.6 W/m
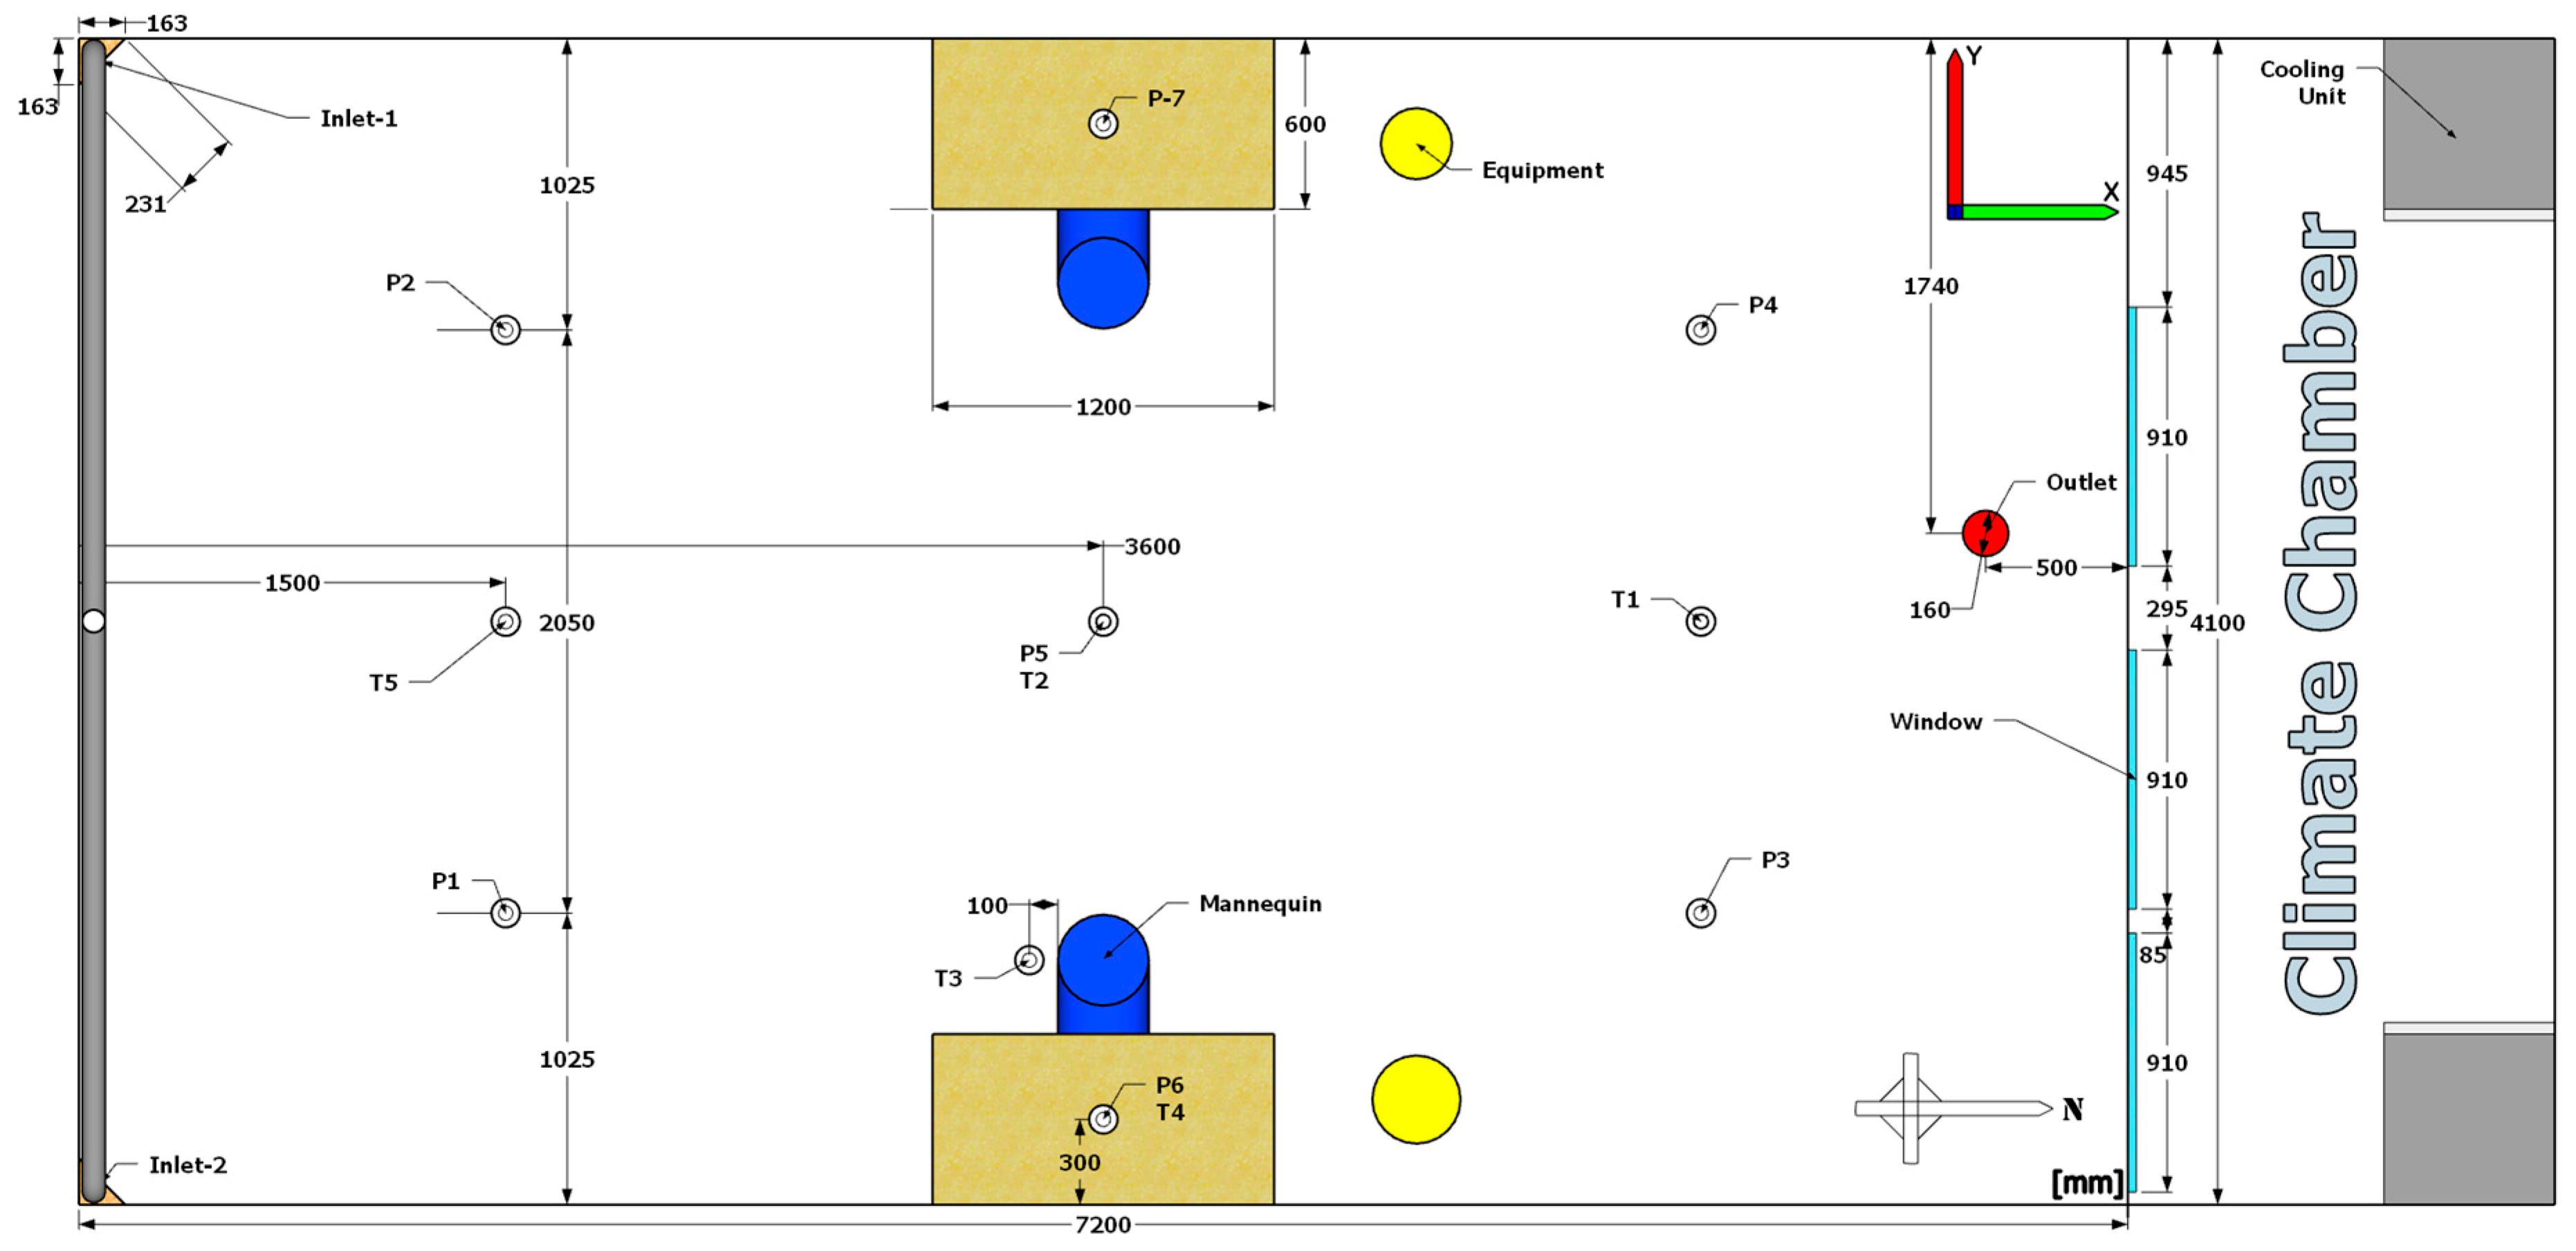
2 °C. The surface temperatures of the windows were maintained at 10.1 ± 0.3 °C during the measurement periods. The location of the room was inside a large laboratory hall with a steady temperature condition of 22.3 ± 0.3 °C during the measurement periods. The heat transfer between the cold climate chamber and the office room was measured by several heat flux sensors of the type HFP01 made by Hukseflux. A total of three heat flux sensors were used. One was placed on the external wall 130.5 cm above the floor level and 47.2 cm from the west wall. Another sensor was placed in the dead center of the window located closest to the west wall. The last sensor was placed on the westside lower frame corner of the same window. The uncertainty of the heat flux sensor is ±3%. The total heat transfer from the office to the climate chamber and the surrounding surface is presented in Table 2. The climate chamber was maintained at −6.2 ± 0.3 °C during measurement periods. Two cooling units were used, one on each side of the climate chamber to provide an even cooling of the air inside the chamber. The heat loss through the rest of the office surfaces, excluding the external wall, amounted to −0.2 ± 0.1 W/m2. The measurement positions and a top view layout of the experimental set-up are shown in Figure 2.

4. Results and Discussion

4.1. Flow Pattern and Thermal Conditions

The results of the air temperature for all the cases are shown in Figure 3. In position P1 (Figure 3a) and P2 (Figure 3b) which are close to the inlets, CMV together with C2-CIJV shows the lowest vertical temperature gradient. One possible reason for this is that the center velocities of the HDV system bypass the measurement probes in those positions. HDV shows the highest temperature gradient compared to CMV or CIJV. One important difference between these three systems is that HDV is designed to deliver the airstream perpendicular to the supply device surface, see Figure 1 and Figure 2, compared to the other two systems where the flow is spread out in all directions when reaching the floor surface.
In position P5 (Figure 3e) which is in the center of the office, the graph shows that the HDV cases have slightly higher temperatures and higher temperature gradient compared to the other systems. Another observation that can be seen is that the CMV cases have a lower temperature and temperature gradient at this position compared to the other ventilation systems. As suggested previously, the possible reason for this is the high level of entrainment created by this type of air distribution system.
Position P3 (Figure 3c) and P4 (Figure 3d) show a high temperature stratification. These locations are heavily affected by the external wall and the cold windows. The main driving force behind the airflows in this region is probably the downdraught flow from the cold windows, which is also shown in other studies [34,35,36]. It is also worth noting that P3 has a slightly lower temperature in the lower part of the room compared to P4. The reason for this is that P3 is adjacent to two windows compared to position P4 which is only close to one window, as can be seen in Figure 2.
The velocity profiles at P1 (Figure 4a) and P2 (Figure 4b) showed that the highest velocities were measured at 0.1 m above the floor level for C2-CMV, C1-CMV and C2-CIJV. In contrast, HDV has very low velocity compared to the other two ventilation systems at that height. A probable explanation is that the centerline of the HDV airstream bypasses the P1 and P2 measuring poles. The CMV cases have the highest velocities of all, reaching as high as 0.5 m/s for C2-CMV. This is explained by the special configuration of the CMV inlets. By being placed high up in the corner of the room and having a high supply velocity, the inlet air jets create a high level of entrainment. This results in an airstream with higher momentum and higher boundary layer thickness compared to the other systems, which was also evident in the cooling mode study [19].
In position P5 (Figure 4e), CIJV shows slightly lower velocity in the upper part of the room compared to the other systems. This also results in lower ACEp value for position P5 (T2) compared to the other systems as seen in Table 4.
The velocities in P3 (Figure 4c) and P4 (Figure 4d) show a stagnation of the air movement. One probable explanation for this is that the cold air movement is below 0.1 m in the direction towards the occupied zone and warm air above 1.7 m in the opposite direction towards the ventilation outlet and the wall facing the climate chamber [37].
The draught levels at P1 (Figure 5a) and P2 (Figure 5b) show a strong connection to the velocity profiles as expected. Due to high velocities at P1 and P2 the draught levels are higher in this part of the room for CIJV and CMV.
P5 (Figure 5e) shows acceptable DR levels for all cases, with CIJV showing excellent levels for both C1 and C2. When comparing C2-CIJV to C2-CMV the results show that the average DR rate at P5 is 0.3% for C2-CIJV and 5.3% for C2-CMV with the highest difference reaching as high as 10% at the height of 1.7 m.
In position P3 (Figure 5c) and P4 (Figure 5d) the DR is at acceptable levels for all cases. However, there is a high possibility of cold air coming from the cold side of the office as suggested previously.
Another way to illustrate the correlation between high velocities and high draught rates can be seen in Figure 6. Figure 6a shows the maximum draught rate (DRmax) based on all the points in each location at P1–P2, P5 and P3–P4. Figure 6b shows the maximum velocity (Umax) at the same locations. The strong connection between the high velocities and the high DR is shown in the graph. Another interesting observation is that in P3–P4 the differences between the different ventilation systems in terms of (∆Tmax) are almost nonexistent. One probable reason for this is that in this part of the room the cold wall and windows are having major impact on the flow and temperature pattern. Since the setting of the outside cold temperature is the same for all cases, the impact should be equal for cases with the same flow rate and inlet temperature, i.e., C1 and C2.
Table 3 shows that PD in all cases are within category A classification.

4.2. Ventilation Effectiveness

The ACEp values presented in Table 4 show that C2-CMV has the most uniform ACEp when compared to the other systems due to the high entrainment it creates when entering the room. However, all the cases show similar ACEp. This indicates that the air is equally “fresh” at breathing level in all the measuring locations, corresponding to an IAQ that equals to a fully mixed condition.
At position T3 located close to the mannequin the best performance is achieved by C1-CIJV and C1-HDV, although by a very small margin. Not surprisingly at T5, which is close to the inlets, the highest values of ACEp are obtained. Overall, the ventilation systems all perform very similar, at breathing level, to a MV with values close to 1. This is different when compared to the previous study in which HDV and CIJV operated in cooling mode [19].
The AEE values are close to each other in all cases. The reason for this is that AEE takes into account the mean age of air for the entire room. This means that a case can have high ACEp values in some zones, but lower values in others.
Table 5 shows the average ε T of the heights 0.1, 0.6 and 1.1m for all studied cases. These results suggest that the studied ventilation systems produce similar results in heating mode when evaluating the ventilation effectiveness in the occupied zone.
To summarize the results, HDV and CIJV provide similar ventilation effectiveness to CMV. As for local thermal comfort evaluation, the results show a small advantage for CIJV in the occupied zone. It is worth mentioning that the flow pattern of the downdraught from the windows has a major impact on the overall airflow pattern in the room. Hence, further studies are recommended in order to fully evaluate the effects of downdraught on the performance of these air distribution systems operating in heating mode.

5. Conclusions

These are the most significant conclusion:
  • CIJV and HDV perform similar to a mixing ventilation in terms of ventilation effectiveness close to the workstations.
  • CIJV performs slightly better that the other systems regarding local thermal comfort close to the workstations
This indicates that these systems can perform as good as MV when used in offices that requires moderate heating. This also provides the possibility of using CIJV and HDV both for heating and cooling. It is important to note that this study was based only on one-room geometry and one configuration of workstation placement in the room. Further studies have to be conducted in order to evaluate corner impinging jet ventilation and hybrid displacement ventilation in more details and also to evaluate different location for the workstations, different heating demands, different locations for the supply inlets, different supply temperatures, etc.

Author Contributions

Main contribution was made by A.A.; The other three authors contributed equally.

Funding

Internal research funding from the University of Gävle.

Acknowledgments

The authors are grateful for the valuable help from University of Gävle’s laboratory staff and the possibility of using the university’s laboratory facilities.

Conflicts of Interest

The authors declare no conflicts of interest.

Nomenclature

ACEair change effectiveness [-]
ACEavgaverage spatial air change effectiveness in a region [-]
ACEplocal air change effectiveness [-]
AEE air exchange effectiveness [-]
Ariinlet Archimedes number [-]
CIJVcorner impinging jet ventilation
CMVcorner mixing ventilation
DRdraught rate [%]
DRmaxmaximum draught rate between 0.1 m and 1.7 m above floor level [%]
DVdisplacement ventilation
HDVhybrid displacement ventilation
IAQindoor air quality
IJVimpinging jet ventilation
MVmixing ventilation
PDpercentage dissatisfied due to vertical air temperature difference [%]
T ¯ 0.1 , 0.6 , 1.1 arithmetic mean air temperature based on the values at height 0.1, 0.6 and 1.1 m [°C]
Timean supply air temperature [°C]
Tomean outlet air temperature [°C]
Δ T 0.1 1.1 vertical air temperature gradient between 0.1 m and 1.1 m above floor level [°C]
Δ T m a x maximum air temperature gradient between 0.1 m and 1.7 m above floor level [°C]
uinnominal inlet air velocity [m/s]
U m a x maximum air velocity between 0.1 m and 1.7 m above floor level [m/s]
Wpower [kg⋅m2⋅s−3]
ε T temperature effectiveness [–]

References

  1. Etheridge, D.W.; Sandberg, M. Building Ventilation: Theory and Measurement; John Wiley & Sons: Chichester, UK, 1996; ISBN 978-0-471-96087-4. [Google Scholar]
  2. Awbi, H.B. Ventilation of Buildings; Routledge: New York, NY, USA, 2002; ISBN 1135817413. [Google Scholar]
  3. Larsson, U.; Moshfegh, B. Comparison of ventilation performance of three different air supply devices: A measurement study. Int. J. Vent. 2017, 16, 244–254. [Google Scholar] [CrossRef]
  4. Cho, Y.; Awbi, H.; Karimipanah, T. A comparison between four different ventilation systems. In Proceedings of the 8th International Conference on Air Distribution in Rooms (Roomvent 2002), Copenhagen, Denmark, 8–11 September 2002; pp. 181–184. [Google Scholar]
  5. Amai, H.; Novoselac, A. Experimental study on air change effectiveness in mixing ventilation. Build. Environ. 2016, 109, 101–111. [Google Scholar] [CrossRef] [Green Version]
  6. Serra, N.; Semiao, V. Comparing displacement ventilation and mixing ventilation as HVAC strategies through CFD. Eng. Comput. 2009, 26, 950–971. [Google Scholar] [CrossRef]
  7. He, G.; Yang, X.; Srebric, J. Removal of contaminants released from room surfaces by displacement and mixing ventilation: Modeling and validation. Indoor Air 2005, 15, 367–380. [Google Scholar] [CrossRef] [PubMed]
  8. Lin, Z.; Chow, T.; Fong, K.; Tsang, C.; Wang, Q. Comparison of performances of displacement and mixing ventilations. Part II: Indoor air quality. Int. J. Refrig. 2005, 28, 288–305. [Google Scholar] [CrossRef]
  9. Awbi, H.B. Ventilation Systems: Design and Performance; Routledge: New York, NY, USA, 2007; ISBN 1135815313. [Google Scholar]
  10. Cao, G.; Awbi, H.; Yao, R.; Fan, Y.; Sirén, K.; Kosonen, R.; Zhang, J.J. A review of the performance of different ventilation and airflow distribution systems in buildings. Build. Environ. 2014, 73, 171–186. [Google Scholar] [CrossRef]
  11. Chen, H.; Janbakhsh, S.; Larsson, U.; Moshfegh, B. Numerical investigation of ventilation performance of different air supply devices in an office environment. Build. Environ. 2015, 90, 37–50. [Google Scholar] [CrossRef]
  12. Awbi, H.B. Ventilation for good indoor air quality and energy efficiency. Energy Procedia 2017, 112, 277–286. [Google Scholar] [CrossRef]
  13. Chen, H.; Moshfegh, B.; Cehlin, M. Numerical investigation of the flow behavior of an isothermal impinging jet in a room. Build. Environ. 2012, 49, 154–166. [Google Scholar] [CrossRef]
  14. Chen, H.; Moshfegh, B.; Cehlin, M. Investigation on the flow and thermal behavior of impinging jet ventilation systems in an office with different heat loads. Build. Environ. 2013, 59, 127–144. [Google Scholar] [CrossRef]
  15. Kobayashi, T.; Sugita, K.; Umemiya, N.; Kishimoto, T.; Sandberg, M. Numerical investigation and accuracy verification of indoor environment for an impinging jet ventilated room using computational fluid dynamics. Build. Environ. 2017, 115, 251–268. [Google Scholar] [CrossRef]
  16. Karimipanah, T.; Awbi, H. Theoretical and experimental investigation of impinging jet ventilation and comparison with wall displacement ventilation. Build. Environ. 2002, 37, 1329–1342. [Google Scholar] [CrossRef]
  17. Ye, X.; Zhu, H.; Kang, Y.; Zhong, K. Heating energy consumption of impinging jet ventilation and mixing ventilation in large-height spaces: A comparison study. Energy Build. 2016, 130, 697–708. [Google Scholar] [CrossRef]
  18. Ye, X.; Kang, Y.; Yang, X.; Zhong, K. Temperature distribution and energy consumption in impinging jet and mixing ventilation heating rooms with intermittent cold outside air invasion. Energy Build. 2018, 158, 1510–1522. [Google Scholar] [CrossRef]
  19. Ameen, A.; Cehlin, M.; Larsson, U.; Karimipanah, T. Experimental investigation of ventilation performance of different air distribution systems in an office environment—Cooling mode. Energies 2019, 12, 1354. [Google Scholar] [CrossRef]
  20. Mandin, C.; Trantallidi, M.; Cattaneo, A.; Canha, N.; Mihucz, V.G.; Szigeti, T.; Mabilia, R.; Perreca, E.; Spinazzè, A.; Fossati, S. Assessment of indoor air quality in office buildings across Europe–The OFFICAIR study. Sci. Total Environ. 2017, 579, 169–178. [Google Scholar] [CrossRef]
  21. Baldi, S.; Michailidis, I.; Ravanis, C.; Kosmatopoulos, E.B. Model-based and model-free “plug-and-play” building energy efficient control. Appl. Energy 2015, 154, 829–841. [Google Scholar] [CrossRef]
  22. Michailidis, I.T.; Baldi, S.; Pichler, M.F.; Kosmatopoulos, E.B.; Santiago, J.R. Proactive control for solar energy exploitation: A german high-inertia building case study. Appl. Energy 2015, 155, 409–420. [Google Scholar] [CrossRef] [Green Version]
  23. Kong, X.; Xi, C.; Li, H.; Lin, Z. A comparative experimental study on the performance of mixing ventilation and stratum ventilation for space heating. Build. Environ. 2019. [Google Scholar] [CrossRef]
  24. Rabani, M.; Madessa, H.B.; Nord, N.; Schild, P.; Mysen, M. Performance assessment of all-air heating in an office cubicle equipped with an active supply diffuser in a cold climate. Build. Environ. 2019. [Google Scholar] [CrossRef]
  25. ISO 7730—Ergonomics of the Thermal Environment-Analytical Determination and Interpretation of Thermal Comfort Using Calculation of the PMV and PPD Indices and Local Thermal Comfort Criteria; ISO: Geneva, Switzerland, 2005.
  26. ASHRAE Standard 129-1997 (RA 2002)—Measuring Air Change Effectiveness; ASHRAE: Atlanta, GA, USA, 2002.
  27. Mundt, M.; Mathisen, H.M.; Moser, M.; Nielsen, P.V. Ventilation Effectiveness; REHVA: Brussels, Belgium, 2004; ISBN 978-29-6004-680-9. [Google Scholar]
  28. Breum, N. Ventilation efficiency in an occupied office with displacement ventilation—A laboratory study. Environ. Int. 1992, 18, 353–361. [Google Scholar] [CrossRef]
  29. Cehlin, M.; Karimipanah, T.; Larsson, U.; Ameen, A. Comparing thermal comfort and air quality performance of two active chilled beam systems in an open-plan office. J. Build. Eng. 2019, 22, 56–65. [Google Scholar] [CrossRef]
  30. Sandberg, M.; Blomqvist, C. A quantitative estimate of the accuracy of tracer gas methods for the determination of the ventilation flow rate in buildings. Build. Environ. 1985, 20, 139–150. [Google Scholar] [CrossRef]
  31. Krajčík, M.; Simone, A.; Olesen, B.W. Air distribution and ventilation effectiveness in an occupied room heated by warm air. Energy Build. 2012, 55, 94–101. [Google Scholar] [CrossRef]
  32. Both, B.; Szánthó, Z. Objective investigation of discomfort due to draught in a tangential air distribution system: Influence of air diffuser’s offset ratio. Indoor Built Environ. 2018, 27, 1105–1118. [Google Scholar] [CrossRef]
  33. Cehlin, M. Visualization of Air Flow, Temperature and Concentration Indoors: Whole-Field Measuring Methods and CFD; KTH: Stockholm, Sweden, 2006. [Google Scholar]
  34. Ge, H.; Fazio, P. Experimental investigation of cold draft induced by two different types of glazing panels in metal curtain walls. Build. Environ. 2004, 39, 115–125. [Google Scholar] [CrossRef]
  35. Manz, H.; Frank, T. Analysis of thermal comfort near cold vertical surfaces by means of computational fluid dynamics. Indoor Built Environ. 2004, 13, 233–242. [Google Scholar] [CrossRef]
  36. Jurelionis, A.; Isevičius, E. CFD predictions of indoor air movement induced by cold window surfaces. J. Civ. Eng. Manag. 2008, 14, 29–38. [Google Scholar] [CrossRef]
  37. Heiselberg, P. Draught risk from cold vertical surfaces. Build. Environ. 1994, 29, 297–301. [Google Scholar] [CrossRef] [Green Version]
Figure 1. Layout of the office room and climate chamber. Three supply devices are illustrated for hybrid displacement ventilation (HDV, A), corner impinging jet ventilation (CIJV, B) and corner mixing ventilation (CMV, C).
Energies 12 01835 g001
Figure 2. Measurement positions and schematic top view layout of office room and the climate chamber.
Energies 12 01835 g002
Figure 3. Air temperature profiles at position P1 (a), P2 (b), P3 (c), P4 (d), P5 (e) and P6 (f) for all cases.
Energies 12 01835 g003
Figure 4. Velocity profiles at position P1 (a), P2 (b), P3 (c), P4 (d), P5 (e) and P6 (f) for all cases.
Energies 12 01835 g004aEnergies 12 01835 g004b
Figure 5. Draught levels at position P1 (a), P2 (b), P3 (c), P4 (d), P5 (e) and P6 (f) for all cases.
Energies 12 01835 g005aEnergies 12 01835 g005b
Figure 6. Maximum draught rate (a), maximum velocity (b) and maximum temperature difference (c) in positions P1–P2, P5 and P3–P4.
Energies 12 01835 g006
Table 1. Case conditions for different ventilation systems.
CaseVentilation SystemSupply Flow Rate [L/s]Occupant [W]Equipment [W]Inlet Temp. [°C]uin [m/s]Ari × 10−4
C1-HDVHDV2 × 152 × 1002 × 7525.20.50−317
C1-CIJVCIJV2 × 152 × 1002 × 7525.21.13−49
C1-CMVCMV2 × 152 × 1002 × 7525.12.98−5
C2-HDVHDV2 × 202 × 1002 × 7524.80.67−140
C2-CIJVCIJV2 × 202 × 1002 × 7524.81.51−19
C2-CMVCMV2 × 202 × 1002 × 7524.83.98−2
Table 2. Energy balance overview of the office room.
CaseInternal H. Generation 1 [W]Ventilation 2 [W]External Wall 3 [W]
C1-HDV38949.9−417.2
C1-CIJV38952.7−411.3
C1-CMV38954.2−426.7
C2- HDV38948.5−419.2
C2-CIJV38948.6−424.5
C2-CMV38958.6−411.3
1 The internal heat was generated from the mannequins (2 × 100 W), two pieces of equipment (2 × 75 W) and from measuring equipment (39 W). 2 The ventilation effect was calculated from the flow rate and the temperature difference between the inlet and outlet. 3 This also includes the windows.
Table 3. Local discomfort (PD) due to high vertical air temperature between head and ankle.
CasePositionC1-HDVC1-CIJVC1-CMVC2-HDVC2-CIJVC2-CMV
PDP10.8%0.7%0.4%0.9%0.4%0.3%
P20.8%0.7%0.3%0.8%0.4%0.3%
P31.2%1.3%1.2%1.2%1.4%1.3%
P41.0%1.2%1.0%1.0%1.2%0.9%
P50.8%0.8%0.6%0.8%0.7%0.6%
Table 4. Air change effectiveness (ACE), local and average, and air exchange effectiveness (AEE) for all cases.
CasePositionC1-HDVC1-CIJVC1-CMVC2-HDVC2-CIJVC2-CMV
ACEpT11.051.021.031.041.011.03
T21.091.051.071.091.061.07
T3 11.051.061.011.020.981.02
T41.011.061.061.031.001.00
T51.151.141.131.191.121.08
ACEavg 2 1.071.071.061.071.031.04
AEE 0.510.510.520.510.490.51
1 The location was in the occupied zone close to the mannequin, as also shown in Figure 2. 2 ACEavg is the average ACE value for the measuring points T1–T5.
Table 5. Average ε T in locations P1–P7 for all cases.
CasePositionC1-HDVC1-CIJVC1-CMVC2-HDVC2-CIJVC2-CMV
ε T 1P10.660.700.870.610.700.93
P20.660.690.840.590.670.88
P30.530.530.560.460.440.52
P40.580.580.600.500.490.58
P50.690.690.670.610.580.63
ε T 2P61.071.241.151.131.111.24
P70.931.011.000.950.951.04
1 calculated by using the arithmetic mean air temperature of the heights 0.1, 0.6, and 1.1 m. 2 calculated by using the arithmetic mean air temperature of the height 1.1 m only.

