Optimal Coordinated Bidding of a Profit Maximizing, Risk-Averse EV Aggregator in Three-Settlement Markets Under Uncertainty


Department for Applied Mathematics and Computer Science, Technical University of Denmark, Richard Petersens Plads, 2800 Kgs. Lyngby, Denmark
*
Author to whom correspondence should be addressed.
Energies 2019, 12(9), 1755; https://doi.org/10.3390/en12091755
Submission received: 4 March 2019
/
Revised: 3 May 2019
/
Accepted: 5 May 2019
/
Published: 9 May 2019
(This article belongs to the Special Issue Progresses in Advanced Research on Intelligent Electric Vehicles)
Abstract
:This paper develops a two-stage stochastic and dynamically updated multi-period mixed integer linear program (SD-MILP) for optimal coordinated bidding of an electric vehicle (EV) aggregator to maximize its profit from participating in competitive day-ahead, intra-day and real-time markets. The hourly conditional value at risk (T-CVaR) is applied to model the risk of trading in different markets. The objective of two-stage SD-MILP is modeled as a convex combination of the expected profit and the T-CVaR hourly risk measure. When day-ahead, intra-day and real-time market prices and fleet mobility are uncertain, the proposed two-stage SD-MILP model yields optimal EV charging/discharging plans for day-ahead, intra-day and real-time markets at per device level. The degradation costs of EV batteries are precisely modeled. To reflect the continuous clearing nature of the intra-day and real-time markets, rolling planning is applied, which allows re-forecasting and re-dispatching. The proposed two-stage SD-MILP is used to derive a bidding curve of an aggregator managing 1000 EVs. Furthermore, the model statistics and computation time are recorded while simulating the developed algorithm with 5000 EVs.
1. Introduction
Due to the growing penetration of distributed energy resources (DERs), including photovoltaic panels (PVs), electric vehicles (EVs), and thermostatically controlled loads (TCLs), power systems are benefiting an increasing control flexibility, not only from the supply side, but also from the demand side. Worldwide EV integration level is assumed to grow up to 20 million by 2020 [1]. Hence, the usage of EV batteries to support a power system has a significant potential [2]. Several types of batteries are used as energy storage for EVs, for example lithium-ion, lead acid and nickel metal hydride batteries. Battery market analysis based on efficiency, cost, durability, performance, power and energy can be found in [3,4,5].
EV flexibilities are combined by aggregators to participate in corresponding markets and to provide bids. An aggregator aims to satisfy the driving needs of its fleet of EVs at the lowest possible cost [2,6]. In addition, the aggregator has an economic incentive to participate in different market places targeting higher revenue [7,8,9,10]. Because they can increase or decrease their power output quite fast, EV aggregators can maximize their profit while at the same time providing reserve power. In references [11,12,13,14,15,16], the authors study the potential of using EVs as a flexible power providers for real-time balancing market and system reserves.
The grid-to-vehicle (G2V) problem of bidding regulation and spinning reserves is investigated in [12]. The vehicle-to-grid (V2G) interaction with the grid as a flexibility source for real-time balancing market is modeled in [13,15,16]. However, using the batteries as storage devices for grid purposes reduces their lifetime [15,17], and therefore, EV owners must be compensated for the lost utility of their batteries.
Optimal bidding strategies are particularly relevant to EV aggregators, since they have the possibility to store energy and choose the best time to charge/discharge the electric power according to the market conditions. When prices are high, electric power is discharged and sold, whereas when prices are low, the electric power is charged to meet the driving needs of the aggregator’s fleet of EVs. Thus, modeling of market price uncertainties is an important feature to be considered when developing a bidding strategy. The optimal bidding problem of EVs is studied in [18], taking into consideration uncertain market price and nonlinear charging curve.
Two approaches can be emphasized for modeling uncertainty in a coordinated bidding problem to address the uncertain nature of market conditions and fleet characteristics: (a) risk management and (b) stochastic programming. The EV aggregator needs to prepare its bid function considering the volatility of the electricity prices. For that purpose, ref. [19] proposes two-stage stochastic optimization of EV participation in electricity markets incorporating VaR risk measure. To manage short-term volatility in market prices the conditional value at risk (CVaR) as a hedging instrument is incorporated in EV aggregation models [14,20]. The authors in [21] apply the concept of CVaR on an hourly basis for controlling the risk of hydropower producer’s hourly profit. In [21], it is illustrated that hourly bid functions derived from an hourly CVaR include more accurate information on the short-term price risk as compared to the bid functions derived from the daily CVaR.
The existing literature on bidding strategies for EV aggregators that uses stochastic programming can be categorized as (1) day-ahead market bidding and (2) day-ahead and balancing markets bidding. Optimal bidding strategies for participation of an EV aggregator in the day-ahead electricity market are modeled in [9,10].
Imbalances between volumes discharged/charged and volumes dispatched in the day-ahead market are settled in the balancing market, where market players submit their bids to increase or decrease the generation/consumption. Two-stage stochastic optimal bidding models of an EV aggregator for trading in day-ahead energy and regulation markets are presented in [11,13,14,15,17]. The reference [22] presents planning and operation models for an EV sharing community in day-ahead and regulating markets. A game theoretic approach is developed in [23] for analyzing the competition among the EV aggregators acting in day-ahead energy and ancillary services markets with variable wind energy.
In addition, adjustments in the actual discharge/charge can also be done by trading energy in the intra-day market, which allows for trading physical electricity between the participants. In previous studies [9,10,11,12,13,14,15,16,17,18,19,20,21,22,23], optimal bidding strategies for an EV aggregator have been developed. However these studies do not include participation of the aggregator in the intra-day market. Worldwide, significant increase of RES integration in the power system causes highly volatile day-ahead, intra-day and real-time market prices. Consequently, the intra-day market becomes a potentially promising market platform for a flexible market actor to participate in. Therefore, coordinated bidding is highly attractive for an EV aggregators who are able to engage in sequential day-ahead, intra-day and real-time markets and thereby increase their profit.
For a small market participant (a price-taker EV aggregator), whose decisions have no impact on the market outcomes, the bidding process is subject to uncertainty in day-ahead, intra-day, real-time market prices and the availability of the aggregator’s fleet of EVs.
This paper is the extension of the work in [16], and develops a stochastic, dynamically updated two-stage multi-period optimal bidding strategy for a risk-averse EV aggregator who participates in the day-ahead, intra-day and real-time markets. The model addresses the uncertain nature of market conditions and fleet characteristics. A Markov-based Holt winter (HW) model is used to predict electricity prices in all three market places. The uncertainty in day-ahead, intra-day and real-time market prices is represented by a set of scenarios, generated by a forecasting tool (based on the historical data) and reduced by the backward-reduction algorithm. Unlike previous two-stage stochastic formulations in [11,14,16,19], this model accounts dynamically for the clearing nature of the intra-day and real-time markets while deriving optimal bids for day-ahead, intra-day and real-time markets. In addition, the hourly version of CVaR (T-CVaR) is incorporated in the coordination to hedge against short-term market price volatility. The rolling planning is employed to update the scenario trees of intra-day and real-time prices within the day of planning. Finally, the developed model enables the aggregator to manage both stationary storages and EVs. The main contributions of the paper are:
- Development of a two-stage SD-MILP optimal coordinated bidding model for an aggregator who manages numerous storage units (stationary and EVs) and trades electric power in three-settlement markets, taking into account uncertainties in market price and fleet characteristics, as well as existing market rules. This model can be used for market exchange irrespective of (1) production or consumption technology and (2) mobile or stationary storage unit.
- Derivation of optimal coordinated charge (discharge) bids for day-ahead, intra-day and real-time markets with reasonable computation time using scenario-reduction techniques.
- Uncertainty modeling in all three market prices as well as of EV mobility parameters.
- Incorporation of the hourly CVaR (T-CVaR) to focus on the lower tails of the profits on hourly bases.
The paper is structured as follows. Section 2 introduces the general decision-making procedure of an EV aggregator participating in three-settlement markets. Section 3 explains the uncertainty modeling related to market prices and EV availability as well as the concept of rolling planning. Section 4 describes the two-stage dynamically updated stochastic mathematical model formulation of an aggregator, who manages a big number of energy storage units. Section 5 provides the case-study results and Section 6 concludes the paper.
2. Decision Process Framework
The typical decision-making procedure of an EV aggregator, as an electricity market business entity, can be considered similar to the decision-making framework of a conventional producer/consumer. Acting in highly uncertain market environments and with uncertain nature-of-fleet characteristics, the aggregator is willing to participate in intra-day and balancing markets closer to real-time to benefit from correcting actions on the day-ahead commitments. Thus, the EV aggregator’s decision process framework includes:
- The daily bidding in day-ahead markets under the volatile day-ahead market prices, meanwhile allocating capacity in adjustment and regulating markets.
- The hourly/quarter-hourly intra-day selling/buying and balancing up/down-regulating positions driven by intra-day and real-time volatile market prices, and the strict requirements to satisfy driving needs of its fleet of EVs. These adjustments are necessary to address the errors stemming from the availability and price forecast.
The decision process is depicted in Figure 1 for a small case with a set of day-ahead, intra-day and real-time price scenarios. The circles represent the decisions made by the EV aggregator, while the squares refer to the variable set calculated after the first stage decisions. Please note that the second stage scenarios contain information related to both intra-day and real-time market prices.
3. Scenario Generation
3.1. Market Places
Electricity markets are multi-settlement markets and are usually featured by the day-ahead, intra-day and real-time markets. In a day-ahead market, an auction is carried out for energy delivery for the following day with hourly increments. The day-ahead electricity market is operated in three steps: (1) bidding, (2) market clearing and (3) pricing [24]. The transmission system operator (TSO) runs an economic dispatch problem that considers received bids from the market participants, with the aim of meeting the system demand at the minimum possible cost. The market clearing price is calculated as the dual variable of the load balance constraint in the economic dispatch problem.
Intra-day markets are open directly after the clearing process of the day-ahead market, and close shortly before the actual delivery of that hour. This market floor aims to decrease the imbalances occurring between day-ahead and real-time markets. Intra-day markets are usually not liquid, and the trading of the physical electricity takes place between the participants. Thus there is no clear relation between day-ahead and intra-day market prices; for example within a specific hour the intra-day selling/buying price can be less/grater than cleared day-ahead market price for that specific hour.
Finally in the real-time market the TSO again runs economic dispatch based on the received bids from producers and consumers, aiming to meet the real-time market demand at the lowest possible cost. Similar to the day-ahead market, the real-time price is cleared and calculated as the dual variable of the load balance constraint in the real-time economic dispatch problem. Thus, each deviation occurring in the real-time market is reflected in real-time market prices. If the real-time market demand happens to be higher than the day-ahead market demand, the flexible generation units will up regulate and the market will experience up-regulation. The up-regulated price is often higher than the day-ahead market price. In a similar way, if the real-time market demand is less than the day-ahead market demand, the market experiences down-regulation. The down-regulation price will often be less than the day-ahead market price. These existing relations between day-ahead and real-time market prices are respected while performing forecasting, scenario generation and reduction.
3.2. Market Price Scenario Generation and Reduction
Studies in [21] show that the Markov-based HW model is one of the best performing predicting tools for electricity market prices. Accordingly, the day-ahead market price scenarios are predicted using the standard HW model [25] as in [21]. For that purpose historical data related to day-ahead market prices reported on Nord Pool website is used [26]. Then, the day-ahead market price scenarios are generated considering the expected values, the variances of day-ahead market prices and assuming normal distribution.
In contrast to day-ahead market prices, both price magnitude and direction have to be forecasted for intra-day and real-time markets. The combination of HW and Markov models is incorporated to forecast both intra-day and real-time market prices. The proposed Markov-based HW model for modeling and predicting the intra-day and real-time prices are presented in detail in [21]. To predict intra-day and real-time market price magnitude, the intra-day and real-time market historical prices are collected and processed. The intra-day market CSV excel files containing intra-day market trading activities are obtained from Nord Pool (these excel files are not available in the Nord Pool database [26]). Then, this data is preprocessed in two steps: first the data is grouped as buying and selling trading within each hour, and then buying and selling price series with hourly resolution are designed taking the average of all buying and all selling trading prices within each hour correspondingly. Similar to day-ahead market prices, the real-time market price series is available from the Nord Pool website [26].
To model the probabilistic information on random prices, a large number of scenarios is initially generated. The initial number of scenarios is then reduced such that the probability information is maintained as much as possible [27]. The problem of optimal scenario reduction can be stated as:
The optimization problem (1) and (2) can be approximately solved using the backward reduction technique. In this technique, price scenario is deleted such that [27]. As a result, the backward reduction algorithm determines a subset from the initial scenario set and assigns new probabilities to the preserved ones.
3.3. Availability Simulation
In order to generate mobility scenarios for mimicking the uncertain driving patterns, a Monte Carlo simulation tool is incorporated. Then, discrete cumulative distribution functions (cdf) are employed. The cdfs are derived considering the following three type of probabilities: (1) the probability of travel on a specific day; (2) the probability that a trip starts in a specific hour; and (3) the probability that a trip covers a certain distance. It is assumed that these distributions are mutually independent as in [14].
3.4. Rolling Planning
As stated above, bids to day-ahead market for all hours of the delivery day are submitted simultaneously before noon the day prior to the delivery day. In contrast, both intra-day and real-time markets are continuous, hourly markets. This means the EV aggregator has new price information realized after the day-ahead market clearing and before the intra-day and real-time markets closure. Rolling horizon planning is employed to take advantage of the continuously released information over time (revealed intra-day and real-time market prices). Hence, the scenario tree of intra-day and real-time prices is updated within the planning day using the rolling planning. Let be the scenario tree predicted for hours t to T using the historical prices up to hour t. Consequently, the is dynamically updated by intra-day and real-time prices revealed until hour t. The ideal case would be to update the on an hourly bases. However, solving the stochastic model dynamically increases the solution time exponentially. To solve the model with reasonable computational time, is updated every few hours which is called ‘iteration’. For every iteration, a new scenario tree is used that updates the information related to intra-day and real-time market prices. The implementation of the rolling planning to update the intra-day and real-time market prices for every four-hour period is depicted in Figure 2. Note that each scenario contains information for both intra-day and real-time market prices.
4. Mathematical Problem Formulation
The current bidding problem formulation of an EV aggregator is an extension of the model presented in [16], where the trading possibilities in intra-day market are ignored and the optimization is risk-neutral.
A profit-maximizing risk-averse aggregator is assumed, who participates in day-ahead, intra-day and real-time markets. The aggregator maximizes its expected profit while minimizing its exposure to market price risk. The profits in different hours might have different statistical behavior due to the fact that the market prices can be functions of fundamentally different drivers for different trading hours within the planning day. The time-dependent conditional value at risk (T-CVaR) is proposed to manage the lower tail of profit distribution in each hour in Equations (3)–(5). Equation (3) aims at maximizing hourly CVaR subject to Equations (4) and (5). Here, constraints (4) and (5) set conditions on the hourly risk measure. According to Equation (4), if the profit for scenario s and hour t is greater than . is defined by the difference between and the relative profit for all other scenarios and hours.
For a given confidence level , the defines the expected value of profits less than -quantile of distributed profit in hour t.
Two-Stage Stochastic Optimal Strategy of an EV Aggregator
The stochastic optimization problem stated in Equation (6) aims at the maximization of scenario-weighted expected profits from day-ahead energy trading, intra-day and real-time power exchange, while minimizing its exposure to market price risk. Hourly resolution is assumed for day-ahead, intra-day and real-time markets.
where , and are potential profits from day-ahead, intra-day and real-time markets expressed as in (7), (8) and (9) correspondingly.
Equations (7)–(9) express the aggregator’s revenue minus cost while providing optimal discharge/charge bids in day-ahead, intra-day and real-time markets, respectively.
The equations in (10) provide the aggregated charge/discharge bids in three market places. The aggregator’s cost in all three markets while providing charging/discharging optimal bids includes the aggregator’s agreement with the EV owner set out in Equations (11)–(13). Here is the degradation cost modeled as in [15] and set out in (14).
To derive the step-function bidding curve for hour t of the day-ahead market, the parameters , , ..., are first fixed at I arbitrary price levels. Then the unknown variables , , ..., of the step function are derived as follows:
Using binary variable and a large enough constant , (15) can be reformulated as constraints (16)–(18):
The selling and buying bids to intra-day market are expressed in (19).
In the similar way, using binary variables and a large enough constant , we have:
Similarly, the up- and down-regulating bids to real-time market are expressed in (23).
Constants , and must be tuned carefully to avoid introducing extra bounds or ill-conditioning in the optimization problem.
The state of charge balance constraint can be modeled in the following way [14]:
Constraint (27) states that for each hour the new content of the storage is equal to its old content plus energy inflow minus energy outflow. Equation (27) allows modeling of both stationary and mobile (EV) storages. For stationary storages, availability matrix entities are always 1. For EVs the availability matrix element for hour t and scenario s is either 0 or 1 depending on whether the EV is available or on a journey. The storage level is bounded by its minimum and maximum levels (28).
The constraint (29) prevents discharging/charging in the periods of unavailability, while the constraint (30) states the end SoC condition.
In Equation (31), is 0 if the profit in scenario s and time t is greater than . Otherwise, is equal to the difference of and the corresponding profit.
With the concept of rolling planning dynamically updated, the stochastic two-stage optimal bidding strategy for deriving the coordinated bidding curves in day-ahead, intra-day and real-time markets is defined in Equations (33) and (34).
where = is the set of decision variables.
The whole framework of deriving the optimal coordinated bids for three-settlement markets is presented in Figure 3.
5. Case Study
The developed two-stage SD-MILP optimal bidding strategy summarized in Equations (33) and (34) is applied to derive a bidding discharge/charge curve of an aggregator managing a fleet of 1000 EVs. Both charging and discharging modes are studied.
5.1. Market Price Series
The historical price data for both day-ahead and real-time markets are taken from the Nordic electricity market website [26]. The CSV excel files, which contain the information about intra-day market trading activities, are obtained from the Nordic electricity market.
5.2. General Parameters
5.3. Simulation Results
5.3.1. Tractability of the Solution
The proposed Markov-based HW model, scenario backward reduction-algorithm and the Monte Carlo simulation tool to produce mobility patterns are coded in Matlab.
To ensure computational tractability while solving stochastic models, it is necessary (1) to approximate the underlying probability distribution by a discrete probability measure and (2) to reduce the number of scenarios and thereby the computational complexity.
Scenario reduction should be done in a way that the statistical information in prices is maintained in the best possible way [27]. The backward-reduction algorithm is used to reduce the number of price scenarios. Using the forecasted prices, 1000 price scenarios with equal probabilities for three market floors are generated and they are reduced to 30 price scenarios.
In addition, 30 equally probable mobility scenarios are produced using the Monte Carlo simulation tool and are integrated with the 30 preserved day-ahead, intra-day and real-time price scenarios. Together with mobility scenarios these preserved price scenarios are used for calculating the optimal bidding curves of the EV aggregator.
5.3.2. Rolling Planning Horizon
A three-level step function is considered for bidding curves. The two-stage SD-MILP model is coded in GAMS platform and solved using CPLEX solver. All optimization problems are solved with an optimality gap of . The whole simulation is run on a computer with 2.66 GHz processor and 4 GB RAM. The objective function values together with the computation time for a fleet of 1000 EVs and all iterations are stated in Table 2. According to Table 2 the computation time is very short.
In addition, the model statistics are set out in Table 3 when the suggested two-stage SD-MILP model is simulated with different number of EVs.
Figure 4 depicts the computation time as a function of the number of EVs involved in the simulation. The observations of Figure 4 show that the model solution time increases linearly when the number of involved EVs increases. Furthermore, the simulation of the developed SD-MILP model with 5000 EVs requires about 6.5 min (see Table 3), thus the model is applicable for simulating a larger case with a greater number of cars or a shorter dispatch interval.
The optimal coordinated bids of the aggregator in three sequential markets are set out in Figure 5, Figure 6 and Figure 7. Figure 5 illustrates that the charge/discharge bid volumes to the day-ahead market remain the same for all iterations. In contrast, Figure 6 and Figure 7 show that intra-day and real-time bid volumes (selling/buying, up/down regulation) change when time evolves and new price information is revealed over time. According to Figure 5, Figure 6 and Figure 7, the EV aggregator actively participates in day-ahead, intra-day and real-time market floors offering discharging bids and participates in real-time market providing down-regulation bids. Moreover, the two-stage SD-MILP offers discharging bids in all three markets when the realized market prices are in the second interval of the three-level price curve (at least €50) and offers charging bids when the realized market prices are cheap (when the prices belong to the first interval of the three-level price curve).
Furthermore the increasing level of intermittent wind and solar power production leads to higher volatility in day-ahead, intra-day, and real-time prices. The impact of increased volatility of market prices on trading of an EV aggregator in these market places can be analyzed using the methodology developed in this paper. To generate market price scenarios with higher volatility, the standard deviation of the price is doubled (the mean remaining the same). The energy tradings in different market places under base prices and prices with higher volatility are reported in Table 4. Table 4 indicates that continuous increases in the share of RES in the power system results in highly volatile market prices, which in turn makes the intra-day market place very attractive for energy trading for an EV aggregator with a flexible energy source.
5.3.3. Controlling the Risk Measure T-CVaR
The T-CVaR risk measure is introduced and modeled in the two-stage SD-MILP (33) and (34), which aims at optimizing the lower tail of profit distribution in each hour t.
To see the sensitivity of the model to risk, the two-stage SD-MILP is run with different risk levels. The lower bound of the constant is zero and describes a risk-neutral aggregator. The upper bound of the constant highly depends on the risk-averseness level of the aggregator. The trade-off between the expected profit and T-CVaR for different values of is shown in Figure 8. In this figure, by increasing the value of , the expected profit decreases while the T-CVaR value increases.
Figure 8 shows that the expected profit for a risk neutral producer () is €118 with a T-CVaR of −€2027. However the expected profit for a risk-averse producer with is only €57 with a T-CVaR value of −€613.
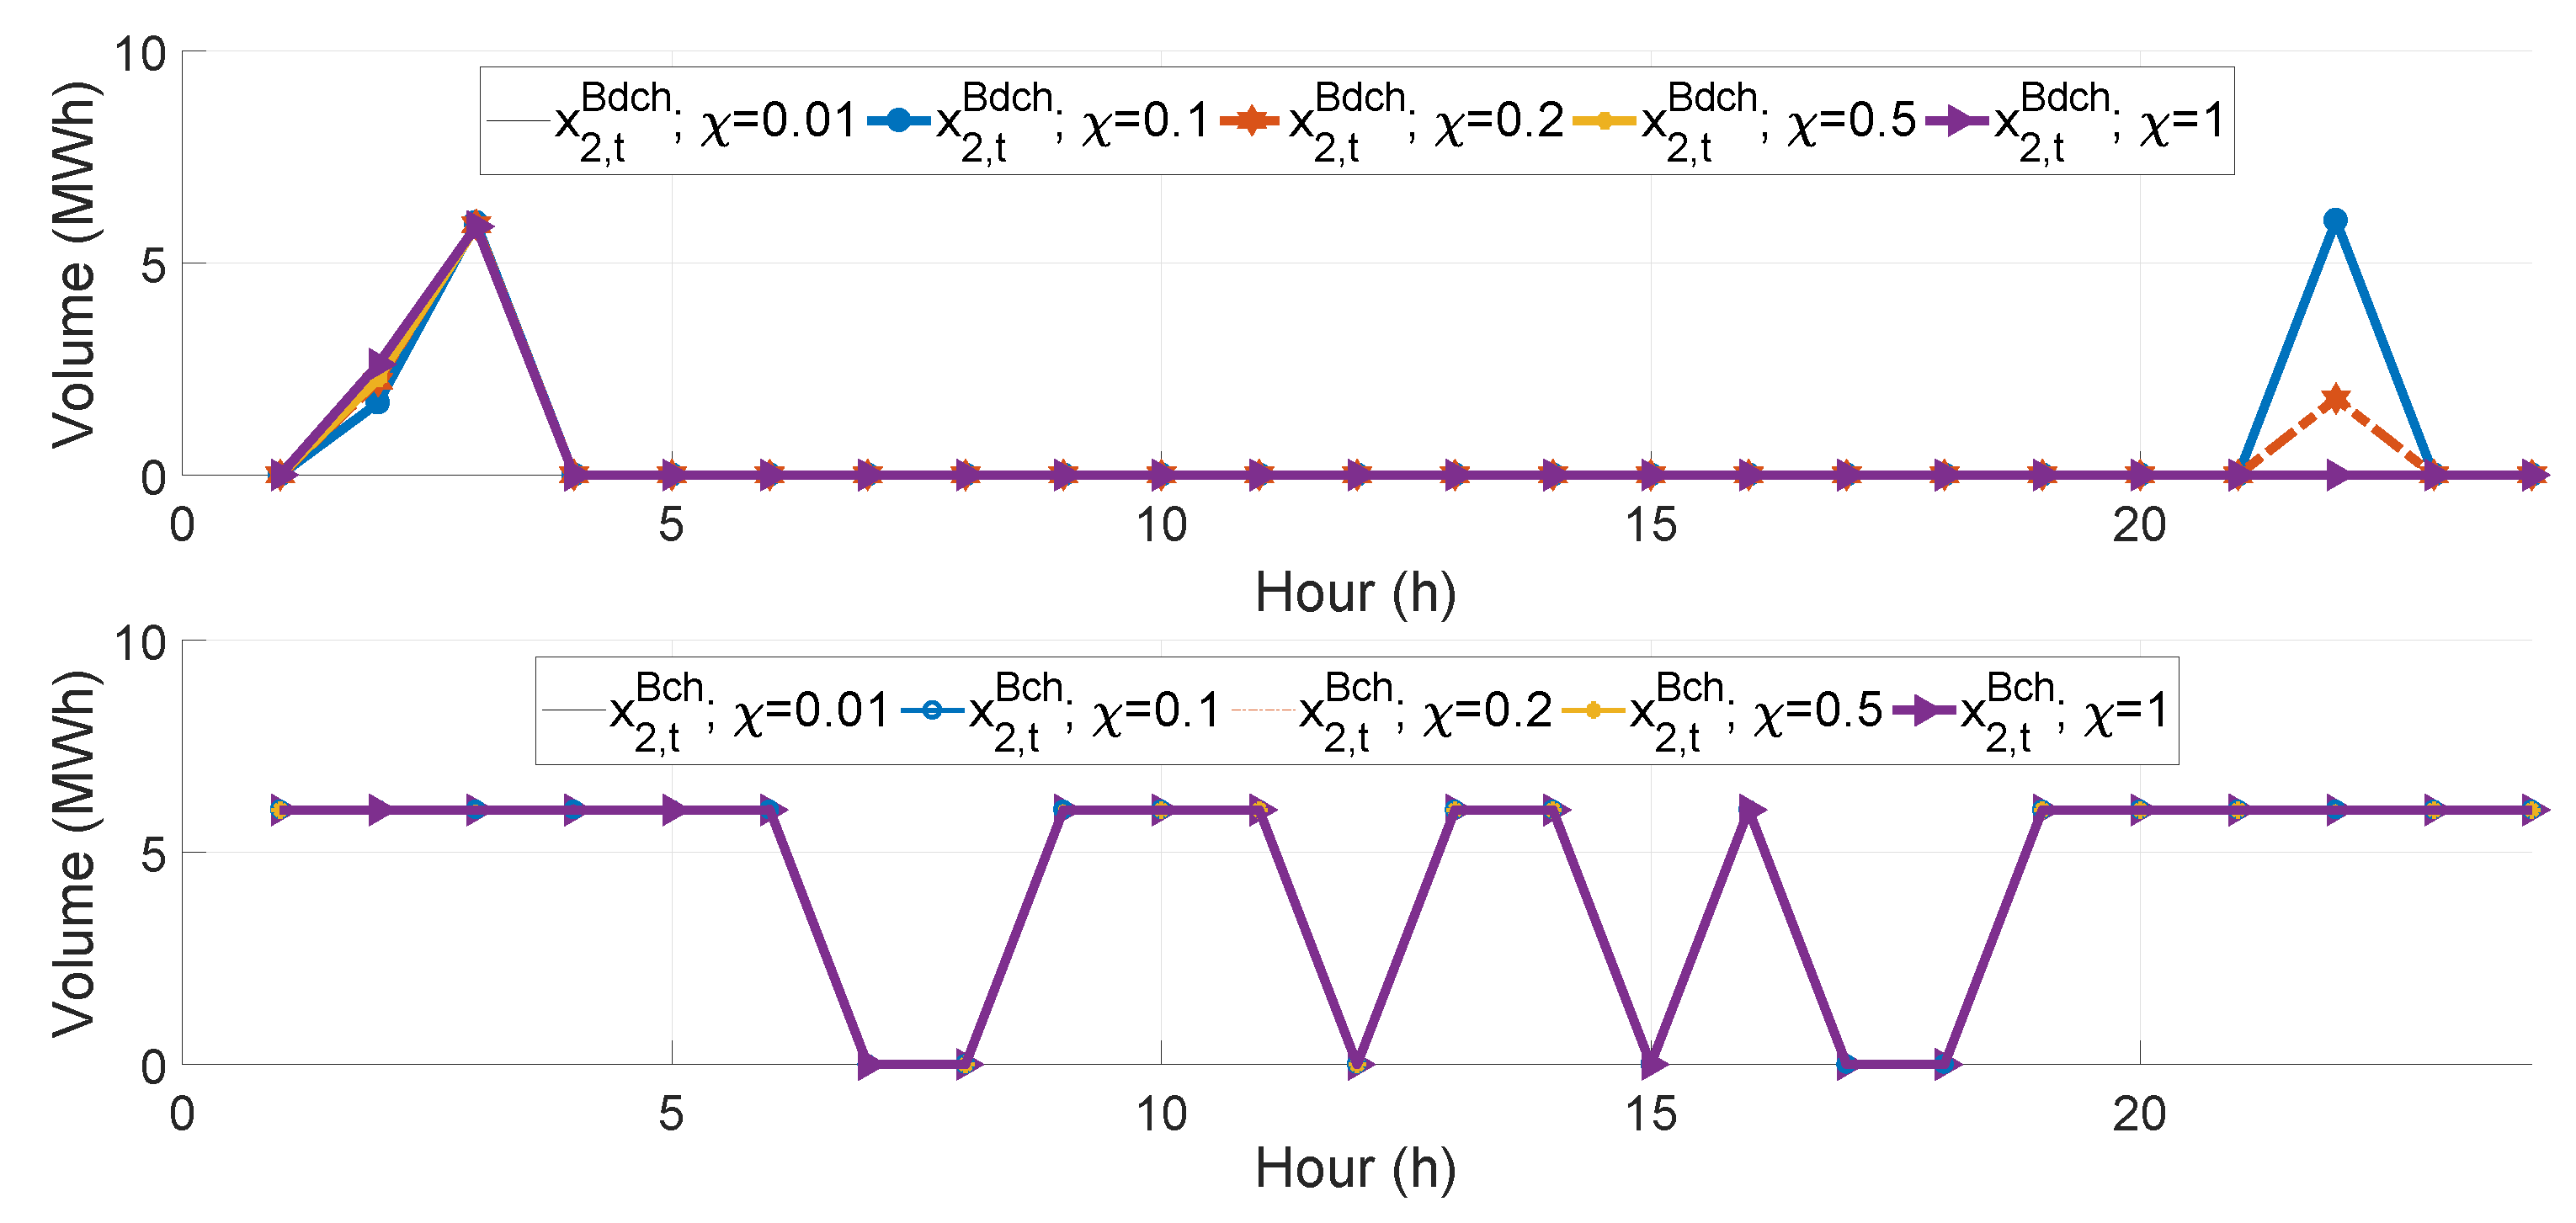
Assuming no bi-lateral contracts and futures markets, the EV aggregator’s risk management applies only the volume traded in day-ahead, intra-day and real-time markets. For chosen levels, day-ahead, intra-day and real-time market bids for the 24 h of the planning period are depicted in Figure 9, Figure 10 and Figure 11. Figure 9 (upper part) shows that the increase in the risk-aversion level causes a volume shift in day-ahead discharging bids for hours 6, 15 and 21. When the bid volume for hour 6 and hour 15 is 6 MWh, while at the other end of the spectrum, for , the bid is reduced to 0 MWh. For hour 21 the day-ahead discharging bid volume decreases from 6 MWh to 4.8 MWh. The day-ahead market charging bids are not affected while giving more weight of the hourly risk measure (see lower part of Figure 9). Accordingly, intra-day market discharging bids for hour 14 and hour 24 and the charging bid for hour 15 are sensitive towards hourly risk measure. Figure 10 illustrates that an increase in the risk aversion level decreases the discharge bid volume for hour 14 whereas it increases the discharge bid volume for hour 24 (upper figure) and the charge bid volume for hour 15 (lower figure). Finally, real-time market discharging bid volumes for hour 3 and hour 22 are the most affected ones. The increase in the risk-aversion level decreases the bid volume for both hours Figure 11 (upper figure). Again the real-time market charging bids are not affected by the inclusion of the risk factor.
Studies have been carried out by incorporating CVaR risk measure in the two-stage SD-MILP (33) and (34) optimization model. The simulated model calculates daily conditional values at risk as −€325. Consequently, an hourly conditional value at risk is = −€17 (considering only available hours) for the EV aggregator. Table 5 summarizes hourly T-CVaR values when T-CVaR risk measure is applied.
According to Table 5, only hours 3, 14, 15, and 19 have an hourly CVaR higher than −€17 and for the rest of the 15 h (when EVs are available), the hourly CVaR is less than the expected value of −€17 from the standard CVaR model. It is apparent that the proposed T-CVaR provides the flexibility to the risk-averse EV aggregator to optimize the lower tails of the aggregator’s hourly profits. Another advantage of the T-CVaR model as compared to the CVaR is that the aggregator can assign more weight to profit risk in a specific hour and thus improve the T-CVaR model, (33) and (34).
6. Conclusions
This paper proposes a two-stage SD-MILP to prepare optimal coordinated bids for day-ahead, intra-day, and real-time markets for a profit-maximizing and risk-averse EV aggregator. The main advantage of the developed SD-MILP model as compared to other bidding strategies is that the model includes intra-day market formulation and provides a potentially attractive market place for an EV aggregator for energy trading. The prices in different market places are forecasted with the proposed Markov-based HW model. The risk of having low profits is handled by incorporation of the hourly conditional value at risk (T-CVaR) into the SD-MILP model. The scenario tree is updated with the released information over time concerning intra-day and real-time market prices by including the rolling planning in the two-stage SD-MILP model. The developed procedure is tested using a fleet of 1000 EVs. Different studies have been carried out and the numerical results discussed. The model statistics and computation time are reported simulating the model with 5000 EVs.
For future work, network constraints can be incorporated into the stochastic model, to simulate and analyze the potential network conditions, study remedies of failures, and investigate the impact of physical and other factors on cost imbalance.
Author Contributions
Research Idea, Y.V.; Problem Formulation, Y.V.; Investigation, Y.V.; Methodology, Y.V.; Funding acquisition, H.M.; Resources, H.M.
Funding
This research received no external funding.
Acknowledgments
This work has been carried out in the context of CITIES projects. The CITIES project is funded by the Danish Innovation found; Grant DSF 1305-00027B (http://smart-cities-centre.org).
Conflicts of Interest
The authors declare no conflict of interest.
Nomenclature
| Abbreviations | |
| MILP | mixed integer linear program; |
| SD-MILP | stochastic dynamically updated MILP; |
| EV | electric vehicle; |
| T-CVaR | hourly CVaR; |
| DER | distributed energy resources; |
| PV | photovoltaic panel; |
| TCL | thermostatically controlled loads; |
| TSO | transmission system operator; |
| EES | electric energy storage; |
| RES | renewable energy source |
| Indices | |
| k | storage indices, ; |
| t | planning periods, ; |
| s | scenarios, ; |
| i | index for possible bid prices |
| Parameters | |
| probabilities associated with the scenarios; | |
| max/min storage rate of discharge/charge [kW]; | |
| max capacity of a storage [kWh]; | |
| scalar to calculate max/min SoC; | |
| charge, discharge efficiency of a storage; | |
| start storage level [kWh]; | |
| end storage level [kWh]; | |
| day-ahead market price scenario [€/MWh]; | |
| intra-day market price scenario [€/MWh]; | |
| real-time market price scenario [€/MWh]; | |
| fixed bid price for day-ahead market [€/MWh]; | |
| fixed bid price for intra-day market [€/MWh]; | |
| fixed bid price for real-time market [€/MWh]; | |
| aggregator’s offer to storage owner [€/MWh]; | |
| capital cost of a storage [€]; | |
| the slope of the linear approximation of the battery life as a function of the cycles; | |
| availability matrix indicating whether EV is available or not; | |
| average hourly driving distance of an EV [km]; | |
| driving efficiency of an EV; | |
| total energy spent on driving [kWh]; | |
| risk aversion level; | |
| significance level; | |
| profit in hour t and scenario s [€]; | |
| sufficiently big constants | |
| Variables | |
| charging/discharging dispatch level for kth storage in day-ahead market [kWh]; | |
| charging/discharging dispatch level for k-th storage in intra-day market [kWh]; | |
| charging/discharging dispatch level for k-th storage in real-time market [kWh]; | |
| energy as day-ahead buying/selling position [kWh]; | |
| buying/selling dispatch volume in intra-day market [kWh]; | |
| down/up-regulating dispatch volume in real-time market [kWh]; | |
| total cost of charging/discharging in day-ahead market [€]; | |
| total cost of charging/discharging in intra-day market [€]; | |
| total cost of charging/discharging in real-time market [€]; | |
| charging/discharging bid volume in day-ahead market [kWh]; | |
| charging/discharging bid volume in intra-day market [kWh]; | |
| charging/discharging bid volume in real-time market [kWh]; | |
| storage level at the end of time step t [kWh]; | |
| value-at-risk for a significance level ; | |
| auxiliary variable employed to calculate hourly CVaR |
References
- Global EV Outlook: Understanding the Electric Vehicle Landscape to 2020. Available online: http://www.iea.org/publications/globalevoutlook_2013.pdf (accessed on 12 October 2017).
- Ortega-Vazquez, M.A.; Bouffard, F.; Silva, V. Electric vehicle aggregator/System Operator coordination for charging scheduling and services procurement. IEEE Trans. Power Syst. 2013, 28, 1806–1815. [Google Scholar] [CrossRef]
- Mohammadi, F. Electric Vehicle Battery Market Analysis: Nickel Metal Hydride. In Proceedings of the 9th Iranian Conference on Electrical and Electronics Engineering, Gonabad, Iran, 28–29 August 2018. [Google Scholar]
- Mohammadi, F. Electric Vehicle Battery Market Analysis: Lead Acid. In Proceedings of the 9th Iranian Conference on Electrical and Electronics Engineering, Gonabad, Iran, 28–29 August 2018. [Google Scholar]
- Mohammadi, F. Electric Vehicle Battery Market Analysis: Lithium-ion. In Proceedings of the First International Conference on Modern Approaches in Engineering Sciences, Tbilisi, Georgia, 21 November 2018. [Google Scholar]
- Lopes, J.A.P.; Soares, F.J.; Almeida, P.M.R. Integration of electric vehicles in the electric power system. Proc. IEEE 2011, 99, 168–183. [Google Scholar] [CrossRef]
- Bessa, R.J.; Matos, M.A.; Soares, F.J.; Lopes, J.A.P. Optimized bidding of a EV aggregation agent in the electricity market. IEEE Trans. Smart Grid 2012, 3, 443–452. [Google Scholar] [CrossRef]
- Sarker, M.; Ortega-Vazquez, M.; Kirschen, D. Optimal coordination and scheduling of demand response via monetary incentives. IEEE Trans. Smart Grid 2015, 6, 1341–1352. [Google Scholar] [CrossRef]
- Bessa, R.J.; Matos, M.A. Global against divided optimization for the participation of an EV aggregator in the day-ahead electricity market. Part I: Theory. Electr. Power Syst. Res. 2013, 95, 309–318. [Google Scholar] [CrossRef]
- Bessa, R.J.; Matos, M.A. Global against divided optimization for the participation of an EV aggregator in the day-ahead electricity market. Part II: Numerical analysis. Electr. Power Syst. Res. 2013, 95, 319–329. [Google Scholar] [CrossRef]
- Vagropoulos, S.I.; Bakirtzis, A.G. Optimal bidding strategy for electric vehicle aggregators in electricity markets. IEEE Trans. Power Syst. 2013, 28, 4031–4041. [Google Scholar] [CrossRef]
- Sortomme, E.; El-Sharkawi, M.A. Optimal combined bidding of vehicle-to-grid ancillary services. IEEE Trans. Smart Grid 2012, 3, 70–79. [Google Scholar] [CrossRef]
- Sortomme, E.; El-Sharkawi, M.A. Optimal scheduling of vehicle-to-grid energy and ancillary services. IEEE Trans. Smart Grid 2012, 3, 351–359. [Google Scholar] [CrossRef]
- Momber, I.; Siddiqui, A.; San Román, T.G.; Söder, L. Risk Averse Scheduling by a PEV Aggregator Under Uncertainty. IEEE Trans. Power Syst. 2015, 30, 882–891. [Google Scholar] [CrossRef]
- Sarker, M.R.; Dvorkin, Y.; Ortega-Vazquez, M.A. Optimal Participation of an Electric Vehicle Aggregator in Day-Ahead Energy and Reserve Markets. IEEE Trans. Power Syst. 2016, 31, 3506–3515. [Google Scholar] [CrossRef]
- Vardanyan, Y.; Banis, F.; Pourmousavi, S.; Madsen, H. Optimal coordinated bidding of a profit-maximizing EV aggregator under uncertainty. In Proceedings of the 5th IEEE International Energy Conference, Limassol, Cyprus, 3–7 June 2018. [Google Scholar]
- Ortega-Vazquez, M.A. Optimal scheduling of electric vehicle charging and vehicle-to-grid services at household level including battery degradation and price uncertainty. IET Gener. Transm. Distrib. 2014, 8, 1007–1016. [Google Scholar] [CrossRef]
- Korolko, N.; Sahinoglu, Z. Robust optimization of EV charging schedules in unregulated electricity markets. IEEE Trans. Smart Grid 2017, 8, 149–157. [Google Scholar] [CrossRef]
- Pantos, M. Exploitation of Electric-Drive Vehicles in Electricity Markets. IEEE Trans. Power Syst. 2012, 27, 682–694. [Google Scholar] [CrossRef]
- Al-Awami, A.; Sortomme, E. Coordinating Vehicle-to-Grid Services With Energy Trading. IEEE Trans. Smart Grid 2011, 3, 453–462. [Google Scholar] [CrossRef]
- Vardanyan, Y.; Hesamzadeh, M. The coordinated bidding of a hydropower producer in three-settlement markets with time-dependent risk measure. Electric Power Syst. Res. 2017, 51, 40–58. [Google Scholar] [CrossRef]
- Song, M.; Amelin, M.; Wang, X.; Saleem, A. Planning and operation models for an EV sharing community in spot and balancing market. IEEE Trans. Smart Grid 2019. [Google Scholar] [CrossRef]
- Wu, H.; Shahidehpour, M.; Alabdulwahab, A.; Abusorrah, A. A game theoretic approach to risk-based optimal bidding strategies for electric vehicle aggregators in electricity markets with variable wind energy resources. IEEE Trans. Sustain. Energy 2016, 7, 374–385. [Google Scholar] [CrossRef]
- Shahidehpour, M.; Yamin, H.; Li, Z. Market Operations in Electric Power Systems: Forecasting, Scheduling and Risk Management; Willy-IEEE Press: Hoboken, NJ, USA, 2002. [Google Scholar]
- Taylor, J.W. Short-term electricity demand forecasting using double seasonal exponential smoothing. J. Oper. Res. Soc. 2003, 54, 799–805. [Google Scholar] [CrossRef] [Green Version]
- Nord Pool Database. Available online: http://www.nordpoolspot.com/ (accessed on 15 August 2017).
- Römisch, W. Scenario Reduction Techniques in Stochastic Programming; Springer: Berlin/Heidelberg, Germany, 2009; pp. 1–14. [Google Scholar]
- Sundström, O.; Binding, C. Flexible Charging Optimization for Electric Vehicles Considering Distribution Grid Constraints. IEEE Trans. Smart Grid 2012, 3, 26–37. [Google Scholar] [CrossRef]
- Van Roy, J.; Leemput, N.; De Breucker, S.; Geth, F.; Tant, P.; Driesen, J. An Availability Analysis and Energy Consumption Model for a Flemish Fleet of Electric Vehicles. In Proceedings of the EEVC European Electric Vehicle Congress, Brussels, Belgium, 26–28 October 2011. [Google Scholar]
- Pesaran, A.; Markel, T.; Tataria, H.S.; Howell, D. Battery Requirements for Plug-In Hybrid Electric Vehicles—Analysis and Rationale. In Proceedings of the 23rd International Electric Vehicle Symposium, Anaheim, CA, USA, 2–5 December 2007. [Google Scholar]
Figure 1.
Decision process framework.

Figure 2.
Illustration of the rolling planning approach implemented in the two-stage optimal bidding model.
Figure 2.
Illustration of the rolling planning approach implemented in the two-stage optimal bidding model.
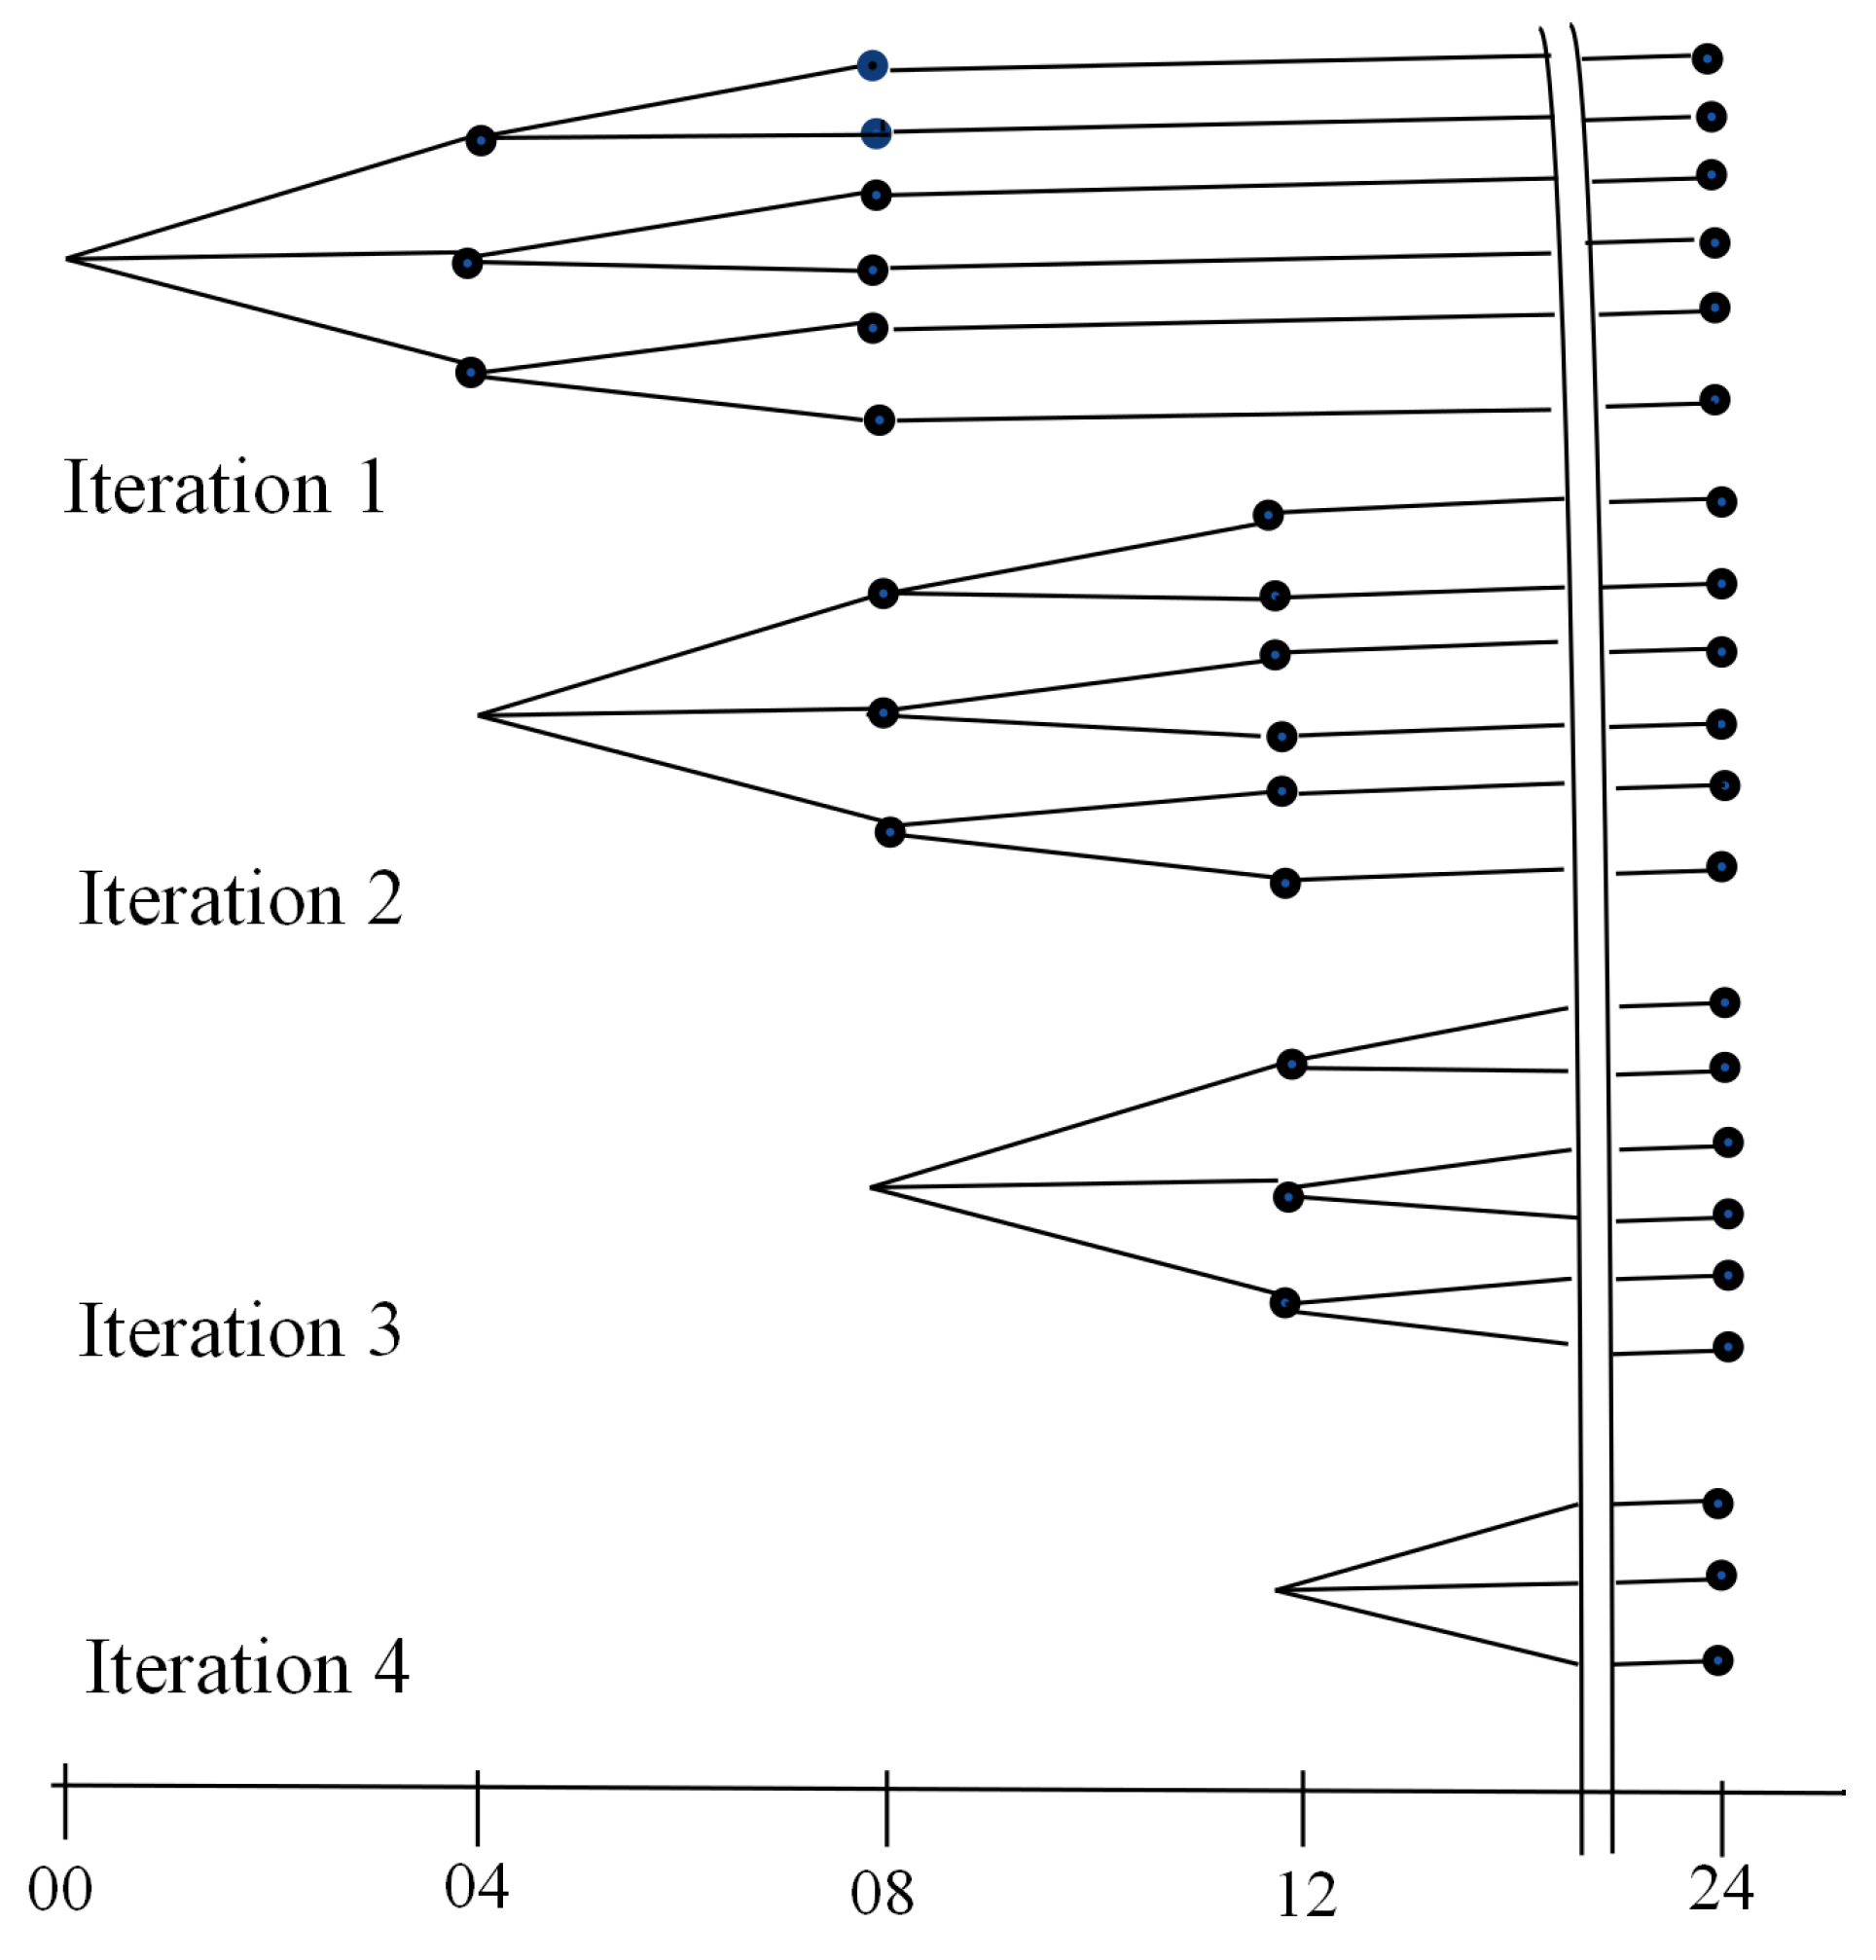
Figure 3.
Flowchart of the proposed algorithm for deriving the optimal coordinated bidding curves to day-ahead, intra-day, and real-time markets.
Figure 3.
Flowchart of the proposed algorithm for deriving the optimal coordinated bidding curves to day-ahead, intra-day, and real-time markets.
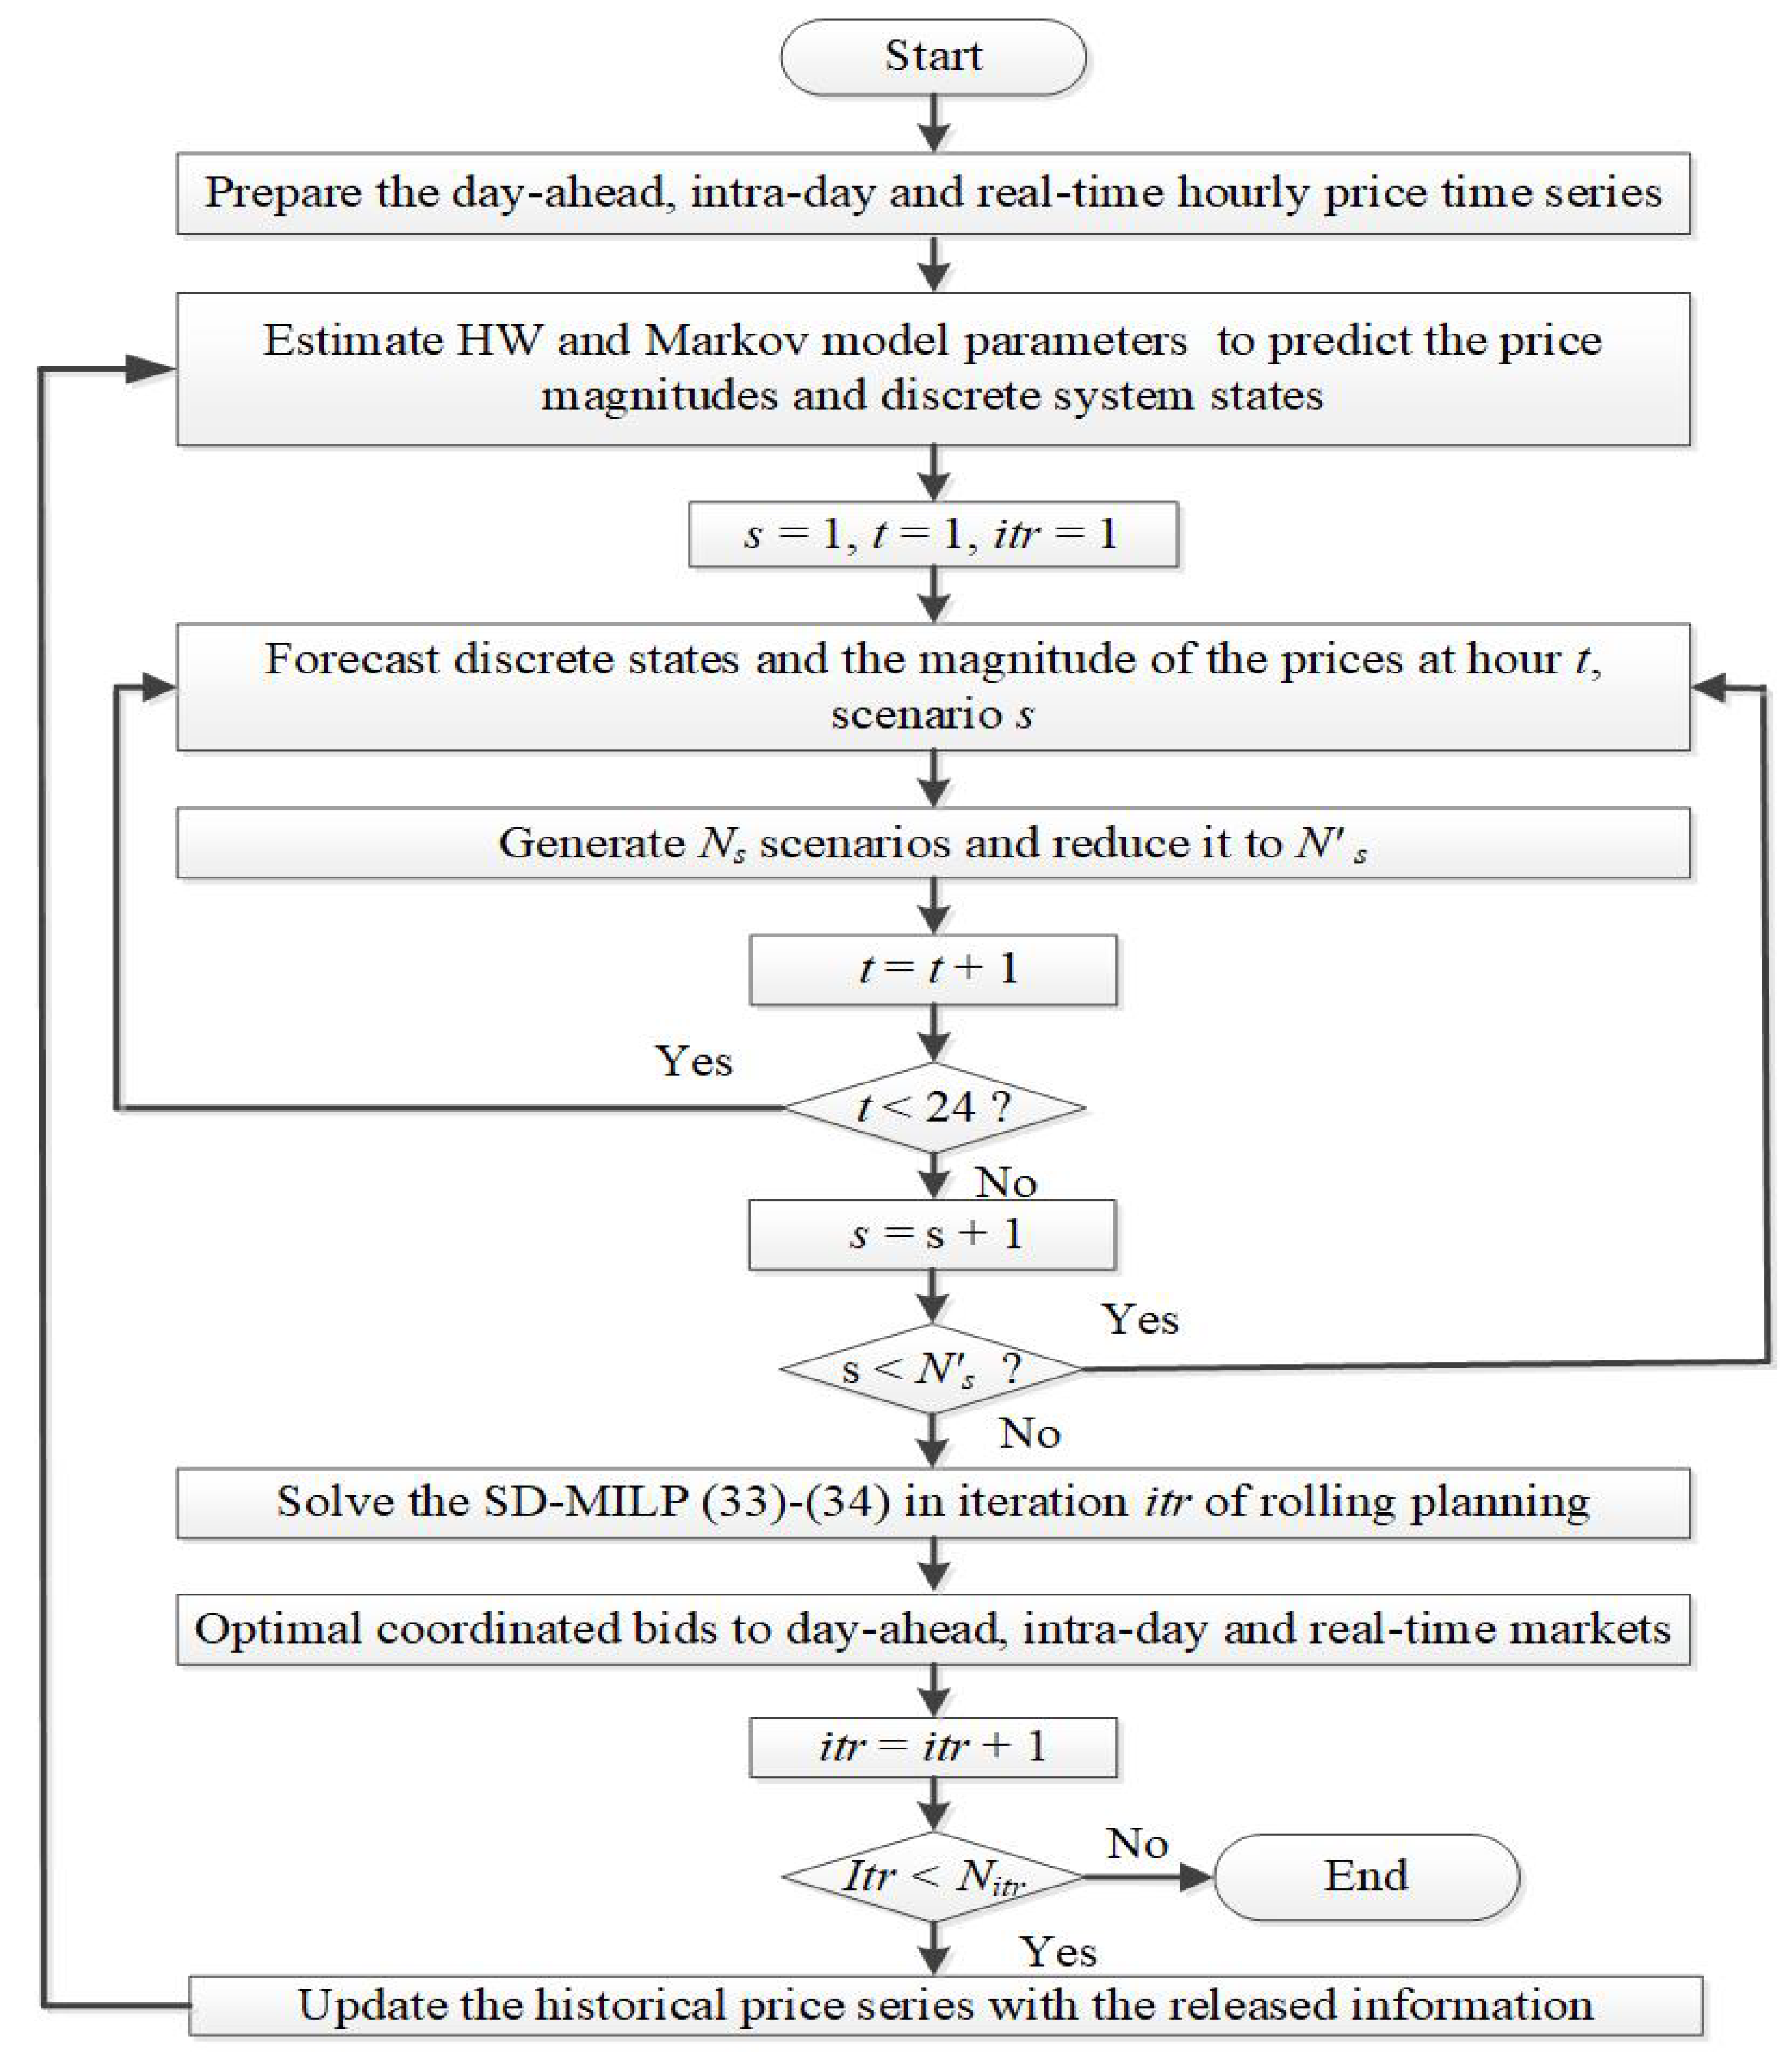
Figure 4.
Computation time as a function of the number of electric vehicles (EVs).
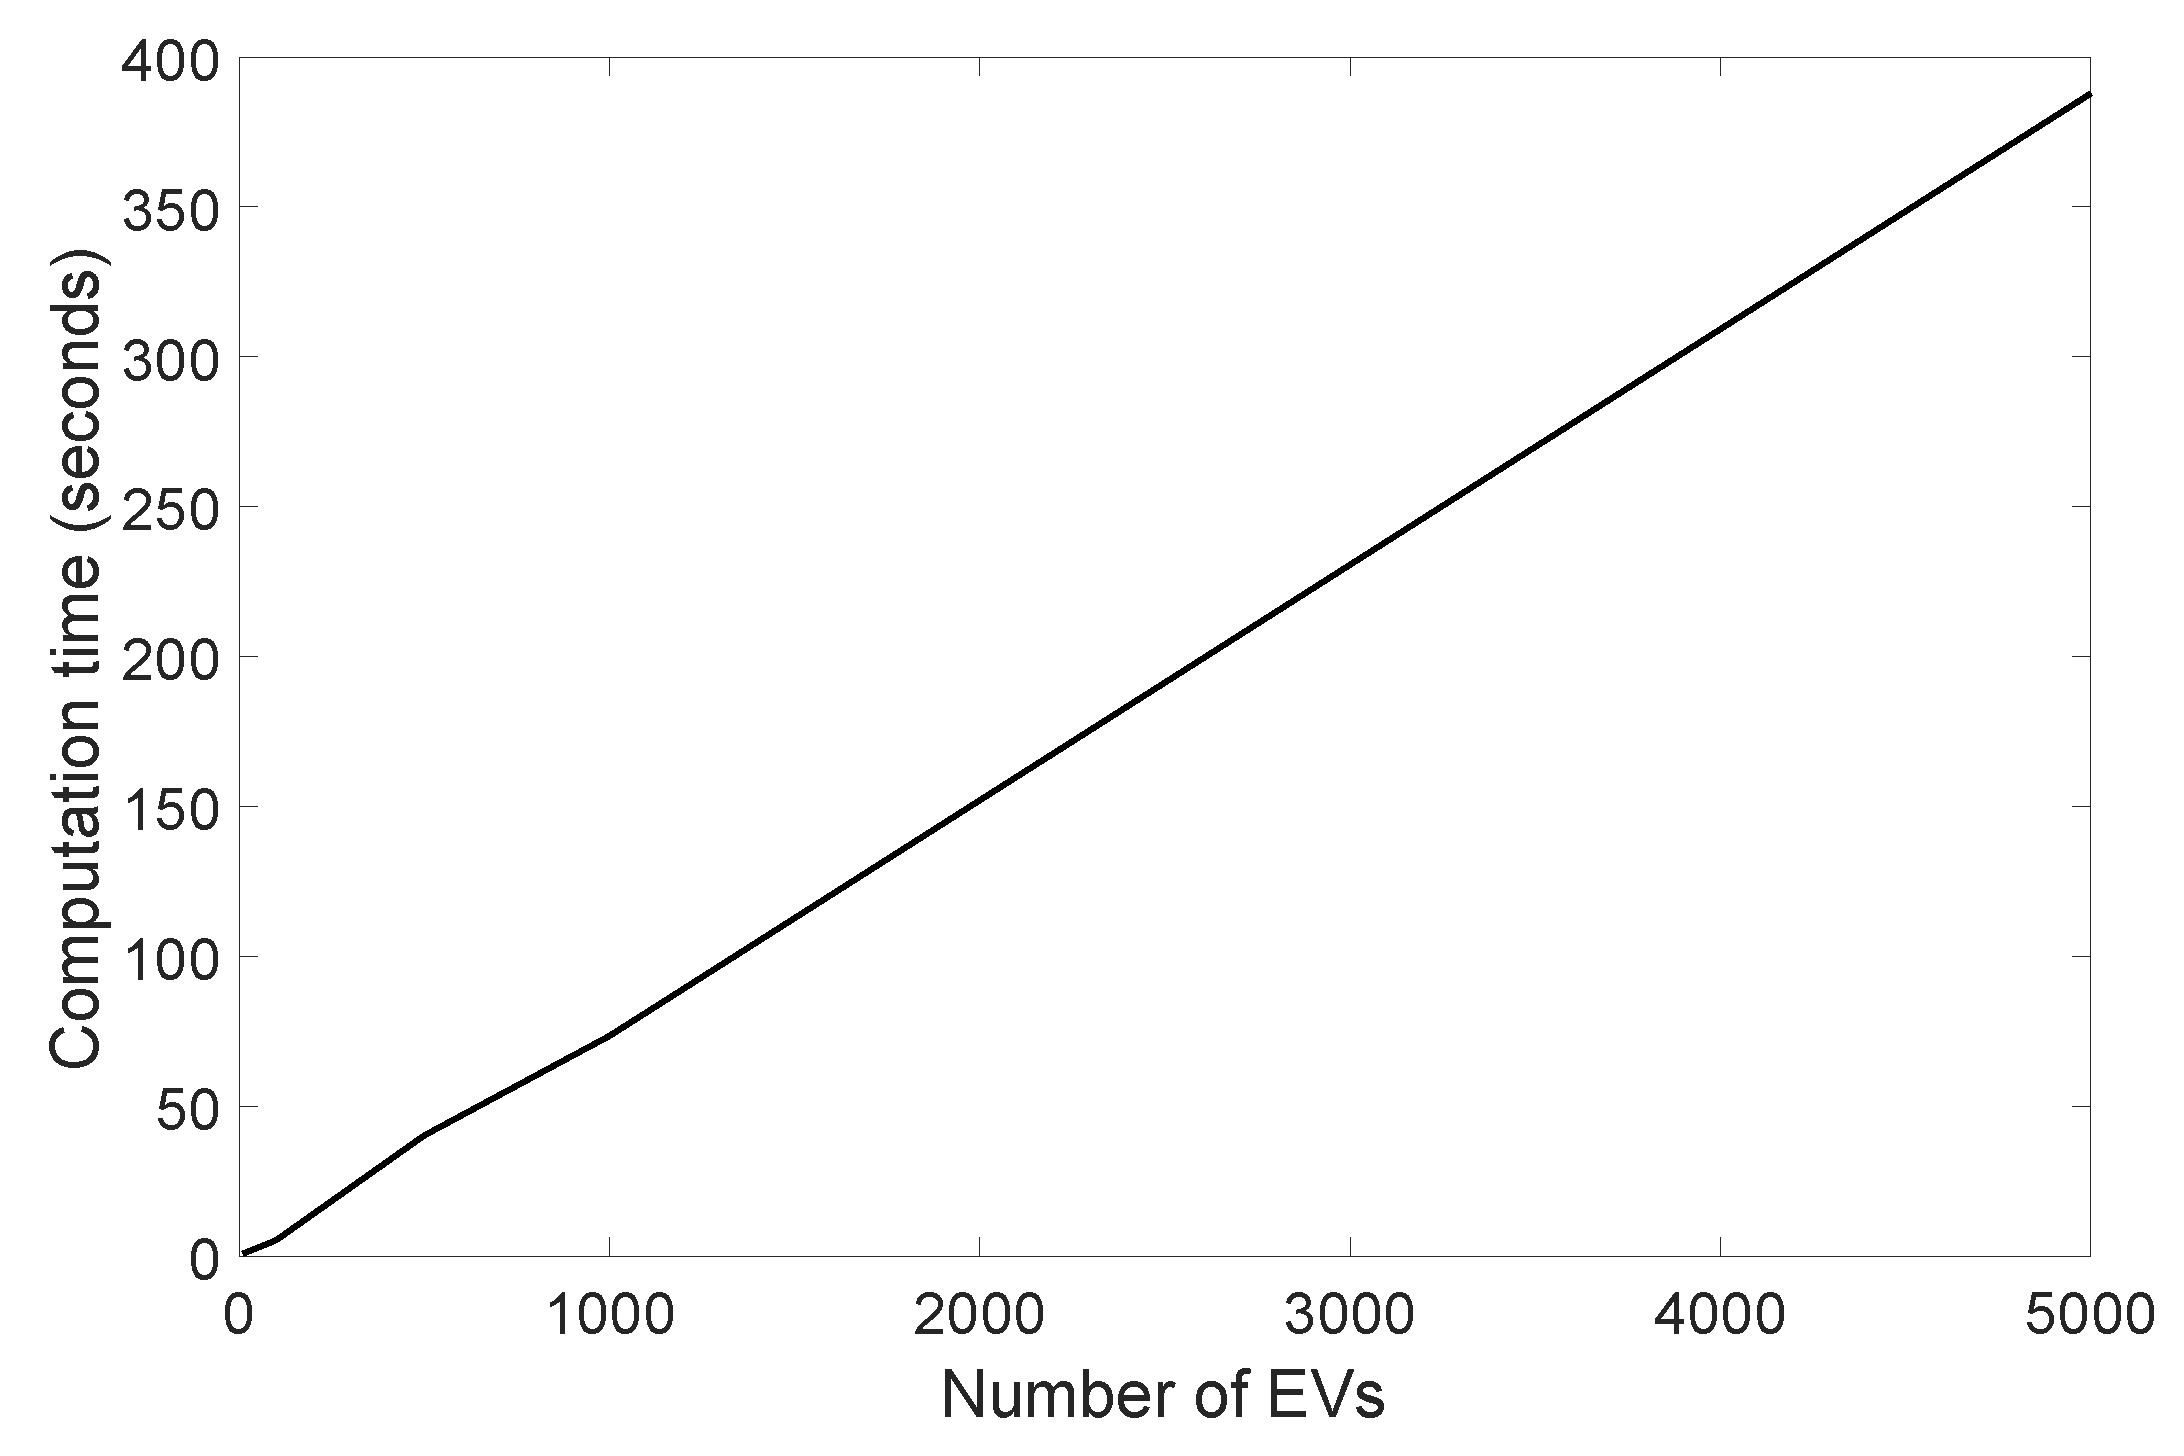
Figure 5.
The optimal coordinated bidding in the day-ahead market for four iterations of rolling planning ().
Figure 5.
The optimal coordinated bidding in the day-ahead market for four iterations of rolling planning ().
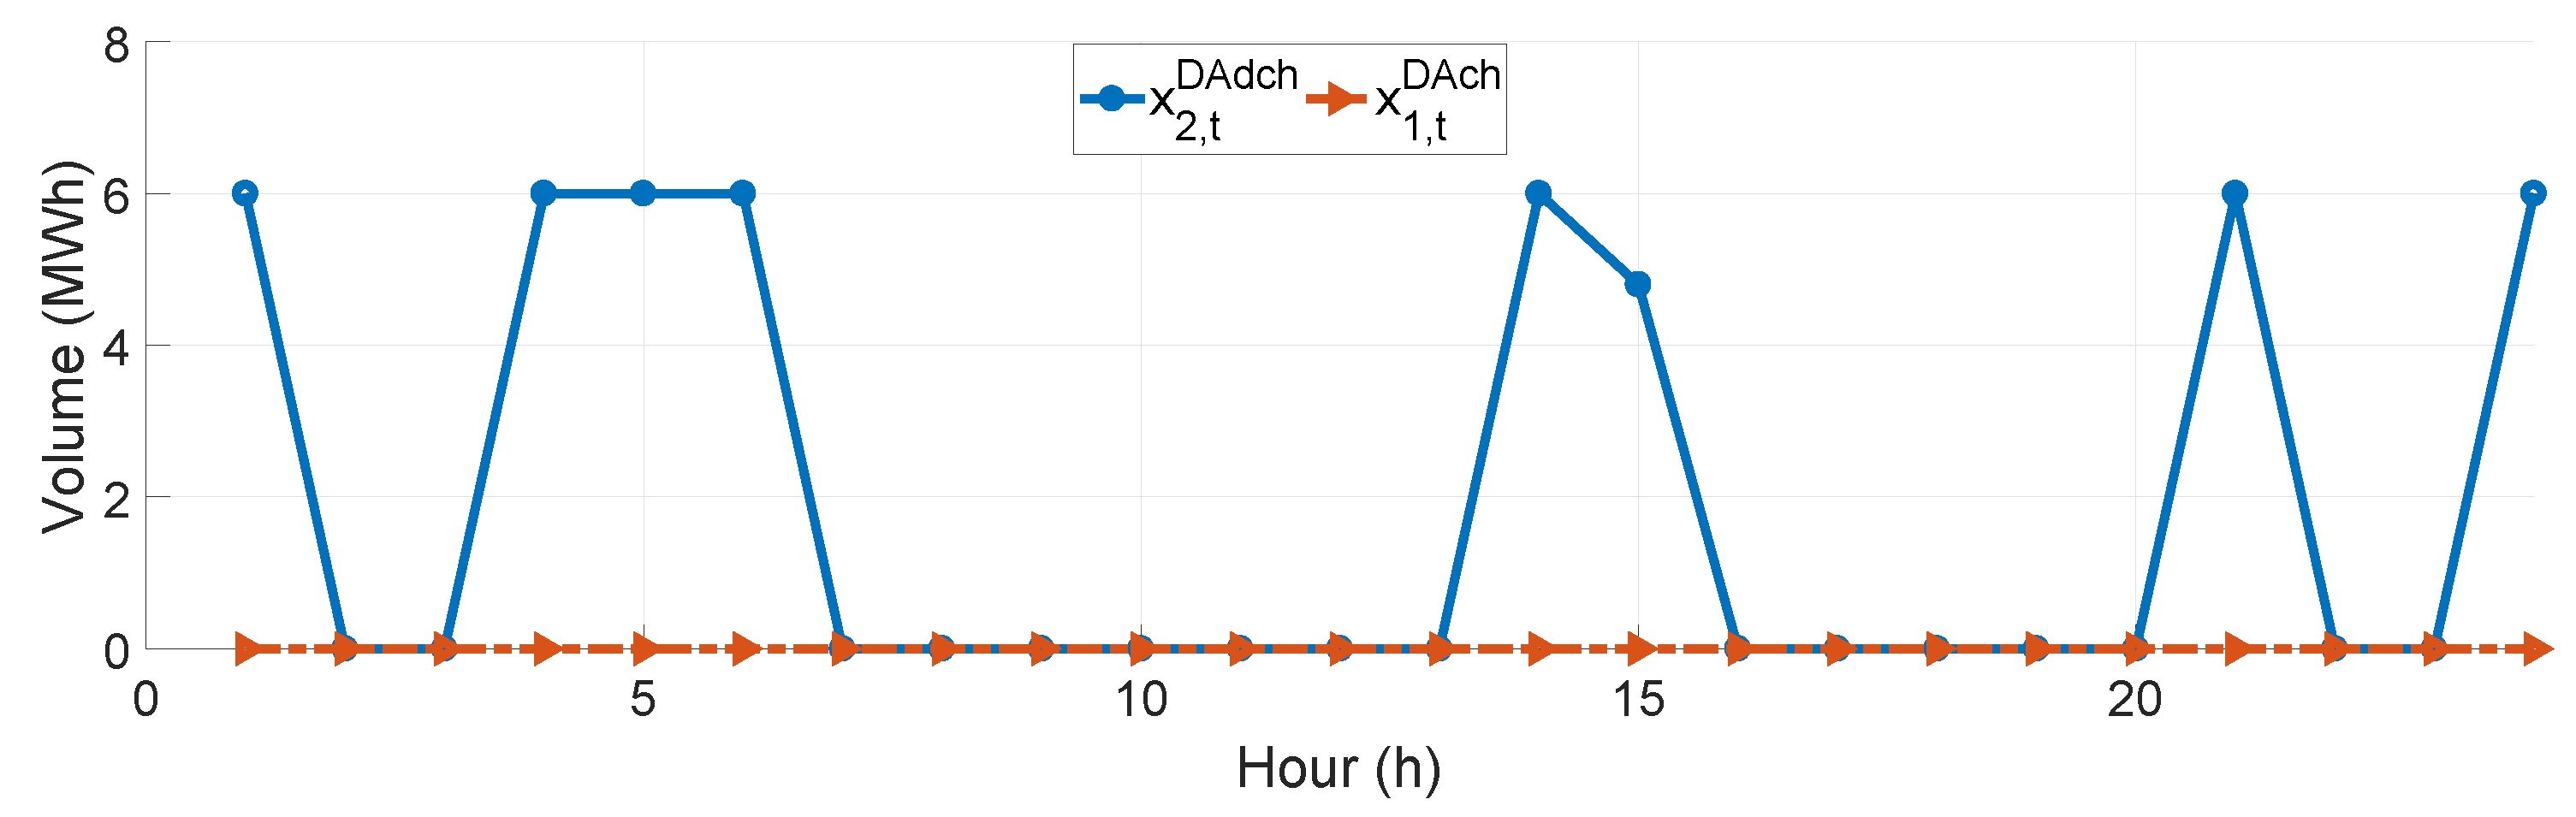
Figure 6.
The optimal coordinated bidding in the intra-day market for four iterations of rolling planning ().
Figure 6.
The optimal coordinated bidding in the intra-day market for four iterations of rolling planning ().
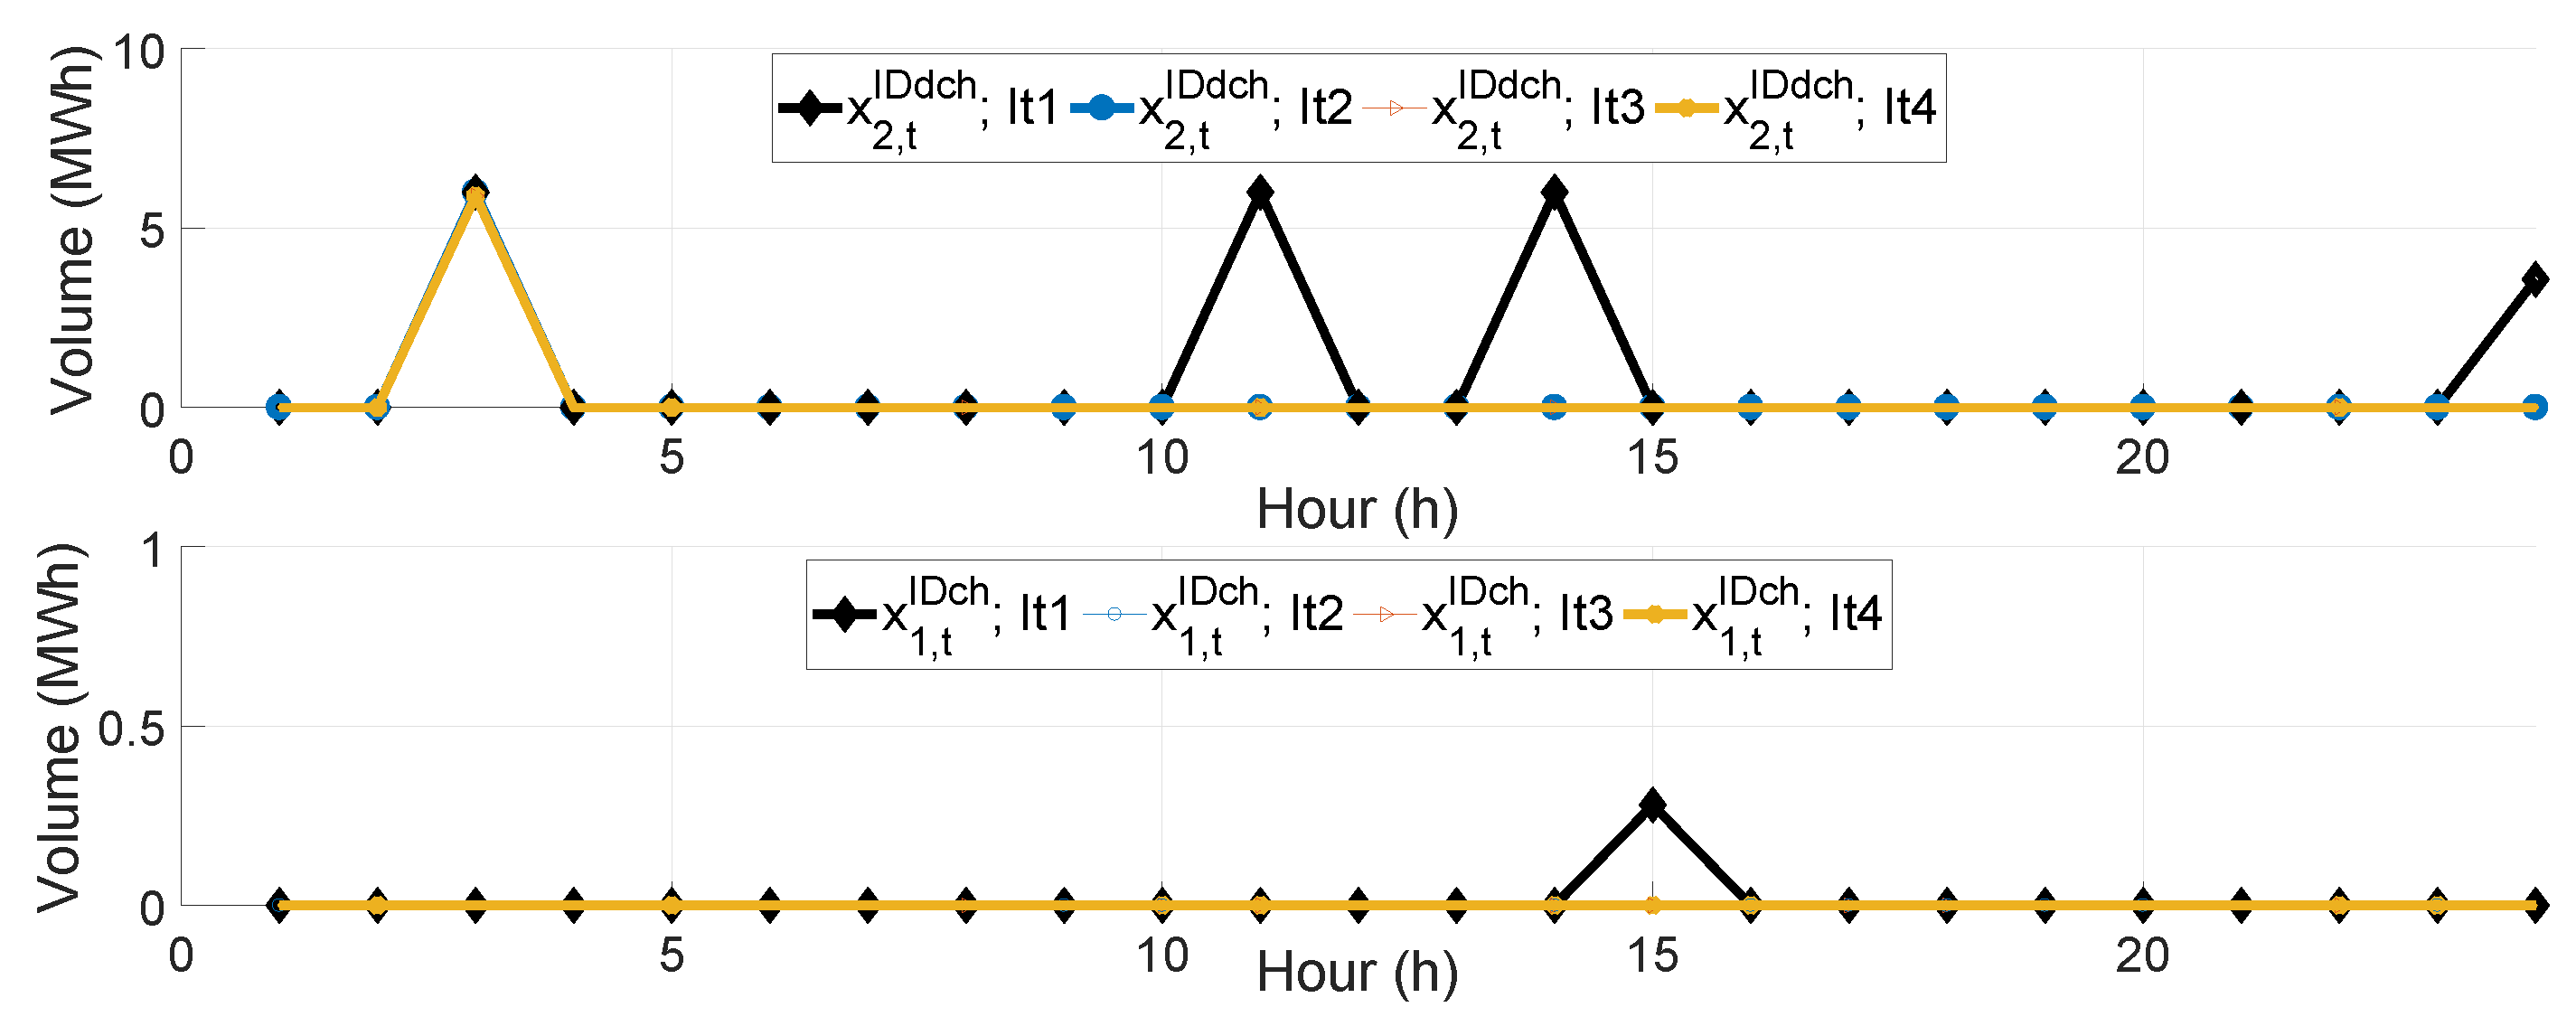
Figure 7.
The optimal coordinated bidding in the real-time market for four iterations of rolling planning ().
Figure 7.
The optimal coordinated bidding in the real-time market for four iterations of rolling planning ().
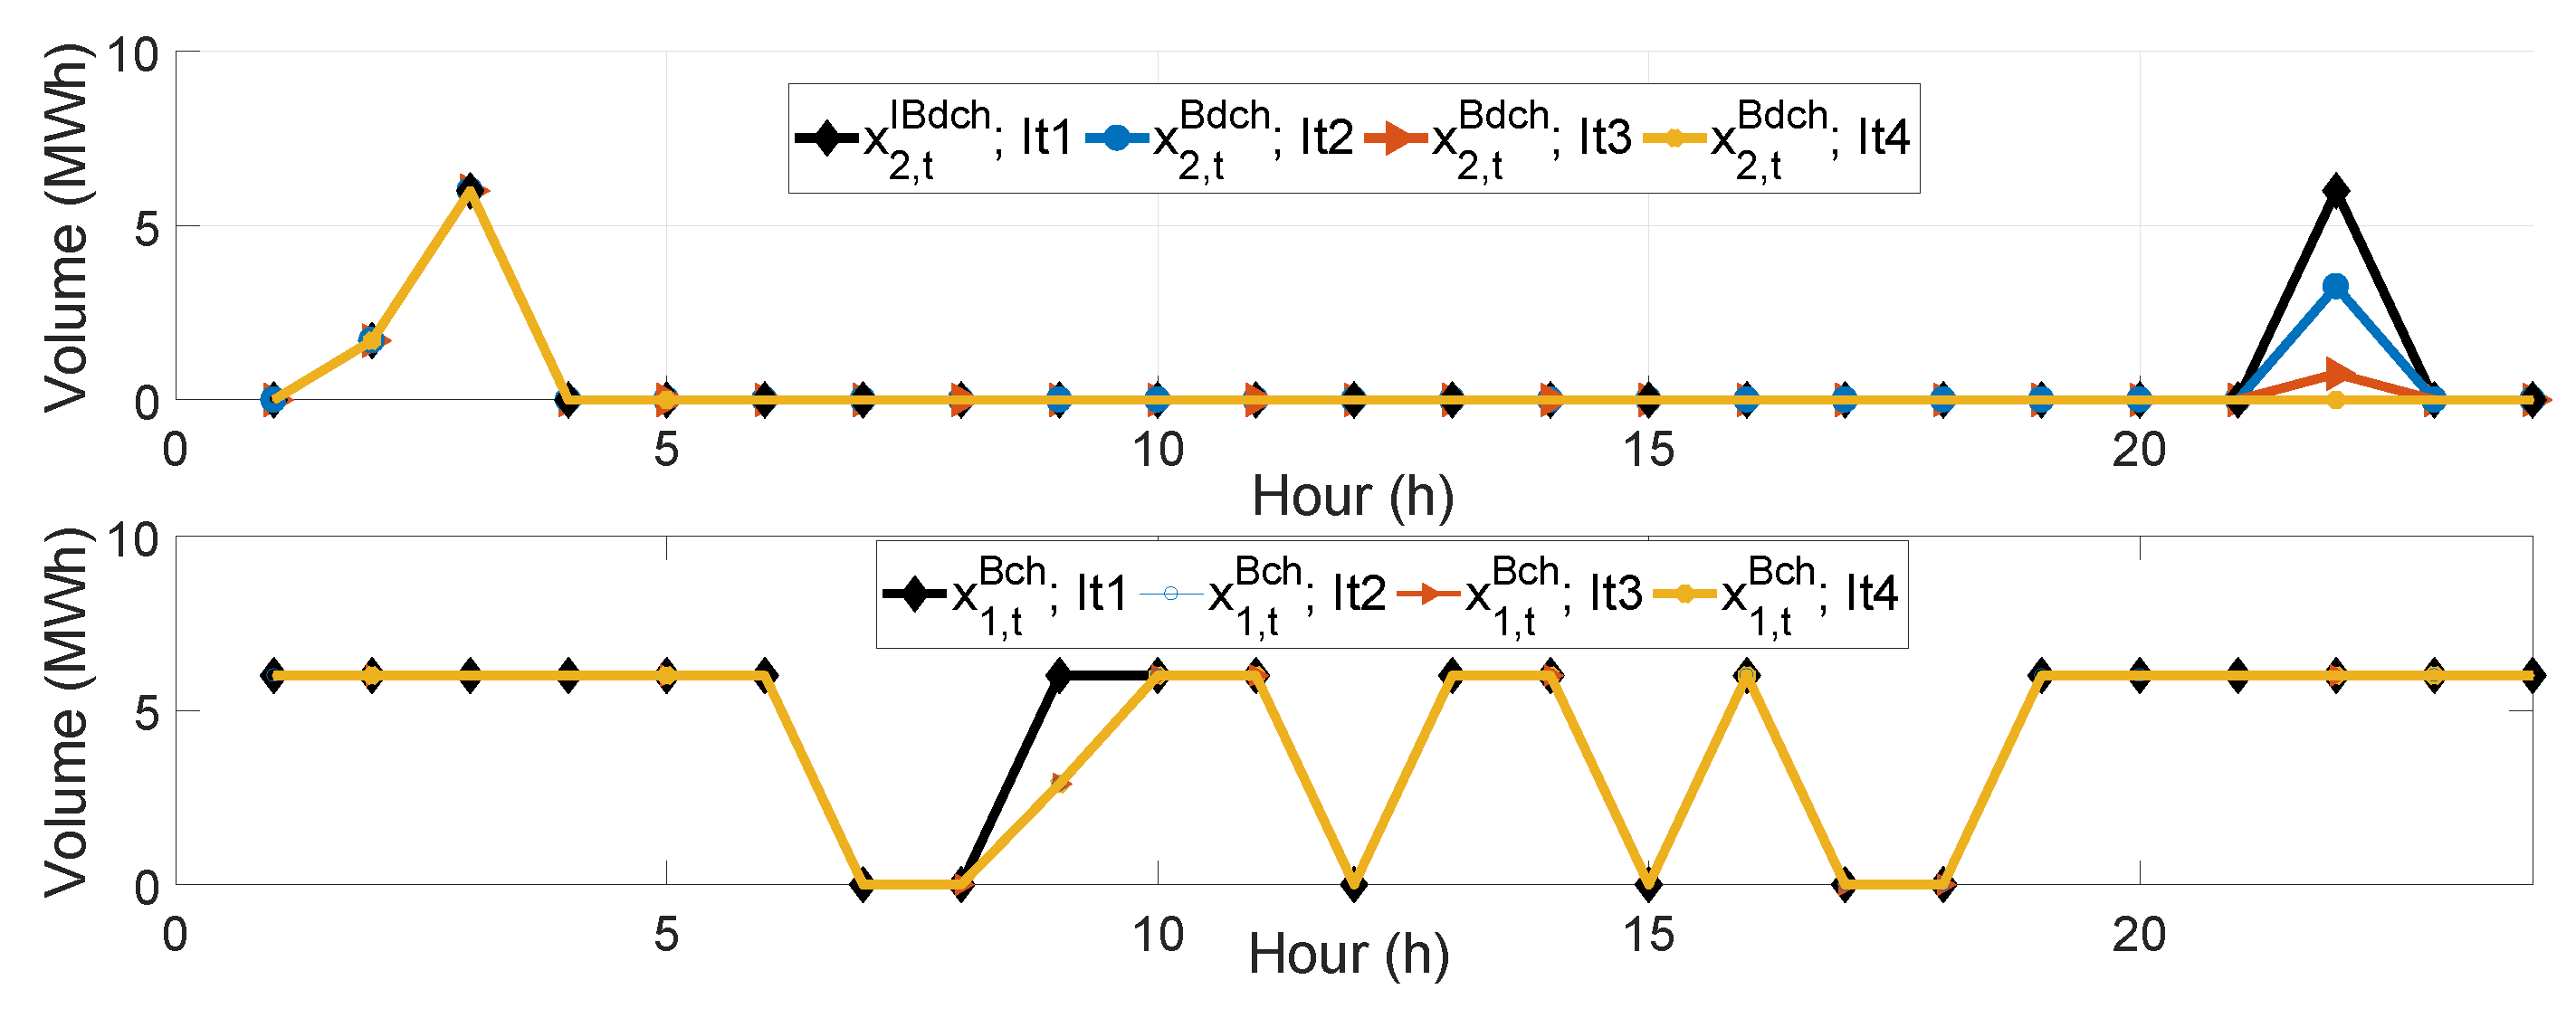
Figure 8.
The profit frontier.
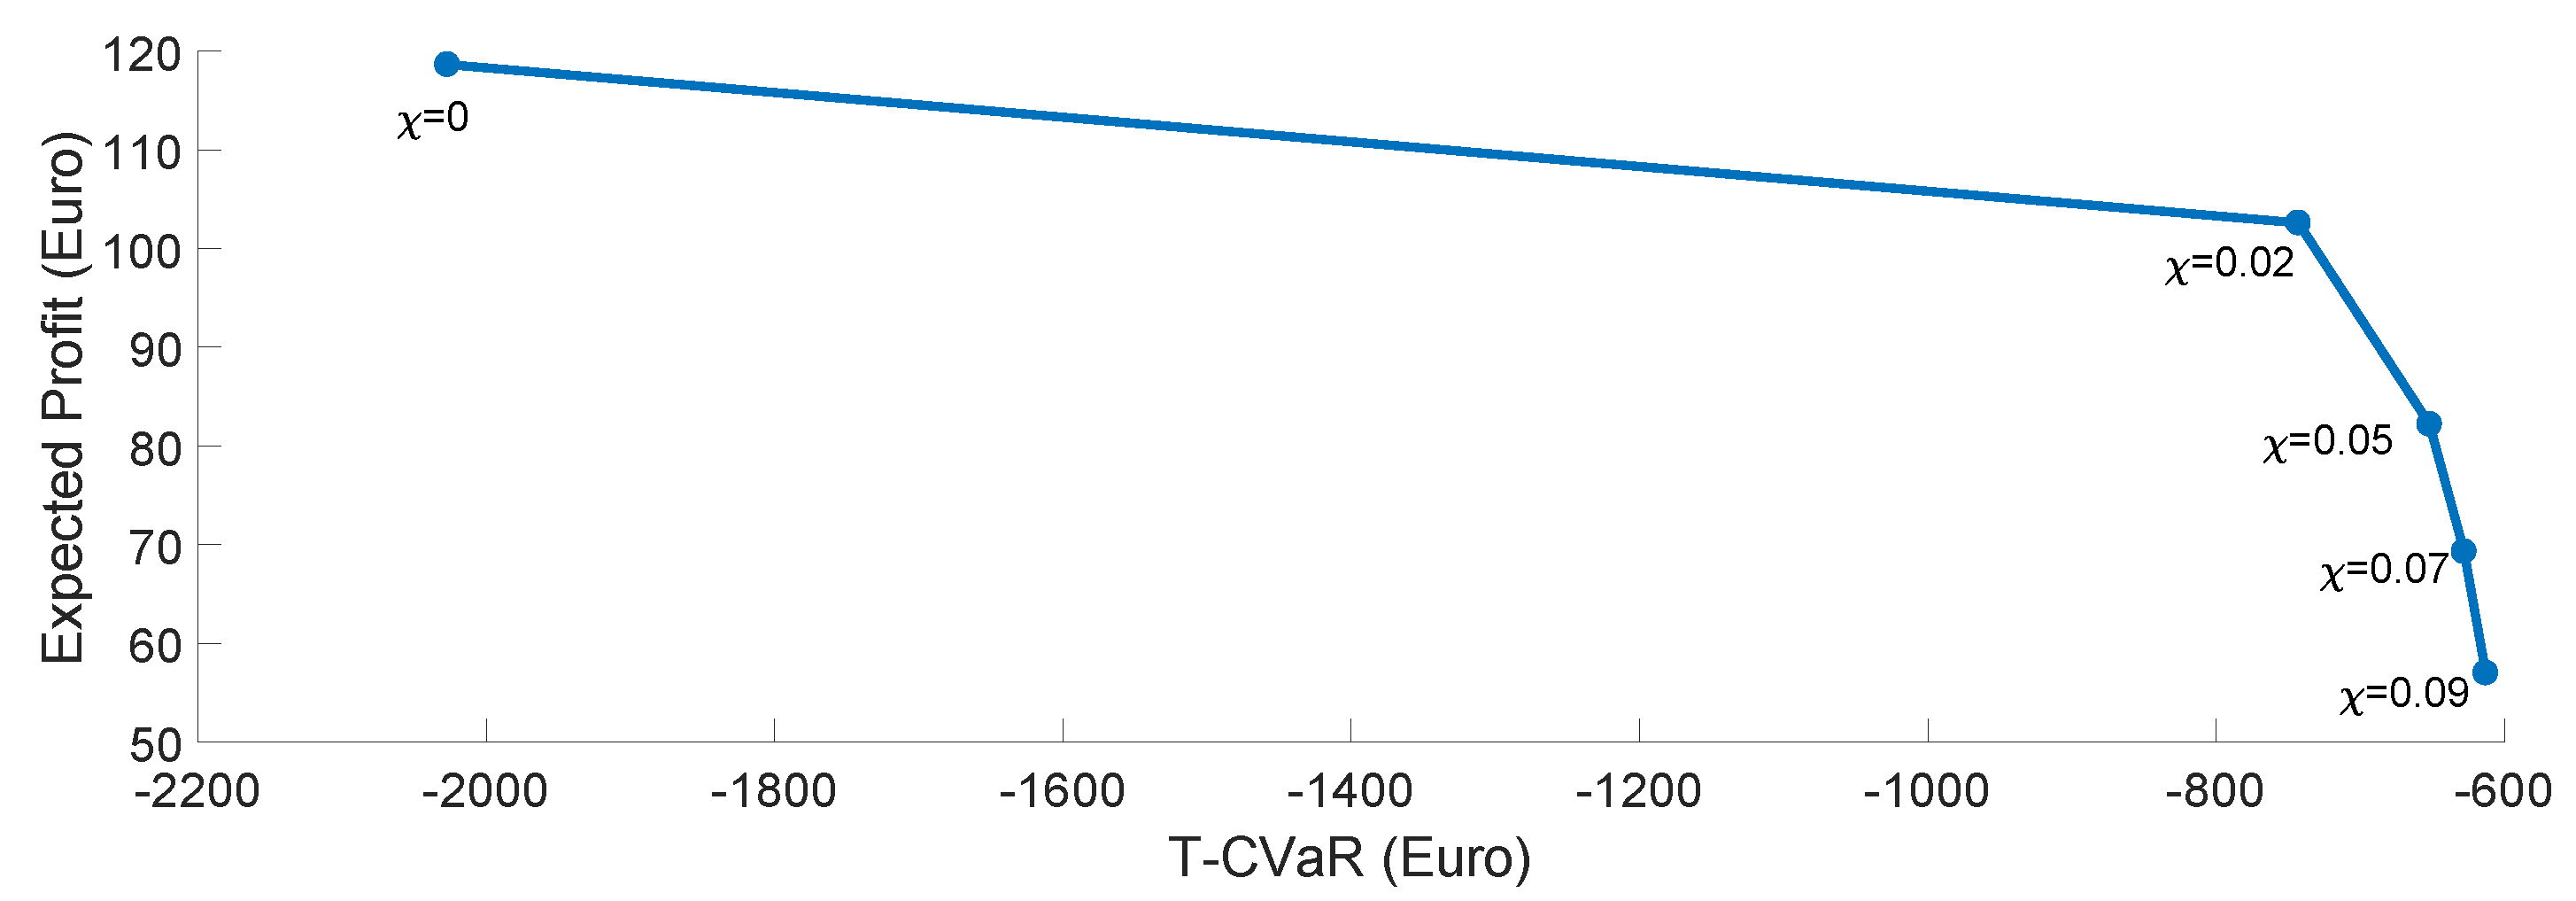
Figure 9.
Day-ahead trading strategies; hourly conditional value at risk (T-CVaR) risk aversion shift in day-ahead bids of 24 h of planning day (upper figure-discharging bids, lower figure-charging bids).
Figure 9.
Day-ahead trading strategies; hourly conditional value at risk (T-CVaR) risk aversion shift in day-ahead bids of 24 h of planning day (upper figure-discharging bids, lower figure-charging bids).

Figure 10.
Intra-day trading strategies; T-CVaR risk aversion shift in intra-day bids of 24 h of planning day (upper figure-discharging bids, lower figure-charging bids).
Figure 10.
Intra-day trading strategies; T-CVaR risk aversion shift in intra-day bids of 24 h of planning day (upper figure-discharging bids, lower figure-charging bids).
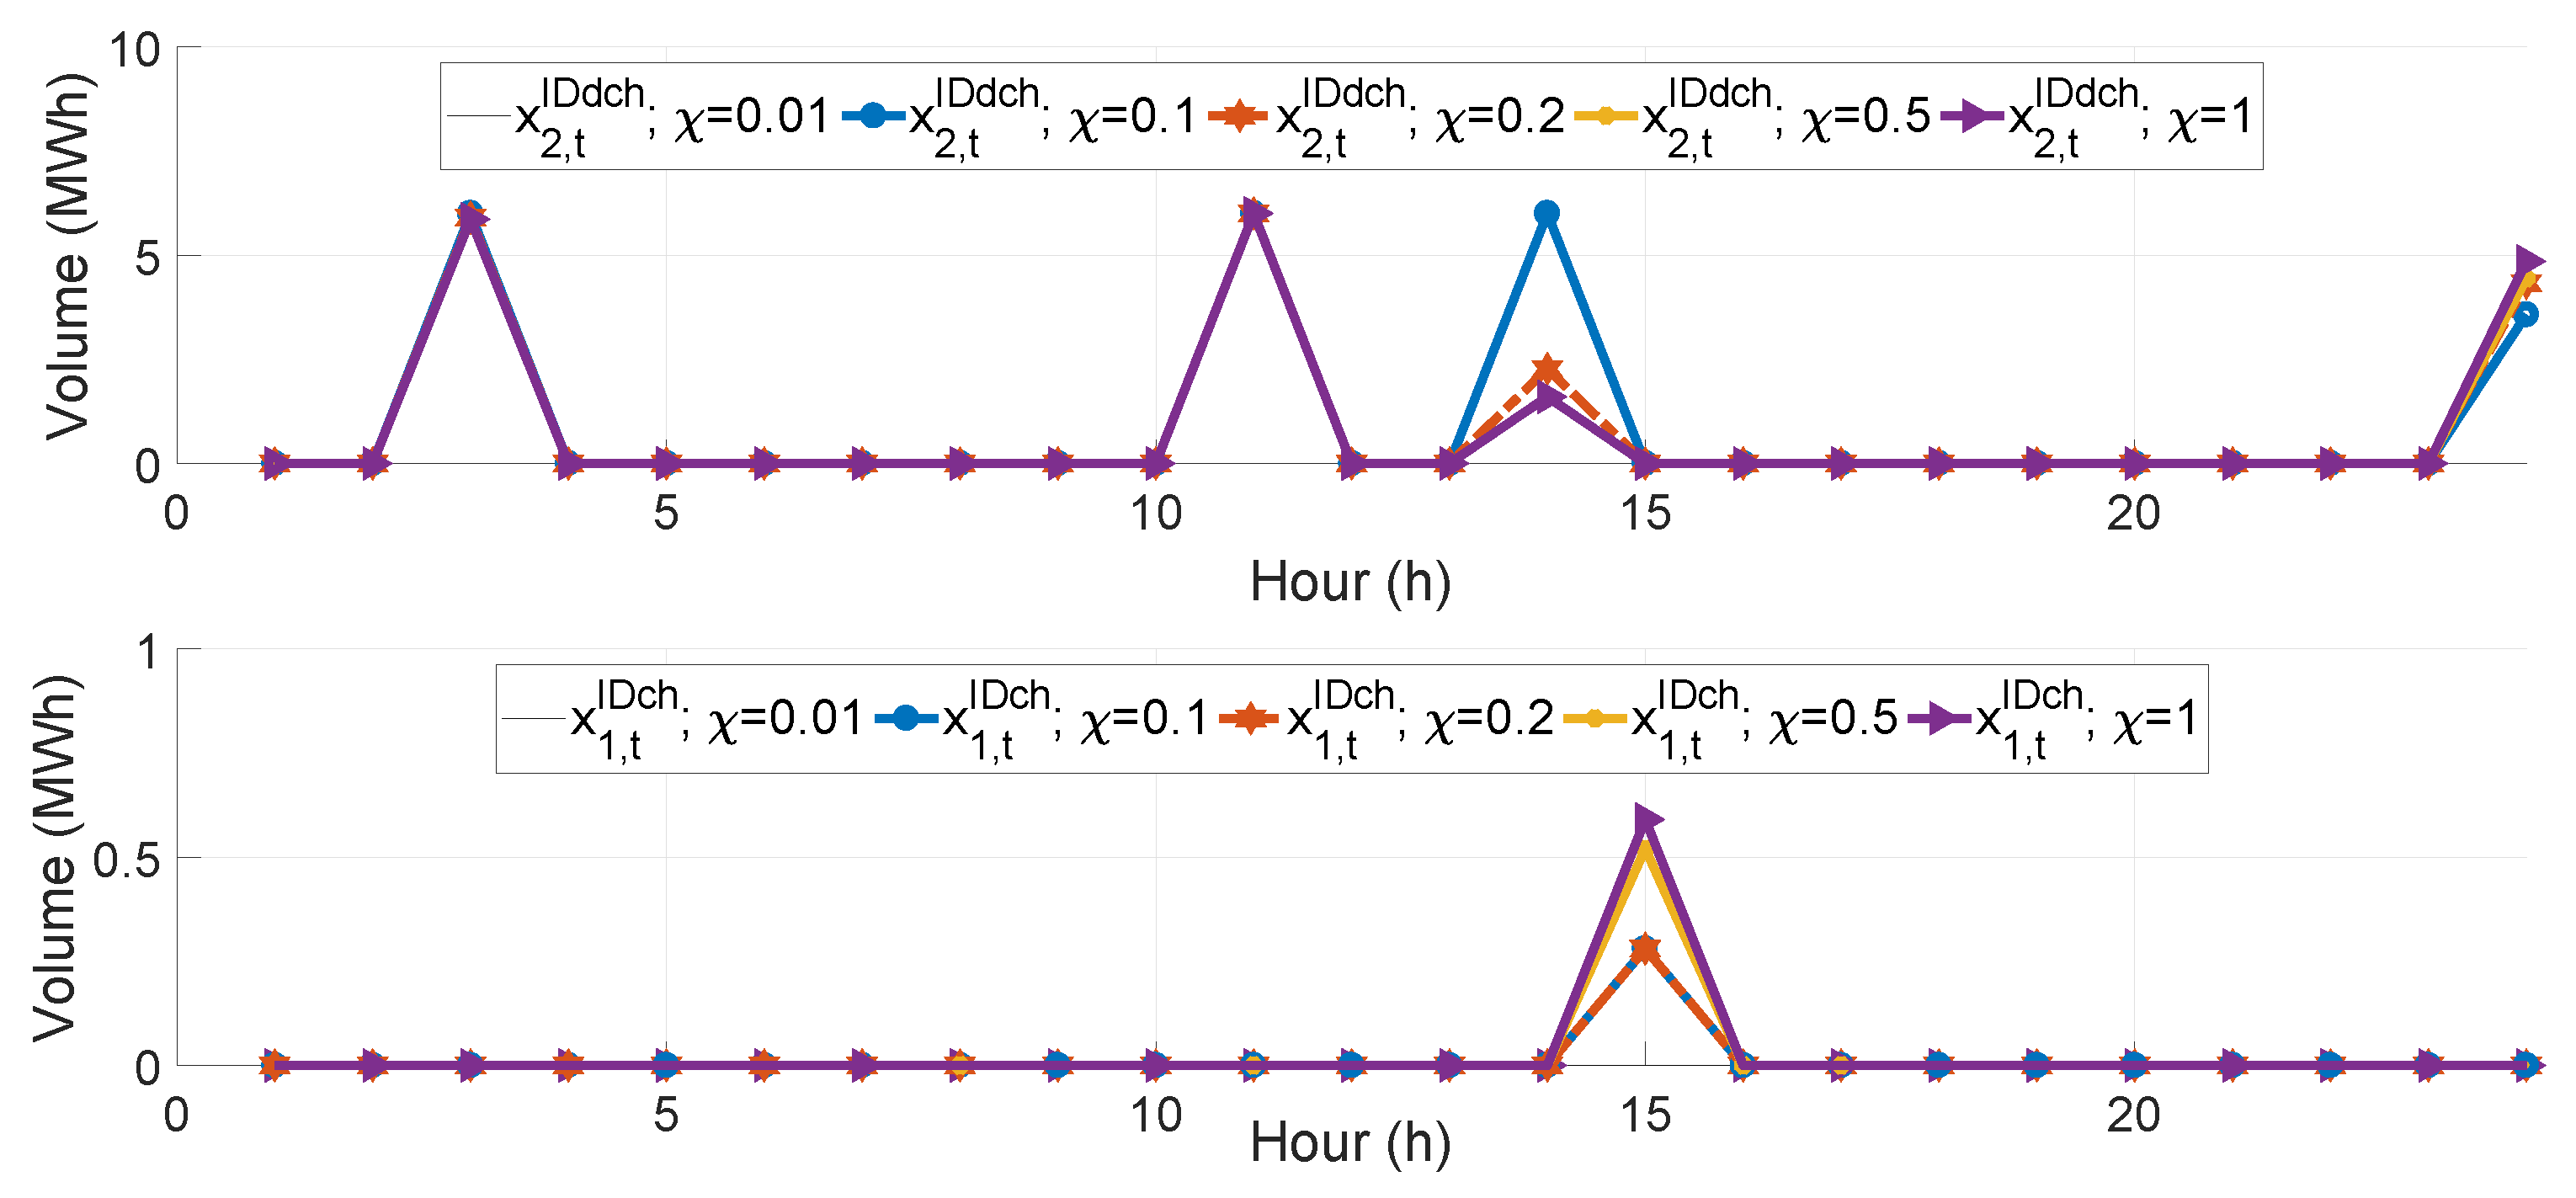
Figure 11.
Real-time trading strategies; T-CVaR risk aversion shift in real-time bids of 24 h of planning day (upper figure-discharging bids, lower figure-charging bids).
Figure 11.
Real-time trading strategies; T-CVaR risk aversion shift in real-time bids of 24 h of planning day (upper figure-discharging bids, lower figure-charging bids).

Table 1.
General input parameters. Par.: parameter, Ref.: reference.
| Par. | Value | Units | Ref. | Par. | Value | Units | Ref. |
|---|---|---|---|---|---|---|---|
| 50 | KWh | [28] | 90% | [29] | |||
| 20 % | [30] | 93% | [29] | ||||
| 100% | [30] | 60% | |||||
| 6 | KW | [28] | 200 | € | [15] | ||
| 6 | KW | [28] | −[0.0013] | [15] |
Table 2.
Model solution report for a fleet of 1000 EVs; = 0.01, It.: itertaion.
| It. 1 | It. 2 | It. 3 | It. 4 | |
|---|---|---|---|---|
| (€) | 110.31 | 101.87 | 77.1 | 76.26 |
| Comp. time (second) | 68.34 | 58.3 | 59.56 | 63.76 |
Table 3.
Model statistics for different cases.
| Number of EVs | 10 | 100 | 500 | 1000 | 5000 |
| Continuous variables | 73,177 | 526,777 | 2,542,777 | 5,062,777 | 25,150,802 |
| Discrete variables | 12,960 | 12,960 | 12,960 | 12,960 | 12,960 |
| Constraints | 115,921 | 569,521 | 2,585,521 | 5,105,521 | 25,205,521 |
| Comp. time (second) | 0.78 | 5.3 | 40.25 | 73.76 | 387.84 |
Table 4.
Day-ahead, intra-day and real-time market trading with increased volatility of market prices; = 0.
Table 4.
Day-ahead, intra-day and real-time market trading with increased volatility of market prices; = 0.
| Base Prices | Volatile Prices | Difference in % | |
|---|---|---|---|
| Day-ahead trading (€) | 183 | 9 | 95% decrease |
| Intra-day trading (€) | 64 | 413 | 85% increase |
| Real-time trading (€) | 1924 | 1983 | 3% increase |
Table 5.
The hourly hourly conditional value at risk (T-CVaR) values; .
| Hours | T-CVaR (€) | Hours | T-CVaR (€) | Hours | T-CVaR (€) |
|---|---|---|---|---|---|
| 1 | 9 | 0 | 17 | 0 | |
| 2 | 10 | 18 | 0 | ||
| 3 | * | 11 | 19 | * | |
| 4 | 12 | 20 | |||
| 5 | 13 | 21 | |||
| 6 | 14 | * | 22 | ||
| 7 | 0 | 15 | * | 23 | |
| 8 | 0 | 16 | 24 |
© 2019 by the authors. Licensee MDPI, Basel, Switzerland. This article is an open access article distributed under the terms and conditions of the Creative Commons Attribution (CC BY) license (http://creativecommons.org/licenses/by/4.0/).
Share and Cite
MDPI and ACS Style
Vardanyan, Y.; Madsen, H. Optimal Coordinated Bidding of a Profit Maximizing, Risk-Averse EV Aggregator in Three-Settlement Markets Under Uncertainty. Energies 2019, 12, 1755. https://doi.org/10.3390/en12091755
AMA Style
Vardanyan Y, Madsen H. Optimal Coordinated Bidding of a Profit Maximizing, Risk-Averse EV Aggregator in Three-Settlement Markets Under Uncertainty. Energies. 2019; 12(9):1755. https://doi.org/10.3390/en12091755
Chicago/Turabian StyleVardanyan, Yelena, and Henrik Madsen. 2019. "Optimal Coordinated Bidding of a Profit Maximizing, Risk-Averse EV Aggregator in Three-Settlement Markets Under Uncertainty" Energies 12, no. 9: 1755. https://doi.org/10.3390/en12091755
Note that from the first issue of 2016, this journal uses article numbers instead of page numbers. See further details here.