Abstract
This paper presents the methodology to detect and identify the type of fault that occurs in the shunt compensated static synchronous compensator (STATCOM) transmission line using a combination of Discrete Wavelet Transform (DWT) and Naive Bayes (NB) classifiers. To study this, the network model is designed using Matlab/Simulink. Different types of faults, such as Line to Ground (LG), Line to Line (LL), Double Line to Ground (LLG) and the three-phase (LLLG) fault, are applied at disparate zones of the system, with and without STATCOM, considering the effect of varying fault resistance. The three-phase fault current waveforms obtained are decomposed into several levels using Daubechies (db) mother wavelet of db4 to extract the features, such as the standard deviation (SD) and energy values. Then, the extracted features are used to train the classifiers, such as Multi-Layer Perceptron Neural Network (MLP), Bayes and the Naive Bayes (NB) classifier to classify the type of fault that occurs in the system. The results obtained reveal that the proposed NB classifier outperforms in terms of accuracy rate, misclassification rate, kappa statistics, mean absolute error (MAE), root mean square error (RMSE), percentage relative absolute error (% RAE) and percentage root relative square error (% RRSE) than both MLP and the Bayes classifier.
1. Introduction
Restructuring and deregulation of a power system with increases in energy demand, environmental hurdles, economic factors and right of way, forces the utilities to use the transmission lines to their thermal limits. Also, some developed countries that have surplus power generation supply the load demand through a large number of distribution companies, leading to transmission line overloading. On the other hand, the connection of renewable energies into the grid causes an unbalance in the system voltage. All of these problems can be resolved economically by enhancing the thermal stability of the line through the placement of a flexible AC transmission systems (FACTS) device into the system [1]. Generally, the shunt compensation device like the static compensator (STATCOM) is a widely used FACTS device for increasing the transmission line capability of the system. STATCOM is a parallel-connected device which controls one or more alternating current (AC) system parameters, such as system stability, power quality and voltage control via the injection and absorption of reactive power from the system by adjusting its control action [2,3,4].
The reliability of power system operation is affected due to occurrences of faults in the transmission lines, leading to equipment damage. In order to ensure the secure and safe operation of the power system network, it is essential to implement an effective protection scheme within the shortest time span to avoid the cascading failure of the system. This is achieved through an advanced fault classification technique that supports an effective, reliable, fast and secured way of relaying operation in the protective system [4]. A numerous study were made for the location of fault in the transmission lines as presented in the literature, only a few of these studies consider the effect of a FACTS-compensated line, and others fail to consider their effects [5,6,7,8,9,10]. The problem of over-reach and under-reach conditions due to the injection and absorption of reactive power by STATCOM into the system leads to a false tripping of the relay [11]. Therefore, the identification of a fault in the presence of the FACTS device is a crucial issue in power system protection.
Over the years, distance relay-based transmission line protection schemes were adapted for secure and reliable operation of power systems [12,13,14]. But the presence of series/shunt FACTS devices leads to mal-operation of this conventional relay to detect and locate the fault [15,16]. Moreover, the fault signal is non-stationary in nature, and the analysis of such a signal is a cumbersome process. Therefore, researches proposed the numerical relays based on signal processing techniques, namely Fourier Transform (FT), Fast FT, discrete FT and short time FT that are extensively used in the initial stage for the analysis of the fault signal. It is observed through rigorous analysis that FTs are not suitable for locating a time-varying fault transient signal, and also the information on the time of the occurrence of transients cannot be obtained. To cater for this limitation, S-transform-based fault locations were used for locating the time and frequency information of the fault signal. But it involves a large number of mathematical computation and calculation time that results in degrading the performance of the numerical relay [17,18,19,20].
The aforementioned drawbacks are overcome by the time–frequency-based discrete wavelet transform (DWT) approach, which is broadly used for the classification and location of faults and power quality mitigation problems such as sag and swell in the system [21]. One of the major problems with DWT is the selection of mother wavelets for particular applications. However, many works in the literature claimed that Daubechies 4 (db4) is the best suited mother wavelet for power system transient signal analysis like a fault. The detailed explanation of this is portrayed in [22]. The rapid filtering of the original signal from the noise signal with a minimum processing time makes the DWT analysis to extract the features more accurately than other signal processing methods. Because of these reasons the features are extracted using DWT analysis in this work. Then the obtained features are used to train the artificial intelligence (AI) or machine learning (ML) classifiers. Numerous computational intelligence classifiers were proposed in the literature for the location of faults in the system, such as the multilayer perceptron (MLP) neural network, support vector machine (SVM), fuzzy logic, particle swarm optimization (PSO), and so on. The Artificial Neural Network (ANN) and SVM classifiers consume large time for training, and also the efficacy of fuzzy depends upon rules framed by the expertise [6,7,13,23,24]. Besides, many different methods of classifier are proposed in the literature, ranging from a heuristic rule of thumb to formal mathematics [24]. Despite all, the proposed work uses a simple, efficient and sensitive type of a probabilistic neural network-based Naive Bayes (NB) approach for the selection of features, and to classify the type of fault in the system.
The remainder of the paper is organized as follows: Section 2 deals with the system model studied, and Section 3 portrays the proposed method of fault classification with detailed explanation about the extraction of features using DWT analysis. Section 4 describes the MLP neural network- and probabilistic network-based classifiers, such as the Bayes and NB methods to classify the fault when it occurs in the system. Section 5 presents the results and discussion of the proposed work of fault classification with comparative analysis presented in Section 6. The conclusion and future work is made in the last part of the paper.
2. System Model Studied
To validate the proposed method of fault detection scheme, it is necessary to acquire the field data from the real time power system network, as the real time data acquisition is a quite tedious and cumbersome process. Therefore, the system under study for fault application considers real time Libya power system data for simulation and the possibility of the occurrence of numerous faults are simulated using Matlab/Simulink. Figure 1 depicts the shunt STATCOM compensated power system model consisting of three phase supply, transmission line network, STATCOM and load. The parameters for the simulation are as follows:
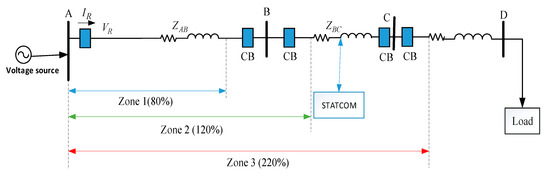
Figure 1.
Power System Model.
Generator: Base MVA rating of 300 MVA, 400 kV, frequency =60 Hz, internal Resistance (Rin) = 0.8929 Ω, internal source inductance (Lin) = 16.56 mH, short circuit MVA rating of 100 and base kV of 300 kV.
Transmission line: Positive and zero sequence resistance of 0.0279 Ω/km and 0.3046 Ω/km, positive and zero sequence inductance of 0.828 mH/km and 3.820 mH/km, positive and zero sequence capacitance of 11.66 ηF/km and7.03 ηF/km, respectively.
STATCOM: Voltage rating of 400 kV with 100 MVA base. The model consists of 48 pulses Voltage Source Converter (VSC).
Load: The system consists of an active and reactive power load of 210 MW and 150 MVar respectively.
Circuit Breakers: During normal operation, the breaker is considered as closed. For simulation of a fault, the fault is applied for the period of 6/60 to 7/60. The breaker resistance of 0.001 Ω, the Snubber resistances and the capacitance of 1 MΩ and infinite value, are considered for simulation study.
The transmission line length of 300 km, considered for each zone (Z1, Z2 and Z3) of line, is assumed to be 100 km. The detailed explanation of simulation parameters and STATCOM are also presented in [11]. The dataset for the training of neural networks (NN) is obtained by introducing the various faults, considering the effect of fault resistance and with/without STATCOM at different locations like 100 km, 200 km and 300 km of the mid-point compensated power system.
The power system model is protected from fault by different zones of protection scheme Z1, Z2 and Z3. Thus, the relay responds to various zones of protection, and the trip signal is obtained from the intelligence relaying scheme developed using the NB classifier. In the proposed work, the percentage of distance protection relay by different zones such as Z1, Z2 and Z3 are assumed to be 80%, 120% and 220% of the total line length, respectively.
Proposed Method of Fault Detection
This section presents the steps for the detection of faults in the power system using the NB method of classification. The detailed steps are illustrated in Figure 2, and also presented as follows:
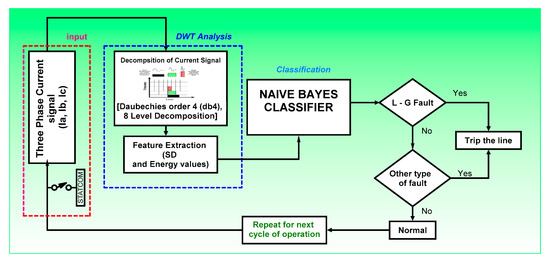
Figure 2.
Proposed method of fault classification.
Step 1: Data Acquisition—The shunt compensated power system model is simulated using Matlab/Simulink under various cases of disturbance, and the current signal is obtained for extracting the features to train the NN.
Step 2: Feature Extraction—The data for training are obtained by sampling the current signal using advanced signal processing techniques like DWT, and the features such as SD and energy values are obtained for the system with and without shunt compensation to study the effect of STATCOM compensation.
Step 3: Training Phase—In this phase, the obtained SD and energy values are acquired for different locations of faults and various values of fault resistance.
Step 4: Fault detection—Here, the trained NN is tested for the occurrence of different faults in the system, and this process is repeated for every cycle of operation.
3. Feature Extraction Using Discrete Wavelet Transform
Wavelet transform (WT) is a widely used signal processing tool for analyzing the high frequency transient signal in applications like bearing fault detection, transmission line faults and power quality disturbances, namely voltage sag and swell detections, as wavelet analysis overcomes the limitations of FT by localizing the fault signal both in time and frequency domains. Fourier analysis does not provide information about the time of occurrence of the fault/disturbance in the non-stationary current/voltage waveform of the power system. In general, WT exists in two forms: a continuous and a discrete method. The latter is extensively used in the literature, due to its resolution and its applicability in real time. The detailed explanation on the application of WT in a power system is discussed in [21,22].
DWT is a significant tool that analyzes the time varying, transient signal-like faults by decomposing the min to an approximation (A) and detailed coefficients (D) through successive filtering of high-pass and low-pass signals, as depicted in Figure 3.
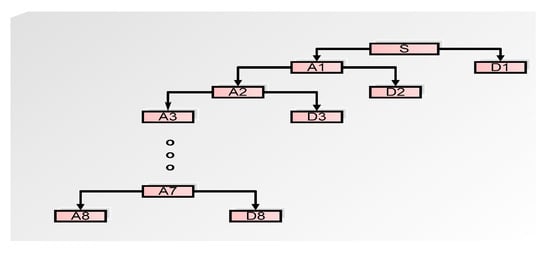
Figure 3.
Discrete Wavelet Transform (DWT) Decomposition at eight levels.
As the number of decomposition levels increases, the DC noise present in the fault signal can be suppressed. In this work, a mother wavelet of db4 with eight levels is used to extract the features by sampling the current signal of one cycle with the sampling frequency of 20 kHz and 333 samples per cycle of the current waveform. Among various mother wavelets existent in literature, Daubechies (db4) has been broadly used in power system fault locations because of its ability to locate the fast transients in a low frequency sinusoidal signal. The bandwidths of each level of decomposition are presented in Table 1.

Table 1.
Detailed Coefficient Levels Frequency Band kHz.
3.1. Feature Extractions
The main aim of feature extraction is to provide the significant information for the classifier to classify the type of event through the features calculated, using standard deviation (SD) and energy values. The detailed information of this is discussed as follows.
3.1.1. Standard Deviation (SD)
The SD is defined as the statistical measure of variation or dispersion that exists in the original signal and is given as follows,
where , x represent the data vector and n is the number of elements in x.
3.1.2. Energy Value (E)
To test the effectiveness of the proposed classifier, this work uses another approach to calculate features based on the energy of the decomposed current signal. The spectral energy of the decomposed signal can be obtained using Equation (2),
where n is the number of detailed coefficient levels and x represents the data vector. To calculate the features, a moving window of one cycle of current wavelet coefficient is passed and the features are extracted for training the classifiers [25].
4. Fault Classifiers
This section presents Bayesian-based fault classifiers to identify and classify the type of fault that occurs in the shunt STATCOM compensated transmission lines. The comparative study is made with the conventional MLP neural network for the system with and without STATCOM. Here in this work, each fault that occurs in the system is considered as a class, and the same is used for training theneural network. The assumed classes for classification are: C1-Normal, C2-LG fault, C3-LL fault, C4-LLG fault and C5-LLLG fault. Moreover, the effectiveness of the method is also tested for occurrence of fault at different locations of thetransmission lines.
4.1. Multi-Layer Perceptron (MLP) Network
Multi-Layer Perceptron (MLP) is the most widely used neural network for the identification and detection of the types of fault in a power system in the literature. MLP is a supervised feed forward network, as it requires learning the desired output to be classified. Figure 4 represents the MLP network that consists of the input (u1, u2 and u3), hidden and output layers.
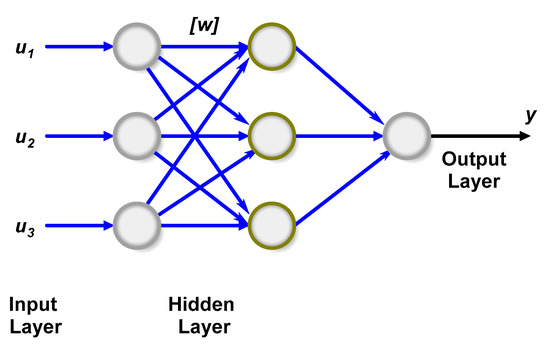
Figure 4.
Perceptron (MLP) neural network.
The output [y] of the network is the weighted sum of input neurons and is defined as,
where aj represents the output of the previous layer neuron, Wij is the weight between the ith an d jth neuron, and Wio is the input bias of this neuron. In this work, the MLP network is trained using the back propagation method, and the detailed explanation is presented in [26,27].
4.2. Bayes and Naive Bayes Classifiers
The conventional MLP neural network performs the classification by adjusting the weight of the network through a small penalty factor that sometimes leads to over fitting. This problem is overcome using a principle approach called Bayes theorem by the Bayesian neural network (BNN). BNN was invented by Israeli Judea Pearlin 1980s, a statistical-based, supervised classifier that determines the variable to be classified in a more way relevant to the class, by evaluating the probability of how likely is its occurrence in that class. This is achieved with the prior information obtained about the occurrence of event that takes the form of prior probability density function [28,29,30,31]. Thus, the Bayes theorem can be defined as
The simplified form can be expressed as,
where P(C) is the class probability and P(L|C) represents the likelihood of datasets {L1, L2, …, Ln} of variables in class C = [C1, C2, …, C5]. The classification problem can be defined as,
Here the attribute P(L) does notvary with the class and can be assumed as constant, and the above equation is approximated as,
In Equations (7) and (8), the most probable output from the input arguments (data) is represented as arg max. It is also called the global maxima of output.
The computation burden of BNN increases as the number of likelihood terms in the class raises exponentially with the attributes L = {L1, L2, …, Ln}. To cater this limitation, all features in a class are assumed to be independent, and that results in the Naive Bayes (NB) classifier that reduces the number of parameters to be estimated from 2(2n − 1) to 2n [25,30,31]. NB is a linear classifier that divides the input data set into the training and prediction step for identifying the type of class using Bayes’ theorem. In the training phase, the classifier determines the probability distribution pertaining to the features of any given class is independent. During the prediction phase, our classifier estimates the posterior probability of the test sample data belonging to a respective class. Then the method classifies the samples based on the maximum likelihood of posterior probability. The NB classifier has been widely used because of its simplicity, being easy to implement with a high accuracy and sound theoretical basis that guarantees the optimized results. The probability function defined in (8) can be rewritten with the assumption of independent features as,
In this work, L is assumed to be the number of variables, i.e., the type of fault that occurs in the system. Let L = {L1, L2, L3, L4, L5} = {Normal, LG, LL, LLG, LLLG}, then P(L) denotes the probability distribution over the sesystem states, as represented in Figure 5,
where xi is the probability of L for being in state Li. The assumed probability of each disturbance is as follows: P(Normal) = P(L1) = 0.2, P(LG) = P(L2) = 0.2, P(LL) = P(L3) = 0.3, P(LLG) = P(L4) = 0.2 and P(LLLG) = P(L5) = 0.2.
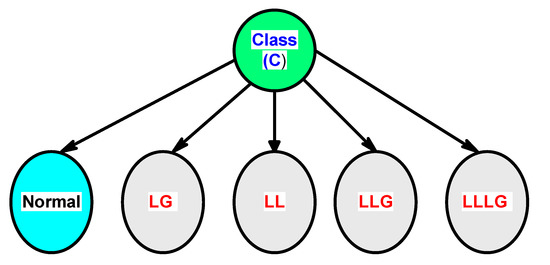
Figure 5.
Naive Bayes (NB) classifier of the proposed work.
The conditional probability for the proposed work considering different possible events is portrayed in Table 2. It is seen that the classifier has (12 × 5) = 60 probabilities.
Table 2.
Conditional Probability for the proposed work.
4.3. Performance Indices of Classifier
The Kappa Statistic (K) is the statistical measure of classifiers that compute the constancy among the predicted type of fault and the actual type of fault, and is defined as follows,
where P(OF) is the probability of the observed fault, P(EF) is the probability of the predicted type of fault. It ranges between 0 and 1.
Mean Absolute Error (MAE)and Root Mean Square Error (RMSE)—MAE is the absolute mean of the error calculated between the predicted and observed value, and is depicted as follows [21],
RMSE is the square root of the mean of variance between the predicted and observed type of fault detected by the classifiers, and is given by,
where EP is the predicted type of fault, and EO is the expected type of fault.
5. Results and Discussion
This section describes the simulation of a proposed probabilistic NB-based classifier to classify the fault and the location of the fault in a transmission line. The effect of the probabilistic classifier is studied for the transmission line with and without compensations. The simulation is carried out for the power system model depicted in Figure 1, and various plausible faults such as LG, LL, LLG and LLLG in the system, considering the variation in fault resistances. The simulation is carried out for a time period of one cycle, and the fault is applied during 0.1 to 0.12 s. Figure 6 and Figure 7 depict the three-phase current waveform of the system without and with STATCOM, respectively. The minimum and maximum values of the peak magnitude of this three phase current signal are captured for the system with and without compensation that are illustrated in Table 3 and Table 4. It is seen from the results, the magnitude of current signal increases for the system with STATCOM device, and the same is presented in the form of a waveform; for the case of the LG fault in the system with and without STATCOM, and these are portrayed in Figure 8 and Figure 9 respectively.
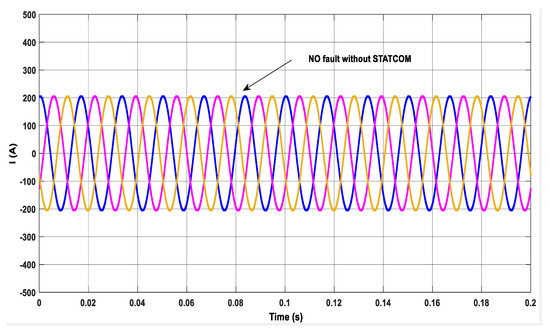
Figure 6.
Three-phase current waveform under normal condition without STATCOM compensation.
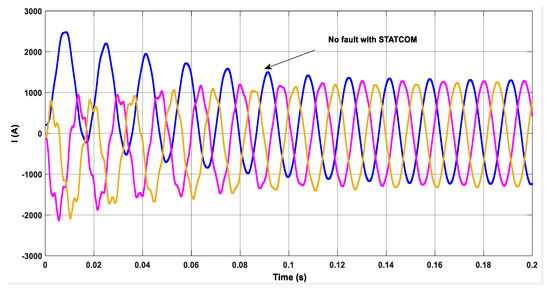
Figure 7.
Three-phase current waveform under normal conditions with midpoint compensation.
Table 3.
Current magnitude during normal conditions and faults at different locations without the STATCOM-compensation.
Table 4.
Current magnitude during normal conditions and faults at different locations with STATCOM-compensation.
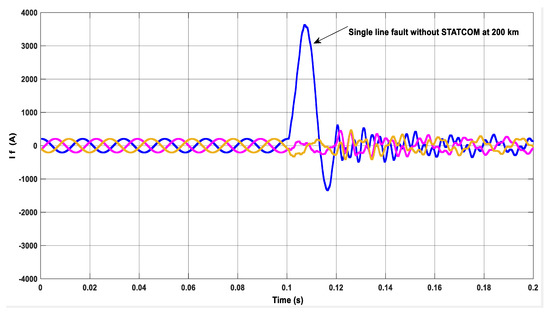
Figure 8.
Three-phase current waveform during a Line to Ground (LG) fault (at 200 km) in Phase A without STATCOM compensation.
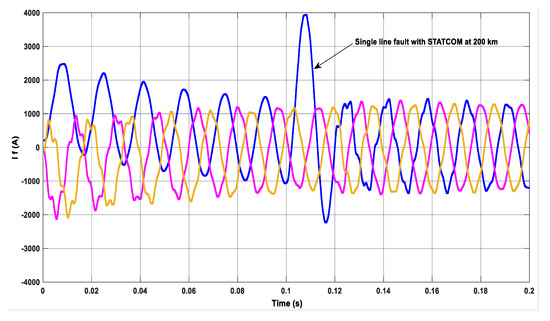
Figure 9.
Three-phase current waveform during the LG fault (at 200 km) in Phase A with STATCOM compensation.
Then the current signal obtained for various cases of fault is analyzed using the db4 mother wavelet of DWT analysis with eight level coefficients to extract the features, such as SD and energy values for training the classifiers. Figure 10 and Figure 11 represent the DWT analysis of current waveform under the normal operation of the system without and with STATCOM, respectively. In general, the magnitude of coefficients is high for the compensated system compared to the uncompensated system. Figure 12 and Figure 13 portray the DWT analysis of the LG fault current waveform considering without and with STATCOM, respectively. Also, it is observed that the coefficients of the detailed coefficient are low when a fault occurs after the location of the STATCOM (at 150 km) device. This effect is due to the STATCOM, where the system fault current reduces as the distance of the fault increases from the fault location point. Table 5 and Table 6 represent the extracted features (SD and energy values) for training the classifiers. The trained classifiers are tested with the test data, and the type of fault that occurs in the system is detected by the classifiers. The performance of the classifier for classification of various faults in the system for cases with and without STATCOM, using the features of SD and energy values, are presented as different cases, as discussed in forthcoming subsections.
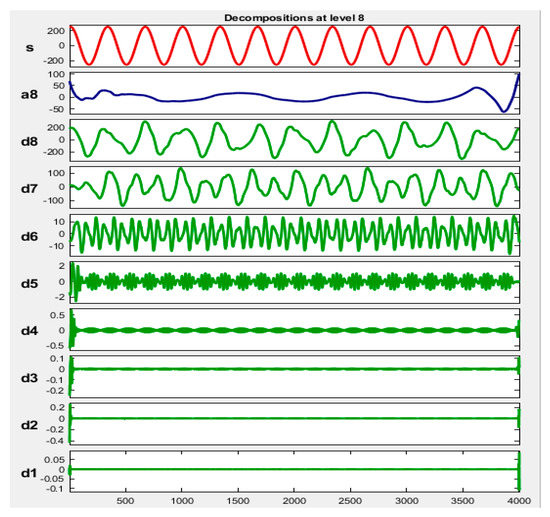
Figure 10.
Discrete Wavelet Transform (DWT) analysis of Phase A under normal conditions without compensation.
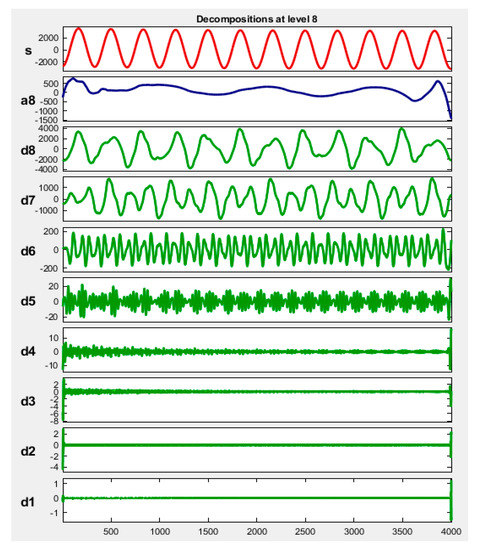
Figure 11.
DWT analysis of Phase A under normal conditions with STATCOM compensation.
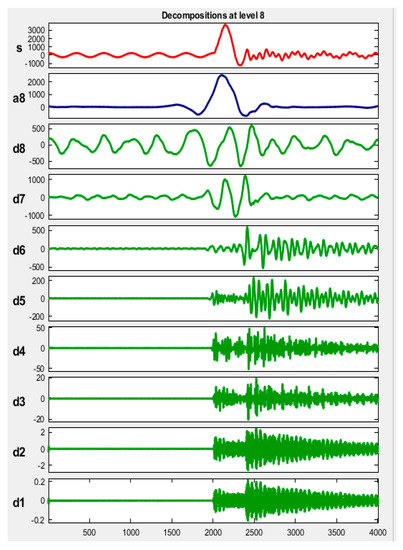
Figure 12.
DWT analysis of Phase A during the LG fault without STATCOM compensation.
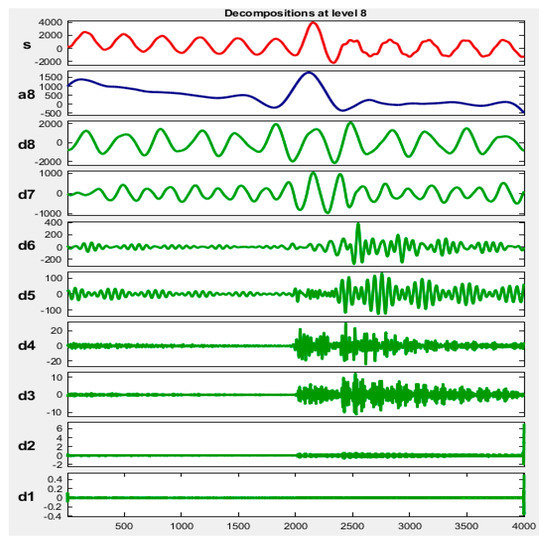
Figure 13.
DWT analysis of Phase A during the LG fault with STATCOM compensation.
Table 5.
Standard deviation (SD)-based feature values for classification.
Table 6.
Energy-based feature values for classification.
Case-1: In this study, the transmission fault classification and identification in a transmission network is done without STATCOM. Table 7 presents the confusion matrix for classification of different states of the system, such as Normal, LG, LLG, LL and LLLG fault. Here, the fault in the system is classified using the SD values obtained by the DWT analysis for different types of fault occurring at the distances of 100 km, 200 km and 300 km of an overhead transmission line, and this is given in Table 5. Then these data are used for training the neural network and the classification results obtained are presented in Table 8.
Table 7.
Confusion Matrix for Classification.
Table 8.
Classifiers’ Accuracy and Misclassification Rate.
The result shows that the proposed NB method of classifier is more accurate compared to the MLP and Bayes methods of classification. Moreover, the % misclassification rate of the proposed method is 0%, whereas the rate is 20% and 80% for the MLP and Bayes approaches of classification, respectively. The MLP method of classification fails to detect the LLG type of fault, and on the other hand, the Bayes method fails to classify all types of fault and whose performance is inferior compared to other methods. It is inferred from Figure 14 and Table 8 that the NB classifier is the most significant method to classify the various types of fault in the system compared to all other methods.
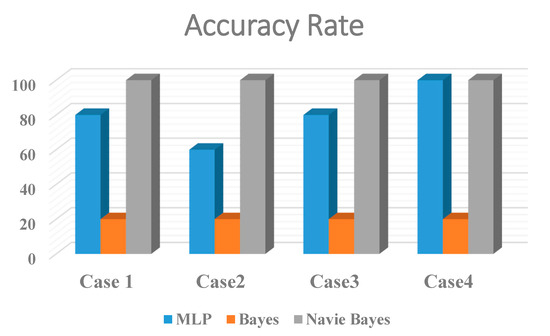
Figure 14.
Accuracy rate of the classifiers.
Case-2: Here in this study, the classification and identification of the fault is done without STATCOM, as incase-1. But in this case, instead of SD values, the energy values obtained from DWT analysis for different types of faults occurring at various distances of 100 km, 200 km and 300 km has been taken for training the network, which is illustrated in Table 6. The results obtained reveal that theNB method of classification is better than the other two methods, such as MLP and Bayes classifiers. Figure 14 represents the % accuracy rate of the proposed method is 100%, whereas this is 60% and 20% for MLP and Bayes networks, respectively. The MLP method of classification fails to detect LG and LLG faults, whilst the Bayes classifier is unable to detect all types of faults. It is seen that the propounded NB has a 0% misclassification rate, the MLP has 40% and the Bayes method has 80% of themisclassification rate, as depicted in Table 8.
Case-3: This case is similar to case-1, but in this study the STATCOM is connected at the midpoint of the transmission line, and the occurrence of faults at different locations such as 100 km, 200 km and 300 km, are studied. The SD values obtained are used to train the network, like the case-1, and shown in Table 5. It is observed from Table 8 thatthe proposed NB classifier performance is more predominant in terms of accuracy and % misclassification rate compared to the MLP and Bayes methods of classification, and is also shown in Figure 14. The Bayes method fails to identify all types of fault, except when the system is operating in normal conditions and MLP method fails to detect the LLG type of fault as withcase-1. It is inferred from the results that both the MLP and Bayes classifier performancesarethe same for the transmission line involving with and without STATCOM, and the proffered NB method classifier outperforms compared to these approaches.
Case-4: This case is analogous to case-2, with the incorporation of STATCOM connected at the midpoint of the transmission line for supporting the reactive power and to improve the voltage profile of the system performance. In this context, the energy values obtained from DWT analysis for different types of faults at various distances of 100 km, 200 km and 300 km has been used for training the network and this is portrayed in Table 6.
Figure 14 represents the proposed NB classifier is very efficient compared to the MLP and Bayes methods. The % accuracy of NB and MLP are 100%, but the Bayes method is only 20% accurate. On the flipside, the % misclassification rate is 0% for NB and the MLP method, and it is 80% for the Bayes approach. It is deduced from the results, the proffered NB classifier gives accurate results for all cases and its performance is significantly predominant than the MLP and Bayes method as depicted in Table 8.
Performance Evaluation of Classifiers
The robustness of the classifier is evaluated by various performance indices, such as Kappa Statistics (KS), Mean Absolute Error (MAE), Root Mean Square Error (RMSE), Percentage Relative Absolute Error (% RAE) and Percentage Root Relative Square Error (%RRSE) for classifiers, namely Bayes, MLP and theNB approach. Firstly, the KS index for various classifiers is presented in Table 9 and Figure 15. The result shows that the indices are ‘1’ for the proposed NB classifier for all the cases and the values lies in the range of 0.5–1 for the MLP classifier (for various cases) and is almost ‘0′ forthe Bayes method of classification. It is inferred from the KS index, the proffered method of classifier outperforms for various cases compared to the other classifiers. Secondly, the MAE is less than 0.1 for the proposed classifier, whereas the value lies in the range of 0.1–0.3 for the MLP method, and it is greater than 0.3 for the Bayes approach under various cases. Moreover, the RMSE is also less than 0.1 for the NB method, and the value lies in the range of 0.2–0.4 for MLP, and it is almost 0.4 for the Bayes classifier for case-1 to case-4. It is seen that the indices such as MAE and RMSE are comparatively very low, as shown in Figure 16 and Figure 17 for the intended NB method of classifier than other approaches presented, proving that the proposed classifier is more robust and efficient.
Table 9.
Performance comparison of various Classifiers.
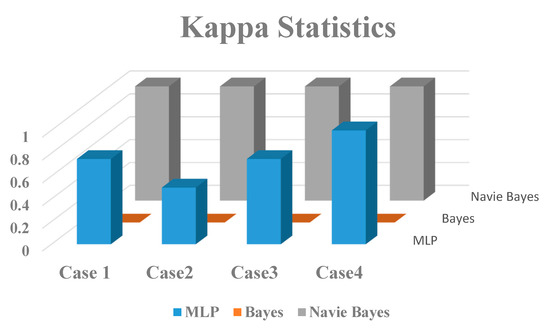
Figure 15.
KappaStatistics comparison of various classifiers.
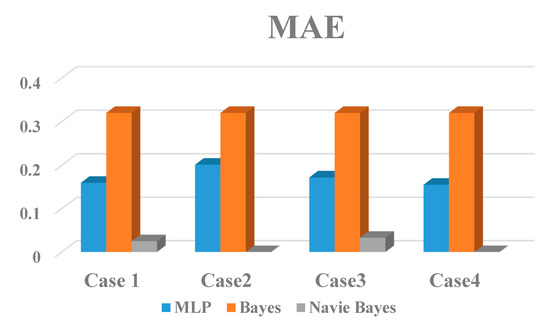
Figure 16.
MAE comparison of various classifiers.
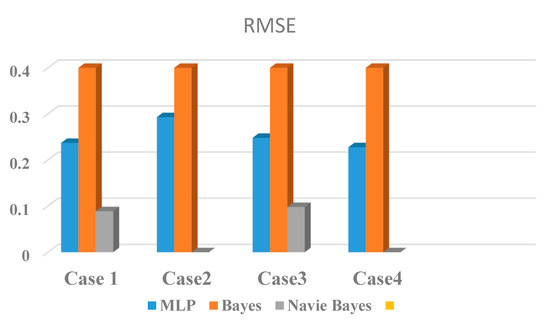
Figure 17.
RMSE comparison of various classifiers.
Lastly, the % RAE and %RRSE is proven to be significantly less for the propounded NB method compared to theMLP and Bayes classifiers, as depicted in Table 10 and Figure 18. It is observed that the results outperform for all the cases by the NB approach rather than the MLP and Bayes classifier methods.
Table 10.
Percentage root relative square error (% RRSE) comparison of various classifiers.
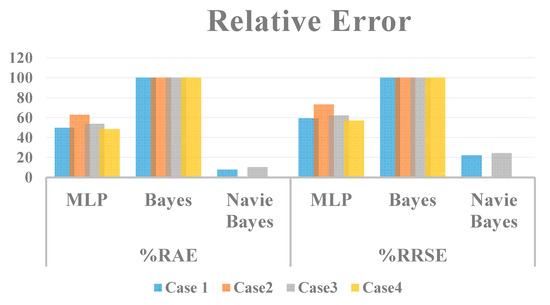
Figure 18.
Percentage relative absolute error (% RAE) comparison of various classifiers.
6. Comparative Analysis
This section describes the comparative analysis of various power system fault classification methods portrayed in the literature works, summarized considering the significant features of % accuracy, and illustrated in Table 11. The comparative performance of the % accuracy of the proposed NB method is made with other existing methods. The results indicate that all of the techniques have an error in identifying the type of faults because of the over-reach/under-reach of relay, due to presence of STATCOM in the transmission line. However, few literatures fail to compare the performance oftheclassifier without compensation.
Table 11.
Performance comparison with literature work.
But in this paper, the identification and classification is done considering with and without STATCOM by the proffered NB classifier, and also comparison is made with MLP and theBayes neural network. It is observed that the NB method of classification outperforms to give superior results for both the cases of system model with and without STATCOM. Also, the performance indices of the classifier, such as Kappa statistics, MAE, RMSE, %RAE and %RRSE are evaluated to show the accuracy of presented classifiers, which is elsewhere presented in the literature.
7. Conclusions
This paper presents a novel probabilistic-based Naive Bayes approach to locate the fault in a shunt STATCOM compensated transmission line. In this work, a high voltage power system model of 400 kV has been simulated using MATLAB/Simulink, and various faults such as LG, LL, DLG and LLLG, are applied. The current waveform obtained under different cases of normal and fault cases are analyzed using DWT to extract the features for locating the type of fault. The fault current signal are sampled with different band of frequencies that depict the 1st, 2nd, 3rd, 4th, 5th, 6th,7th and 8th level of the detailed coefficient and its approximation coefficient at the 8th level. The SD and Energy values have been obtained for different faults with a fault resistance of 0.001 Ω. The obtained features are used to train the classifiers to classify the type of fault. The obtained results showed that the proposed NB classifier outperforms to give a 100% accuracy rate in the case of with and without STATCOM. On the flipside, the MLP method gives an average accuracy rate of 80%, with Bayes of 20%. It also inferred from the performance indices such as Kappa statistics, MAE, %RAE and %RRSE, that the proffered NB approach gives the predominant result compared to the MLP and Bayes classifier method.
In the proposed work, though the system is specific, it is subjected to fault occurrence for various scenarios of being with and without STATCOM. Also, to test the robustness of the proposed classifier, two different features, such as standard deviation (SD) and energy values, are taken for the system with and without STATCOM. In all of the four cases presented in this paper, the proffered method of classifier outperforms to give better results than other classifiers. This claim proves even the system considered is the same, but the trained data features have the ability to give better results for various cases. So, this method can also give better results for other power system models, too. Further, the location of the fault and detection of its zones of occurrence considering with and without STATCOM is the future scope of the work.
Moreover, the presented work with the Internet of Things (IoT) paves the way for the smart relaying scheme that helps the utility to locate and isolate the faulty section from the healthy part of power system, thereby minimizing the cascading failures of the system.
Author Contributions
E.A. and M.L.O. proposed the main idea and performs the simulation of the work; V.V. and N.I.A.W. provided sources and wrote the paper; proof reading and final drafting was done by I.b.A. and H.H. All authors have read and agreed to the published version of the manuscript.
Funding
The research received funding from the Universiti Putra Malaysia named Geran Putra Berimpak with ref. UPM/800-3/3/1/GPB/2019/9671700.
Acknowledgments
The authors are thankful to Center for Advanced Lightning Power and Energy Research (ALPER) and Universiti Putra Malaysia to carry out this research.
Conflicts of Interest
The authors declare no conflict of interest.
References
- Singh, A.R.; Patne, N.R.; Kale, V.S. Synchronized measurement based an adaptive distance relaying scheme for STATCOM compensated transmission line. Measurement 2018, 116, 96–105. [Google Scholar] [CrossRef]
- Mirzaei, M.; Vahidi, B.; Hosseinian, S.H. Accurate fault location and faulted section determination based on deep learning for a parallel-compensated three-terminal transmission line. IET Gener. Transm. Distrib. 2019, 13, 2770–2778. [Google Scholar] [CrossRef]
- Ghazizadeh-Ahsaee, M.; Sadeh, J. Accurate fault location algorithm for transmission lines in the presence of shunt-connected flexible AC transmission system devices. IET Gener. Transm. Distrib. 2012, 6, 247. [Google Scholar] [CrossRef]
- Mishra, S.K.; Tripathy, L.N.; Swain, S.C. DWT approach based differential relaying scheme for single circuit and double circuit transmission line protection including STATCOM. Ain Shams Eng. J. 2019, 10, 93–102. [Google Scholar] [CrossRef]
- Chen, K.; Huang, C.; He, J. Fault detection, classification and location for transmission lines and distribution systems: A review on the methods. High Volt. 2016, 1, 25–33. [Google Scholar] [CrossRef]
- Veerasamy, V.; Abdul Wahab, N.I.; Ramachandran, R.; Thirumeni, M.; Subramanian, C.; Othman, M.L.; Hizam, H. High-impedance fault detection in medium-voltage distribution network using computational intelligence-based classifiers. Neural Comput. Appl. 2019, 31, 9127–9143. [Google Scholar] [CrossRef]
- Veerasamy, V.; Abdul Wahab, N.I.; Ramachandran, R.; Mansoor, M.; Thirumeni, M.; Othman, M.L. High impedance fault detection in medium voltage distribution network using discrete wavelet transform and adaptive neuro-fuzzy inference system. Energies 2018, 11, 3330. [Google Scholar] [CrossRef]
- Gupta, O.H.; Tripathy, M. An innovative pilot relaying scheme for shunt-compensated line. IEEE Trans. Power Deliv. 2015, 30, 1439–1448. [Google Scholar] [CrossRef]
- Mehrjerdi, H.; Ghorbani, A. Adaptive algorithm for transmission line protection in the presence of UPFC. Int. J. Electr. Power Energy Syst. 2017, 91, 10–19. [Google Scholar] [CrossRef]
- Albasri, F.A.; Sidhu, T.S.; Varma, R.K. Performance comparison of distance protection schemes for shunt-FACTS compensated transmission lines. IEEE Trans. Power Deliv. 2007, 22, 2116–2125. [Google Scholar] [CrossRef]
- Aker, E.E.; Othman, M.L.; Aris, I.; Wahab, N.I.A.; Hizam, H.; Emmanuel, O. Adverse impact of STATCOM on the performance of distance relay. Indones. J. Electr. Eng. Comput. Sci. 2017, 6, 528–536. [Google Scholar] [CrossRef][Green Version]
- Othman, M.L.; Aris, I.; Wahab, N.I.A. Modeling and simulation of the industrial numerical distance relay aimed at knowledge discovery in resident event reporting. Simulation 2014, 90, 660–686. [Google Scholar] [CrossRef]
- Othman, M.L.; Aris, I.; Othman, M.R.; Osman, H. Rough-Set-and-Genetic-Algorithm based data mining and Rule Quality Measure to hypothesize distance protective relay operation characteristics from relay event report. Int. J. Electr. Power Energy Syst. 2011, 33, 1437–1456. [Google Scholar] [CrossRef]
- Othman, M.L.; Aris, I.; Othman, M.R.; Osman, H. Rough-Set-based timing characteristic analyses of distance protective relay. Appl. Soft Comput. J. 2012, 12, 2053–2062. [Google Scholar] [CrossRef]
- Hussain, S.; Osman, A.H. Fault location on series and shunt compensated lines using unsynchronized measurements. Electr. Power Syst. Res. 2014, 116, 166–173. [Google Scholar] [CrossRef]
- Kumar, B.; Yadav, A.; Pazoki, M. Impedance differential plane for fault detection and faulty phase identification of FACTS compensated transmission line. Int. Trans. Electr. Energy Syst. 2019, 29, e2804. [Google Scholar] [CrossRef]
- Megahed, A.I.; Moussa, A.M.; Bayoumy, A.E. Usage of wavelet transform in the protection of series-compensated transmission lines. IEEE Trans. Power Deliv. 2006, 21, 1213–1221. [Google Scholar] [CrossRef]
- Patel, B. A new FDOST entropy based intelligent digital relaying for detection, classification and localization of faults on the hybrid transmission line. Electr. Power Syst. Res. 2018, 157, 39–47. [Google Scholar] [CrossRef]
- Krishnanand, K.R.; Dash, P.K. A new real-time fast discrete S-transform for cross-differential protection of shunt-compensated power systems. IEEE Trans. Power Deliv. 2013, 28, 402–410. [Google Scholar]
- Dash, P.K.; Das, S.; Moirangthem, J. Distance protection of shunt compensated transmission line using a sparse S-transform. IET Gener. Transm. Distrib. 2015, 9, 1264–1274. [Google Scholar] [CrossRef]
- Wilkinson, W.A.; Cox, M.D. Discrete wavelet analysis of power system transients. IEEE Trans. Power Syst. 1996, 11, 2038–2044. [Google Scholar] [CrossRef]
- Osman, A.H.; Malik, O.P. Protection of Parallel Transmission Lines Using Wavelet Transform. IEEE Trans. Power Deliv. 2004, 19, 49–55. [Google Scholar] [CrossRef]
- Devasahayam, V.; Veluchamy, M. An enhanced ACO and PSO based fault identification and rectification approaches for FACTS devices. Int. Trans. Electr. Energy Syst. 2017, 27, e2344. [Google Scholar] [CrossRef]
- Dash, P.K.; Samantaray, S.R.; Panda, G. Fault classification and section identification of an advanced series-compensated transmission line using support vector machine. IEEE Trans. Power Deliv. 2007, 22, 67–73. [Google Scholar] [CrossRef]
- Hindarto, H.; Muntasa, A. Wavelet sub-band energy for feature extraction of electro encephalo graph (EEG) signals. J. Eng. Sci. Technol. 2019, 14, 578–588. [Google Scholar]
- Patil, K.; Jadhav, N. Multi-Layer Perceptron Classifier and Paillier Encryption Scheme for Friend Recommendation System. In Proceedings of the 2017 International Conference on Computing, Communication, Control and Automation (ICCUBEA), Pune, India, 17–18 August 2017; pp. 1–5. [Google Scholar] [CrossRef]
- Bebarta, D.K.; Rout, A.K.; Biswal, B.; Dash, P.K. Efficient Prediction of Stack Market Indices using Adaptive Neural Network. In Proceedings of the Second International Conference on Soft Computing for Problem Solving (SocProS 2012), Jaipur, India, 28–30 December 2012; Springer: Jaipur, India, 2014; Volume 236, ISBN 978-81-322-1601-8. [Google Scholar]
- Zhang, N.; Wu, L.; Yang, J.; Guan, Y. Naive bayes bearing fault diagnosis based on enhanced independence of data. Sensors 2018, 18, 463. [Google Scholar] [CrossRef]
- Youn, E.; Jeong, M.K. Class dependent feature scaling method using naive Bayes classifier for text datamining. Pattern Recognit. Lett. 2009, 30, 477–485. [Google Scholar] [CrossRef]
- Addin, O.; Sapuan, S.M.; Mahdi, E.; Othman, M. A Naïve-Bayes classifier for damage detection in engineering materials. Mater. Des. 2007, 28, 2379–2386. [Google Scholar] [CrossRef]
- Muralidharan, V.; Sugumaran, V. A comparative study of Naïve Bayes classifier and Bayes net classifier for fault diagnosis of monoblock centrifugal pump using wavelet analysis. Appl. Soft Comput. J. 2012, 12, 2023–2029. [Google Scholar] [CrossRef]
© 2020 by the authors. Licensee MDPI, Basel, Switzerland. This article is an open access article distributed under the terms and conditions of the Creative Commons Attribution (CC BY) license (http://creativecommons.org/licenses/by/4.0/).