Improvement of Waste Dehydrated Sludge for Anaerobic Digestion through High-Temperature and High-Pressure Solubilization

1
Jeongbong Co., Ltd., Cheongju 28516, Korea
2
Department of Environmental Engineering, Chungbuk National University, Cheongju 361-763, Korea
*
Author to whom correspondence should be addressed.
Energies 2020, 13(1), 88; https://doi.org/10.3390/en13010088
Submission received: 20 November 2019
/
Revised: 13 December 2019
/
Accepted: 21 December 2019
/
Published: 23 December 2019
(This article belongs to the Special Issue Biomass for Energy Country Specific Show Case Studies 2019)
Abstract
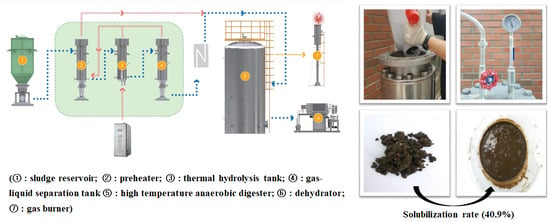
:Biochemical methane potential tests and lab-scale continuous experiments were conducted to improve the yield and energy efficiency of anaerobic digestion through thermal hydrolysis pre-treatment. Methane generation, yield, and solubilization efficiency were evaluated through lab-scale tests. The pre-treated samples presented 50% biodegradability at 140 °C and 61.5% biodegradability at 165 °C. The increase in biodegradability was insignificant at 165 °C or higher temperature, and it was confirmed that the optimum conditions were achieved at 165 °C and 20 min of solubilization. The lab-scale continuous experiments confirmed that polymers were decomposed into low-molecular-weight compounds due to thermal hydrolysis, and pH decreased. NH4HCO3 produced by thermal hydrolysis acted as an alkali to enable a more stable operation compared to that before thermal hydrolysis. Total chemical oxygen demand as chromium (TCODCr) and soluble chemical oxygen demand as chromium (SCODCr) indicated 35.4% and 23.1% removal efficiency in terms of organic matter removal, respectively. Methane yield was approximately 0.35 kg m−3 at 2.0–4.0 kg (m3 d)−1 and 0.26 kg m−3 at 5.0 kg (m3 d)−1. The solubilization rate of 40.9% by thermal hydrolysis was confirmed through the lab-scale tests to determine its full-scale applicability.
1. Introduction
Incineration and landfilling are conventional methods for the disposal of waste hydrated sludge [1]. However, as environmental pollution gradually spreads to areas such as marine waters, soil, and air, the above measures have become subjected to social and legal restrictions [2]. In particular, the 2012 ban on the dumping of waste hydrated sludge completely prohibited all kinds of ocean dumping, which used to be a major disposal measure [3]. Therefore, an efficient treatment that can replace ocean dumping, in particular, a plan to fundamentally reduce the amount of waste hydrated sludge should be developed [4]. At present, the methods to reduce waste hydrated sludge include aerobic and anaerobic decomposition directly in the treatment facility, as well as recycling practices such as the use of sludge as fertilizer or fuel [5]. Anaerobic digestion is advantageous over aerobic decomposition due to its relatively low energy consumption, effective elimination and reduction of harmful bacteria, and stable operation when treating waste hydrated sludge [6]. However, most anaerobic digesters in operation present low biological oxygen demand (BOD) concentrations in the influent sewage. Thus, the amount of organic load does not meet their design standard (1.6–4.8 kg volatile solid (m3·d)−1), leading to low digestibility (20–40%) [7]. This circumstance occurs because the production of primary sludge with high biodegradability is low, and the ratio of excess sludge is relatively high. These conditions are created because cytoplasm (organic matter) in the excess sludge is surrounded by a solid cell wall, and hydrolysis acts as a rate-determining step during anaerobic digestion [8]. In addition, anaerobic digestion is affected by factors such as pH, temperature, nutrients, and toxic substances [9]. Thus, a stable operation is difficult due to problems such as long hydraulic retention time and slow growth methanogens [10].
To solve these problems in anaerobic digestion, research and development are being conducted to implement a pre-treatment process in the front end of digestion processes [11]. Such pre-treatment processes promote the hydrolysis of organic materials [12] and, consequently, have advantages such as improvement in digestion efficiency [13], biogas (methane) yield [14], and sludge reduction. Pre-treatments are mainly divided into physical, chemical, and biological processes. Physical methods include ultrasonic treatments, thermal hydrolysis, and cavitation [15,16]. Chemical methods include ozonation and alkaline or acid treatments [17]. Biological methods have not been widely introduced into actual processes, but some of them aim to reduce sludge [18]. Examples include enzyme hydrolysis and auto-heated thermophilic aerobic digestion. The solubilization process through thermal hydrolysis is a method based on the dissolution of a gel structure and the release of internal cell-bound water by using heat above 100 °C [19]. Thermal hydrolysis combines the advantages of simple process mechanism, high organic load of inflowing sludge, improved biogas yield, and higher reduction rate compared to other pre-treatment processes. However, its disadvantages include high initial installation cost and high energy cost required to inject heat of over 100 °C [20,21]. In recent years, growing attention has been paid to thermal hydrolysis with the purpose of utilizing waste heat generated from heat exchangers and developing treatment processes to address these cost problems [22].
On the basis of the results of previous studies, it was hypothesized that thermal hydrolysis pre-treatment of waste hydrated sludge can improve methane yield and solubilization efficiency. Therefore, in this study, thermal hydrolysis efficiency and conditions were evaluated through biochemical methane potential (BMP) tests. The main operational factors, methane yield, and solubilization efficiency were evaluated through lab-scale continuous tests.
2. Materials and Methods
2.1. Substrate Characteristics from Biochemical Methane Potential (BMP) Tests
The inflow substrate used in this study was a mixed sludge (33.3% of primary sludge and 66.7% of secondary sludge) of a municipal sewage treatment plant. The characteristics of the sludge used in the study are shown in Table 1. The substrate was sieved using a 150 µm sieve for homogeneity.
2.2. Substrate Characteristics in Lab-Scale Experiments
The substrate used in this study was a dehydrated sludge. Prior to its injection, the samples were sieved, and thermal hydrolysis was performed under the conditions obtained from the BMP test. The sludge was then injected into the reactor, and the control group was injected independently after sieving without thermal hydrolysis. The properties before and after thermal hydrolysis are shown in Table 2, and they include high concentrations of organic matter and nutrient salts.
The largest difference in the results can be observed for the soluble chemical oxygen demand as chromium (SCODCr)/total chemical oxygen demand as chromium (TCODCr) ratio. This difference can be attributed to the increased dissolved chemical oxygen demand (COD) upon destruction of the cells and to the elution of eosinophil cationic protein (ECP) during thermal hydrolysis at high temperature. In addition, the extracellular polymeric substances (EPS) derived from the microbial flocs are mainly composed of substances that increase the soluble COD (SCOD) due to elution, such as proteins, polysaccharides, fats, and humic acids [23]. Moreover, total ammonia nitrogen (TAN) is present in the form of free ammonia nitrogen (FAN) and ionized ammonia nitrogen (NH4+-N). TAN interferes with anaerobic digestion, reducing digestion efficiency and biogas production [24]. A previous study [25] demonstrated that proteins in the form of particulates are converted to NH4+-N after pre-treatment. In this study, the concentration of NH4+-N after pre-treatment was higher than the one before it, indicating that the proteins were converted to NH4+-N by thermal hydrolysis.
2.3. Configuration of the BMP Test Reactor
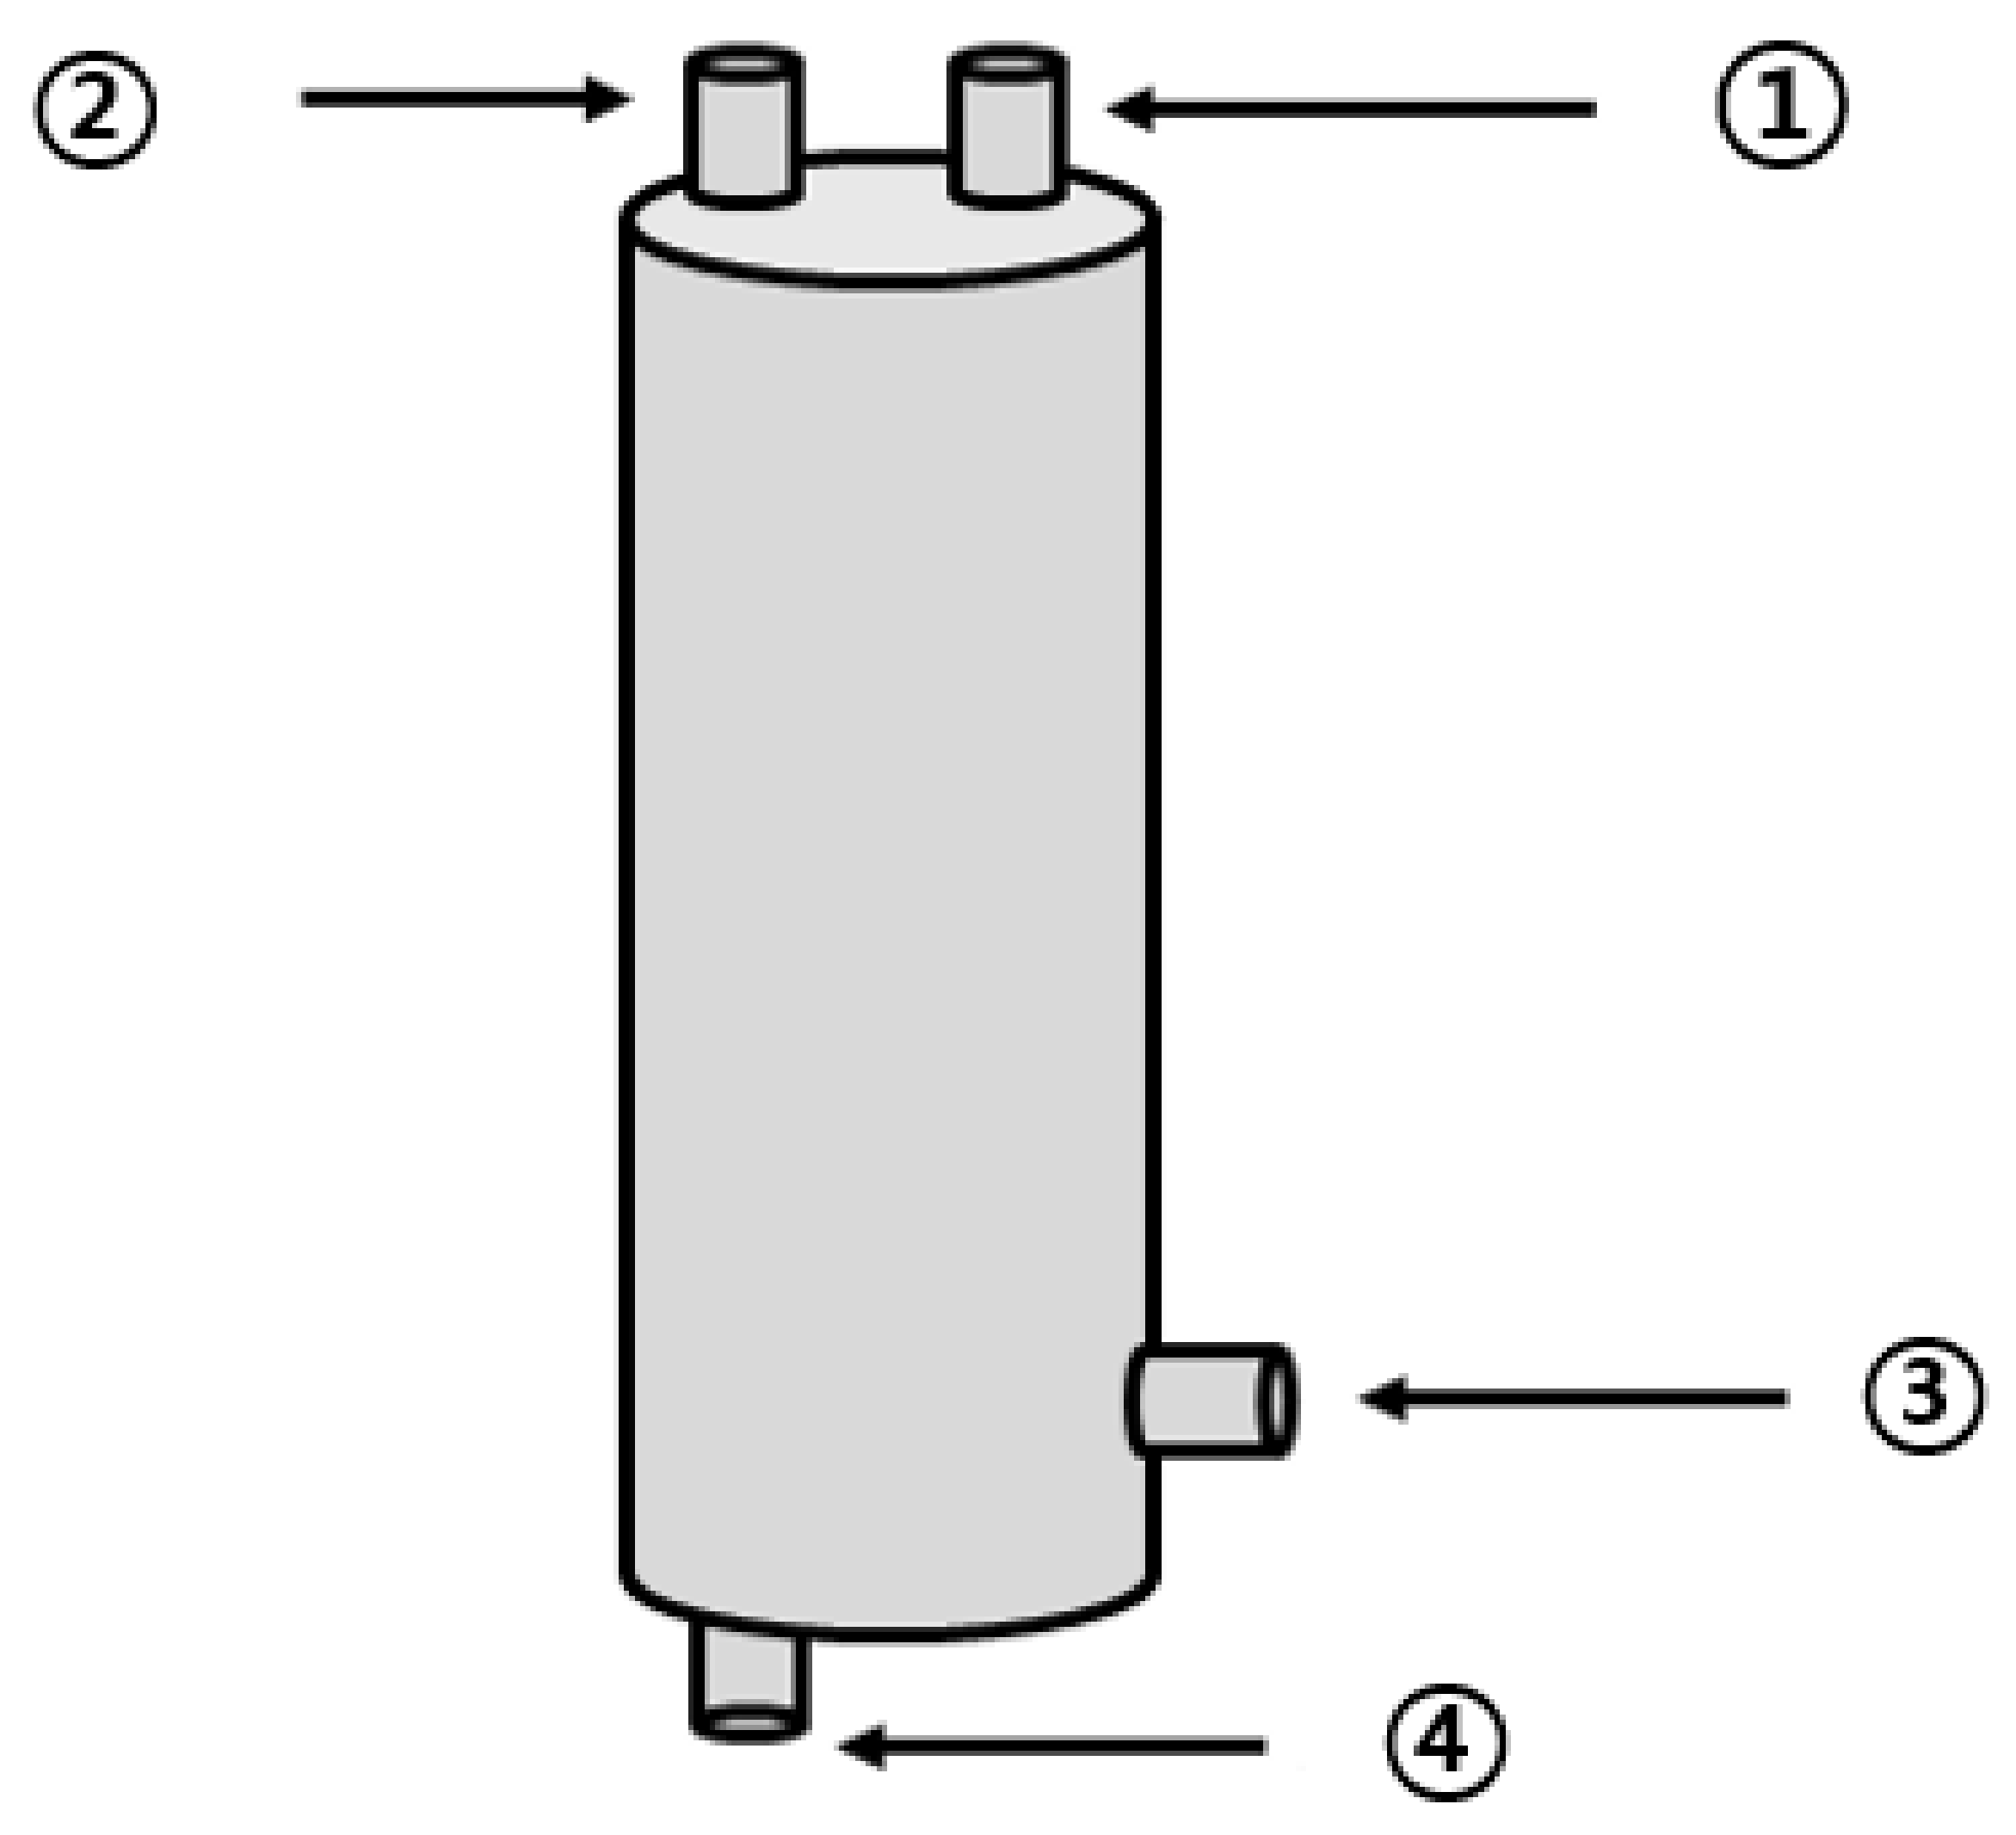
In this study, a thermal hydrolysis reactor and an anaerobic reactor were fabricated to derive the optimal thermal hydrolysis conditions. Experiments to compare batch pre-treatments were performed in the thermal hydrolysis reactor, which is shown in Figure 1. The thermal hydrolysis reactor was composed of stainless-steel material. The reactor was cylindrical, with an effective capacity of approximately 30 L (D300 × H500), and it was equipped with a sludge inlet at the top and a pressure gauge to check the internal static pressure. The heat energy required for high-temperature solubilization was supplied by a separate high-temperature steam inlet. At the bottom of the reactor, an outlet for heat from the solubilized sludge was placed, and a separate pipe was connected.
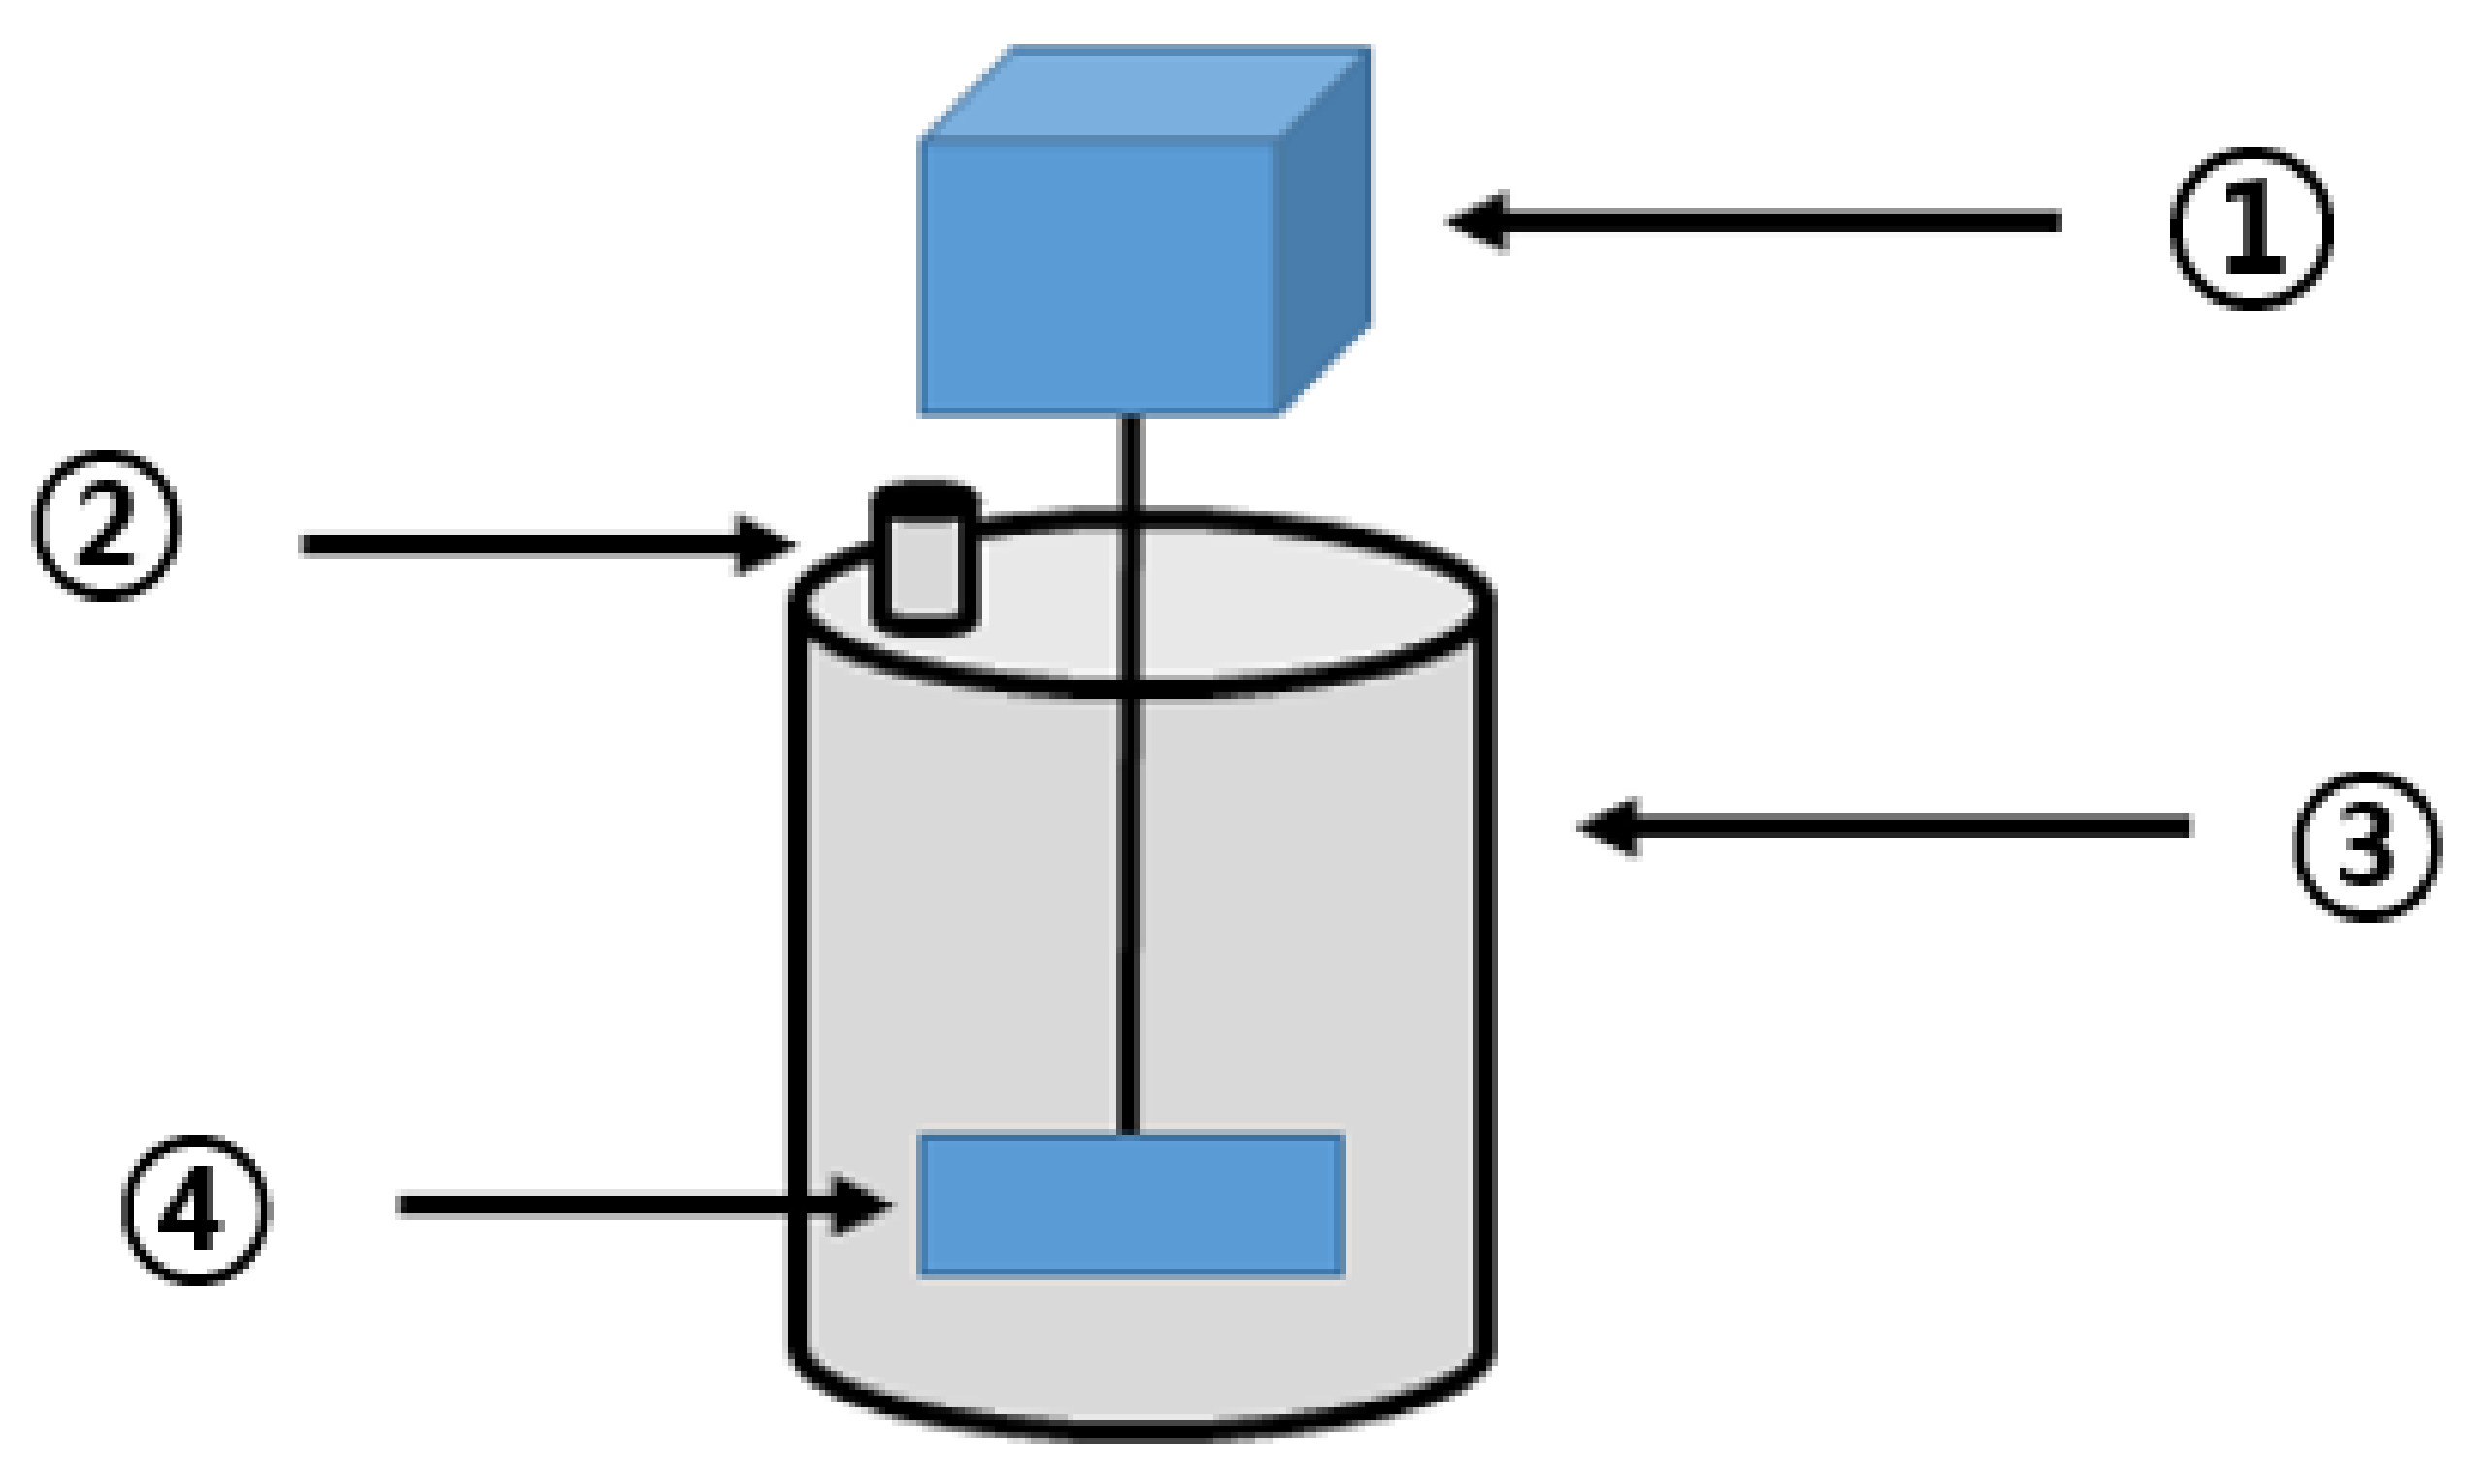
The thermal hydrolysis reactor was manufactured for the BMP test (Figure 1). Upon solubilization of the waste hydrated sludge in the reactor, methane production was measured through anaerobic digestion. On the basis of the obtained results, the optimum solubilization conditions were investigated. The anaerobic digester (Figure 2) was composed of stainless-steel material. It included a cylindrical reactor with an effective capacity of approximately 15 L (D280 × H410), mounted with a stirring motor of 40 rpm, and an outlet at the top for biogas collection.
2.4. Operating Conditions in the BMP Test
The BMP test was performed by changing thermal hydrolysis temperature, pressure, and retention time. Table 3 shows the operating conditions for each experimental group. The thermal hydrolysis temperature increased from 110 °C to approximately 187 °C, the retention time varied between 20, 30, and 40 min, and the pressure varied between 5, 6, 7, and 8 bar. The organic load was operated at an organic loading rate (OLR) of 1.0 kg (m3 d)−1 based on COD, and the final biogas (CH4, H2, CO2, H2S, etc.) generated in the reactor was collected in a gas collector (headspace: 20 L) filled with acidic saturated brine. Subsequently, analysis of the composition and quantitation were performed.
2.5. Lab-Scale Reactor Configuration
The effect of thermal hydrolysis on high-temperature anaerobic digestion is described in the following sections. For that, a series of continuous comparative experiments were performed in a reactor configured as shown in Figure 3. The reactor used in this study was composed of a cylindrical anaerobic digester with an effective capacity of 15 L (D280 × H410 mm, working volume 15 L) made of stainless-steel material and a thermal hydrolysis reactor (D300 × H500 mm) of the same material. The anaerobic digester was equipped with a low-speed stirrer (40 rpm). The thermal hydrolysis reactor had a pressure gauge for measuring internal pressure and valves and outlets for pressure injection at the side and bottom. As a control, the reactor before thermal hydrolysis also included an anaerobic digester of the same specification and was operated by changing the substrate, as shown in Table 4.
The biogas (CH4, H2, CO2, H2S) generated in the reactors was collected in a gas collector (headspace: 20 L) filled with acidic saturated brine. Analysis and quantitation were performed for each component.
2.6. Lab-Scale Operating Conditions
Lab-scale continuous tests were conducted to confirm the effect of the pre-treatment of waste hydrated sludge on anaerobic digestion performance based on the results of the BMP test. The operating conditions of the equipment are shown in Table 5. The control group (Run 1) without thermal hydrolysis was operated with 0.6 m3 of sludge per day, and the organic load was continuously applied for 113 d at approximately 2.0 kg of COD (m3 d)−1 in COD base. There were five experimental groups (Run 1–Run 5) in which thermal hydrolysis was applied. They were operated continuously for approximately 30 d. To obtain the optimum OLR, the amount of input sludge and the input ratio were increased as the experiment proceeded. Solubilization in the thermal hydrolysis reactor was performed at 165 °C for the retention time of 20 min, on the basis of the BMP test results. The hydraulic retention time (HRT) of the anaerobic digester was 20 d, and for the digestion method, it was operated at less than 55 °C, which is the optimum temperature for high-temperature digestion. A double-wall reactor was used to maintain high temperatures.
2.7. Analysis Method
Total solid (TS), volatile solid (VS), TCODcr, and SCODcr were analyzed after filtration with 1.2 µm filter paper (Whatman, GF/CTM, London, UK). Methane gas production was obtained by calculating the amount of methane generated per vs. of injected waste and was expressed in mL CH4 (g VS)−1. The composition of the biogas was analyzed using gas chromatography (GC) (GOW-MAC, series 580).
Assuming that the organic matter in the waste hydrated sludge is completely decomposed into methane and carbon dioxide by anaerobic digestion, the theoretical methane yield can be calculated by the following stoichiometry [26], based on the elemental composition of organic matter.
Equation (1) is the most basic formula for theoretical gas generation estimation and it assumes that organic wastes consist only of C, H, and O, and all matter which is biodegraded undergoes bioconversion to methane and carbon dioxide. The theoretical volume of the generated gas is then estimated by stoichiometry. However, this equation does not consider the content of nitrogen chemically bound to organic wastes. Thus, it might overestimate the methane production of anaerobic digestion. To solve this problem, two studies [27,28] presented the following equations, respectively, which take into account the effects of nitrogen.
Equations (2) and (3) assume that organic wastes consist of C, H, O, and N, or C, H, O, N, and S, respectively, and all matter is bio-converted to methane and carbon dioxide. Equation (4) is a formula proposed by [29], which is also used to calculate the theoretical gas production. It assumes that organic wastes composed of C, H, O, and N are biodegraded and undergo bioconversion into methane, carbon dioxide, and ammonia gas.
In this study, considering that waste hydrated sludge was composed of carbon, hydrogen, oxygen, and nitrogen, and that the gases produced in the biogas treatment facility were methane, carbon dioxide, and ammonia, the theoretical amount of biogas was calculated using Equation (4).
In addition, the generated methane production was converted to the normal state through Equations (5) and (6).
where M0 and V0 are the methane concentration (%) and the biogas volume (L) in the gas collector headspace before measurement, respectively, M1 and V1 are the methane concentration (%) in the gas collector and volume of generated biogas (L) at the measurement time point, T is the reactor operation temperature (°C), and W is the saturated steam pressure (mmHg) at the operation temperature [30].
3. Results and Discussion
3.1. Results of the BMP Tests
3.1.1. Chanegs in the Physical Properties of Waste Hydrated Sludge Upon Thermal Hydrolysis
Table 6 shows the changes of the physical properties of the wastewater sludge upon thermal hydrolysis pre-treatment. At 110 °C, the SCOD values of R1–R3 were 11,283, 12,443, and 13,272 g m−3, respectively. The SCOD concentration increased by approximately 3000–5000 g m−3, from the value of 8600 g m−3 of the initial inflow substrate. The VS/TS ratio was 0.84, 0.86, and 0.87 for R1, R2, and R3, respectively. The solubilization rate at 110 °C was not large, and its change with time was also insignificant.
At 141 °C, the SCOD of R4, R5, and R6 was 15,777, 18,456, and 18,241 g m−3, respectively, showing increases of 7177, 9856, and 9641 g m−3 compared with the initial SCOD values. Compared with the results at 110 °C, the increase was approximately two times higher. In addition, at 141 °C, after a 20 min retention time of thermal hydrolysis, the R5 group showed an SCOD which was 2679 g m−3 greater compared to the value of the R4 group with 10 min of retention time. In contrast, the SCOD values were low for the retention time of 30 min. The VS/TS ratio did not present effective changes as those observed for R1–R3. At 165 °C, the SCOD values from R7 to R9 were 26,673, 27,457, and 25,607 g m−3, respectively, indicating a high solubilization ratio. As in the previous experimental group, the highest SCOD value was obtained at the retention time of 20 min, and the VS/TS ratio did not significantly change. The SCOD values of R10, R11, and R12 were 28,345, 30,686, and 28,527 g m−3, respectively, at 187 °C. This increase is high compared to the initial SCOD, but the increase rate was small compared to the solubilization ratio at 165 °C. The solubilization rate was the highest at 20 min retention time, as observed for the other experimental groups, and the VS/TS ratio also presented no effect. In summary, the effect of temperature was greater on the solubilization rate than on time, which was also confirmed by the standard deviation of each step, as summarized in Table 7. In other words, the standard deviation over time was 758.2–1215.4 g m−3, but the standard deviation over temperature was 6011.2–7225.8 g m−3, indicating that the temperature had a greater effect than the time. Moreover, as summarized in Table 7, the reliability value between time values was high at low temperatures but decreased as the temperature increased. According to previous studies, thermal hydrolysis increases the extinguishing efficiency due to the reduction of solids and the increase of surface area and of the accessibility to microorganisms. Thermal hydrolysis is influenced by temperature, time, solid concentration, etc., but it resulted that the temperature is the most important influence factor [31]. This conclusion is consistent with the results of our study. Therefore, the effect of time becomes insignificant as temperature rises. Table 6 shows TCOD, SCOD, TS, and vs. and their ratios for each thermal hydrolysis condition.
3.1.2. Waste Hydrated Sludge Element Composition after Thermal Hydrolysis
Table 8 shows the elemental composition of the waste hydrated sludge and the theoretical methane production upon thermal hydrolysis. The elemental composition of the waste hydrated sludge showed no change for different operating conditions during thermal hydrolysis. Cano et al., [22] reported that this lack of effect occurred because thermal hydrolysis disrupted chemical bonds in the cell wall and released the cytosol [22]. In addition, the theoretical methane production according to the operating conditions was within 0.579 and 0.609 m3 of CH4 (Kg VS)−1 (Equation (4)), regardless of solubilization.
3.1.3. BMP Test Results after Thermal Hydrolysis
On the basis of the BMP test coupled with thermal hydrolysis, the biodegradability characteristics of the waste hydrated sludge were evaluated by comparing methane production according to temperature, time, and theoretical methane production.
As a result of the BMP test, biodegradability gradually increased with the progress of thermal hydrolysis (Table 9 and Figure 4). R6 presented approximately 51% biodegradability, whereas R7 presented 61.5% biodegradability after solubilization at 165 °C for 20 min. However, the biodegradability increase between R8 and R12 was insignificant compared to that up to R7. These results are similar to those of previous studies [18,19,20]. In other words, R7 was the optimal thermal hydrolysis condition, in the same way as the SCOD/TCOD ratio in the previous section. On the basis of these derived conditions, the anaerobic digestion efficiency was evaluated, as reported in the next chapter.
3.2. Results of Continuous Lab-Scale Test
3.2.1. Alkalinity and pH
The changes in pH and alkalinity according to the organic load of each pilot equipment injected with waste hydrated sludge during the entire operation period are shown in Figure 5. A pH drop occurred at the beginning of each operation stage when the organic load increased, but in the stabilized state, the optimum pH range was maintained. Except for the latter part of Run 5, pH was maintained at 7.0 ± 1 under all conditions, and the system was operated in a pH range that allowed stable anaerobic digestion. The pH drop in the latter part of Run 5 was attributed to the high biodegradability of the sludge by thermal hydrolysis and the following organic acid accumulation [32]. The sudden drop in pH at high organic loads is expected to result in a stable operation if the rate-determining step mixes each different substrate at the optimum ratio. Integrated digestion of injected substrates mixed with food wastes, livestock manure, etc., will help to prevent a pH drop and provide a more stable digestion process compared to the use of single substrates [3,7]. Consequently, differences in the reaction rates of anaerobic digestion depending on the substrate could be overcome according to the characteristics of each substrate.
The alkalinity change according to the organic load was similar to that of pH. Alkalinity was maintained at approximately 3000 g m−3 as CaCO3, except in the later part of Run 5. This is close to the mean value of the optimum alkalinity (1000–5000 mg as CaCO3) of the already known anaerobic digestion process [33]. In general, the alkalinity in an anaerobic digester is one of the indicators of its stability, and the stability is largely determined by the ratio between volatile fatty acids (VFAs) and alkalinity [10,34]. Alkalinity is produced by the reduction of ammonia sulphate through the decomposition of organic nitrogen and methane production and is reduced by the accumulation of VFAs [33]. In the latter part of Run 5, alkalinity and organic acid accumulation were likely reduced for the same reasons as those of the pH drop. This occurrence is expected to be managed by the integrated digestion with other substrates [3,17].
3.2.2. Organic Matter Removal
The characteristics of organic matter removal according to the organic load of each anaerobic digester in which waste hydrated sludge was injected before and after solubilization are shown in Figure 6. Before solubilization, waste hydrated sludge (Run 1) presented TCOD and SCOD removal efficiencies of 52.7% and 60.5%, respectively, which indicates lower biodegradability compared to the sludge after solubilization. However, the treatment efficiency was not stable.
After the pre-treatment, when waste hydrated sludge was operated according to the organic load, Run 2 (2 kg of COD (m3 d)−1) to Run 4 (4 kg of COD (m3 d)−1) presented TCOD removal efficiencies of 70% or higher compared to Run 1 (2 kg of COD (m3 d)−1).
It is believed that the release of the cytoplasm from the cell wall using heat and pressure may improve the organic removal rate. The released cytoplasm turns into organic material which is relatively easily biodegradable [35,36]. However, Run 5 (5 kg of COD (m3 d)−1) presented 66.4% TCOD removal rate, which is a decrease in the removal rate. Possible causes for this result include a fast acid production reaction in the high-rate digester (5–40 kg of COD (m3 d)−1), increased instability due to the accumulation of VFAs in the reactor, and lower pH and alkalinity, which can affect organic matter removal [37]. Therefore, it can be concluded that the pre-treatment increased the biodegradability of the substrate in proportion to the organic load amount, with the optimum organic load being 2–4 kg- of COD (m3 d)−1. Moreover, the hydrolysis was more efficient compared to that of the waste hydrated sludge without pre-treatment [20,25].
3.2.3. VFAs Changes
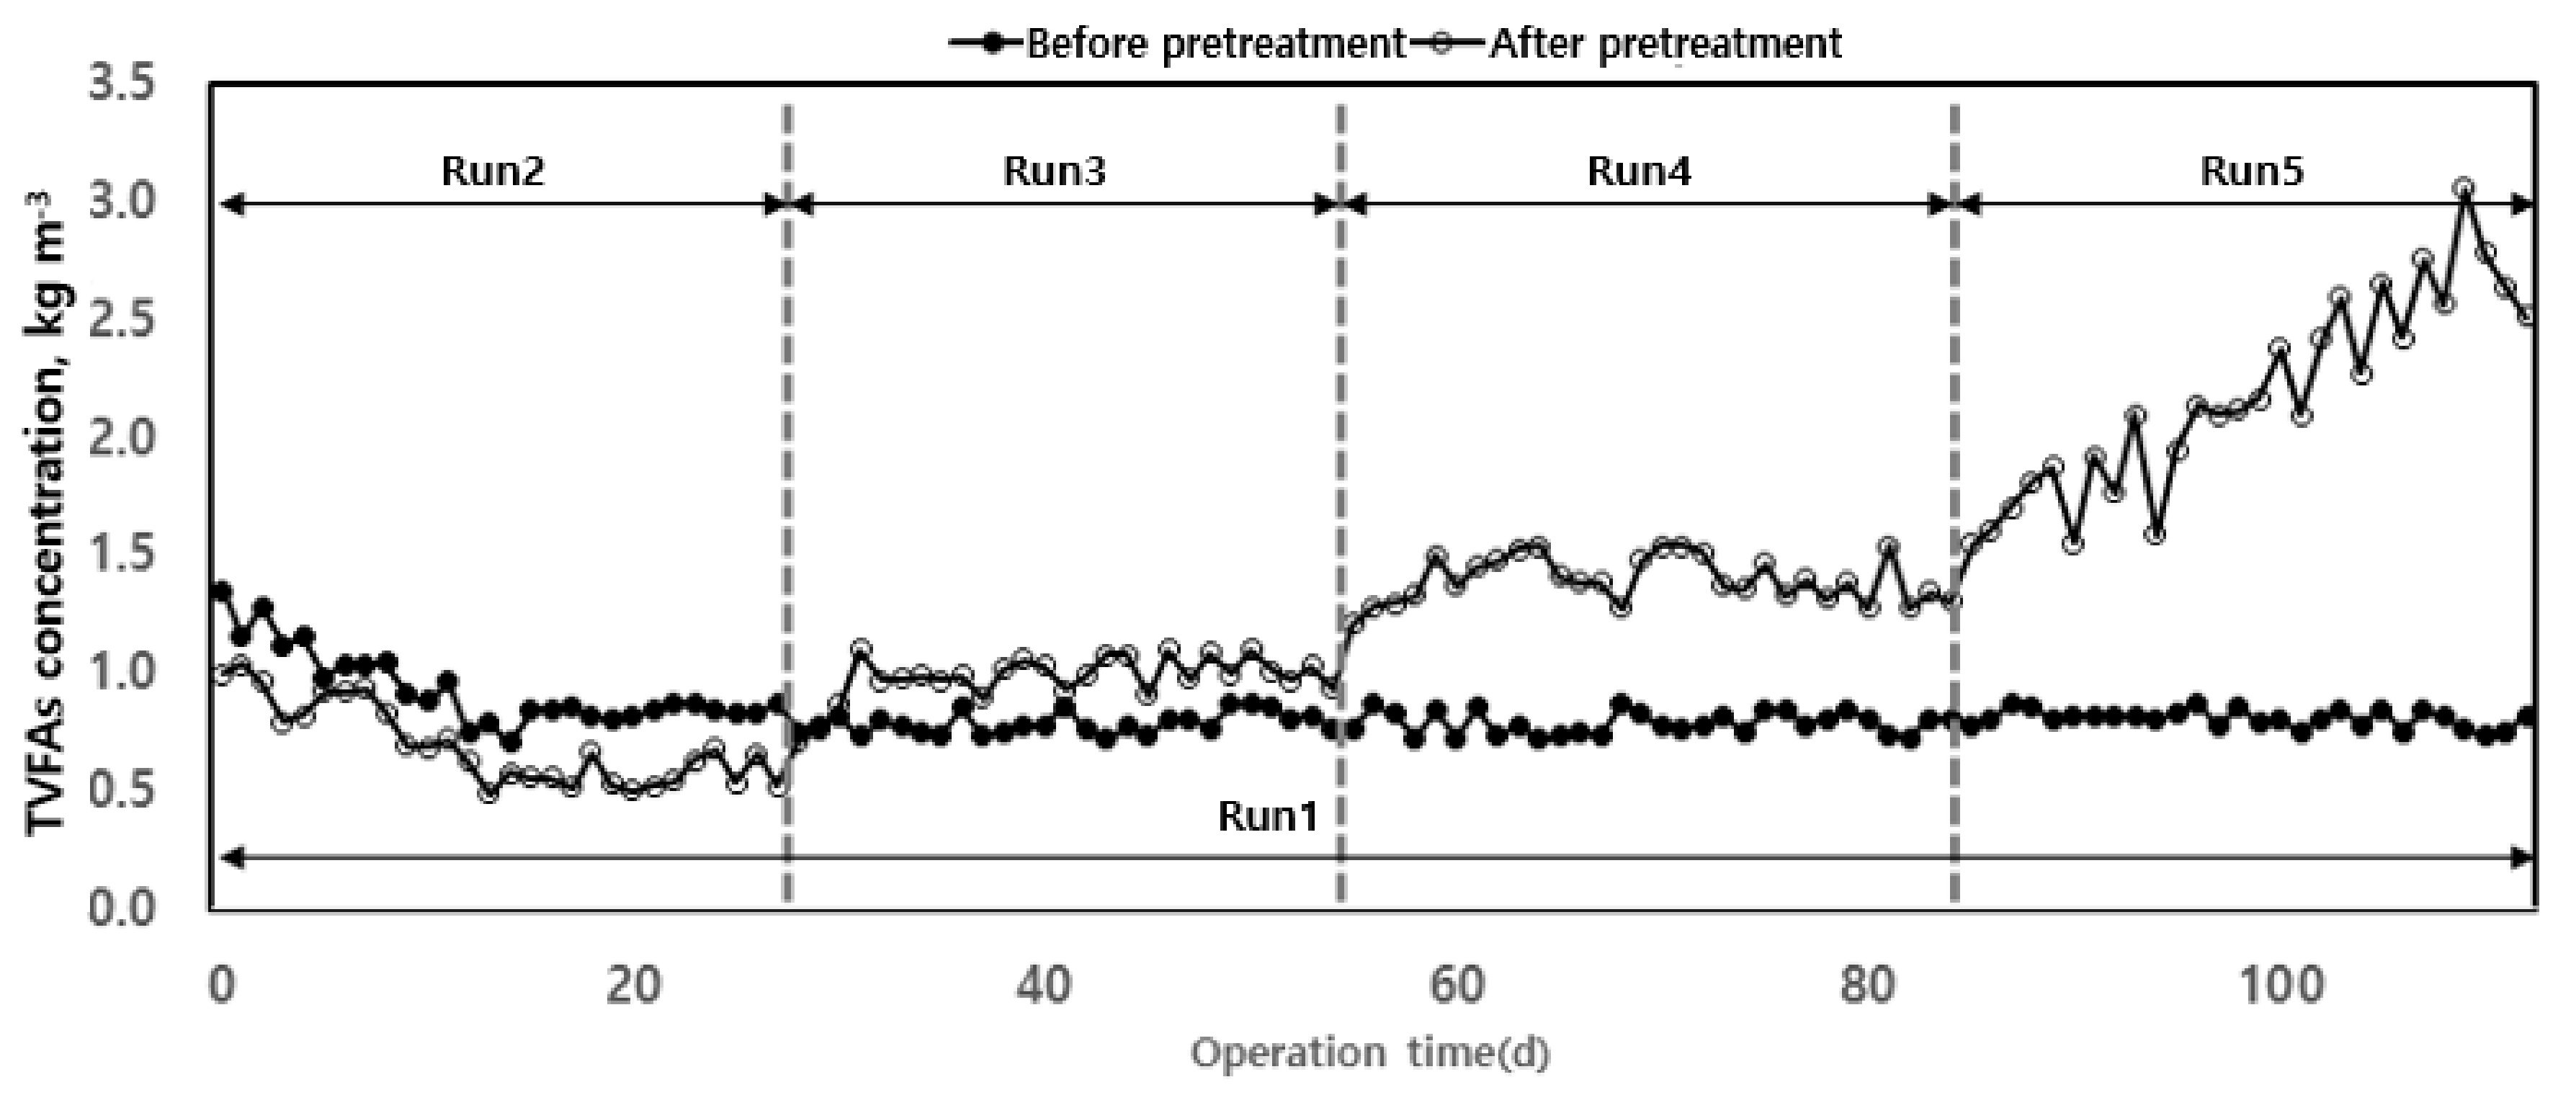
The accumulation of VFAs is a major cause of pH and alkalinity decrease in anaerobic digesters [24]. VFAs reduce the activity of the microorganisms involved in organic matter removal and methane production, thus being a limiting factor in the operation of an anaerobic digester. There are various reports on the criteria to evaluate the stability of anaerobic digesters’ operations [24,34,38]. Among them, the VFAs/alkalinity ratio proposed by [39] has been used in various studies to evaluate VFA accumulation and operational stability of pH and alkalinity according to organic load. As shown in Figure 7, the increase in organic load increased the concentration of total volatile fatty acids (TVFAs) in the reactor. This accumulation of TVFAs caused a decrease in alkalinity and pH in the digester and a rapid decrease in methane production. In the case of Run 1, stable operation was possible for 100 d without significant variation of TVFAs concentration. After thermal hydrolysis, TVFAs concentration increased with the organic load. For Run 5, the concentration rapidly increased, indicating that the optimum organic load range for anaerobic digestion using waste hydrated sludge after thermal hydrolysis corresponded to those up to Run 4.
3.2.4. Methane Production and Yield
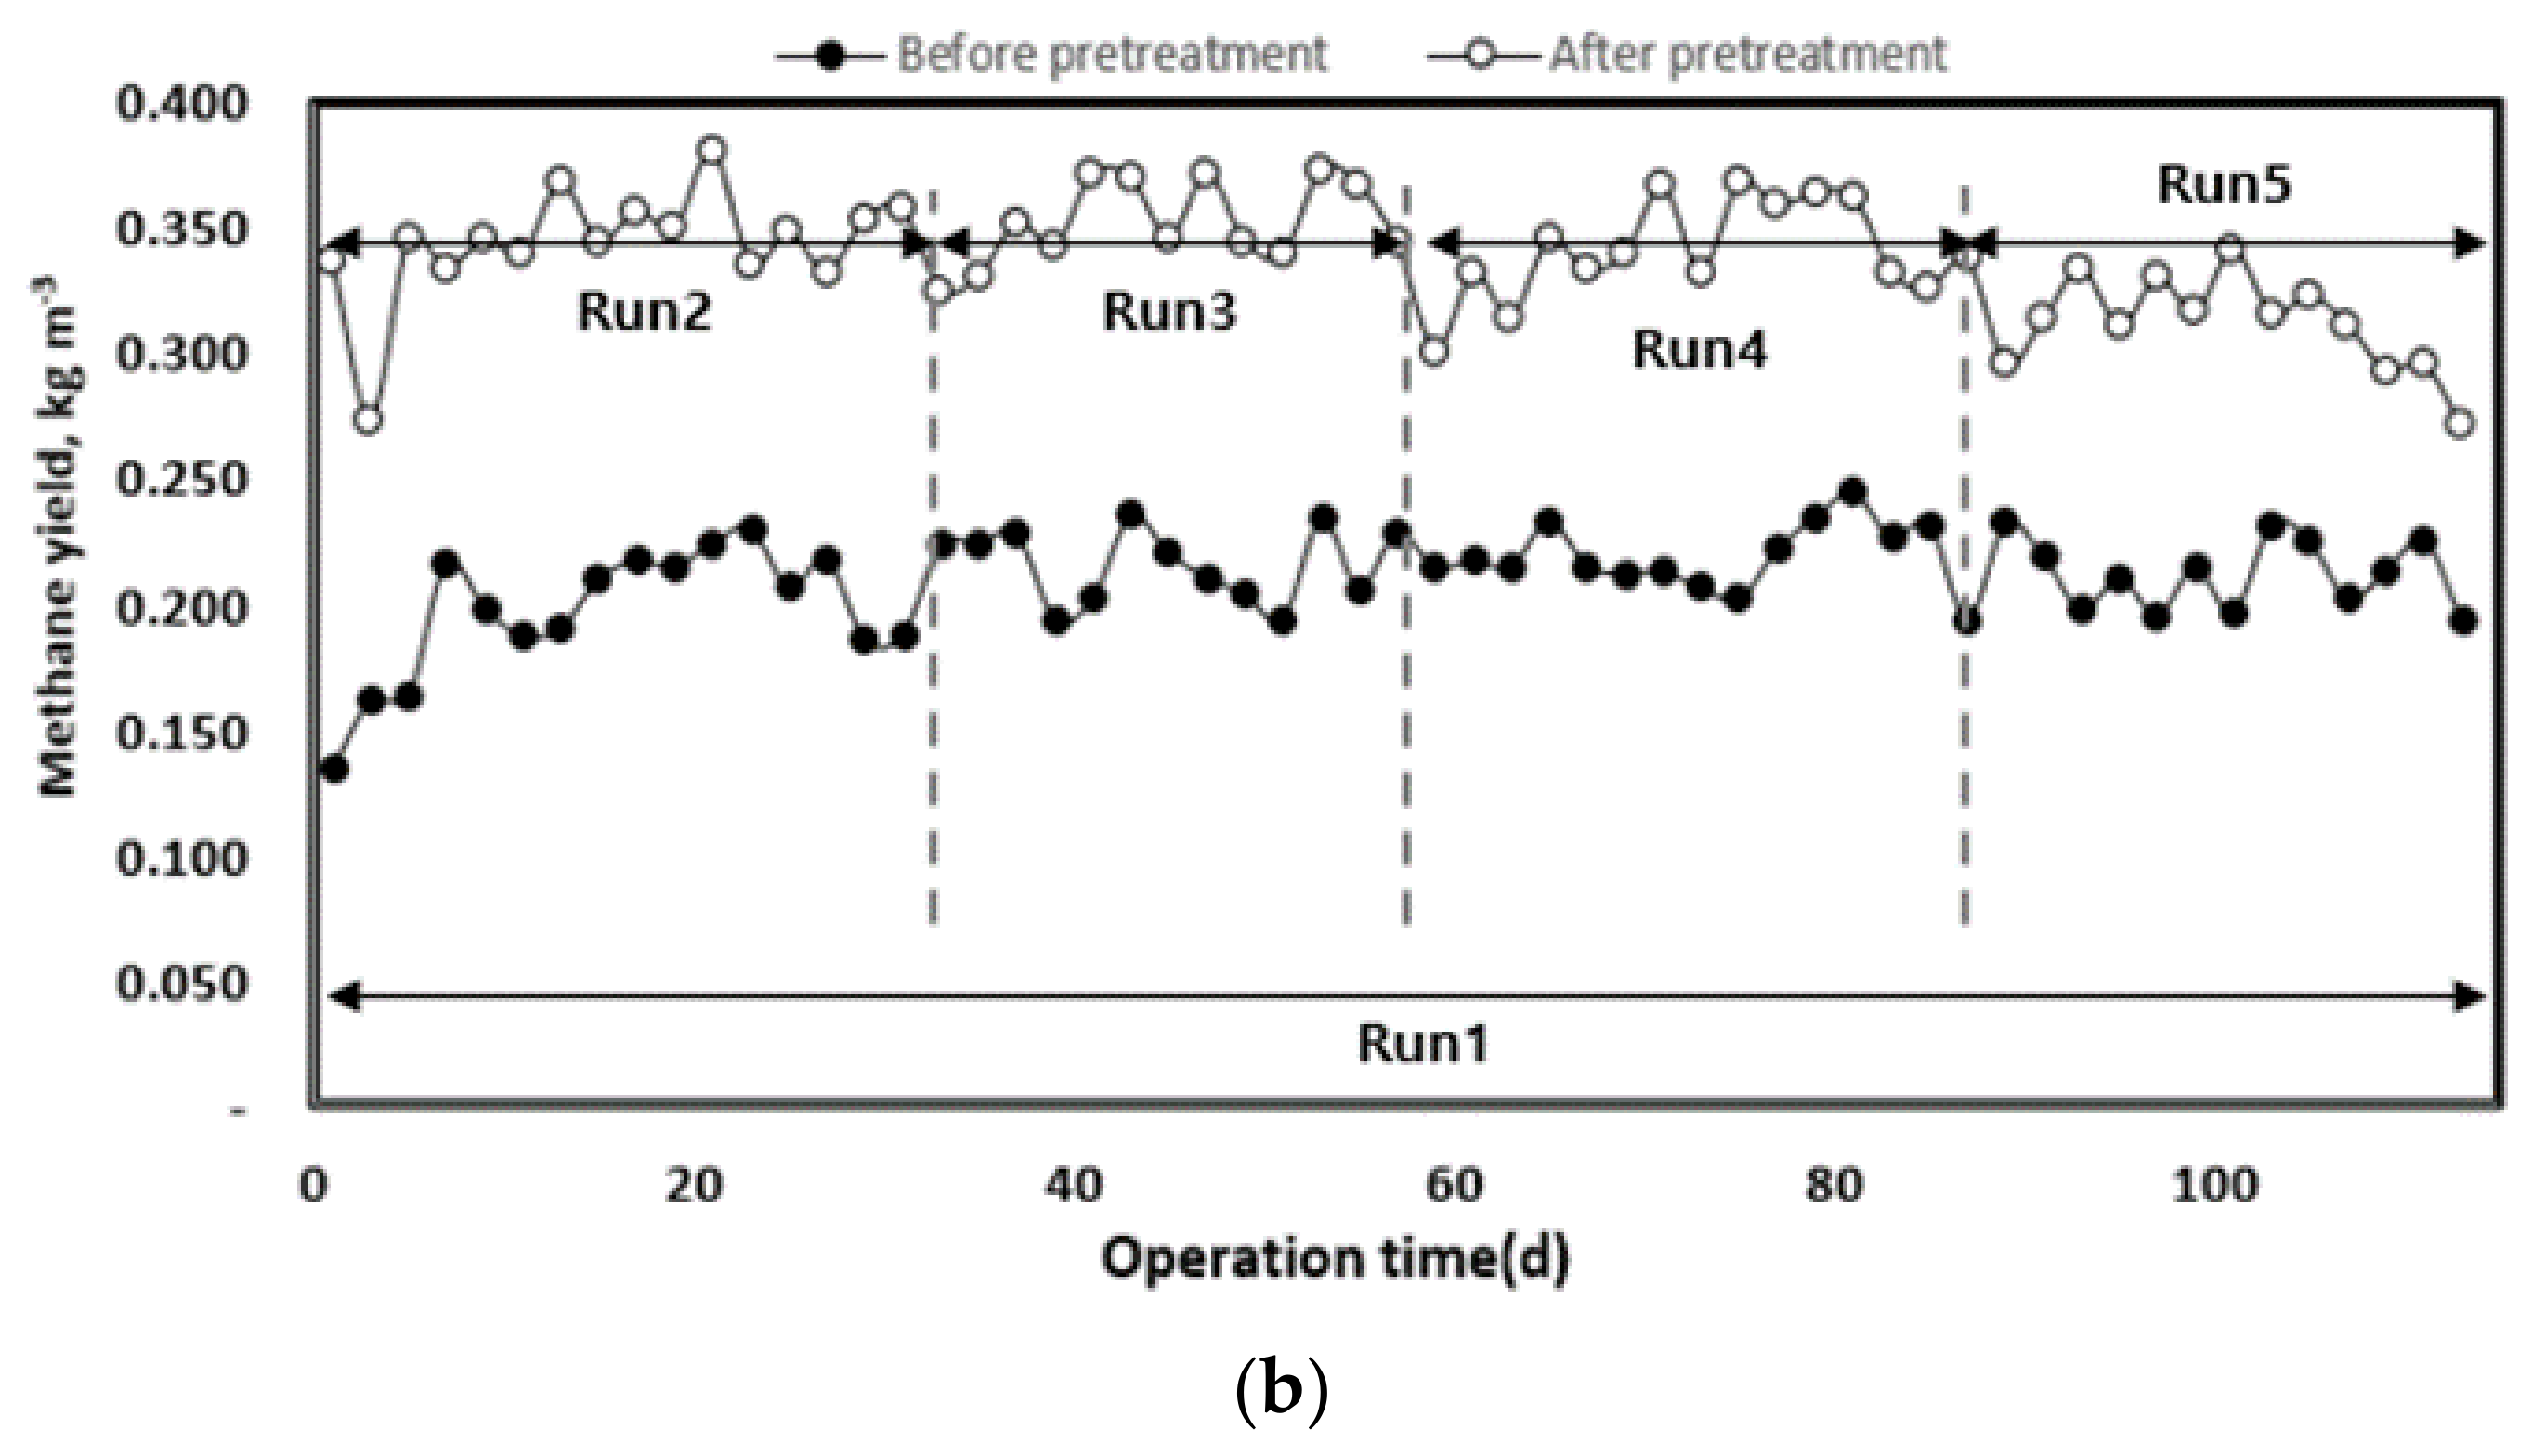
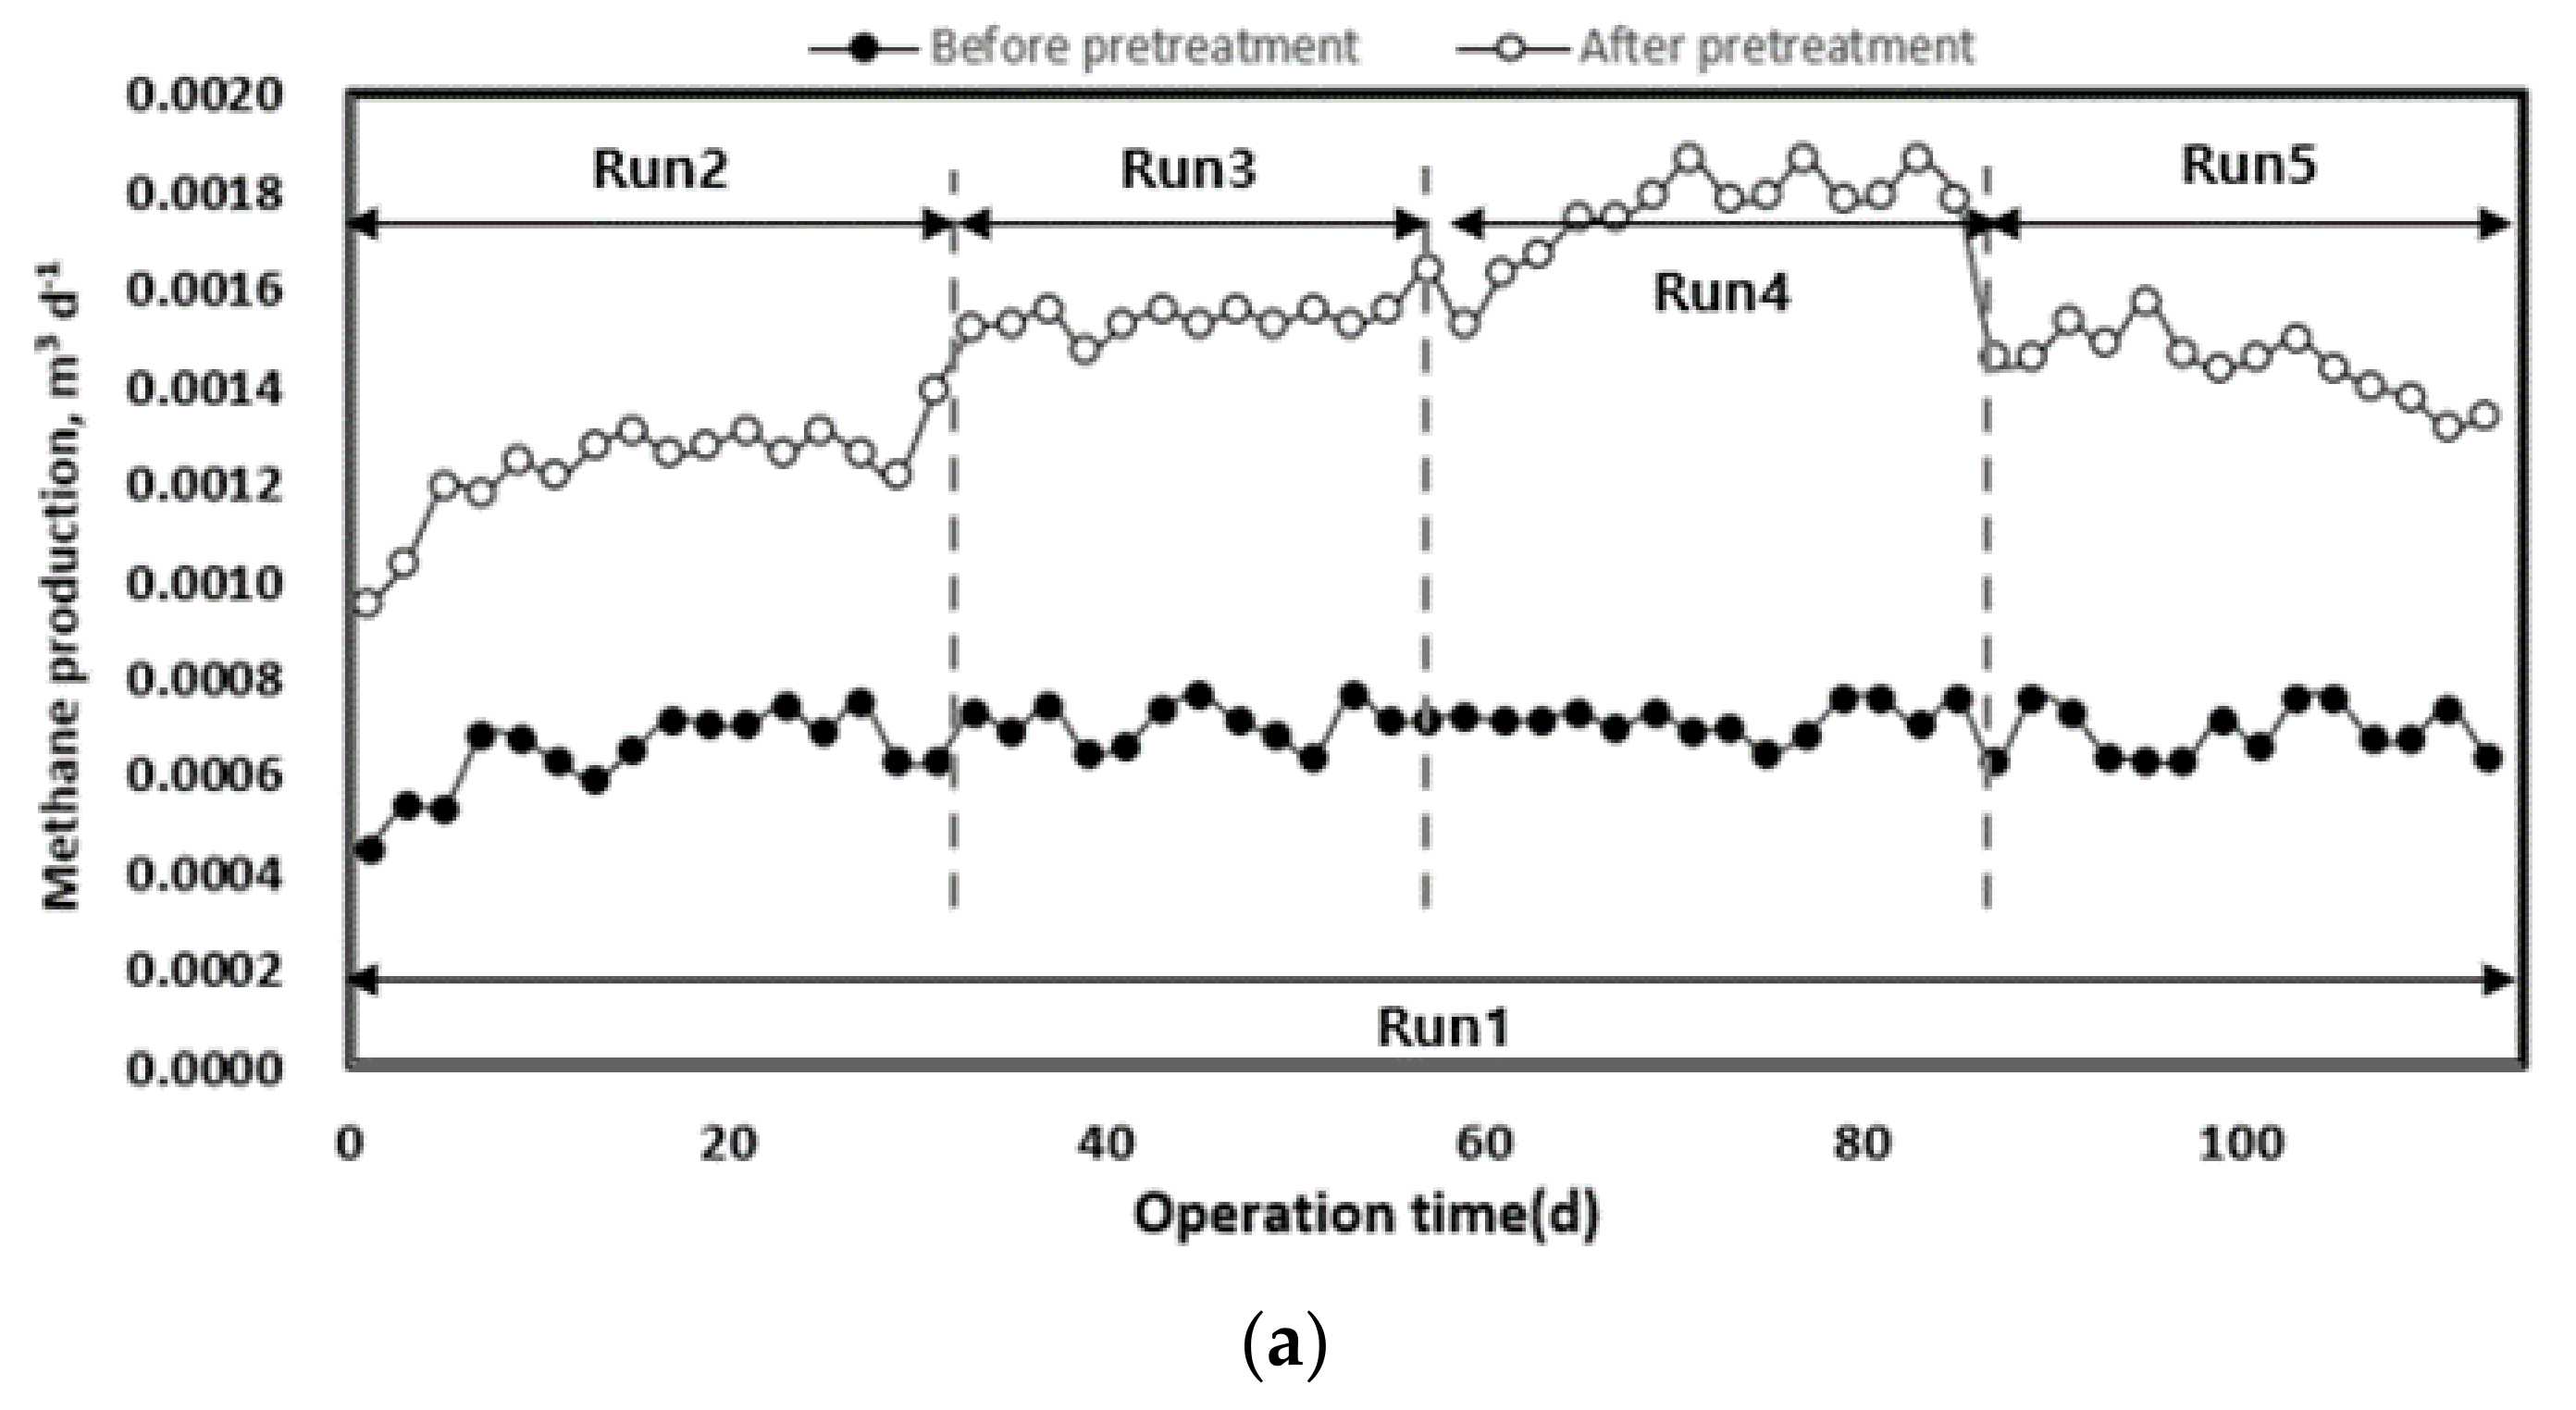
The change in methane yield according to the organic load of each pilot plant injected with waste hydrated sludge during the entire operation period is shown in Figure 8. Waste hydrated sludge without pre-treatment by thermal hydrolysis led to a significantly lower methane production, with an average of 0.68 L d−1. The waste hydrated sludge with pre-treatment led to an average methane production of 1.22 L d−1 during the initial start-up period of approximately 27 d and then to an average methane production of 1.57 L d−1 until the end of the experiment. On the basis of the total experimental period, methane production without thermal hydrolysis averaged 0.68 L d−1, and that with thermal hydrolysis was 1.48 L d−1. Therefore, pre-treated sludge allowed an increase in methane production of approximately 54% compared to the sludge without pre-treatment.
As the organic load increased, methane production also increased. In Run 5, methane production was first inhibited by the deterioration of the operating conditions of anaerobic digestion (pH, alkalinity, VFA concentration). The pre-treatment rapidly improved methane production up to the optimum organic load. However, at high organic loads, the stability of the operation was low [40]. On the basis of the organic concentration of the inflow substrate, methane yield increased after pre-treatment, which means that biodegradability increased with the pre-treatment [8,17]. For Run 5, there was a rapid decrease in methane yield. A low methane yield implies a low conversion efficiency of injected organics to methane [16]. Therefore, high organic removal and methane production efficiency can be expected when a mixed treatment is performed with substrates such as food waste, which has high biodegradability [7].
4. Conclusions
In this study, we investigated the major operational factors and solubilization effects during thermal hydrolysis in various conditions and continuous operation using waste hydrated sludge. As a result, it was confirmed that the main factor affecting the solubilization rate was temperature. Considering temperature and time, there was a relatively high reliability of the system at low temperatures and a low reliability at high temperatures, indicating that the effect of time became smaller as the temperature increased. In addition, it was confirmed that there was no significant difference in the elemental composition before and after thermal hydrolysis. These findings indicate that thermal energy disrupted chemical bonds but did not change the internal constituent elements. In other words, the effect of the thermal hydrolysis conditions on the theoretical methane generation was minimal.
As a result of the BMP test, it was confirmed that the biodegradability increased rapidly at 165 °C, as in the case of SCOD increase due to thermal hydrolysis. Therefore, it was confirmed that the optimum condition for solubilization was at 165 °C for 20 min. In addition, there was a high correlation between biodegradability and the SCOD/TCOD ratio, indicating that organic matter with slow decomposition rate is advantageous for methane generation due to thermal hydrolysis.
In the lab-scale continuous operation, a pH drop occurred at the beginning of each operation stage when the organic load of Run 2 to Run 4 increased. However, an adequate pH range was maintained in the stabilized state. Nevertheless, a sharp pH drop occurred in Run 5, which is thought to be due to the accumulation of organic acids as a result of the increased biodegradability of the sludge through thermal hydrolysis. The alkalinity change showed the same trend as the pH change values, and it was confirmed that optimum alkalinity could be maintained in the anaerobic digestion process under all operating conditions, except Run 5. When the removal of organic matter was compared before and after thermal hydrolysis, it was confirmed that the sludge before hydrolysis presented lower biodegradability, also confirming its relatively lower removal efficiency. In addition, TVFA concentration increased with load after thermal hydrolysis, with a particularly rapid increase in Run 5. This result indicates that for anaerobic digestion using waste hydrated sludge after thermal hydrolysis, the optimum organic load is up to Run 4. As a result, the optimum organic load according to thermal hydrolysis was 2–4 kg of COD (m3 d)−1. The treatment efficiency can be increased by improving the hydrolysis efficiency with respect to that before thermal hydrolysis. In conclusion, this study showed that high temperature and pressure pre-treatment of waste hydrated sludge could improve methane yield and solubilization rate. These findings are expected to be useful for renewable energy utilization.
Author Contributions
Conceptualization, Writing Original Draft, and Methodology, E.-H.H. and J.-G.P.; Data Curation and Measurement, B.L. and W.-Q.S.; Review and Supervision, H.-B.J. All authors have read and agreed to the published version of the manuscript.
Funding
This research was supported by the Ministry of Trade, Industry and Energy (MOTIE) and Korea Institute for Advancement of Technology (KIAT) through the National Innovation Cluster R&D program (P0006716) and was supported by the Korea Ministry of Environment as Waste to Energy-Recycling Human Resource Development Project (YL-WE-19-001).
Conflicts of Interest
The authors declare no conflicts of interest. The funders had no role in the design of the study; in the collection, analyses, or interpretation of data; in the writing of the manuscript, or in the decision to publish the results.
References
- Tozlu, A.; Özahi, E.; Abuşoğlu, A. Waste to energy technologies for municipal solid waste management in Gaziantep. Renew. Sustain. Energy Rev. 2016, 54, 809–815. [Google Scholar] [CrossRef]
- Kacprzak, M.; Neczaj, E.; Fijałkowski, K.; Grobelak, A.; Grosser, A.; Worwag, M.; Rorat, A.; Brattebo, H.; Almås, Å.; Singh, B.R. Sewage sludge disposal strategies for sustainable development. Environ. Res. 2017, 156, 39–46. [Google Scholar] [CrossRef] [PubMed]
- Han, M.J.; Behera, S.K.; Park, H.S. Anaerobic co-digestion of food waste leachate and piggery wastewater for methane production: Statistical optimization of key process parameters. J. Chem. Technol. Biotechnol. 2012, 87, 1541–1550. [Google Scholar] [CrossRef]
- Zou, K.; Zhang, L. Implementing the London Dumping Convention in East Asia. Asia Pac. J. Ocean Law Policy 2017, 2, 247–267. [Google Scholar] [CrossRef]
- Polprasert, C.; Koottatep, T. Organic Waste Recycling; IWA Publishing: London, UK, 2007. [Google Scholar]
- Park, J.G.; Shin, W.B.; Shi, W.Q.; Jun, H.B. Changes of bacterial communities in an anaerobic digestion and a bio-electrochemical anaerobic digestion reactors according to organic load. Energies 2019, 12, 2958. [Google Scholar] [CrossRef] [Green Version]
- Kim, S.H.; Ju, H.J. Feasibility of co-digestion of sewage sludge, swine waste, and food waste leachate. J. Korea Org. Resour. Recycl. Assoc. 2012, 20, 61–70. [Google Scholar]
- Mata-Alvarez, J.; Mace, S.; Llabres, P. Anaerobic digestion of organic solid wastes: An overview of research achievements and perspectives. Bioresour. Technol. 2000, 74, 3–16. [Google Scholar] [CrossRef]
- Cristancho, D.E.; Arellano, A.V. Study of the operational conditions for anaerobic digestion of urban solid wastes. Waste Manag. 2006, 26, 546–556. [Google Scholar]
- Lee, B.; Park, J.G.; Shin, W.B.; Tian, D.J.; Jun, H.B. Microbial communities change in an anaerobic digestion after application of microbial electrolysis cells. Bioresour. Technol. 2017, 234, 273–280. [Google Scholar] [CrossRef]
- Ariunbaatar, J.; Panico, A.; Esposito, G.; Pirozzi, F.; Lens, P.N. Pretreatment methods to enhance anaerobic digestion of organic solid waste. Appl. Energy 2014, 123, 143–156. [Google Scholar] [CrossRef]
- Kim, J.; Park, C.; Kim, T.H.; Lee, M.; Kim, S.; Kim, S.W.; Lee, J. Effects of various pretreatments for enhanced anaerobic digestion with waste activated sludge. J. Biosci. Bioeng. 2003, 95, 271–275. [Google Scholar] [CrossRef]
- Valo, A.; Carrere, H.; Delgenes, J.P. Thermal, chemical and thermo-chemical pre-treatment of waste activated sludge for anaerobic digestion. J. Chem. Technol. Biotechnol. Int. Res. Process Environ. Clean Technol. 2004, 79, 1197–1203. [Google Scholar] [CrossRef]
- Bohutskyi, P.; Betenbaugh, M.J.; Bouwer, E.J. The effects of alternative pretreatment strategies on anaerobic digestion and methane production from different algal strains. Bioresour. Technol. 2014, 155, 366–372. [Google Scholar] [CrossRef] [PubMed]
- Mudhoo, A. (Ed.) Biogas Production: Pretreatment Methods in Anaerobic Digestion; John Wiley & Sons: Hoboken, NJ, USA, 2012. [Google Scholar]
- Michaud, S.; Bernet, N.; Buffière, P.; Roustan, M.; Moletta, R. Methane yield as a monitoring parameter for the start-up of anaerobic fixed film reactors. Water Res. 2002, 36, 1385–1391. [Google Scholar] [CrossRef]
- Lee, B.; Park, J.G.; Shin, W.B.; Kim, B.S.; Byun, B.S.; Jun, H.B. Maximizing biogas production by pre-treatment and by optimizing the mixture ratio of co-digestion with organic wastes. Environ. Eng. Res. 2019, 24, 662–669. [Google Scholar] [CrossRef] [Green Version]
- Kavitha, S.; Jayashree, C.; Kumar, S.A.; Yeom, I.T.; Banu, J.R. The enhancement of anaerobic biodegradability of waste activated sludge by surfactant mediated biological pretreatment. Bioresour. Technol. 2014, 168, 159–166. [Google Scholar] [CrossRef]
- Xue, Y.; Liu, H.; Chen, S.; Dichtl, N.; Dai, X.; Li, N. Effects of thermal hydrolysis on organic matter solubilization and anaerobic digestion of high solid sludge. Chem. Eng. J. 2015, 264, 174–180. [Google Scholar] [CrossRef]
- Carrère, H.; Dumas, C.; Battimelli, A.; Batstone, D.J.; Delgenès, J.P.; Steyer, J.P.; Ferrer, I. Pre-treatment methods to improve sludge anaerobic degradability: A review. J. Hazard. Mater. 2010, 183, 1–15. [Google Scholar] [CrossRef]
- Mahmood, T.; Elliott, A. A review of secondary sludge reduction technologies for the pulp and paper industry. Water Res. 2006, 40, 2093–2112. [Google Scholar] [CrossRef]
- Cano, R.; Nielfa, A.; Fdz-Polanco, M. Thermal hydrolysis integration in the anaerobic digestion process of different solid wastes: Energy and economic feasibility study. Bioresour. Technol. 2014, 168, 14–22. [Google Scholar] [CrossRef]
- Tyagi, V.K.; Lo, S.L. Sludge: A waste or renewable source for energy and resources recovery. Renew. Sustain. Energy Rev. 2013, 25, 708–728. [Google Scholar] [CrossRef]
- Rajagopal, R.; Massé, D.I.; Singh, G. A critical review on inhibition of anaerobic digestion process by excess ammonia. Bioresour. Technol. 2013, 143, 632–641. [Google Scholar] [CrossRef] [PubMed]
- Wilson, C.A.; Novak, J.T. Hydrolysis of macromolecular components of primary and secondary wastewater sludge by thermal hydrolytic pre-treatment. Water Res. 2009, 43, 4489–4498. [Google Scholar] [CrossRef] [PubMed]
- Buswell, A.M.; Mueller, H.F. Mechanism of methane fermentation. Ind. Eng. Chem. 1952, 44, 550–552. [Google Scholar] [CrossRef]
- O’Rourke, M.F.; Blazek, J.V.; Morreels, C.L., Jr.; Krovetz, L.J. Pressure wave transmission along the human aorta: Changes with age and in arterial degenerative disease. Circ. Res. 1968, 23, 567–579. [Google Scholar] [CrossRef] [Green Version]
- Boyle, E.A.; Sclater, F.; Edmond, J.M. On the marine geochemistry of cadmium. Nature 1976, 263, 42. [Google Scholar] [CrossRef]
- Kayhanian, M.; Tchobanoglous, G. Innovative two-stage process for the recovery of energy and compost from the organic fraction of municipal solid waste (MSW). Water Sci. Technol. 1993, 27, 133–143. [Google Scholar] [CrossRef]
- Connaughton, S.; Collins, G.; O’Flaherty, V. Psychrophilic and mesophilic anaerobic digestion of brewery effluent: A comparative study. Water Res. 2006, 40, 2503–2510. [Google Scholar] [CrossRef]
- Schieder, D.; Schneider, R.; Bischof, F. Thermal hydrolysis (TDH) as a pretreatment method for the digestion of organic waste. Water Sci. Technol. 2000, 41, 181–187. [Google Scholar] [CrossRef]
- Strong, P.J.; McDonald, B.; Gapes, D.J. Combined thermochemical and fermentative destruction of municipal biosolids: A comparison between thermal hydrolysis and wet oxidative pre-treatment. Bioresour. Technol. 2011, 102, 5520–5527. [Google Scholar] [CrossRef]
- Agdag, O.N.; Sponza, D.T. Effect of alkalinity on the performance of a simulated landfill bioreactor digesting organic solid wastes. Chemosphere 2005, 59, 871–879. [Google Scholar] [CrossRef] [PubMed]
- Siegert, I.; Banks, C. The effect of volatile fatty acid additions on the anaerobic digestion of cellulose and glucose in batch reactors. Process Biochem. 2005, 40, 3412–3418. [Google Scholar] [CrossRef]
- Carrere, H.; Antonopoulou, G.; Affes, R.; Passos, F.; Battimelli, A.; Lyberatos, G.; Ferrer, I. Review of feedstock pretreatment strategies for improved anaerobic digestion: From lab-scale research to full-scale application. Bioresour. Technol. 2016, 199, 386–397. [Google Scholar] [CrossRef] [PubMed]
- Elliott, A.; Mahmood, T. Pretreatment technologies for advancing anaerobic digestion of pulp and paper biotreatment residues. Water Res. 2007, 41, 4273–4286. [Google Scholar] [CrossRef] [PubMed]
- Nguyen, D.; Gadhamshetty, V.; Nitayavardhana, S.; Khanal, S.K. Automatic process control in anaerobic digestion technology: A critical review. Bioresour. Technol. 2015, 193, 513–522. [Google Scholar] [CrossRef]
- Chen, Y.; Cheng, J.J.; Creamer, K.S. Inhibition of anaerobic digestion process: A review. Bioresour. Technol. 2008, 99, 4044–4064. [Google Scholar] [CrossRef]
- Kardos, L.; Juhász, A.; Palkó, G.Y.; Oláh, J.; Barkács, K.; Zaray, G. Comparing of mesophilic and thermophilic anaerobic fermented sewage sludge based on chemical and biochemical tests. Appl. Ecol. Environ. Res. 2011, 9, 293–302. [Google Scholar] [CrossRef]
- Kong, X.; Wei, Y.; Xu, S.; Liu, J.; Li, H.; Liu, Y.; Yu, S. Inhibiting excessive acidification using zero-valent iron in anaerobic digestion of food waste at high organic load rates. Bioresour. Technol. 2016, 211, 65–71. [Google Scholar] [CrossRef]
Figure 1.
Schematic diagram of the thermal hydrolysis reactor (1: pressure gauge; 2: steam outlet; 3: steam inlet; 4: thermal hydrolysis byproduct outlet).
Figure 1.
Schematic diagram of the thermal hydrolysis reactor (1: pressure gauge; 2: steam outlet; 3: steam inlet; 4: thermal hydrolysis byproduct outlet).

Figure 2.
Anaerobic digester. (1: stirring motor; 2: biogas outlet; 3: high-temperature anaerobic digester; 4: stirring paddle;).
Figure 2.
Anaerobic digester. (1: stirring motor; 2: biogas outlet; 3: high-temperature anaerobic digester; 4: stirring paddle;).

Figure 3.
Schematic diagram of the thermal hydrolysis device and high-temperature anaerobic digester (1: stirring motor; 2: biogas outlet; 3: outlet; 4: high-temperature anaerobic digester; 5: stirring paddle; 6: injection pump; 7: pressure gauge; 8: steam outlet; 9: steam inlet; 10: thermal hydrolysis byproduct outlet).
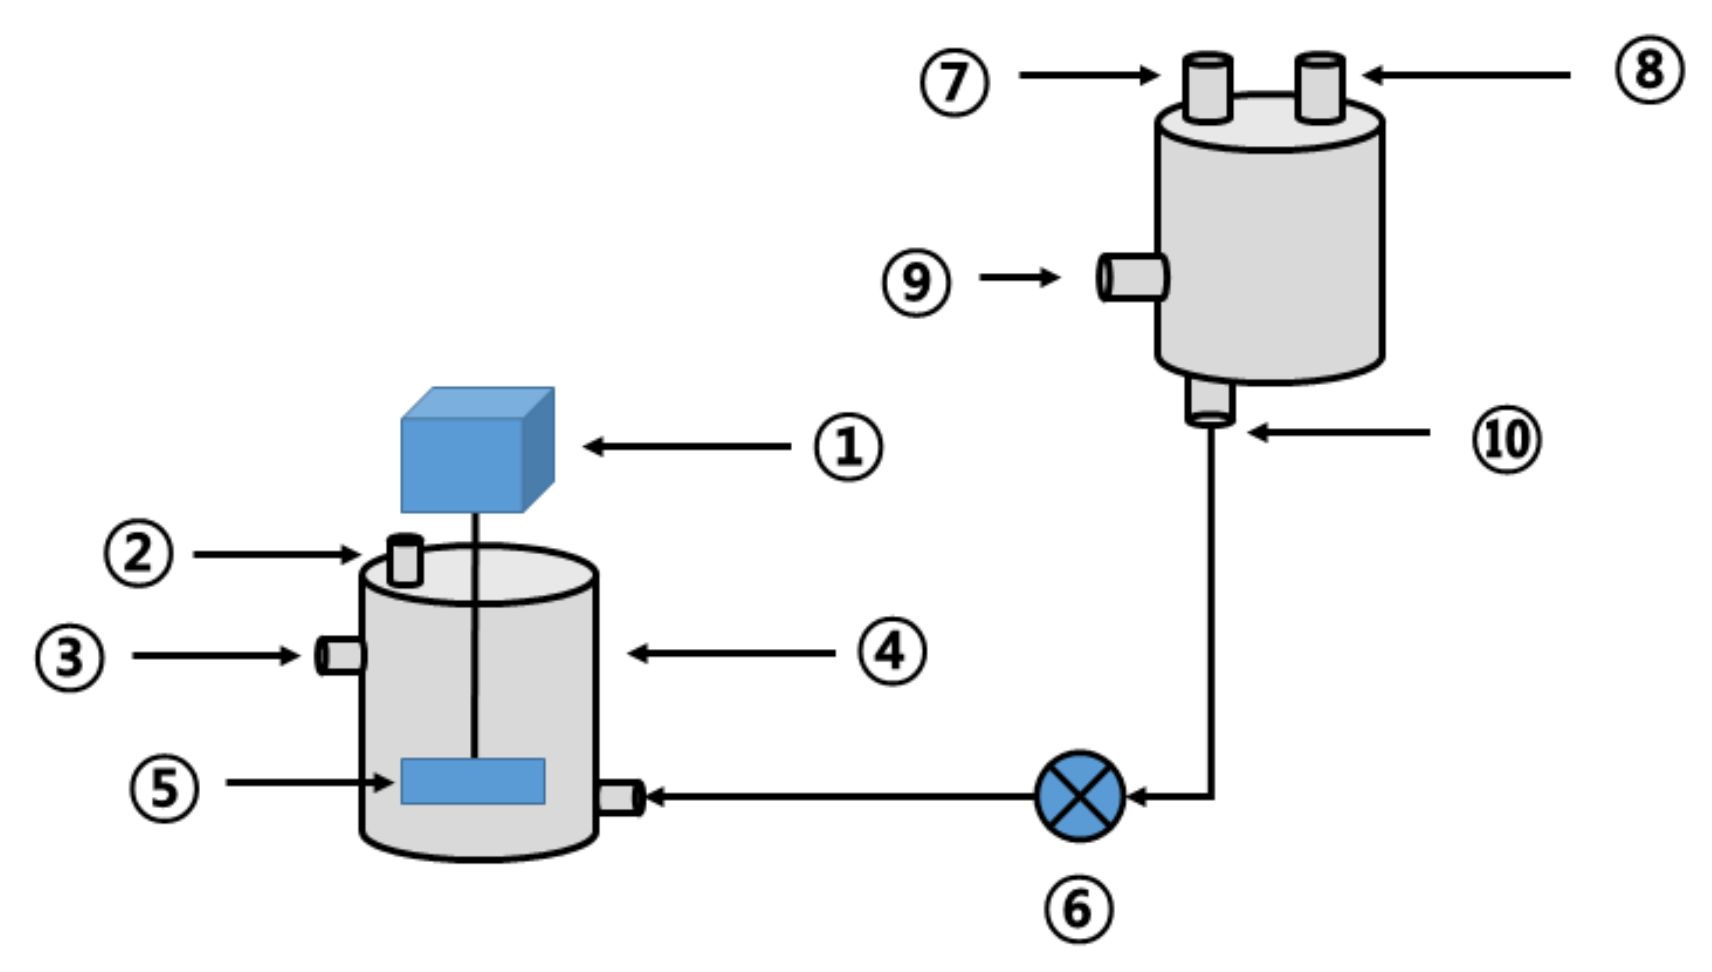
Figure 4.
BMP test results after thermal hydrolysis in various reactors (R1–12).
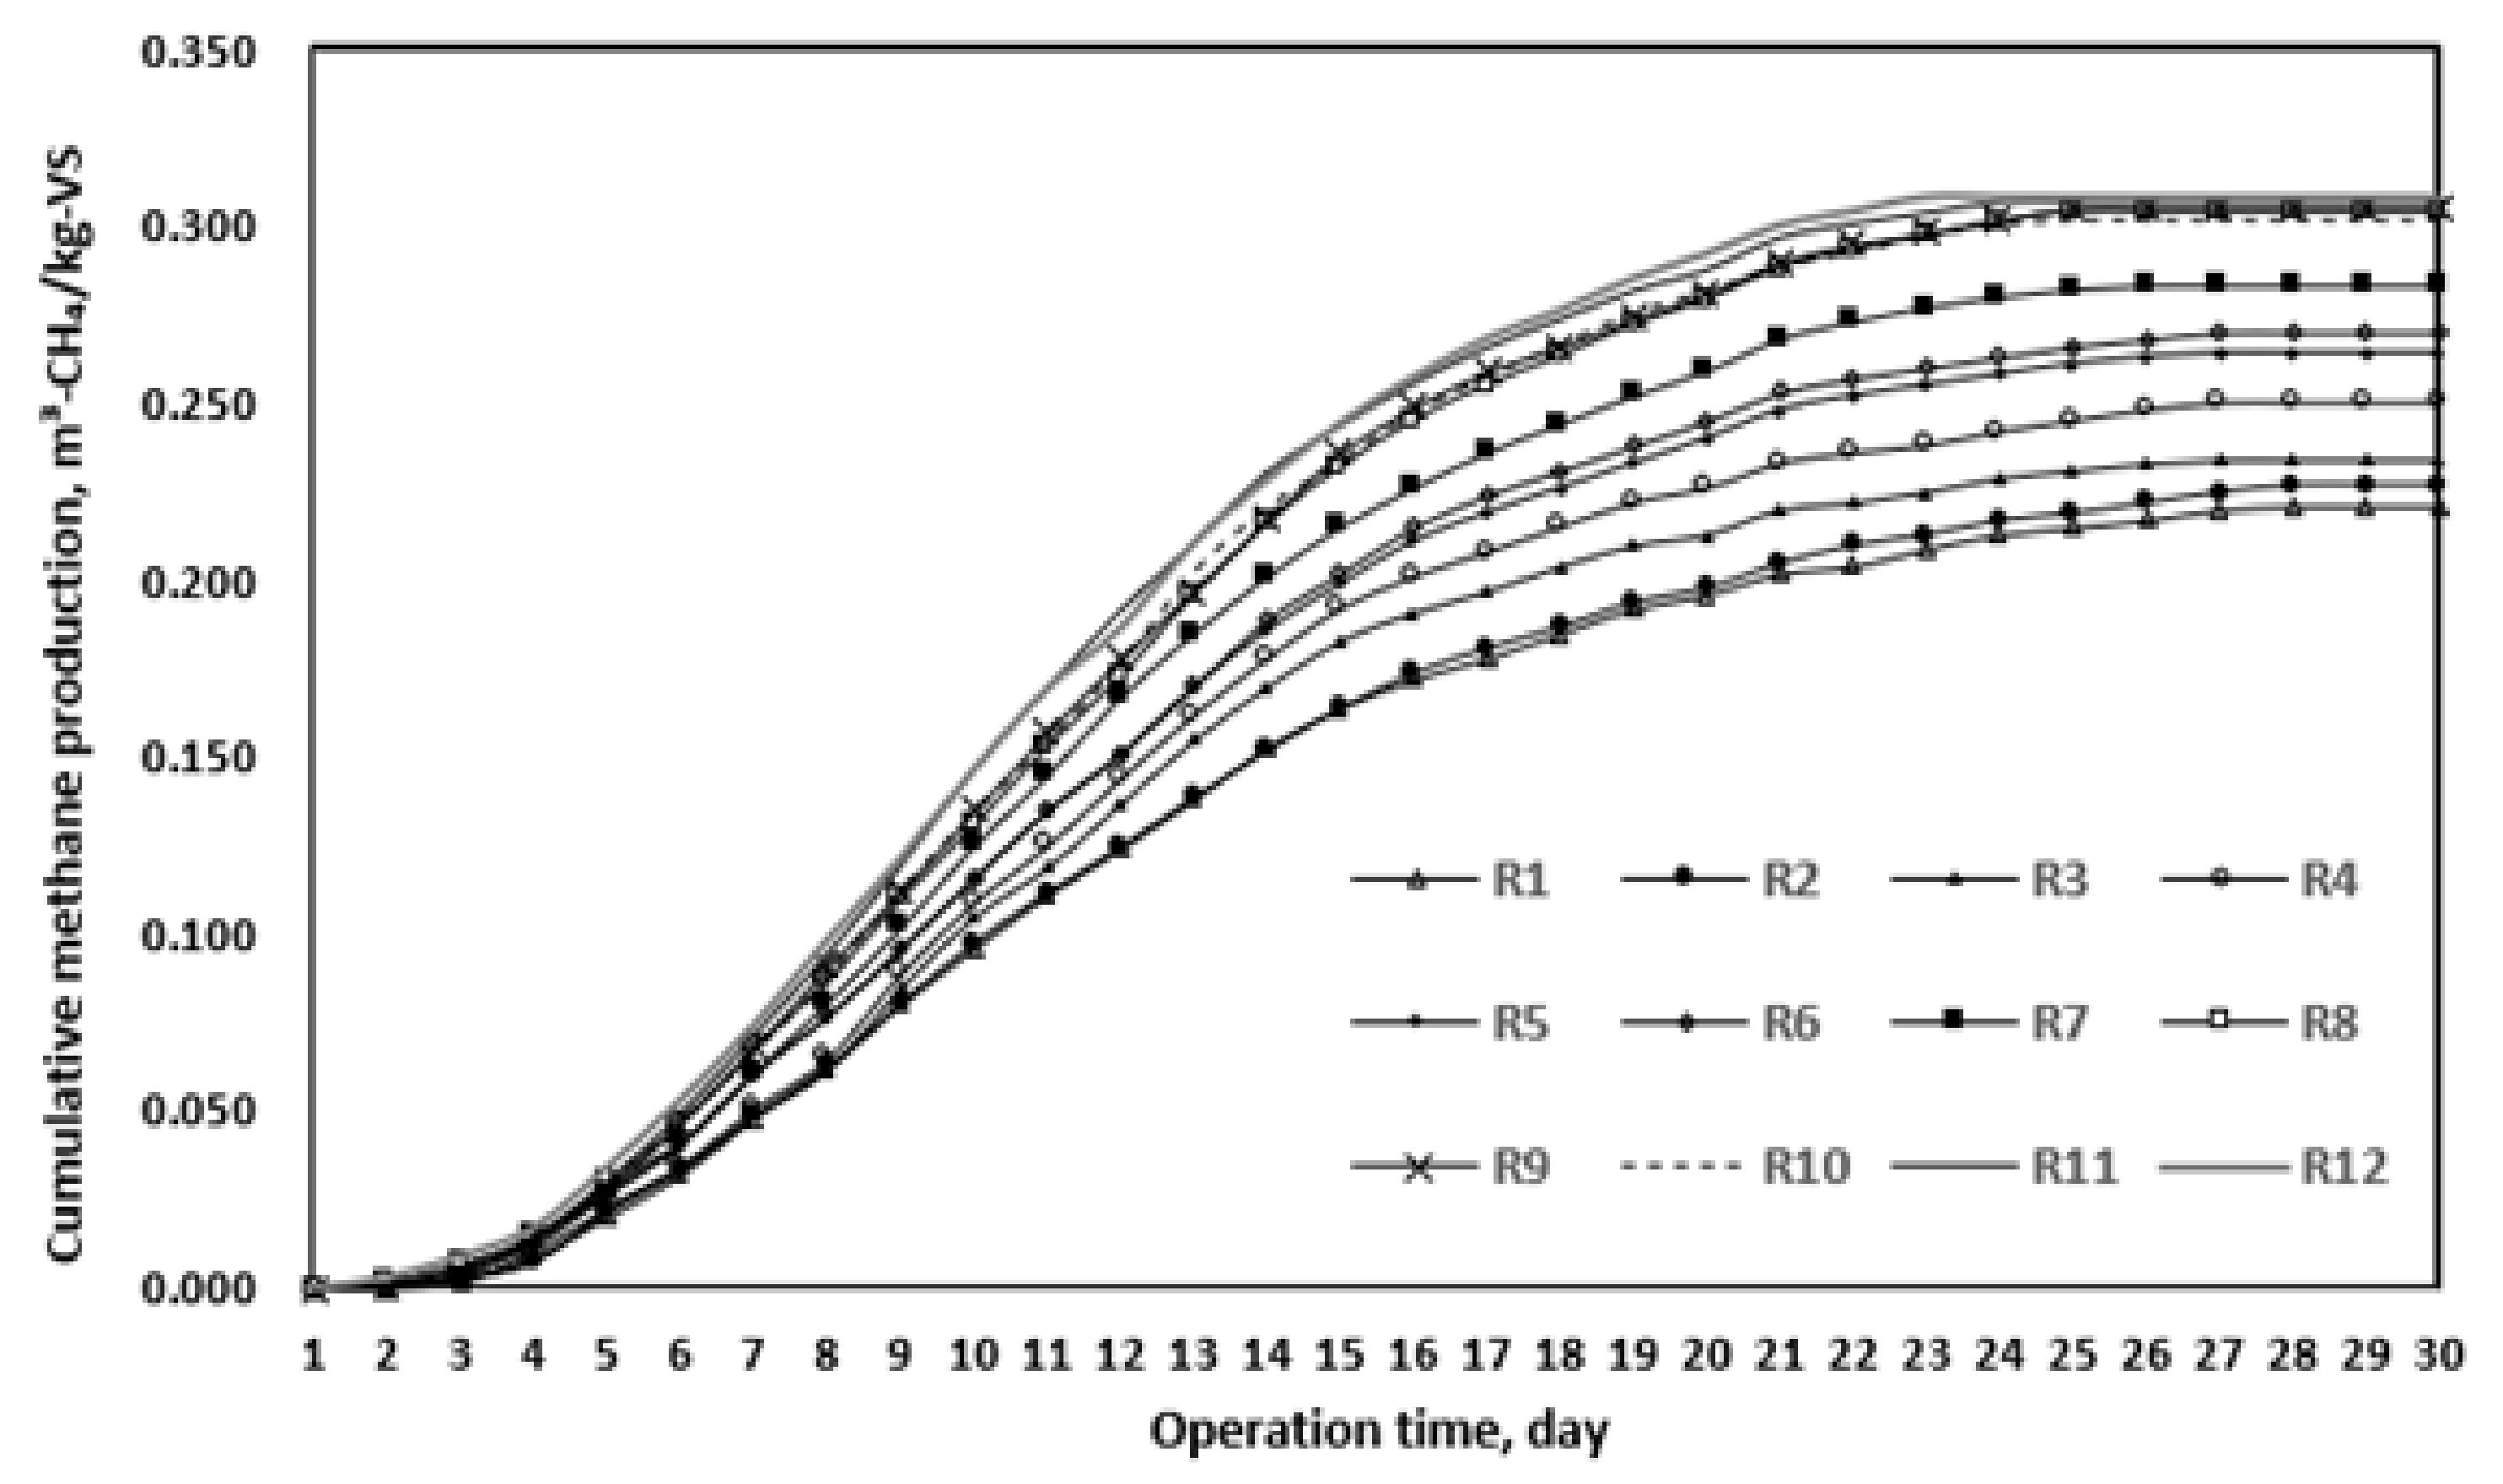
Figure 5.
Changes in pH (a) and alkalinity (b) according to operation time.

Figure 6.
TCOD (a) and SCOD (b) removal efficiency according to operation time.
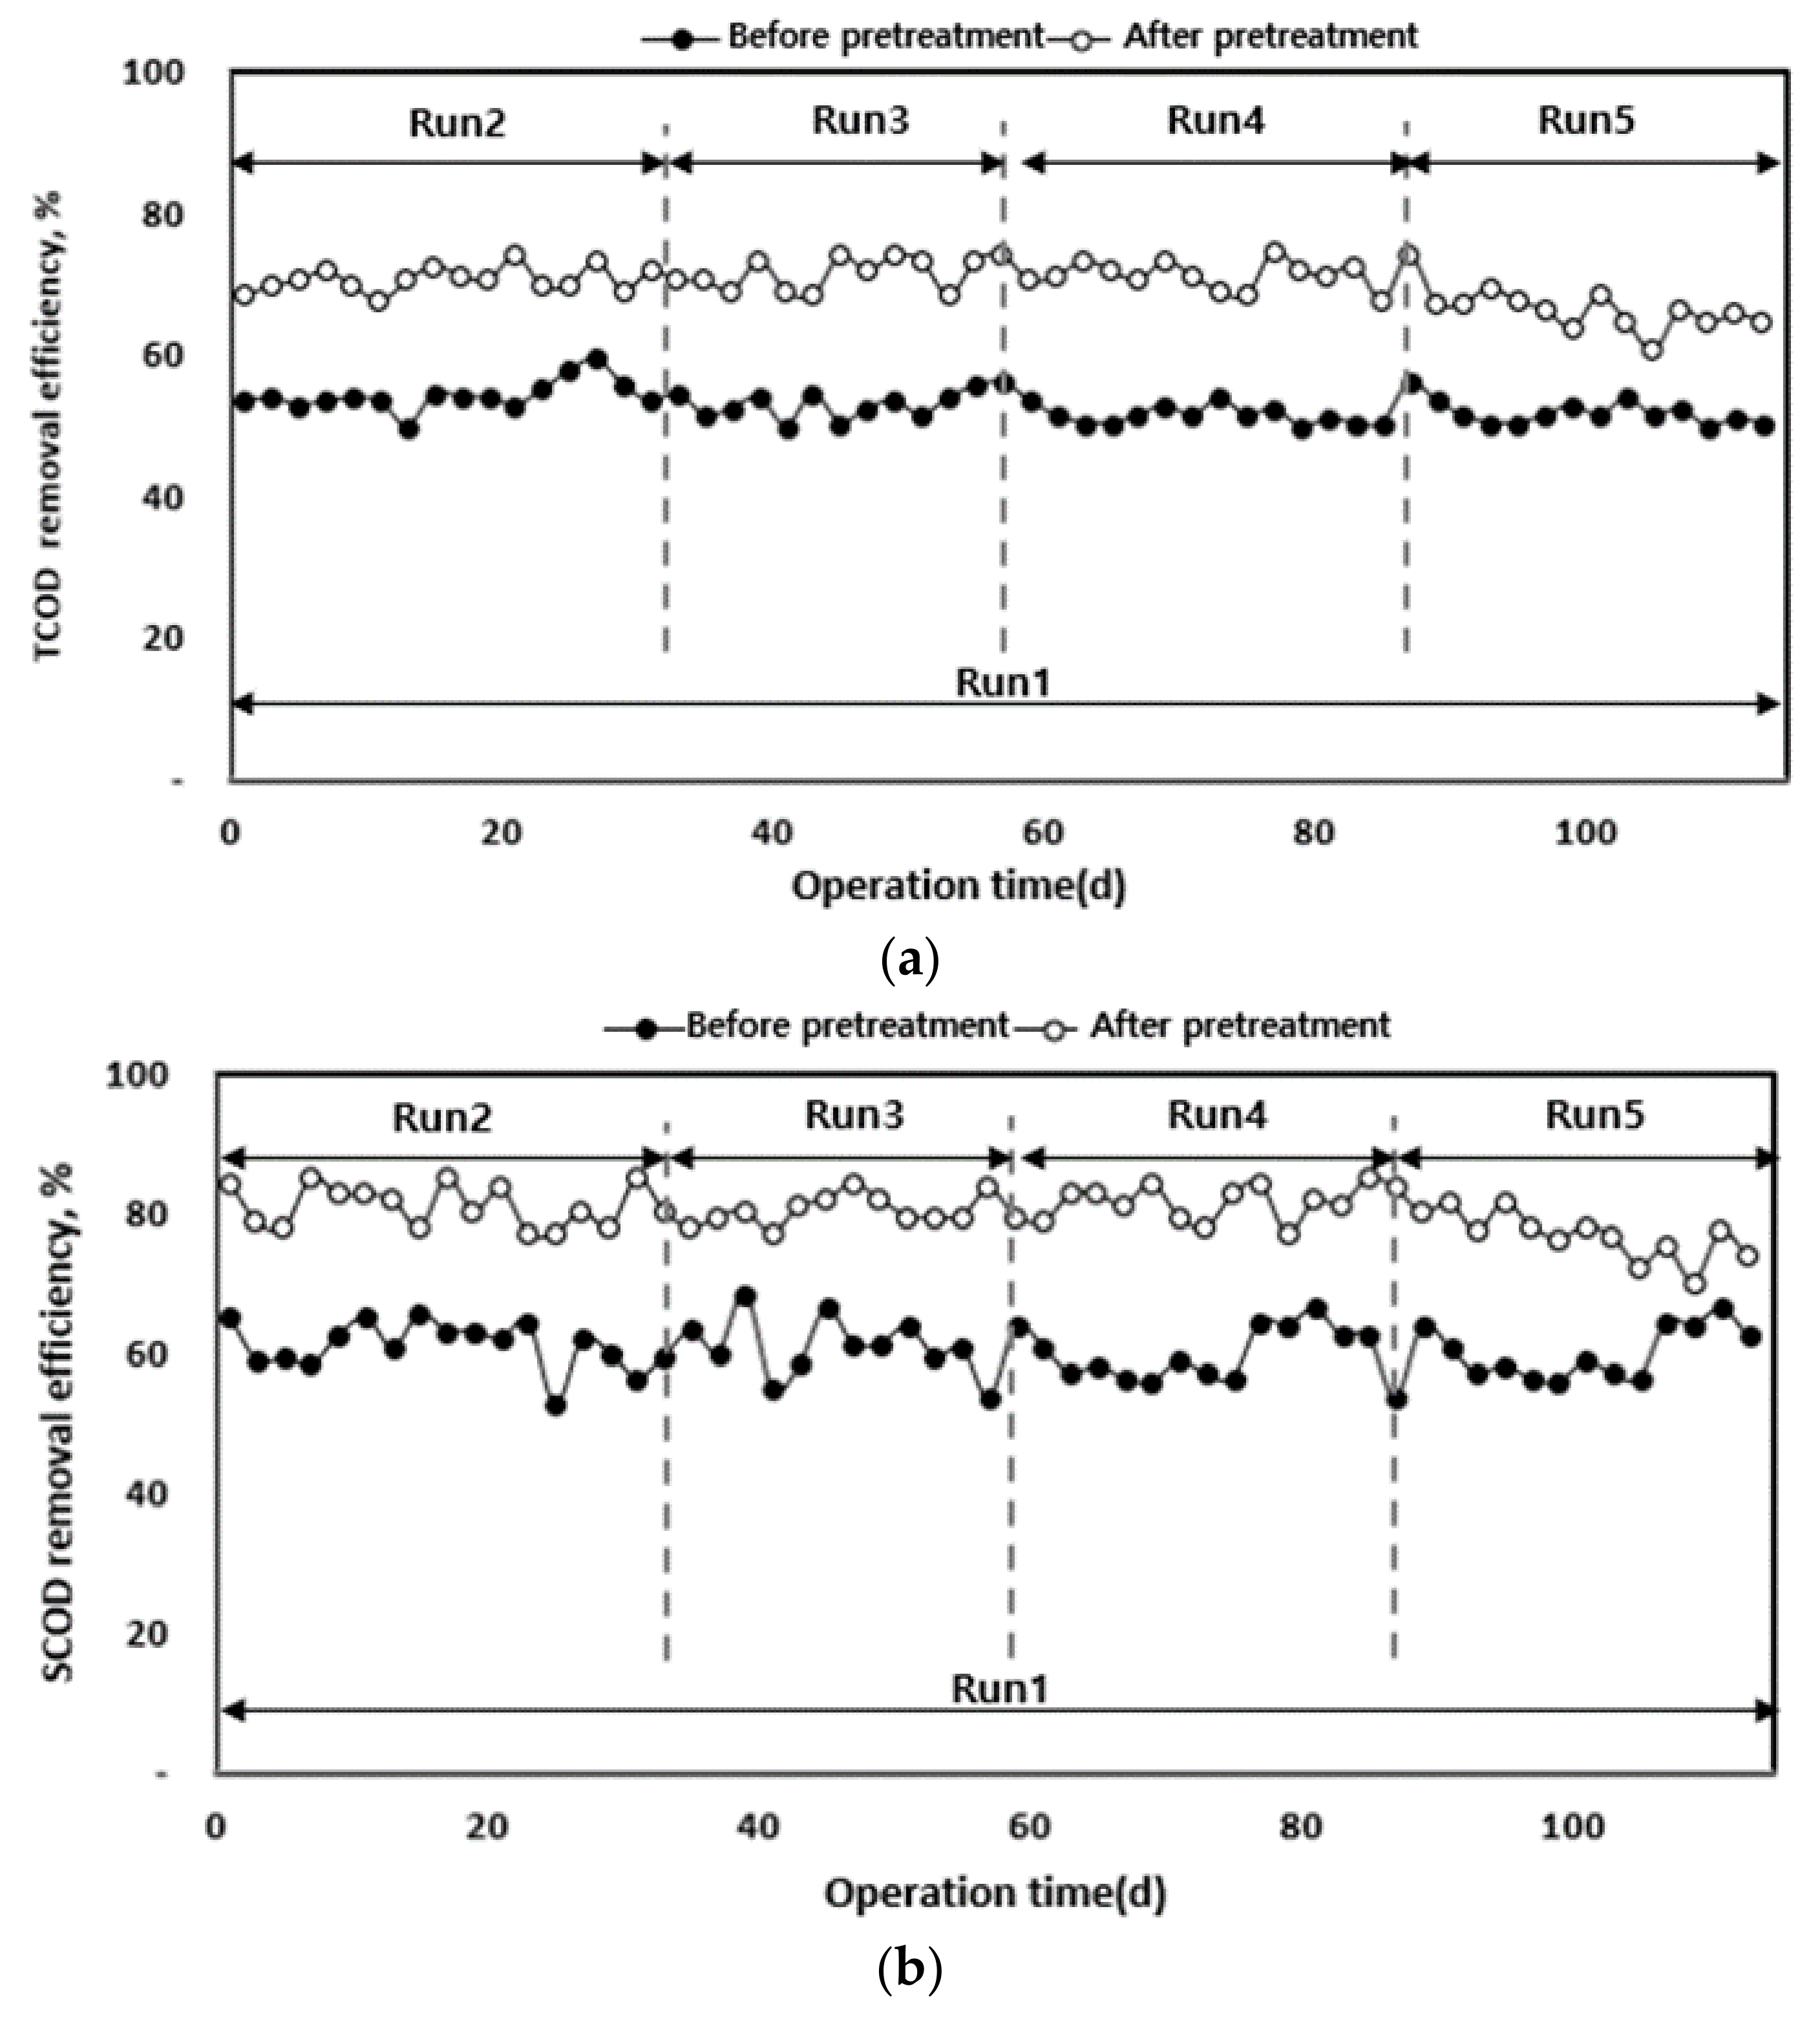
Figure 7.
Total volatile fatty acids’ (TVFAs) changes according to operation time.

Figure 8.
Change in methane production (a) and yield (b) according to operation time.


Table 1.
Biochemical methane potential (BMP) test: waste hydrated sludge characteristics.
| Description | Specification |
|---|---|
| Total chemical oxygen demand as chromium (TCODCr), g m−3 | 43,350 |
| Soluble chemical oxygen demand as chromium (SCODCr), g m−3 | 8600 |
| Total solid (TS), g m−3 | 119,753 |
| Volatile solid (VS), g m−3 | 99,489 |
| VS/TS ratio | 0.83 |
| Nitrogen, % | 6.24 |
| Carbon, % | 43.92 |
| Hydrogen, % | 6.48 |
| Sulphur, % | 0.64 |
| Oxygen, % | 12.99 |
| C/N ratio | 7.04 |
Table 2.
Waste hydrated sludge characteristics before and after thermal hydrolysis.
| Parameter | Before Solubilization | After Solubilization | ||
|---|---|---|---|---|
| Range | Average | Range | Average | |
| pH | 6.52–7.90 | 7.19 ± 0.36 | 5.65–6.63 | 6.08 ± 0.21 |
| Alkalinity, g m−3 as CaCO3 | 2203–4373 | 3455 ± 540 | 2044–3860 | 3124 ± 467 |
| TCODCr, g m−3 | 37,840–54,120 | 45,147 ± 2944 | 37,600–53,500 | 44,628 ± 3655 |
| SCODCr, g m−3 | 6700–13,500 | 9599 ± 1635 | 18,110–34,640 | 28,144 ± 1096 |
| NH4+-N, g m−3 | 948–1411 | 1174 ± 104 | 1120–1567 | 1395 ± 92 |
| TS, g m−3 | 38,130–52,950 | 44,199 ± 3926 | 37,240–49,460 | 42,278 ± 3243 |
| VS, g m−3 | 23,170–31,640 | 27,146 ± 2698 | 21,060–29,260 | 25,353 ± 2300 |
Table 3.
Operating conditions in the BMP test for optimal thermal hydrolysis.
| Parameter | Pressure (Bar) | Time (Min) | Temperature (°C) |
|---|---|---|---|
| R1 | 5 | 20 | 110 |
| R2 | 5 | 30 | 110 |
| R3 | 5 | 40 | 110 |
| R4 | 6 | 20 | 141 |
| R5 | 6 | 30 | 141 |
| R6 | 6 | 40 | 141 |
| R7 | 7 | 20 | 165 |
| R8 | 7 | 30 | 165 |
| R9 | 7 | 40 | 165 |
| R10 | 8 | 20 | 187 |
| R11 | 8 | 30 | 187 |
| R12 | 8 | 40 | 187 |
Table 4.
Lab-scale experiment features for a comparison before and after thermal hydrolysis.
| Parameter | Lab-Scale Reactor | |
|---|---|---|
| Reactor 1 | Reactor 2 | |
| Material | SUS 304 | |
| Size, mm | D280 × H410, 25 L | |
| Effective volume, L | 15 | |
| Stirring speed, rpm | 40 | |
| Substrate | - | Pre-treatment |
Table 5.
Operating conditions of lab-scale experiments. OLR: organic loading rate.
| Parameter | Lab-Scale Operating Conditions | ||||
|---|---|---|---|---|---|
| Run 1 | Run 2 | Run 3 | Run 4 | Run 5 | |
| Operation time | 113 d | 28 d | 27 d | 30 d | 28 d |
| Thermal solubilization conditions | 165 °C, 20 min | ||||
| Anaerobic digestive conditions | 55 °C | ||||
| Injection amount | 0.6 m3 d−1 | 0.6 m3 d−1 | 0.9 m3 d−1 | 1.2 m3 d−1 | 1.5 m3 d−1 |
| Thermal energy supply method | Boiler | Solubilized Heat Energy Recycling | |||
| OLR (COD-based) | 2.0 kg (m3 d)−1 | 2.0 kg (m3 d)−1 | 3.0 kg (m3 d)−1 | 4.0 kg (m3 d)−1 | 5.0 kg (m3 d)−1 |
Table 6.
Changes in inflow substrate characteristics according to thermal hydrolysis pre-treatment conditions.
Table 6.
Changes in inflow substrate characteristics according to thermal hydrolysis pre-treatment conditions.
| Parameter | pH | TCODCr (g m−3) | SCODCr (g m−3) | TS (g m−3) | VS (g m−3) | SCOD/TCOD (%) | VS/TS Ratio |
|---|---|---|---|---|---|---|---|
| Blank | 7.2 | 43,350 | 8600 | 119,753 | 99,489 | 19.8 | 0.83 |
| R1 | 7.4 | 45,300 | 11,283 | 117,358 | 98,494 | 24.9 | 0.84 |
| R2 | 7.3 | 45,579 | 12,443 | 116,185 | 99,479 | 27.3 | 0.86 |
| R3 | 7.4 | 44,740 | 13,272 | 115,023 | 100,474 | 29.7 | 0.87 |
| R4 | 7.5 | 45,047 | 15,777 | 113,872 | 98,465 | 35 | 0.87 |
| R5 | 7.4 | 47,001 | 18,456 | 117,641 | 99,449 | 39.3 | 0.85 |
| R6 | 7.5 | 42,640 | 18,241 | 119,144 | 96,485 | 42.8 | 0.81 |
| R7 | 7.5 | 46,260 | 26,673 | 116,912 | 96,467 | 57.7 | 0.83 |
| R8 | 7.6 | 46,007 | 27,457 | 123,379 | 98,369 | 59.7 | 0.80 |
| R9 | 7.6 | 41,787 | 25,607 | 114,736 | 96,447 | 61.3 | 0.84 |
| R10 | 7.6 | 45,321 | 28,345 | 120,152 | 100,228 | 62.5 | 0.83 |
| R11 | 7.7 | 48,858 | 30,686 | 123,368 | 98,390 | 62.8 | 0.80 |
| R12 | 7.6 | 44,498 | 28,527 | 119,068 | 99,326 | 64.1 | 0.83 |
Table 7.
Standard deviation of temperature and time during thermal hydrolysis.
| SCOD (g m−3) | 110 (°C) | 141 (°C) | 165 (°C) | 187 (°C) | Standard Deviation |
|---|---|---|---|---|---|
| 10 min | 11,283 | 15,777 | 26,673 | 28,345 | 7192.2 |
| 20 min | 12,443 | 18,456 | 27,457 | 30,686 | 7225.8 |
| 30 min | 13,272 | 18,241 | 25,607 | 28,527 | 6011.2 |
| Standard deviation | 815.7 | 1215.4 | 758.2 | 1063.3 | - |
Table 8.
Elemental composition of waste hydrated sludge according to different operating conditions.
Table 8.
Elemental composition of waste hydrated sludge according to different operating conditions.
| Parameter. | C (%) | H (%) | O (%) | N (%) | S (%) | CH4 Yield (m3 (kg VS)−1) |
|---|---|---|---|---|---|---|
| Blank | 43.9 | 6.5 | 23 | 6.2 | 0.6 | 0.594 |
| R1 | 43.6 | 6.1 | 22.6 | 6.4 | 0.5 | 0.584 |
| R2 | 42.7 | 6.2 | 23.1 | 6.3 | 0.6 | 0.579 |
| R3 | 44 | 6.2 | 22.4 | 6.3 | 0.6 | 0.593 |
| R4 | 43.2 | 6 | 22.4 | 6.5 | 0.4 | 0.580 |
| R5 | 44.5 | 6 | 22.6 | 6.3 | 0.5 | 0.587 |
| R6 | 44.5 | 6.6 | 23.2 | 6.1 | 0.4 | 0.599 |
| R7 | 43.8 | 6.6 | 23.2 | 6 | 0.6 | 0.598 |
| R8 | 44.4 | 6.5 | 22.8 | 6.3 | 0.5 | 0.598 |
| R9 | 42.7 | 6.7 | 22.4 | 6.5 | 0.7 | 0.584 |
| R10 | 43.2 | 6.7 | 22.8 | 6.3 | 0.6 | 0.598 |
| R11 | 44.7 | 6.8 | 22.6 | 6.4 | 0.4 | 0.609 |
| R12 | 42.8 | 6.9 | 23.8 | 6.6 | 0.5 | 0.586 |
Table 9.
BMP test results upon thermal hydrolysis.
| Parameter | Cumulative Methane Yield (m3 (kg VS)−1) | Theoretical Methane Yield (m3 (kg VS)−1) | Biodegradability (%) | Maximum Rate Operation Time (d) | K (d−1) |
|---|---|---|---|---|---|
| blank | 0.167 | 0.5941 | 28.1 | 20 | 0.0713 |
| R1 | 0.221 | 0.5847 | 37.8 | 19 | 0.0802 |
| R2 | 0.2497 | 0.579 | 43.1 | 18 | 0.0834 |
| R3 | 0.2574 | 0.5931 | 43.4 | 18 | 0.0857 |
| R4 | 0.2825 | 0.5809 | 48.6 | 17 | 0.0884 |
| R5 | 0.2983 | 0.5873 | 50.8 | 16 | 0.0897 |
| R6 | 0.3051 | 0.5998 | 50.9 | 16 | 0.0914 |
| R7 | 0.3679 | 0.5983 | 61.5 | 15 | 0.0978 |
| R8 | 0.3709 | 0.5984 | 62 | 15 | 0.0979 |
| R9 | 0.363 | 0.5843 | 62.1 | 15 | 0.0983 |
| R10 | 0.3715 | 0.5988 | 62 | 15 | 0.0984 |
| R11 | 0.3776 | 0.6087 | 62 | 15 | 0.0986 |
| R12 | 0.3784 | 0.5863 | 64.5 | 15 | 0.0987 |
© 2019 by the authors. Licensee MDPI, Basel, Switzerland. This article is an open access article distributed under the terms and conditions of the Creative Commons Attribution (CC BY) license (http://creativecommons.org/licenses/by/4.0/).
Share and Cite
MDPI and ACS Style
Hong, E.-H.; Park, J.-G.; Lee, B.; Shi, W.-Q.; Jun, H.-B. Improvement of Waste Dehydrated Sludge for Anaerobic Digestion through High-Temperature and High-Pressure Solubilization. Energies 2020, 13, 88. https://doi.org/10.3390/en13010088
AMA Style
Hong E-H, Park J-G, Lee B, Shi W-Q, Jun H-B. Improvement of Waste Dehydrated Sludge for Anaerobic Digestion through High-Temperature and High-Pressure Solubilization. Energies. 2020; 13(1):88. https://doi.org/10.3390/en13010088
Chicago/Turabian StyleHong, Eui-Hwan, Jun-Gyu Park, Beom Lee, Wei-Qi Shi, and Hang-Bae Jun. 2020. "Improvement of Waste Dehydrated Sludge for Anaerobic Digestion through High-Temperature and High-Pressure Solubilization" Energies 13, no. 1: 88. https://doi.org/10.3390/en13010088
Note that from the first issue of 2016, this journal uses article numbers instead of page numbers. See further details here.