Long-Term Wet Bioenergy Resources in Switzerland: Drivers and Projections until 2050


1
Swiss Forest, Landscape and Snow Federal Research Institute WSL, Zürcherstrasse 111, CH-8903 Birmensdorf, Switzerland
2
Swiss Federal Institute of Technology Zürich (ETH Zürich), Institute of Environmental Engineering, John-von-Neumann-Weg 9, CH-8093 Zürich, Switzerland
*
Author to whom correspondence should be addressed.
Energies 2019, 12(18), 3585; https://doi.org/10.3390/en12183585
Submission received: 8 July 2019
/
Revised: 2 September 2019
/
Accepted: 15 September 2019
/
Published: 19 September 2019
(This article belongs to the Special Issue Biomass for Energy Country Specific Show Case Studies 2019)
Abstract
:In the energy sector, decisions and technology implementations often necessitate a mid- to long-term perspective. Thus, reliable assessments of future resource availability are needed to support the decision-making process. In Switzerland, similarly to other countries, only a limited part of the available wet biomass feedstock is currently used for anaerobic digestion. Understanding potential future trajectories of the available biomass amount is therefore essential to facilitate its deployment for energetic use and to establish adequate bioenergy strategies. Here, we utilized extensive government data, historical trends, and data from academic literature to identify relevant drivers and their trends. Starting with current biomass potential, the future availability and variation of resources was estimated by taking into account selected drivers and their projected future development. Our results indicated an increase of over 6% in available wet bioenergy resources by 2050 (from 43.4 petajoules (PJ) of primary energy currently to 44.3 PJ in 2035 and 45.4 PJ in 2050), where a Monte Carlo analysis showed that this projection is linked to high uncertainty. Manure remains by far the biomass with the largest additional potential. Possible consequences regarding the country’s pool of biogas facilities and their development are discussed.
1. Introduction
Transforming the current energy system to achieve a sustainable energy transition is crucial for mitigating climate change [1]. In this context, bioenergy is the most versatile form of renewable energy. It can be used to generate electricity, supply heat, and provide liquid fuel for transport [2]. Moreover, the efficient use of locally available biomass resources can strengthen regional and national added values [3]. These characteristics posit bioenergy as an important energy source in energy transition.
Switzerland has set itself ambitious targets for optimizing both the material and energy use of domestic biomass resources [4,5]. Similar targets have been set at the European level [6]. Previous studies have assessed current national biomass potential [7,8,9]. Having good estimates of the future availability of biomass enables stakeholders to better plan the infrastructure needed to use biomass for energy [10].
The complexity of long-term energy planning originates in numerous uncertainties and incomplete knowledge [11,12]. Scenarios portray plausible future realities. They are widely used for considering uncertainty and describing a range of possible developments [12,13,14,15]. Understanding available energy resources forms the core of strategic decision-making and allows for quantitative, long-term energy planning.
Regarding bioenergy, several studies have indicated that the use of biomass [16,17,18] and the production of biogas worldwide will largely increase by 2050 [14]. Strategies to foster bioenergy projects have been adopted at many levels [11,12,13,14,15]. The infrastructure to produce biogas nowadays in Switzerland, however, is very limited. Around 400 biogas facilities—about 100 agricultural, 30 industrial, and 270 from wastewater treatment plants [19]—are processing only one-third of available fermentable biomass [9]. In contrast to other types of renewable energies, costs are not expected to decrease significantly [20] and are a major obstacle to biogas development.
This paper focuses on the availability of domestic wet biomass feedstock for energy in the mid- (2035) to long term (2050). In Switzerland, these two years have particular relevance, as the Federal Council has developed targets for these two time horizons in its Energy Strategy 2050 [21]. Current biomass potential has already been determined [9,22]. This study aims to explore the drivers of biomass availability and indicate possible future developments and uncertainties.
To reach this aim, we determined the decisive explanatory variables (drivers) for each biomass type [23] and quantified the correlations between them. We then assessed their respective trends in 2035 and 2050 based on an analysis of past data and consolidation through literature research. We then used a Monte Carlo approach to estimate biomass potential and uncertainties.
2. Methodology
2.1. Overview
In a previous study, we determined the current potential of biomass for energy [9]. The focus of this paper lies in the future availability of wet biomass. We divided wet biomass into six types based on two main categories: agricultural residues (including animal manure and agricultural crop byproducts) and anthropogenic wastes (including the organic fraction of household garbage, green waste from household and landscape maintenance, commercial and industrial organic waste, and sewage sludge). This classification allowed for a better comparison to our previous study [9]. Scenarios of the future availability of dry biomass (wood), which was also part of our previous study [9], are described elsewhere [24]. Since wet (nonwoody) biomass is mostly treated through anaerobic digestion to produce biogas, and dry (woody) biomass is either used for material production or thermally treated, the value chains are clearly separated, and treatment facility units can accordingly be planned separately.
In accordance with previous studies [7,9], we distinguished different levels of biomass availability: (i) the theoretical potential, which refers to the maximum amount of biomass that could theoretically be collected, and (ii) the sustainable potential, which refers to the biomass actually available for energy after deducting losses due to environmental, technical, economic, and social restrictions. Therefore, the sustainable potential represents the part of the resources that can sustainably be mobilized for energy (not, for example, manure dropped by cattle during grazing that is not collected) [9].
2.2. Procedure
We used a mechanistic approach, trying to understand this complex system by examining the workings of its individual parts and how they are coupled. Biomass resource amounts for 2035 and 2050 were estimated following the procedure outlined below. The current biomass availabilities needed to be estimated as well, because they have not been assessed through surveys or measurements elsewhere:
- Then, we tried to understand the broader context of generating biomass. We searched for further possible explanatory variables that could influence biomass development using international literature and expert knowledge. Furthermore, available national databases (time series) from the Swiss Federal Offices of Statistics, Energy, the Environment, and Agriculture were searched for information that could be linked to any of the six biomass types;
- We analyzed possible pairwise correlations between variables using time series (up to 20 years) from the databases and tested them using Pearson’s coefficient. In total, we tested pairwise correlations between 49 potential explanatory variables. The number of tested variables varied depending on the biomass type. Some drivers could not be tested due to a lack of historical time series data but were chosen based on evidence in the literature (e.g., amount and characteristics of the produced manure per animal or technological change). The resulting correlations were included in the uncertainty analysis when appropriate to perform correlated sampling in the Monte Carlo simulation (see below). For five variables (number of animals, agricultural area, number of inhabitants, GDP, and industrial production), enough historical data were available to forecast their trends and uncertainties into the future. For the other drivers, projections were based on literature data or expert knowledge;
- We chose the relevant explanatory variables (drivers) from among the previously described variables. Whenever possible, an overlap in information was avoided. For instance, meat production and animal numbers are correlated, so it was sufficient to consider only one of the two parameters. In this case, animal number was chosen because it is more directly linked to manure production. The drivers may vary according to the biomass, but some (such as population growth) influence several types of anthropogenic wastes. Table 1 presents the 16 key drivers selected for our projections. These key drivers are described in Section 2.3 for each biomass type and are summarized in Figure 1 and Figure 2. More details regarding all of the possible explanatory variables considered and their correlations, as well as the collected base time data series, can be found in the appended Supplementary Materials (S) in Section S1;
- In the next step, we estimated each driver trend and uncertainty, which were quantified as the standard deviation (SD), for 2035 and 2050. Moreover, we analyzed the available time series (five of the identified variables) to quantify their evolution until 2035 and 2050. To do so, we tested different autoregressive integrated moving average models (ARIMAs) for these five variables. ARIMA is a forecasting technique that projects the future values of a time series based on its own inertia and has been used in the biomass context before [25]. In this model, the “autoregressive” (AR) component shows a dependent relationship between an observation and a number of lagged observations; “integrated” (I) enables differentiation between raw observations (e.g., by subtracting an observation from an observation at the previous time step) to make the time series stationary; and “moving average” (MA) allows for the observation of the dependency between an observation and a residual error from a moving average model applied to lagged observations. Each of these components is explicitly given as a parameter, noted as ARIMA(p,d,q). Considering the residuals from the autocorrelation function (ACF) and the partial autocorrelation function (PACF), the most appropriate model was chosen. This enabled us to extrapolate the data into the future to obtain a forecast and its SD. We used the R-Package “Forecast”. More details about the time-series analysis can be found in the Supplementary Materials (Section S2).
Finally, we used these drivers, their trends, and uncertainties (always indicated as SD unless stated otherwise) to conduct the Monte Carlo simulation, which provided the amount of each of the six biomass types for 2035 and 2050. Base-year values (calculated biomass amount in petajoules (PJ) in 2014 [9]) were used as a starting point, with an SD of 1.5% to reflect uncertainty. The simulation demands a percentage of change for each factor affecting the biomass to calculate the new value as well as a variance–covariance matrix (with variance on the diagonal and covariance whenever the factors are correlated) to calculate the uncertainty. Each factor value was estimated according to historical data, projections found in the literature, or our own estimations (point 5). When “current value” is stated, the trend is expected to be 0, and only the SDs for 2035 and 2050 are given. Starting with the value in PJ for each biomass, we applied each factor influencing this particular biomass to estimate the value in PJ in 2035 and 2050. The simulation was performed per time horizon and biomass type for 1000 runs using the software R [26]. The standard models assumed a normal distribution. This distribution typically approaches common patterns in nature, such as yield or size, which arise from the summing up of many small-scale processes [27]. This distribution seemed appropriate here, as we modeled mostly natural phenomena with symmetric uncertainties relative to the mean. Both the theoretical and sustainable potentials were calculated in the same simulation, and thus the sustainable potential also took the theoretical potential uncertainties into account. The pairwise correlations between drivers were considered whenever possible in the covariance matrix. These factors and the equation are provided for each biomass type (see below). The results for future trajectories of biomass amounts indicated expected values (mean and median) and an estimated spread (95% confidence interval, as well as minimum and maximum). The covariance matrices and an example R-script are provided in the Supplementary Materials.
2.3. Biomass Types
2.3.1. Animal Manure
Animal manure refers to all excretions (both liquid and solid forms) from livestock farming. Farm animal excrements (including urine) form the basic components of this biomass category. Depending on the stable system, they are produced without any additional material (except eventually water) as liquid manure or they are mixed with bedding material as solid manure.
The future availability of manure and cereal residues are the most important future contributions of biomass to energy in agriculture [28]. After a decline at the end of the 1990s, the number of agricultural biogas plants in Switzerland has been increasing since 2004, when new subsidies made building anaerobic digesters more profitable. On the one hand, there is currently a great demand throughout Switzerland for the production of renewable energy from biomass. On the other hand, limiting factors are, above all (despite financial assistance), the large investment expenditure and limited economic efficiency. The uncertainty of the future of the subsidies themselves [29], similarly to the effects of changes and cuts to support measures in Germany and Italy [30], makes any investment even riskier.
Theoretic Potential
The theoretic potential includes all animal manure produced in Switzerland’s livestock farming sector in one year [9,22,31]. Decisive drivers and their trends are the following:
- The total animal number in livestock units (total animal number in LSUs 1996–2017 [32]). According to our analyses of past data, we expected an overall light increase in Switzerland’s total LSU (1%, SD ±5% by 2035; 1%, SD ±7% by 2050, see evolution in the Supplementary Materials);
- The amount of manure produced per LSU (current value, no time series [33]). We assumed a stable value [33] with uncertainty increasing with time (SD ±1.5% by 2035 and ±3% by 2050) due to changed practices and adaptation to changing conditions (e.g., regulations, climate change, consumers preferences);
Thus, the formula would be
where ManureT2035,2050: manure theoretical potential in 2035/2050 in PJ; ManureT2014: manure theoretical potential in 2014 in PJ [9]; LSU2035,2050: change in LSUs by 2035/2050; Qty2035,2050: change in the amount of manure produced per LSU in 2035/2050; Comp2035,2050: change in the energetic content of the manure in 2035/2050; i: iteration in the Monte Carlo analysis.
Sustainable Potential
The sustainable potential only includes farmyard manure collected centrally by the farmer. The excrements of the animals that occur during grazing and remain on the meadow are deducted from the theoretical potential, as they are not available for energetic use. Decisive influencing variables are the following:
- The proportion of animals with access to pasture, combined with the number of grazing days per year and number of grazing hours per day (years 2002, 2007, and 2010 [34]). Due to the promotion of animal-friendly housing systems and stricter requirements of animal protection legislation, the proportion of animals with access to pasture as well as the grazing period has increased in recent years for all animal categories [34,35]. As manure produced during grazing will not be collected and used for biogas production, we assumed a decrease of 3% (±3.5%) by 2035 and 7% (±7.5%) by 2050 linked to a decreased in stable time;
- Changed basic conditions for biogas facilities (available technology such as mini-biogas, legal constraints, and subsidies) can impact the amount of mobilizable manure for energetic use [9]. A minimum quantity of biomethane yield was assumed to be a prerequisite for the successful operation of a biogas plant according to the current state of technology. The basis for the study was the theoretical potential minus losses due to grazing. The lower limit assumed was 790 GJ biomethane yield (or approximately 10 kilowatt electric (kWel)) for a single operation or 3160 GJ (40 kWel) at a distance of 1 km for a joint operation [9,36]. Many new technologies are being developed [37], but at the moment, only optimizations of the processes and costs are expected [18]. These developments were assessed more specifically for Switzerland, where increased efficiency of the technology is expected for secondary energy sources [38]. For the minimum limit, other aspects that are based on purely technological innovations also play a role, such as economic or legal boundary conditions (bans, incentives, CO2 emissions, etc.). Hence, no significant trend was assumed with regard to the applicable technology (current values with an uncertainty ±5% by 2035 and ±10% by 2050).
Thus, the formula would be
where ManureS: manure sustainable potential (in 2014 or 2035/2050) in PJ; StableT2035,2050: change in stable time by 2035/2050; Mobil2035,2050: change in the amount of manure mobilizable for an energetic use in 2035/2050.
2.3.2. Agricultural Crop Byproducts
This category comprises the residues that are left on the fields after the main crop harvest, as well as the intermediate crops sown to cover the soil between the main crop. Only byproducts occurring after harvesting of a major crop under current practices were considered, for example, chaff and residues from field vegetables. Nowadays, these are mostly left in the field and are incorporated into the soil. Note that hay (pastures, meadows) and cereal straw, which are currently mainly used for animal feed or as bedding, were not included [9].
Theoretic Potential
The theoretic potential includes all byproducts from agricultural crop production that, in addition to the harvest of the main product, are produced in Switzerland in one year, including integrated intermediate crops [9,22]. The decisive influencing variables are the following:
- The agricultural area (without summer pasture). Over the last 15 years, the total agricultural area decreased by 2% [32]. Extrapolating from the data of recent years [32], a further reduction of about 2% (±2%) in total agricultural land was expected by 2035 (4% ± 4% by 2050). In the case of intermediate crops, no significant change was expected;
- The quantity of arising byproducts per area (linked to the main crop yield). Crop yield (main and byproduct) is estimated to increase throughout the world (from 16.8 GJ per hectare in 2010 to 21.5 GJ in 2050 [14]) due to general agricultural progress [39]. Similarly, in Switzerland, the area planted with cereals has fallen by 22% over the last 30 years, while the harvest has decreased by only 13% [40,41]. Data on crop yields are readily available, while data on the residue-to-yield ratio are very limited. Since there is a large annual variation in crop production, the amount of agricultural crop residues varies significantly [42]. The data found in the literature on the residue-to-yield ratios do not show a clear trend for the future [42,43]. Hence, in this paper, we assumed a constant ratio between crop yield and byproducts, in spite of the variability of this parameter [42,43]. The quantity of arising byproducts per area was thus assumed to increase by a further 3% (±1.5%) by 2035 and 5% (±2.5%) by 2050;
- The energetic content of the byproducts (current value, no time series [33], with an SD of ±1.5% by 2035 and ±2.5% by 2050).
Thus, the formula would be
where AgriT2035,2050: agricultural theoretical potential in 2035/2050 in PJ; AgriT2014: agricultural theoretical potential in 2014 in PJ (previous study); Area2035,2050: change in total area by 2035/2050; Qty2035,2050: change in the amount of residues produced per hectare in 2035/2050; Comp2035,2050: change in the energetic content of the residues in 2035/2050; i: iteration in the Monte Carlo analysis.
Sustainable Potential
Due to current harvesting technology, competing uses, logistics, and costs, agricultural byproducts are barely used for energy purposes. Today, the majority of agricultural crop residue remains on the field and is plowed directly into the soil. The decisive driving variables here change basic conditions for collecting the byproducts (available technology). Indeed, new machines are needed to make the collection of crop residues efficient and cost-effective, as the traditional harvester only removes the main crop itself. Under current conditions, it was estimated that about 18% of the overall byproducts could be used for energy purposes [9]. Regarding resource mobilization, no significant trend was assumed with regard to the applicable technology [44] (current values with an uncertainty ±5% by 2035 and ±10% by 2050):
where AgriS: agricultural sustainable potential (in 2014 or 2035/2050) in PJ; Mobil2035,2050: change in the amount of manure mobilizable for an energetic use in 2035/2050.
2.3.3. Organic Fraction of Household Garbage
Theoretic Potential
Household garbage comprises all municipal waste from households that is not separately collected or further used as material. The characteristics of Swiss household garbage were analyzed through garbage bags from 33 municipalities [45]. Note that the organic fraction of household garbage is not only composed of wet biomass (two-thirds) but also includes other organic sources such as paper, cardboard, and leather. The wet organic portion investigated here included all materials of plant, animal, or microbial origin (e.g., food leftovers, vegetable peels, flowers). This fraction would be best collected separately and digested with green waste, whereas paper-like material and nonorganic products, for example, should be recycled or burned. Although household garbage and green waste are closely linked, they are collected and treated separately, and thus it was more adequate to keep their quantification separated.
The theoretic potential includes the total wet organic portion of household garbage currently occurring in Switzerland in one year. Due to its high standard of living, Switzerland has one of the highest waste generation levels in the world (716 kg of total waste per person per year, 200 kg above the Organisation for Economic Co-operation and Development (OECD) average [46]). The peak of waste production is expected in OECD countries in 2050, but it is only expected globally in the coming century [47]. The decisive explanatory variables are the following:
- Waste mitigation policies and strategies (overall reduction, improved separation). The government is taking preventive measures to reduce waste generation using a combination of regulation [50], political and economic instruments [51], and voluntary agreements [52]. Hence, despite an increased private consumption of over +26% in the last 20 years, the overall waste amount per inhabitant has only increased by 15% [46]. Moreover, on account of the ever-increasing rates of separately collected material (+10% in the last 20 years), the amount of mixed municipal waste (which has to be incinerated) could be stabilized [46]. Further waste mitigation measures are still expected in the future [51] and were accounted for (−25% (±5%) by 2035, −50% (±10%) by 2050, with relatively high uncertainty). This decrease is largely linked to improved separate collection [45] and overall societal measures to reduce waste generation [50,51,52].
Thus, the formula would be
where GarbageT2035,2050: household garbage theoretical potential in 2035/2050 in PJ; GarbageT2014: household garbage theoretical potential in 2014 in PJ (previous study); Cons2035,2050: change in total private consumption by 2035/2050; Qty2035,2050: change in the quantity of waste produced per capita in 2035/2050; i: iteration in the Monte Carlo analysis.
Sustainable Potential
The sustainable potential includes the total proportion of wet organic waste in household garbage that cannot practically be composted or fermented to close the nutrient cycles. Today, garden and kitchen waste account for about 30% of household garbage, of which about 80% could be collected separately together with green waste [45,53,54]. We assumed that this amount will be collected and recycled with green waste from households and landscape by 2050 (−80% (±10%)) and that by 2035, about half of this goal would be achieved (−40% (±5%)). Thus, by 2050, the theoretical potential will be equal to the sustainable potential. This is not an absolute reduction in the quantity of overall biomass, but a shift from the biomass type “household garbage” to the separately collected “green waste from households and landscape” (see Section 2.3.4.).
Thus, the formula would be
where GarbageS: household garbage sustainable potential (in 2014 or 2035/2050) in PJ; Collect2035,2050: change in the quantity of biowaste separately collected in 2035/2050.
2.3.4. Green Waste from Households and Landscape
This category refers to all nonligneous waste collected separately by local authorities from households and during landscape maintenance. Currently, separately collected green waste in Switzerland is either treated by composting or anaerobic digestion. Similarly to household garbage, the quantity of green waste from households and landscape could be estimated for each Swiss municipality [9].
Theoretic Potential
The theoretic potential includes all green waste from households and landscape maintenance separately collected in Switzerland in one year [9]. The amount of green waste collected separately has continuously increased over the past 20 years (+63%) [55], partly due to the improved collection system. The decisive explanatory variables are the following:
- Total private consumption (see Section 2.3.3, “Organic Fraction of Household Garbage”);
- Green waste mitigation measures (e.g., food waste strategies). Around 15% of household waste is estimated to be still edible food waste [56]. Due to the government’s efforts to reduce avoidable food waste [51,57], a trend of −10% by 2050 (±5%) was accounted for. This considered that part of green waste comes from landscape maintenance, which is not impacted by food waste;
- Area/management of green space. No clear trend could be identified in the area or management of green space (current conditions with an uncertainty ±1% by 2035 and ±2.5% by 2050).
Thus, the formula would be
where GreenwasteT2035,2050: green waste theoretical potential in 2035/2050 in PJ; GreenwasteT2014: green waste theoretical potential in 2014 in PJ (previous study); Cons2035,2050: change in total private consumption by 2035/2050; Qty2035,2050: change in the quantity of waste produced per capita in 2035/2050; Space2035,2050: change in the area or management of green spaces in 2035/2050; i: iteration in the Monte Carlo analysis.
Sustainable Potential
In addition to the already separately collected green waste (which is the theoretical potential), we added the quantity of organic waste, which currently ends up in the household garbage but which could be collected separately and either be digested or composted to close the nutrient cycles (Federal Waste Regulation, Art. 13 [50]). The reduction linked to food waste is particularly important. This quantity is, therefore, a resource shift from the mixed biomass type “household garbage” to separately collected green waste (see Section 2.3.3). For structural reasons (isolated areas, societal preferences) and economic reasons (collection costs), we assumed that a small proportion of about 10% is best composted in a decentralized way in private gardens [9,58]. We did not expect any major changes in this proportion (current conditions with an uncertainty ±2.5% by 2035 and ±5% by 2050):
where GreenwasteS: green waste sustainable potential (in 2014 or 2035/2050) in PJ; Compost2035,2050: quantity to be composted locally in 2035/2050.
2.3.5. Commercial and Industrial Organic Waste
This category refers to all organic, nonwoody commercial and industrial wastes. Six main industrial and commercial sectors were identified that produce a significant quantity of organic waste in Switzerland: catering, retailers, and paper manufacturing (industry sludge); and the tobacco, food processing, and phyto-pharma industries. The resulting theoretic potential of commercial and industrial organic waste was calculated for 2035 and 2050 as the sum of these six sectors.
Theoretic Potential
The theoretic potential includes all produced organic waste from industry, retailers, and restoration [9].
The decisive explanatory variables are the following:
- Industrial production is the total production account for all branches at current prices (in millions of Swiss francs), and it considers production, turnover, sales volumes, and stock inventory statistics from the secondary sector without the construction industry [59]. It applies to all sectors. We extrapolated the values from the past 20 years, and we expected industrial production to continue growing (+37% (±12%) by 2035, +49% (±16%) by 2050) [60];
- Industry relocation, for example to lower-cost countries, in all processing industries. We assumed a −2% (±1%) reduction by 2035 and −5% (±2.5%) by 2050 (own estimates);
- Technical and organizational changes in all processing industries (food, tobacco, paper production (sludge), phyto-pharmacy). Here, we assumed that slightly less waste will occur per produced unit through optimized processes (−5% (±2.5%) by 2035 and −10% (±5%) by 2050) (based on our own estimates).
Thus, the formula would be
where IndustryT2035,2050: industrial theoretical potential in 2035/2050 in PJ; IndustryT2014: industrial theoretical potential in 2014 in PJ (previous study); Reloc2035,2050: relocation of industries in 2035/2050; Prod2035,2050: change in total Swiss production in 2035/2050; i: iteration in the Monte Carlo analysis.
Sustainable Potential
The sustainable potential is much lower than the theoretical potential, as a large quantity of industrial waste is better recycled, and thus used nonenergetically, whenever possible (e.g., feeding animals food processing waste). The most decisive driver influencing the development of sustainable potential is associated with the management of generated food waste (e.g., retailers’ food waste donations). Switzerland will strive for a 50% decrease in edible food waste by 2030 [57]. Due to the government’s efforts to reduce avoidable wastes [51], a trend of −50% by 2050 (±20%) was therefore accounted for, which is similar to the Sustainable Development Goals (Agenda 2030 from the United Nation Organization) [61] (−50% in 2030). Thus, the formula would be
where IndustryS: industrial sustainable potential (in 2014 or 2035/2050) in PJ; Foodwaste2035,2050: social and legal changes impacting food waste in 2035/2050; Collect2035,2050: percent of biomass that can be collected in 2035/2050.
2.3.6. Sewage Sludge
Sewage sludge generally describes all organic matter derived from central water treatment. Here, we examine the potential of fresh sludge, which refers to untreated sewage sludge, in more detail. Subsequently, organic substances from the fresh sludge that decompose rapidly can be degraded under controlled conditions. Anaerobic digestion is a proven and common process for stabilizing fresh sludge and converting it into digested sludge while producing biogas [9].
Theoretic Potential
The theoretic potential includes all the fresh sludge currently produced in Switzerland’s central wastewater treatment plants in one year. The wastewater load is usually expressed in population equivalents. This value corresponds to the quantity of pollutants of a “typical inhabitant” that is directed to the wastewater treatment plant, including households and small businesses. In 2010, 10.5 million population equivalents were cleaned throughout Switzerland [62]. Around 70% came from domestic wastewater and 30% from industrial wastewater. The key drivers are the following:
- The number of inhabitants of Switzerland [28]. Switzerland’s population has more than doubled since 1900 [63], from 3.3 million to 8.4 million today. Since 2007, the average population growth has been just over 1% and is expected to continue growing. Based on past data, we calculated a strong increase in the years to come (+18% (±3.5%) by 2035, +22% (±6.5%) by 2050), similar to the expectations of the government [64]. The organic load in domestic wastewater comes mainly from sanitary facilities, bathing, laundering, and cooking activities. Thus, population development is expected to have a direct impact on the produced sewage sludge amount;
- Wastewater technology (which could impact the produced sewage sludge). New technologies could reduce the load at the central treatment plant (e.g., urine separation), and current installations could be extended (e.g., integrative consideration of network and purification) [65]. However, the wastewater infrastructure in Switzerland is already built, and fundamental changes are not expected. The main focus at the moment is the elimination of micropollutants and phosphorus recycling from sewage sludge [62,66]. Hence, it was assumed that the sewage sludge load per population equivalent will remain similar in the future (the same value as today, with an SD of ±1% by 2035 and ±2.5% by 2050).
Thus, the formula would be
where SewageT2035,2050: sewage sludge theoretical potential in 2035/2050 in PJ; SewageT2014: sewage sludge theoretical potential in 2014 in PJ (previous study); Pop2035,2050: change in number of inhabitants by 2035/2050; Load2035,2050: change in the energetic content of the sewage sludge in 2035/2050; i: iteration in the Monte Carlo analysis.
Sustainable Potential
As sewage sludge in Switzerland must be treated thermally in suitable plants (Federal Waste Regulation, Art. 10 and 12 [50]), all sewage sludge produced is used for energy purposes. At the resource level, the theoretical potential is equal to the sustainable potential.
3. Results
3.1. Future Theoretical and Sustainable Potential
As shown in Figure 3, agricultural residues remained fairly stable, whereas anthropogenic wastes increased at first (due mostly to population and consumption growth) and then stabilized or slightly decreased in 2050 (mostly due to improved waste management practices)—apart from green waste, which kept increasing until 2050. Uncertainty, however, increased for all types of waste over the years, especially for the sustainable potentials (see also table in the Supplementary Materials, Section S3). The results of the respective biomass types are described in the following sections (Section 3.1.1, Section 3.1.2, Section 3.1.3, Section 3.1.4, Section 3.1.5 and Section 3.1.6). Figure 4 shows the cumulative expected development of the total wet biomass potentials for 2035 and 2050. Animal manure remained by far the biomass with the largest additional potential, representing about half of the total wet bioenergy potential.
3.1.1. Animal Manure
By 2050, the theoretical amount of manure is expected to be similar to the current values (49.4 PJ, or 1% more than today). Indeed, overall animal number, amount of produced manure per animal, and energetic characteristics of the produced manure are not expected to change significantly, although a decrease in meat consumption has been observed [67]. With regard to the sustainable potential, a slight decrease of less than 1 PJ is expected (reaching 25 PJ in 2050) due to higher amounts of time spent in pastures, where manure cannot be collected. Farmyard manure has only been used as an energy source to a very limited extent in Switzerland to date [68].
Extrapolating from the current trend, we expect fewer but larger farms in Switzerland (e.g., 40,000 livestock farms in 2035 and 33,000 in 2050). Their spatial distribution should not show any significant development. They will remain mostly located in the central lowlands, like today, where only a few small farms exist in the mountainous regions.
3.1.2. Agricultural Crop Byproducts
With regard to the amount of agricultural crop byproducts, no significant developments are expected (from 2.6 PJ available today to 2.7 PJ by 2050), although local changes are possible due to changed crops. Other important influences are the weather or harvesting techniques. These are associated with great uncertainty.
Until now, agricultural byproducts from crop production in Switzerland have only been used as an energy source to a very limited extent. They are mostly fermented as a cosubstrate together with animal manure, so their future energetic use will be shaped by the overall development of the use of animal manure.
Changes in agricultural policy and the market economy in recent decades have led to a structural change in agriculture, leading to a slow reduction in the number of farms and an increase in the average area of farms. This trend is likely to continue in the future [69], with further homogenization of the open cultural landscape [70]. This could allow for a higher portion of resources to be mobilized, as it simplifies the logistics of gathering manure and agricultural byproducts.
3.1.3. Organic Fraction of Household Garbage
The volume of wet organic household garbage steadily decreased from 2.1 PJ today to 1.1 PJ in 2050. As the uncertainty of the drivers was set to increase over the years, the development uncertainty of the organic household garbage amount increased over the years. Overall, these forecasts agree with the report of the Federal Council [71], which assumed that the amount of waste in the waste incineration plants will not decrease in the future due to general consumer behavior and population growth. Since mixed household garbage in Switzerland cannot be landfilled and must be incinerated in suitable plants (Federal Waste Regulation, Art. 10) [50], the total theoretic potential is already used for energy even though not always in an optimized way. This obligation is also expected to remain in place until 2035 and 2050.
The spatial distribution of household garbage and green waste is closely linked to population demographics. Matter et al. [72] expected the population to increase in the metropolitan areas of large settlements and along transport axes and to decrease in rural areas without direct access to a city [64]. This can also have an impact on the amount of organic household waste produced. Household waste and green waste produced by the Swiss population will therefore be concentrated in the catchment areas of the largest cities.
3.1.4. Green Waste from Households and Landscape
By 2050, the sustainable potential of green waste should reach 7.8 PJ, 50% more than today. Separately recycled biogenic waste is currently fermented (52%) or composted (48%). The importance of fermentation has increased considerably in recent years [73]. By 2050, the sustainable potential of green waste should be largely fermented and used for energy production.
3.1.5. Commercial and Industrial Organic Waste
Due to industrial production processes improving and the relocation of industrial activities to other countries, a decrease in this potential is to be expected (1.8 PJ sustainable potential by 2050). This consists of two-thirds of waste from the food processing industry, followed by catering and retailers. The uncertainty is due to diverse and unpredictable changes in general conditions (e.g., changes in legislation, industrial processes, and the relocation of operations).
3.1.6. Sewage Sludge
Overall, an increase in Switzerland’s total sewage sludge volume was expected (18% by 2035, 22% by 2050), in line with the expected population growth, with an overall uncertainty of ±5% (2035) and ±8.5% (2050). Thus, the energy potential increased to 6.0 PJ (±0.6 PJ) in 2050.
In Switzerland, sewage sludge counts as waste and must be thermally treated [50]. This is mostly done in specialized monocombustion plants, municipal waste incinerators, and cement works [22]. Today, the potential already used is 4.9 PJ. Before incineration, the sludge is treated to decrease the high organic matter and water content. This is done to improve its stability, transportability, and recoverability. One of the applicable treatment steps is to subject the raw sludge to digestion processes (thus producing biogas, which can be used as a renewable energy source). An energetic increase of about 1.4 PJ would be possible if anaerobic digestion and subsequent biogas utilization for energy were systematically integrated into sewage sludge treatment [9]. Similarly, an additional energy potential from sewage sludge of 1.7 PJ could be expected in 2050.
Sewage sludge is also closely linked to the spatial distribution of the population. In order to treat the larger wastewater quantities expected in 2035 and 2050 (mostly from larger cities), infrastructure should be installed to handle about 20% more capacity.
4. Discussion
The long-term estimation of the wet biomass resource potential of this paper facilitates the planning of infrastructures to exploit it [10]. This study suggests that there will be enough biomass waste available in the future, especially manure, to run a much higher number of (especially agricultural) facilities than today. However, the results also show the limited availability of valuable cosubstrates (e.g., from industry or gastronomy), and hence point out the relevance of making efficient and coordinated use of them. The time frame adopted in this paper was longer than the 20-year life expectancy of a biogas installation [74]. We estimated previously that, to valorize the sustainable potential of manure for energy alone, up to 1500 agricultural biogas facilities could be necessary [31], 15 times more than today [19]. Considering the future availability of wet biomass resources estimated in this paper, a lot of resources are available. An increase in both agricultural and industrial biogas facilities would be needed to exploit the remaining potential today and in the future.
Several other studies have looked at biomass potential, often using a few individual scenarios [23,75]. These scenarios were used to show specific influences of policy measures (subsidies, legislations) or societal will to implement renewable energies in general and biogas in particular. Other studies have looked at the biomass quantities needed or wanted to increase supplies accordingly [17] and have been mostly concerned with energy crops. In Switzerland, one of the most important biomass future potential reference studies is from 2004 [76], and it was used for the development of the Swiss Energy Strategy [77]. Differences in definitions and assumptions led to some different estimates in 2014 [9]. Overall, our estimations are lower (2050: theoretical potential 88 PJ primary energy, sustainable potential 45 PJ) than the potentials indicated in the study (theoretical potential in 2040: 104 PJ; ecological potential in 2040: 39–50 PJ; see p. 80 in Reference [76]), although there are variations within the different categories. In Switzerland, new waste regulations stipulate that all recoverable anthropogenic wastes have to be separated before collection and recycled as much as possible [50]. Similar resource-saving objectives are being pursued in EU waste policy through new waste management hierarchies that prioritize material recovery above sole energetic use [78]. From this perspective, anaerobic digestion allows for both material and energy recovery. The produced biogas can be used for heat, power, and as transport fuel, while the digestate can be applied to the land as organic fertilizer. Anaerobic digestion has also been identified as one of the most promising practices for mitigating CH4 and N2O emissions from manure storage while producing renewable bioenergy [79,80,81]. In Switzerland, manure could produce 15 PJ of gross biogas yearly, while preventing the emission of 159 kT of CO2 equivalents compared to emissions under current management practices [31]. Nowadays, manure is hardly used for energy production in Switzerland and is directly applied to fields. The main financial obstacle lies in deploying biogas technology, especially for low-energetic sources such as manure. Strategies to promote the fermentation of manure could include the cofermentation of manure with higher-energetic sources or various financial incentives (handing out subsidies, imposing feed-in tariffs, providing CO2 certificates, etc.). However, this can only happen with broad social and political support, as the promotion of biogas will require some form of subsidy.
Regarding overall sustainability, more biomass being available is not necessarily better. For example, fewer animals would imply fewer environmental damages [80,82] but also less manure for producing energy. Therefore, stakeholders should not try to increase the amount of waste resources but rather optimize their use for energy.
To estimate the future potentials, we looked at the drivers that influence them. Some may not be easily controlled by governments, but others could be influenced to achieve a better pool of resources (e.g., by promoting green waste separation, favoring technological innovation, or setting a favorable legal framework). Therefore, presenting both the potentials and their drivers is relevant. We did not consider the possibility of a major disruptive change, such as new unforeseen technology, waste mitigation measures, or massive diet shifts. For example, a recent trend to eat less meat [67], especially among younger people, could increase the long-term uncertainty regarding animal numbers and therefore the manure potential. Our method helps to capture possible outcomes with a large range of estimated uncertainties, which is helpful for planning purposes. The method is dependent on the quality and quantity of the drivers chosen, and we tried to focus only on the most relevant drivers with the strongest possible effects.
Nowadays, energy crops are hardly cultivated in Switzerland due to the lack of subsidies because they have not been considered a political priority. Various life cycle assessments have also shown that the cultivation of common energy crops (such as maize and rapeseed) does not make sense from an ecological point of view in Switzerland [83,84]. New research has indicated the potential of perennial crops such as Miscanthus [85], Silphium perfoliatum L. [86], or wild plant mixtures [87], which have a better environmental performance, especially when grown on marginal land. However, there is a lot of pressure on agricultural land in Switzerland due to the mountainous topography and high population density. This leads to competition in feed and food crops. Hence, the cultivation of energy crops on a large scale is not expected in the future, and biogas technology is expected to continue using waste or byproducts as the main feedstock.
At the European level, the competition in food production is much smaller [88]. Currently, the potential of bioenergy to contribute to the reduction of greenhouse gas emissions (GHGs) and demand-driven supply plays a significant role in the bioenergy and bioeconomy debate in Switzerland and Europe. In 2017, biogas made up 0.1% (1.8 PJ) of the renewable-based final energy supply in Switzerland [89]. According to our results, with current technology, wet biomass could have produced a total of 21 PJ biogas in 2014, increasing up to 23 PJ in 2050. In 2015, the EU produced 350 PJ, or 4% of the gas used in Europe (about one-third heat and two-thirds electricity) [90]. In comparison, the European Biogas Association’s strategy is based on reaching the full potential of biogas and biomethane production, roughly 10% of the EU’s current natural gas consumption [91]. Utility companies in Switzerland are planning to cover 30% of household gas heating needs with biogas [92]. This cannot be achieved just by using sustainable domestic biomass for energy, and other technological pathways are needed to achieve this goal.
A major bioenergy potential in the electricity sector is system stabilization. This could be encouraged with a flexibility premium, where installations produce energy on demand when it is most needed (German Renewable Energy Act 2012 in Reference [30]). As a result of the many resources that can potentially be used as feedstock (e.g., manure, organic waste, and crop byproducts), as well as the numerous thermochemical, biochemical, and physicochemical conversion methods to generate and produce it, wet biomass has the potential to support the generation of energy for all end-use applications (electricity, heat, and transport). Furthermore, bioenergy conversion usually generates heat and power simultaneously by using combined heat and power plants. The increased use of cogenerated heat would increase overall efficiency. In addition, in the transport sector, alternative renewable-based fuels will likely play an important role [93].
5. Conclusions
The estimation of future wet biomass amounts will enable better utilization of biomass resources now and in the long term. Our analysis confirmed that resources are expected to stay stable enough to justify long-term investments in infrastructures to convert all types of wet biomass into energy (from a current total of 43 PJ of primary energy available toward 45 PJ in 2050). In particular, agricultural biomass and conversion to biogas could be exploited to a much larger extent, calling for an increase in bioenergy infrastructure. Using this information, energy from biomass can be positioned to flexibly fill gaps in the future energetic system in Switzerland and other countries. However, mobilizing these resources is still a challenge, and further studies are needed to identify barriers and enablers in increasing the use of biomass for energy.
Supplementary Materials
The following are available online at https://www.mdpi.com/1996-1073/12/18/3585/s1, Figure S1: Number of animals (in livestock units LSU), time series forecast with ARIMA. Figure S2: Number of animals (in livestock units LSU), time series forecast with ARIMA (residuals of the fitted model). Figure S3: Agricultural area (in hectare), time series forecast with ARIMA (black: past, green: forecast, dotted line: standard deviation). Figure S4: Agricultural area (in hectare), time series forecast with ARIMA (residuals of the fitted model). Figure S5: Population (in number of inhabitants), time series forecast with ARIMA. Figure S6: Population (in number of inhabitants), time series forecast with ARIMA (residuals of the fitted model). Figure S7: Gross domestic product (GDP) per capita (in CHF), time series forecast with ARIMA. Figure S8: Gross domestic product (GDP) per capita (in CHF), time series forecast with ARIMA. Figure S9: Industrial production (in CHF), time series forecast with ARIMA. Figure S10: Industrial production (in CHF), time series forecast with ARIMA. Figure S11: Animal manure - Distribution of the simulated values for the theoretical and sustainable potential (2035, 2050); 1000 runs. Figure S12: Agricultural crop by-products - Distribution of the simulated values for the theoretical and sustainable potential (2035, 2050); 1000 runs. Figure S13: Org. fraction of household garbage - Distribution of the simulated values for the theoretical and sustainable potential (2035, 2050); 1000 runs. Figure S14: Green waste from household and landscape - Distribution of the simulated values for the theoretical and sustainable potential (2035, 2050); 1000 runs. Figure S15: Commercial and industrial org. waste - Distribution of the simulated values for the theoretical and sustainable potential (2035, 2050); 1000 runs. Figure S16: Sewage sludge - Distribution of the simulated values for the theoretical and sustainable potential (2035, 2050); 1000 runs. Table S1: Animal manure—Correlation coefficient and level of significance of tested variables. Table S2: Agricultural crop by-products—Correlation coefficient and level of significance of all tested variables. Table S3: Org. fraction of household garbage & green waste from household and landscape—Correlation coefficient and level of significance of all tested variables. Table S4: Commercial and industrial organic waste—Correlation coefficient and level of significance of all tested variables. Table S5: Time series from 1996 to 2016. Table S6: Time series projections for 2035 and 2050 from the ARIMA model Table S7: Future biomass availability for 2035 and 2050 as theoretical and sustainable potentials in primary energy in PJ.
Author Contributions
This study was undertaken as a collaborative work between the authors. Conceptualization: V.B. and O.T. Data collection: V.B. and G.B. Formal analysis: V.B. and G.B. Funding acquisition: O.T. Investigation: V.B. and G.B. Methodology: V.B., G.B., O.T. and S.H. Project administration: V.B. Supervision and feedback: O.T. and S.H. Visualization: V.B. and G.B. Writing—original draft: V.B. and G.B. Writing—review and editing: O.T. and S.H.
Funding
This research project was financially supported by the Swiss Innovation Agency Innosuisse and is part of the Swiss Competence Center for Energy Research SCCER BIOSWEET.
Acknowledgments
The authors wish to thank Janine Burren from the Seminar for Statistics (ETHZ) for her help with the Monte Carlo simulations and Leo Bont (WSL) for useful advice on the time-series analysis.
Conflicts of Interest
The authors declare no conflicts of interest.
References
- IPCC. Climate Change 2014: Mitigation of Climate Change. Contribution of Working Group III to the Fifth Assessment; Report of the Intergovernmental Panel on Climate Change; Cambridge University Press: Cambridge, UK, 2014; p. 1420. [Google Scholar]
- Cornelissen, S.; Koper, M.; Deng, Y.Y. The role of bioenergy in a fully sustainable global energy system. Biomass Bioenergy 2012, 41, 21–33. [Google Scholar] [CrossRef]
- Sacchelli, S. Social, economic, and environmental impacts of biomass and biofuel supply chains. In Biomass Supply Chains for Bioenergy and Biorefining; Woodhead Publishing: Sawston, UK, 2016; pp. 191–213. [Google Scholar]
- Bundesamt für Energie (BFE). Erläuternder Bericht zur Energiestrategie 2050 (Vernehmlassungsvorlage); BFE: Ittigen, Switzerland, 2012; p. 138.
- Bundesamt für Umwelt (BAFU). Strategie für die energetische Nutzung von Biomasse in der Schweiz; BAFU: Bern, Switzerland, 2010.
- Anonymous. Declaration of Graz, January 2017: The role of bioenergy in Europe after COP 21 Paris. In Proceedings of the 5th Central European Biomass Conference, Graz, Austria, 18–20 January 2017; p. 4. [Google Scholar]
- Steubing, B.; Zah, R.; Waeger, P.; Ludwig, C. Bioenergy in Switzerland: Assessing the domestic sustainable biomass potential. Renew. Sust. Energ. Rev. 2010, 14, 2256–2265. [Google Scholar] [CrossRef] [Green Version]
- Baier, U.; Baum, S. Biogene Güterflüsse der Schweiz 2006, Massen- und Energieflüsse; Bundesamt für Umwelt BAFU: Bern, Switzerland, 2006; p. 114. [Google Scholar]
- Burg, V.; Bowman, G.; Erni, M.; Lemm, R.; Thees, O. Analyzing the potential of domestic biomass resources for the energy transition in Switzerland. Biomass Bioenergy 2018, 111, 60–69. [Google Scholar] [CrossRef]
- Trutnevyte, E.; Guivarch, C.; Lempert, R.; Strachan, N. Reinvigorating the scenario technique to expand uncertainty consideration. Climatic Chang. 2016, 135, 373–379. [Google Scholar] [CrossRef]
- Craig, P.P.; Gadgil, A.; Koomey, J.G. What can history teach us? A Retrospective Examination of Long-Term Energy Forecasts for the United States. Ann. Rev. Energy Environ. 2002, 27, 83–118. [Google Scholar] [CrossRef]
- Lempert, R. Can scenarios help policymakers be both bold and careful? In Blindside: How to Anticipate Forcing Events Wild Cards; Brookings Institution Press: Washington, DC, USA, 2007. [Google Scholar]
- Meylan, G.; Haupt, M.; Duygan, M.; Hellweg, S.; Stauffacher, M. Linking energy scenarios and waste storylines for prospective environmental assessment of waste management systems. Waste Manag. 2018, 81, 11–21. [Google Scholar] [CrossRef] [PubMed]
- Fischer, G.; Schrattenholzer, L. Global bioenergy potentials through 2050. Biomass Bioenergy 2001, 20, 151–159. [Google Scholar] [CrossRef] [Green Version]
- Scarlat, N.; Banja, M. Possible impact of 2020 bioenergy targets on European Union land use. A scenario-based assessment from national renewable energy action plans proposals. Renew. Sustain. Energy Rev. 2013, 18, 595–606. [Google Scholar] [CrossRef]
- Haberl, H.; Beringer, T.; Bhattacharya, S.C.; Erb, K.H.; Hoogwijk, M. The global technical potential of bio-energy in 2050 considering sustainability constraints. Curr. Opin. Environ. Sustain. 2010, 2, 394–403. [Google Scholar] [CrossRef] [Green Version]
- Hoogwijk, M.; Faaij, A.; Eickhout, B.; de Vries, B.; Turkenburg, W. Potential of biomass energy out to 2100, for four IPCC SRES land-use scenarios. Biomass Bioenergy 2005, 29, 225–257. [Google Scholar] [CrossRef]
- Scarlat, N.; Fahl, F.; Dallemand, J.-F.; Monforti, F.; Motola, V. A spatial analysis of biogas potential from manure in Europe. Renew. Sustain. Energy Rev. 2018, 94, 915–930. [Google Scholar] [CrossRef]
- Bundesamt für Energie (BFE). Schweizerische Statistik der Erneuerbaren Energien 2017; BFE: Bern, Switzerland, 2017.
- De Vries, B.J.M.; van Vuuren, D.P.; Hoogwijk, M.M. Renewable energy sources: Their global potential for the first-half of the 21st century at a global level: An integrated approach. Energy Policy 2007, 35, 2590–2610. [Google Scholar] [CrossRef] [Green Version]
- Swiss Federal Office for Energy. Energy Strategy 2050. Available online: https://www.bfe.admin.ch/bfe/en/home/policy/energy-strategy-2050.html (accessed on 1 February 2019).
- Thees, O.; Burg, V.; Erni, M.; Bowman, G.; Lemm, R. Biomassepotenziale der Schweiz für die energetische Nutzung, Ergebnisse des Schweizerischen Energiekompetenzzentrums SCCER Biosweet; Swiss Federal Institute for Forest, Snow and Landscape Research (WSL): Birmensdorf, Switzerland, 2017; p. 299. [Google Scholar]
- Thrän, D.; Seidenberger, T.; Zeddies, J.; Offermann, R. Global biomass potentials—Resources, drivers and scenario results. Energy Sustain. Dev. 2010, 14, 200–205. [Google Scholar] [CrossRef]
- Erni, M.; Thees, O.; Lemm, R. Quantitative trends and development of woody biomass potentials for energy—Today, 2035 and 2050. In press.
- Zhang, F.; Li, C.; Yu, Y.; Johnson, D.M. Resources and future availability of agricultural biomass for energy use in Beijing. Energies 2019, 12, 1828. [Google Scholar] [CrossRef]
- Crawley, M.J. The R Book; Wiley: Hoboken, NJ, USA, 2007; 942p. [Google Scholar]
- Frank, S.A. The common patterns of nature. J. Evol. Biol. 2009, 22, 1563–1585. [Google Scholar] [CrossRef] [PubMed]
- Berndes, G.; Hoogwijk, M.; van den Broek, R. The contribution of biomass in the future global energy supply: A review of 17 studies. Biomass Bioenergy 2003, 25, 1–28. [Google Scholar] [CrossRef]
- Swiss Federal Audit Office. Coordination et Efficacité des Soutiens aux Installations de Biogaz Agricole et Rentabilité pour les Exploitants; Swiss Federal Office: Bern, Switzerland, 2018.
- Torrijos, M. State of development of biogas production in Europe. Procedia Environ. Sci. 2016, 35, 881–889. [Google Scholar] [CrossRef]
- Burg, V.; Bowman, G.; Haubensak, M.; Baier, U.; Thees, O. Valorization of an untapped resource: Energy and greenhouse gas emissions benefits of converting manure to biogas through anaerobic digestion. Resour. Conserv. Recycl. 2018, 136, 53–62. [Google Scholar] [CrossRef]
- Bundesamt für Landwirtschaft. Agrar Bericht 2017; BLW: Bern, Switzerland, 2017; p. 460.
- Grundlagen für die Düngung im Acker- und Futterbau. Principles of Fertiliser Application in Arable and Forage Cultivation; GRUDAF: Bern, Switzerland, 2009. [Google Scholar]
- Kupper, T.; Bonjour, C.; Achermann, B.; Rihm, B.; Zaucker, F.; Menzi, H. Ammoniakemissionen in der Schweiz 1990–2010 und Prognose bis 2020; Bundesamt für Umwelt: Ittigen, Switzerland, 2013; p. 110. [Google Scholar]
- Bundesamt für Statistik. Schweizer Landwirtschaft–Ergebnisse der Zusatzerhebung 2010; BFS: Neuchâtel, Switzerland, 2010; p. 36.
- Bundesamt Für Energie. Liste aller KEV-Bezüger im Jahr 2016; BFE: Ittigen, Switzerland, 2017.
- Swiss Competence Center for Energy Research. KTI Biomass for Swiss Energy Future; SCCER: Zurich, Switzerland, 2019; Research Program 2014–2020.
- Bauer, C.; Hirschberg, S.; Cox, B.; Baeuerle, Y.; Zhang, X.; Treyer, K.; Heck, T.; Schenler, W.; Biollaz, S.; Calbry-Muzyka, A.; et al. Potentials, Costs and Environmental Assessment of Electricity Generation Technologies; BFE: Bern, Switzerland, 2017. [Google Scholar]
- Zhao, G. Assessment of potential biomass energy production in China toward 2030 and 2050. Int. J. Sustain. Energy 2016, 37, 47–66. [Google Scholar] [CrossRef]
- Bundesamt fur Statistik (BFS). Landwirtschaft und Ernährung—Taschenstatistik; BFS: Neuchâtel, Switzerland, 2017.
- Bundesamt fur Statistik (BFS). Production de Céréales, Évolution; BFS: Neuchâtel, Switzerland, 2017.
- Scarlat, N.; Martinov, M.; Dallemand, J.-F. Assessment of the availability of agricultural crop residues in the European Union: Potential and limitations for bioenergy use. Waste Manag. 2010, 30, 1889–1897. [Google Scholar] [CrossRef]
- Bentsen, N.S.; Felby, C.; Thorsen, B.J. Agricultural residue production and potentials for energy and materials services. Prog. Energy Combust. Sci. 2014, 40, 59–73. [Google Scholar] [CrossRef]
- Kaltschmitt, M.; Hartmann, H.; Hofbauer, H. Energie aus Biomasse, Grundlagen, Techniken und Verfahren; Springer: Berlin, Germany, 2009. [Google Scholar]
- Bundesamt für Umwelt (BAFU). Erhebung der Kehrichtzusammensetzung 2012; BAFU: Bern, Switzerland, 2012; p. 63.
- Bundesamt fur Statistik (BFS). Siedlungsabfälle. Available online: https://www.bfs.admin.ch/bfs/de/home/statistiken/kataloge-datenbanken/tabellen.assetdetail.4082480.html (accessed on 1 June 2018).
- Hoornweg, D.; Bhada-Tata, P.; Kennedy, C. Waste production must peak this century. Nature 2013, 502, 615–617. [Google Scholar] [CrossRef] [PubMed]
- Bundesamt fur Statistik (BFS). Hauptindikatoren der Volkswirtschaftlichen Gesamtrechnung. Available online: https://www.bfs.admin.ch/bfs/de/home/statistiken/volkswirtschaft/volkswirtschaftliche-gesamtrechnung.assetdetail.6067513.html (accessed on 1 June 2018).
- ECOPLAN. Branchenszenarien 2011 bis 2030/2050 Schlussbericht—Aktualisierung 2015; ECOPLAN, Forschung und Beratung in Wirtschaft und Politik Kopfzeilentext manuell einfügen: Bern, Switzerland, 2015; p. 93. [Google Scholar]
- Federal Council of the Swiss Confederation. Regulation on the Prevention and Disposal of Waste (VVEA); Federal Council of the Swiss Confederation: Bern, Switzerland, 2016.
- Bundesamt für Umwelt (BAFU). U. Grüne Wirtschaft: Massnahmen des Bundes für eine ressourcenschonende, zukunftsfähige Schweiz; BAFU: Bern, Switzerland, 2016.
- Kuhn, P.; Reich, S.; Wasserman, E. Ein Dialog über Herausforderungen und Lösungsansätze in der Abfall- und Ressourcenwirtschaft der Schweiz 2030; Ressourcen Trialog: Aarau, Switzerland, 2017; p. 48. [Google Scholar]
- Bundesamt für Umwelt (BAFU). Gesamtmenge der Siedlungsabfälle und Recyclingquote 2012; BAFU: Bern, Switzerland, 2012; p. 4.
- AfU Freiburg. Von den Gemeinden gesammelte Siedlungsabfälle—Statistiken 2015; Staad Freiburg, Amt für Umwelt: Freiburg, Germany, 2015; p. 6. [Google Scholar]
- Bundesamt fur Statistik (BFS). Siedlungsabfälle-Separatsammelquote—Anteil der separat gesammelten Abfälle im Verhältnis zur Gesamtmenge der verursachten Siedlungsabfälle—In Prozent. Available online: https://www.bfs.admin.ch/bfs/de/home/statistiken/nachhaltige-entwicklung/monitoring-ziele-agenda-2030/alle-nach-themen/12-konsum-produktion/abfall-separatsammelquote.assetdetail.5626310.html (accessed on 1 June 2018).
- Beretta, C.; Stoessel, F.; Baier, U.; Hellweg, S. Quantifying food losses and the potential for reduction in Switzerland. Waste Manag. 2013, 33, 764–773. [Google Scholar] [CrossRef] [PubMed]
- Chevalley, I. Nahrungsmittelverluste im Detailhandel und in der Gastronomie in der Schweiz; Schweizerisch Bundesrat: Bern, Switzerland, 2014. [Google Scholar]
- Schleiss, K. Grüngutbewirtschaftung im Kanton Zürich aus betriebswirtschaftlicher und ökologischer Sicht Situationsanalyse, Szenarioanalyse, ökonomische und ökologische Bewertung sowie Synthese mit MAUT. Ph.D. Thesis, ETH Zürich, Zürich, Switzerland, 1999. [Google Scholar]
- Bundesamt fur Statistik (BFS). Compte de production par Branches (50 branches). Available online: https://www.bfs.admin.ch/bfs/de/home/statistiken/volkswirtschaft/volkswirtschaftliche-gesamtrechnung/produktionskonto.assetdetail.5966197.html (accessed on 1 June 2018).
- Capros, P.; De Vita, A.; Fragkos, P.; Kouvaritakis, N.; Paroussos, L.; Fragkiadakis, K.; Tasios, N.; Siskos, P. The impact of hydrocarbon resources and GDP growth assumptions for the evolution of the EU energy system for the medium and long term. Energy Strategy Rev. 2015, 6, 64–79. [Google Scholar] [CrossRef]
- Food and agricultural organization of the United Nations. Transforming Food and Agriculture to Achieve the SDGs: 20 Interconnected Actions to Guide Decision-Makers; Food and agricultural organization of the United Nations: Rome, Italy, 2018; p. 76. [Google Scholar]
- Verband Schweizer Abwasser- und Gewässerschutzfachleute (VSA); Organisation Kommunale Infrastruktur OKI. Kosten und Leistungen der Abwasserentsorgung; VSA: Bern, Switzerland, 2010. [Google Scholar]
- Bundesamt fur Statistik (BFS). Ständige Wohnbevölkerung nach Alter und Geschlecht (Total), 1860–2009. Available online: https://www.bfs.admin.ch/bfs/fr/home/statistiques/catalogues-banques-donnees/tableaux.assetdetail.5453920.html (accessed on 1 June 2018).
- Bundesamt fur Statistik (BFS). Szenarien zur Bevölkerungsentwicklung der Kantone der Schweiz 2015–2045; BFS: Neuchâtel, Switzerland, 2016; p. 7.
- Maurer, M.; Chawla, F.; von Horn, J.; Staufer, P. Abwasserentsorgung 2025 in der Schweiz; Eawag: Das Wasserforschungs-Institut des ETH-Bereichs: Dübendorf, Switzerland, 2012; p. 232. [Google Scholar]
- Maurer, M.; Herlyn, A. Zustand. Kosten und Investitionsbedarf der Schweizerischen Abwasserentsorgung; Eawag: Dübendorf, Switzerland, 2006. [Google Scholar]
- Bundesamt fur Statistik (BFS). Schweizerische Gesundheitsbefragung 2017; BFS: Neuchâtel, Switzerland, 2018; p. 28.
- Bundesamt für Energie (BFE). Schweizerische Statistik der erneuerbaren Energien 2014. Available online: http://www.admin.ch/themen/00526/00541/00543/?dossier_id=00772&lang=de (accessed on 1 June 2018).
- Bundesamt fur Statistik (BFS). Landwirtschaftliche Nutzfläche. In Ohne Sömmerungsweiden 1985–2016. Available online: https://www.bfs.admin.ch/bfs/de/home/statistiken/kataloge-datenbanken/tabellen.assetdetail.7106327.html (accessed on 1 June 2016).
- Wynistorf, A.; Strebel, R.; Zaugg Stern, M. Raumrelevant Trends und Entwicklungen in der Landwirtschaft—Arbeitsbericht zum Projekt; Entwicklung der Kulturlandschaft im RZU-Gebiet: Zurich, Switzerland, 2017; p. 78. [Google Scholar]
- Der Schweizerisch Bundesrat. Kapazitätsplanung bei Kehrichtverbrennungsanlagen mit Abwärmenutzung Bericht des Bundesrates in Erfüllung des Postulats 14.3882 Knecht (Killer) vom 25. September 2014; Der Schweizerisch Bundesrat: Bern, Switzerland, 2017; p. 15.
- Matter, D.; Fahrländer, S.; Fuchs, S.; Heye, C.; Unternährer, T.; Weilenmann, B. Bauzonen Schweiz: Wie viele Bauzonen braucht die Schweiz? Bundesamt für Raumentwicklung ARE: Bern, Switzerland, 2008. [Google Scholar]
- Inspektorat der Kompostier- und Vergärbranche der Schweiz. Jahresbericht 2014, Ergebnisse von 243 inspizierten Anlagen in 20 Kantonen; Inspektorat der Kompostier- und Vergärbranche der Schweiz: Münchenbuchsee, Switzerland, 2014; p. 11.
- Stucki, M.; Jungbluth, N.; Leuenberger, M. Life Cycle Assessment of Biogas Production from Different Substrates; Bundesamt für Energie: Ittigen, Switzerland, 2011; p. 84. [Google Scholar]
- Haberl, H.; Erb, K.H.; Krausmann, F.; Bondeau, A.; Lauk, C.; Muller, C.; Plutzar, C.; Steinberger, J.K. Global bioenergy potentials from agricultural land in 2050: Sensitivity to climate change, diets and yields. Biomass Bioenergy 2011, 35, 4753–4769. [Google Scholar] [CrossRef] [PubMed] [Green Version]
- Bundesamt für Energie (BFE). Potentiale zur energetischen Nutzung von Biomasse in der Schweiz; BFE: Ittigen, Switzerland, 2004; p. 293.
- Kirchner, A.; Bredow, F.; Grebel, T.; Hofer, P.; Kemmler, A.; Ley, A.; Piégsa, A.; Schütz, N.; Strassburg, S.; Struwe, J. Die Energieperspektiven für die Schweiz bis 2050, Energienachfrage und Elektrizitätsangebot in der Schweiz 2000–2050; Prognos: Basel, Switzerland, 2012; p. 842. [Google Scholar]
- European Parliament. Directive 2008/98/EC of the European Parliament and of the Council of 19 November 2008 on Waste and Repealing Certain Directives; European Parliament: Brussels, Belgium, 2008. [Google Scholar]
- Chadwick, D.; Sommer, S.G.; Thorman, R.; Fangueiro, D.; Cardenas, L.; Amon, B.; Misselbrook, T. Manure management: Implications for greenhouse gas emissions. Anim. Feed Sci. Technol. 2011, 166, 514–531. [Google Scholar] [CrossRef]
- Gerber, P.J.; Steinfeld, H.; Henderson, B.; Mottet, A.; Opio, C.; Dijkman, J.; Falcucci, A.; Tempio, G. Tackling Climate Change through Livestock—A Global Assessment of Emissions and Mitigation Opportunities; FAO: Rome, Italy, 2013; p. 139. [Google Scholar]
- Moral, R.; Bustamante, M.A.; Chadwick, D.; Camp, V.; Misselbrook, T. N and C transformations in stroed cattle farmyard manure, including direct estimates of N2 emission. Resour. Conserv. Recycl. 2012, 63, 35–42. [Google Scholar] [CrossRef]
- Steinfeld, H.; Gerber, P.J.; Wassenaar, T.; Castel, V.; Rosales, M.; de Haan, C. Livestock’s Long Shadow: Environmental Issues and Options.; Food and Agriculture Organization of the United Nations: Rome, Italy, 2006. [Google Scholar]
- Kägi, T.; Freiermuth Knuchel, R.; Gaillard, G.; Nemecek, T. Ökobilanz von Energiepflanzen, Forschungsanstalt. AGRARForschung 2007, 14, 460–465. [Google Scholar]
- Zah, R.; Böni, H.; Gauch, M.; Hischier, R.; Lehmann, M.; Wäger, P. Ökobilanz von Energieprodukten: Ökologische Bewertung von Biotreibstoffen; EMPA: Dübendorf, Switzerland, 2006. [Google Scholar]
- Kiesel, A.; Wagner, M.; Lewandowski, I. Environmental performance of miscanthus, switchgrass and maize: Can C4 perennials increase the sustainability of biogas production? Sustainability 2016, 9, 5. [Google Scholar] [CrossRef]
- Gansberger, M.; Montgomery, L.F.R.; Liebhard, P. Botanical characteristics, crop management and potential of Silphium perfoliatum L. as a renewable resource for biogas production: A review. Ind. Crops Prod. 2015, 63, 362–372. [Google Scholar] [CrossRef]
- Von Cossel, M.; Lewandowski, I. Perennial wild plant mixtures for biomass production: Impact of species composition dynamics on yield performance over a five-year cultivation period in southwest Germany. Eur. J. Agron. 2016, 79, 74–89. [Google Scholar] [CrossRef]
- Philippidis, G.; Bartelings, H.; Helming, J.; M’barek, R.; Smeets, E.; Van Meijl, H. The good, the bad and the uncertain: Bioenergy use in the European Union. Energies 2018, 11, 2703. [Google Scholar] [CrossRef]
- Bundesamt für Energie. Endverbrauch Erneuerbare Energien, nach Energieträgern und Technologien (Dargestellter Zeitraum: 1990–2017). Available online: https://www.bfs.admin.ch/bfs/de/home/statistiken/energie.html (accessed on 1 June 2018).
- Scarlat, N.; Dallemand, J.F.; Monforti-Ferrario, F.; Nita, V. The role of biomass and bioenergy in a future bioeconomy: Policies and facts. Environ. Dev. 2015, 15, 3–34. [Google Scholar] [CrossRef]
- EBA European Biogas Association. Available online: https://www.europeanbiogas.eu/ (accessed on 1 January 2019).
- Angele, H.-C. 30/2030 So wird die Schweizer Gasversorgung erneuerbar. In Medienfrühstück swissbau; Gas Energie: Zurich, Switzerland, 2018. [Google Scholar]
- Boulouchos, K.; Cellina, F.; Cox, B.; Georges, G.; Hirschberg, S.; Hoppe, M.; Jonietz, D.; Kannan, R.; Kovacs, N.; Küng, L. Towards an Energy Efficient and Climate Compatible Future Swiss Transportation System; Sccer: Zurich, Switzerland, 2017. [Google Scholar]
Figure 1.
Key drivers for agricultural residues (animal manure and agricultural crop byproducts).

Figure 2.
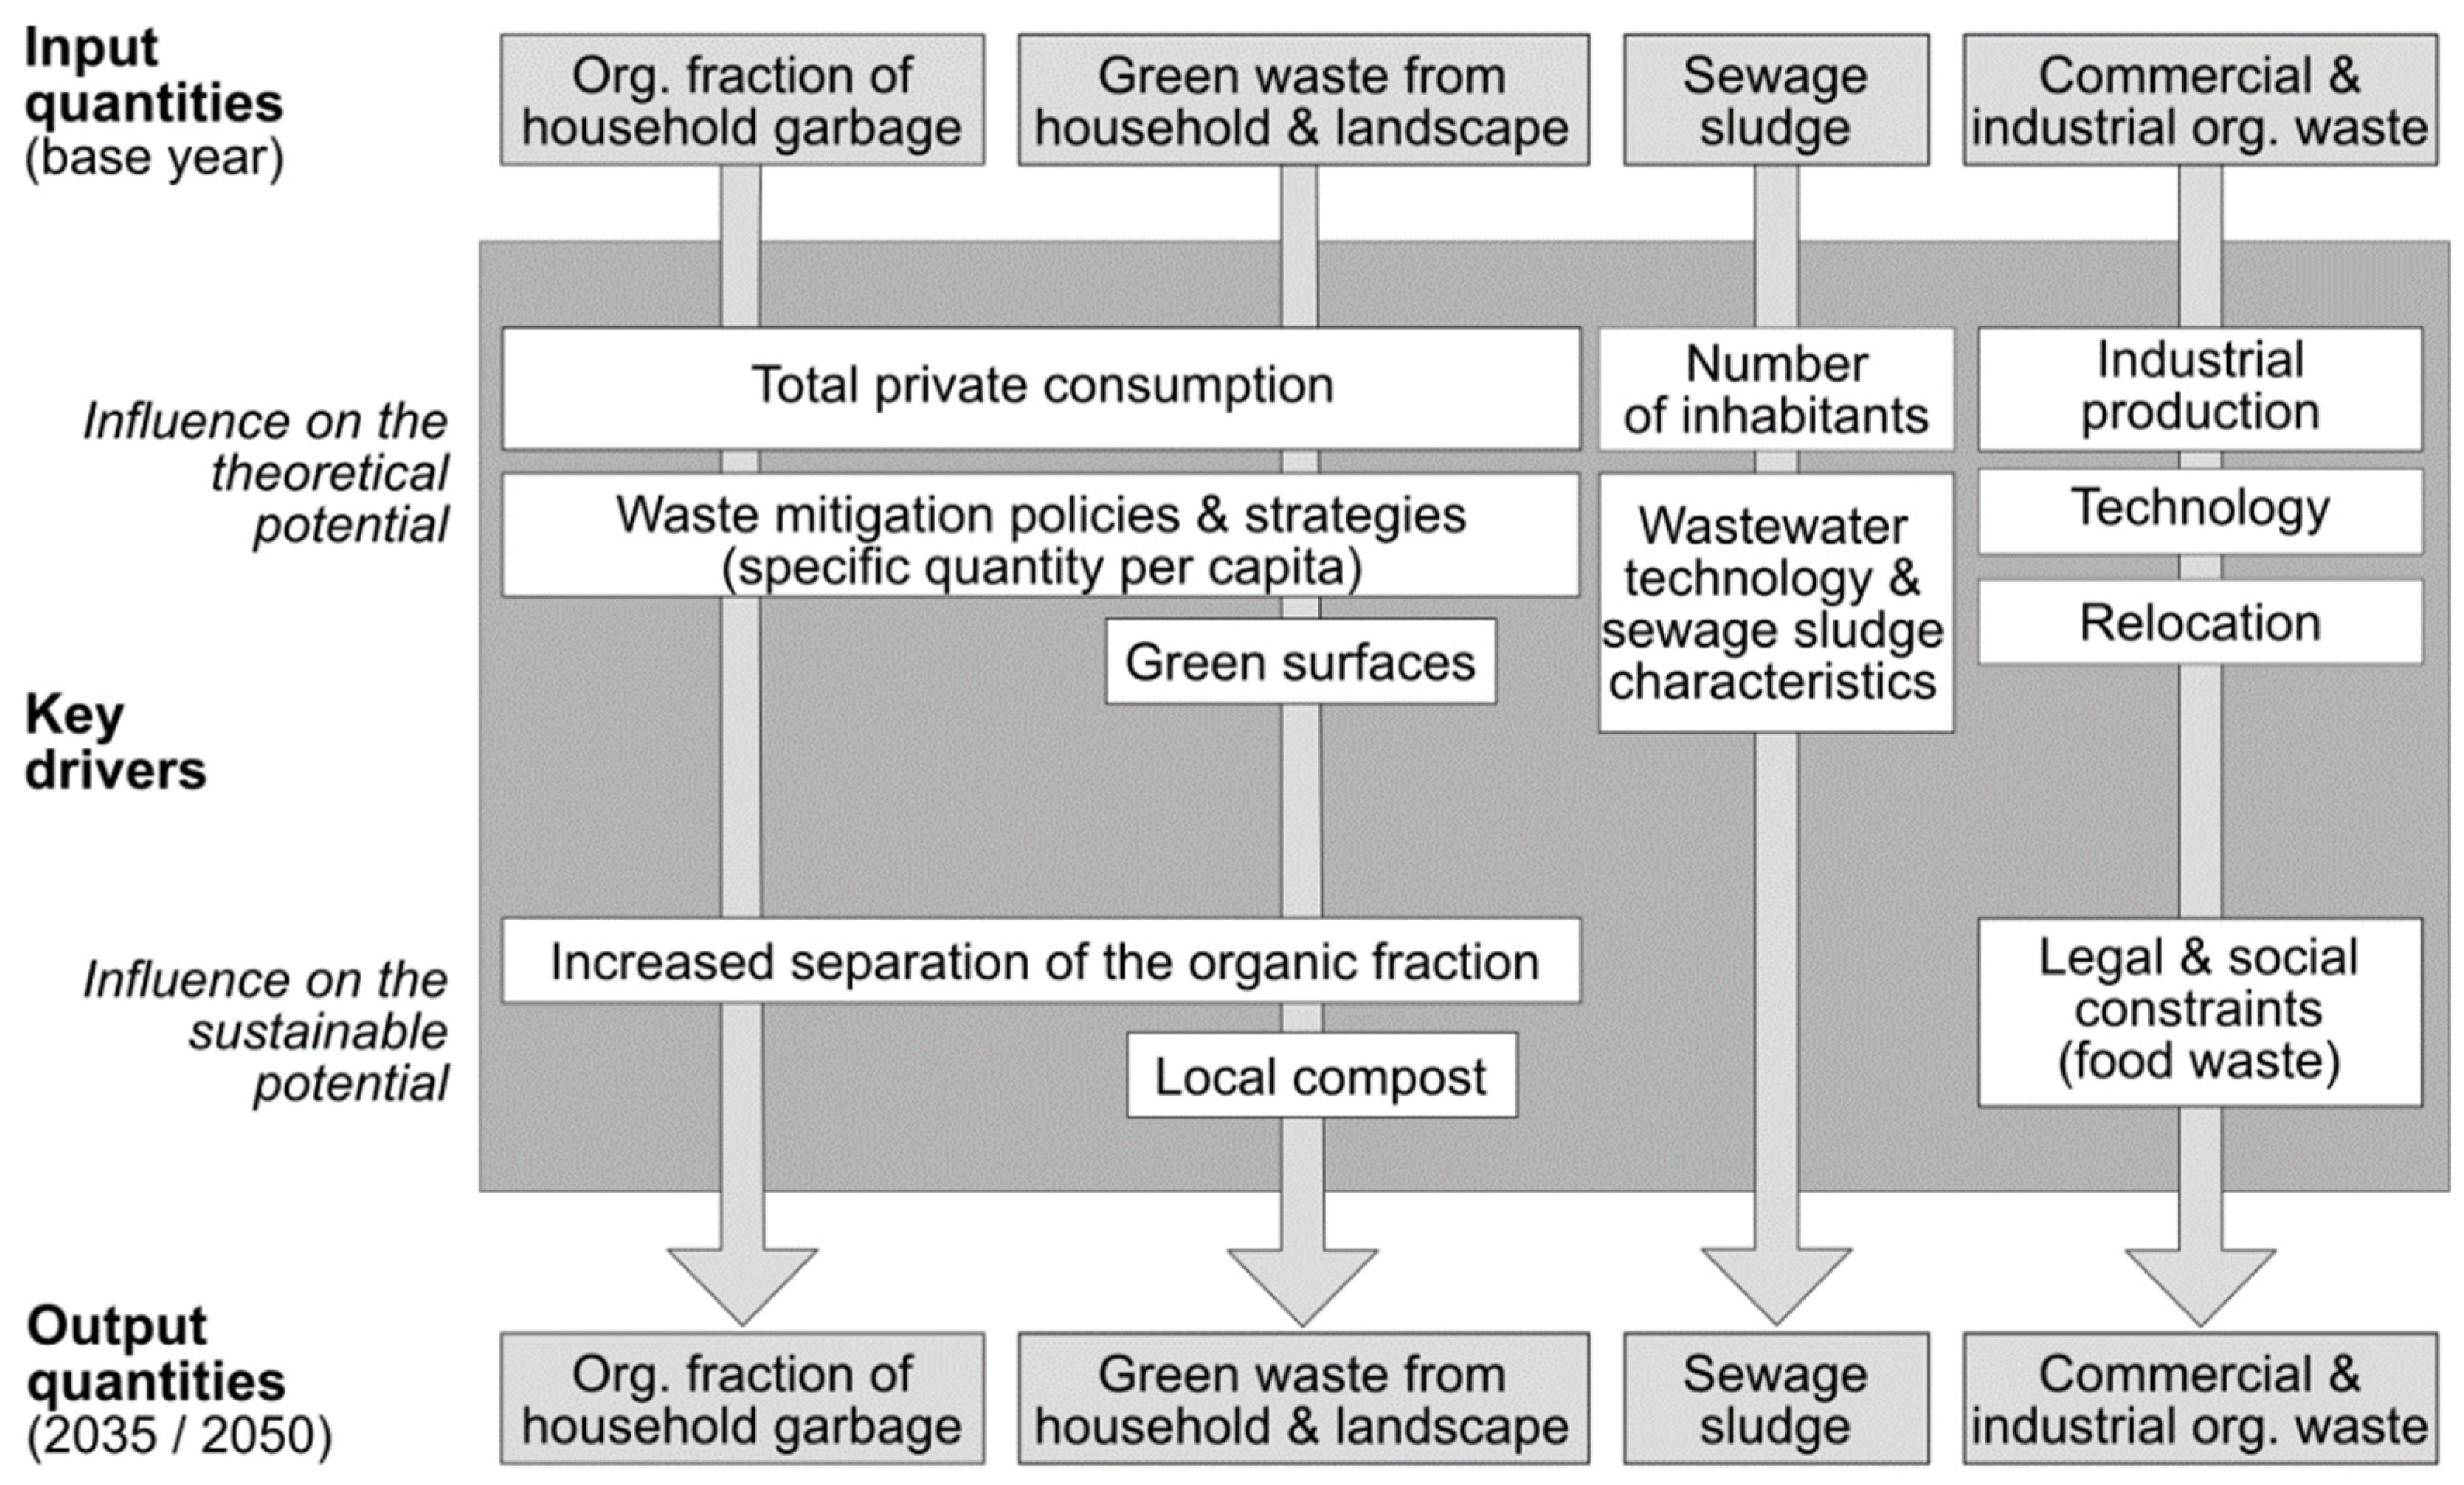
Key drivers for anthropogenic wastes (organic fraction of household garbage, green waste from households and landscape, commercial and industrial organic waste, and sewage sludge).
Figure 2.
Key drivers for anthropogenic wastes (organic fraction of household garbage, green waste from households and landscape, commercial and industrial organic waste, and sewage sludge).

Figure 3.
Mean of the expected development of biomass potentials in petajoules (PJ) in 2035 and 2050, with indication of the uncertainty (95% confidence interval) from the Monte Carlo simulation. Theoretic potentials are in blue full lines, and sustainable potentials are in red dotted lines.
Figure 3.
Mean of the expected development of biomass potentials in petajoules (PJ) in 2035 and 2050, with indication of the uncertainty (95% confidence interval) from the Monte Carlo simulation. Theoretic potentials are in blue full lines, and sustainable potentials are in red dotted lines.

Figure 4.
Cumulative mean of the expected development of biomass potentials in PJ in 2035 and 2050 from the Monte Carlo simulation: (a) theoretical; (b) sustainable.
Figure 4.
Cumulative mean of the expected development of biomass potentials in PJ in 2035 and 2050 from the Monte Carlo simulation: (a) theoretical; (b) sustainable.


Table 1.
Description of the selected drivers for all biomass types. Note that the drivers of the theoretical potential also apply to the sustainable potential.
Table 1.
Description of the selected drivers for all biomass types. Note that the drivers of the theoretical potential also apply to the sustainable potential.
| Biomass | Drivers of Theoretical Potential | Drivers of Sustainable Potential |
|---|---|---|
| Animal manure | Number of animals (customer demand, subsidies) | Proportion of animals with access to pastures/meadows (customer demand, legal constraints), combined with the number of days per year and the hours per day of grazing (climate conditions, agricultural practices) |
| Quantity of manure produced per animal (depending on stabling or feeding practices, animal type) | Basic conditions for individual and joint biogas facilities (available technology, substrate collection limitations, legal constraints, subsidies) | |
| Manure characteristics (feeding practices, stabling system, animal type) | ||
| Agricultural crop byproducts | Agricultural area (land use, customer demand, subsidies) | Proportion of the byproducts possible to mobilize for energy (e.g., new harvesting technology, subsidies, legal constraints) |
| Average byproducts per area, including intermediate crops (climate conditions and agricultural practices such as fertilizer, pesticide use) | ||
| Composition of byproducts (e.g., plantation type) | ||
| Organic fraction of household garbage | Total private consumption | Biogenic waste (not yet collected separately) and nonsustainable part of theoretical are transferred to green waste: sustainable = theoretical by 2050 |
| Waste mitigation policies and strategies (overall reduction, improved recycling) | ||
| Green waste from households and landscape | Total private consumption | Part of the mixed garbage not yet collected separately, but feasible: added after the simulation |
| Green waste mitigation measures (e.g., food waste strategies) | Part to be preferably composted in as decentralized a way as possible (structural and economic reasons) | |
| Area/management of the green space | ||
| Commercial and industrial organic waste | Industrial production | Waste mitigation policies, social acceptance regarding food waste (e.g., reuse as animal feed, food donation) |
| Technology (optimized industrial processes) | ||
| Relocation of industries | ||
| Sewage sludge | Amount of wastewater treated expressed as population equivalents (here using number of inhabitants) | Assumed to be equal to the theoretical potential. In Switzerland, all sewage sludge currently has to be incinerated (thermal treatment). All sewage sludge could be used for biogas production compared to only around two-thirds today. |
| Sewage sludge load and characteristics (e.g., new wastewater treatment processes) |
© 2019 by the authors. Licensee MDPI, Basel, Switzerland. This article is an open access article distributed under the terms and conditions of the Creative Commons Attribution (CC BY) license (http://creativecommons.org/licenses/by/4.0/).
Share and Cite
MDPI and ACS Style
Burg, V.; Bowman, G.; Hellweg, S.; Thees, O. Long-Term Wet Bioenergy Resources in Switzerland: Drivers and Projections until 2050. Energies 2019, 12, 3585. https://doi.org/10.3390/en12183585
AMA Style
Burg V, Bowman G, Hellweg S, Thees O. Long-Term Wet Bioenergy Resources in Switzerland: Drivers and Projections until 2050. Energies. 2019; 12(18):3585. https://doi.org/10.3390/en12183585
Chicago/Turabian StyleBurg, Vanessa, Gillianne Bowman, Stefanie Hellweg, and Oliver Thees. 2019. "Long-Term Wet Bioenergy Resources in Switzerland: Drivers and Projections until 2050" Energies 12, no. 18: 3585. https://doi.org/10.3390/en12183585
Note that from the first issue of 2016, this journal uses article numbers instead of page numbers. See further details here.