Wind Energy Implementation to Mitigate Wildfire Risk and Preemptive Blackouts


College of Business Administration, Texas A&M University-Kingsville, Kingsville, TX 78363, USA
Energies 2020, 13(10), 2421; https://doi.org/10.3390/en13102421
Submission received: 10 April 2020
/
Revised: 4 May 2020
/
Accepted: 6 May 2020
/
Published: 12 May 2020
(This article belongs to the Section A: Sustainable Energy)
Abstract
:Damages caused by wildfires in California due to transmission line failures have increased significantly in recent years. Curtailment of electric service in areas under fire threat has been implemented to avoid these wildfires. Results from this research indicated that 24% of California’s cities are at risk of wildfire, while 52% are at risk of blackout. These blackouts have resulted in significant financial losses and risk to life and health. Undergrounding current transmission lines has been proposed as a long-term solution. However, undergrounding lines would take decades to complete and increase average monthly electric bills from $80 to $260. This research investigated shortening the length of the electricity supply chain, supplying affected communities with onshore and offshore wind energy. Results showed good wind energy potential in locations near affected cities. Distance analyses revealed that more than two hundred cities (population 5.5 million) can be served by existing wind farms located at less than 50 km. Future offshore wind turbines could generate high power output (capacity factor >50% for significant periods). An analysis of diverse locations along California’s coast indicated that just one offshore wind farm could serve more than a hundred cities with cumulative population larger than one million.
1. Introduction
A large number of the most damaging wildfires in California have been attributed to power lines damaged by strong winds [1,2]. Figure 1a shows significant increase in the number of these type of wildfires in recent years [3]. Additionally, Figure 1b,c highlights how power line wildfires are much more damaging and costly than other types of wildfires, having burned larger areas (Figure 1b) and destroyed more structures (Figure 1c) [4]. One of the world’s most expensive disasters in 2018 was the Campfire wildfire (caused by a power line in California), with damages exceeding $16.5 billion [5]. Eight of the 20 most destructive wildfires in California were caused by power line failures [4].
Local electric companies have been held liable for wildfires caused by their power lines, which can place them under financial strain [6]. Wildfires caused by power line failures in the presence of strong winds are more damaging than other wildfires because the incidents are normally caused by dry branches from forest trees. Sparks in contact with dry forests are then flamed quickly by strong winds [7,8]. Furthermore, wildfires caused by power lines are normally in proximity to cities or suburbs, creating an increased financial risk and potential loss of life [9]. To reduce risks from power line wildfires electric companies have explored different alternatives. Undergrounding California’s overhead transmission and distribution lines has been indicated as the clearest solution. However, undergrounding lines would cost from $1 to $23 million dollars per mile, compared to above ground lines that cost $174,000 for rural construction to $11 million for urban construction (per mile). It has been estimated that undergrounding electric lines would increase the consumer’s average monthly electric bills from $80 to $260 for 30 years. Efforts to underground power lines have been undertaken, but it is estimated that it will take decades to be completed [10].
Electric companies have opted to shut-off power in transmission lines that are under increased wildfire risk in presence of high winds. Large areas have experienced blackouts lasting several days, leaving millions of people without electricity. This has caused large financial losses and created health risks for vulnerable populations [6]. Even when power is curtailed in some areas, power line wildfires can start in other areas where power was left active, due to the unforeseen wind conditions [11]. Electric companies faced with enormous liabilities from wildfires and long-term investments to improve electric transmission lines plan to continue with the blackouts, probably expanding them in the future. It has been considered that blackouts will become a fact of life in California for the foreseeable future [6].
This research proposes using local onshore and offshore wind energy to shorten the length of transmission lines and significantly reduce the investment required to underground them. Most of the underground transmission lines for nearby wind turbines would be in rural areas, which have the lowest undergrounding costs [10]. Furthermore, since the direct cause of the blackouts is the presence of strong winds, installing one or several wind turbines near to cities affected by power line wildfires and blackouts will help to ameliorate the current situation.
2. Materials and Methods
This research developed a Geographic Information System (GIS) methodology, applying the open source software QGIS (Quantum GIS). Data from California’s Department of Forestry and Fire Protection (CalFire) was used to evaluate historic wildfire patterns since 1878, revealing an increase of power line wildfires in recent years [3]. To assess the areas with higher risk of power line wildfires and of blackouts, the Public Safety Power Shutoff (PSPS) planning maps from Pacific Gas and Electric Company (PG&E) [12] and from Southern California Edison (SCE) [13,14] were overlaid with the California Public Utilities Commission (CPUC) Fire map, which contains wildfire risk on Tier 2 (Elevated) and Tier 3 (Extreme) levels [15]. Data from the Census Bureau was applied to overlay California cities affected by PSPS [16,17]. Results from this GIS analysis are shown in Figure 2; with diverse PSPS circuit areas for PG&E and SCE that fall under Tier 2 and 3 and which contain cities marked with red dots. It is important to recognize that a significant number of cities might not be in areas of wildfire risks, but are serviced by a PSPS under fire threat, and therefore, will be affected by the corresponding blackout.
To assess the wind energy potential to supply local communities, two approaches were considered: (1) electricity supplied from wind farms in operation and (2) installation of new wind turbines. All new wind turbines were modeled to have the same parameters as the Vestas V136-3.45 MW. The power table of this wind turbine is indicated in Figure 3a. It has a rotor diameter of 136 m, cut-in wind speed of 4.5 m/s, cut-out wind speed of 22 m/s, and rated wind speed of 11 m/s [18]. This wind turbine model was designed for onshore and offshore application [19]. The Vestas 3.45 model has been used in previous research [20], in onshore projects such as Patriot Wind in Nueces County, Texas [21], and offshore projects such as Rampion in the English Channel, United Kingdom [22]. The manufacturer indicated that this wind turbine has high efficiency adaptability for low, medium, and high wind speed areas, with rotor sizes options ranging from 105 m to 136 m [19]. This also indicated that this platform is one of the highest producing low wind turbines available, maximizing permit options for high restriction locations [19]. The Electric Reliability Council of Texas (ERCOT) has reported average annual Capacity Factors on the ranges of 34% to 45% for wind farms containing this wind turbine model [23]. To calculate the power output, meteorological wind speed data in diverse California locations from 1979 to 2010 was applied. This data was obtained from the Climate Forecast System Reanalysis (CFSR) from the National Oceanic and Atmospheric Administration (NOOA) [24] and the Global Wind Atlas 3.0 (Figure 3b) owned and operated by the Technical University of Denmark (DTU) and released in partnership with the World Bank Group [25] (DTU, 2019). CFSR meteorological wind speed data has a spatial resolution of one third of a degree by one third of a degree and temporal resolution of one hour, geared for a regional and State level assessment [24]. For focused assessments on particular locations, this research methodology can be applied with higher spatial and temporal resolution data. This data is normally obtained from on-site monitoring or contracted remote sensing services. The proposed system will include energy storage components to provide communities with a stable power supply, considering that wind energy is variable [26]. Energy storage systems are becoming economically feasible and have been installed in diverse wind farms [27].
3. Results
3.1. Risk Assessment from Wildfire and Blackouts
Blackouts and wildfire risk assessment for cities in California was implemented by overlaying the CPUC Fire Threat and PSPS areas with cities classified by population as shown in Figure 4. Contrasting the results from both graphs shown in Figure 4, it is important to highlight that more than 52% of all the cities in California are at risk of blackout, while less than half that number (24%) are at risk of wildfire. Furthermore, smaller cities (population < 10,000) have much higher risk from both blackout and wildfires. Among cities with population larger than 10,000, 2% of all communities have fire threat and 14% have blackout risk. This seven-fold increment in the number cities affected by blackout risk when compared with wildfire is relevant, indicating that a city has a much higher probability of having a blackout than wildfire damage. Smaller cities (population < 10,000) are affected in greater numbers from both these risks. Additionally, the blackout risk increases when considering that several PSPS can serve the same city, as evaluated in other sections of this research.
Electric transmission data from the Homeland Infrastructure Foundation [28] was combined with CPUC Fire Threat data (level 2 and 3). The analysis provides better understanding of the divergences on the number of cities under risk of fire and blackouts. Figure 5a shows CPUC fire threat data overlaid with the more than 60,000 km of transmission lines (diverse voltages) in California. Large tracks along coastal regions and in north central California are affected by CPUC Fire Threat. This figure clearly showcases that long segments of transmission lines servicing cities all over the state are compromised by fire threat. Furthermore, long line sections outside CPUC fire threat areas are nevertheless affected by disconnection because one or several of its segments are inside the risk area. These lines are identified as “Affected” (blue color) in Figure 5b. Results from this figure reveal that more than 34% of all transmission lines are inside CPUC fire threat areas (level 2 and 3) that, when combined with the 28% “Affected” category, results in 62% of transmission lines under risk of disconnection. When only high voltage (higher than 200 kV) transmission lines are considered, the percent at risk of disconnection increases to 80%. This can be attributed to high voltage lines traversing forest areas to connect communities. The analysis contributes to understand why a significant number of cities that do not fall in CPUC fire threat areas are nevertheless at risk of blackouts. Electric companies in California (PG&E and SCE) have publicly identified PSPS zones to provide the public and authorities concise information on blackout risk. In the event of wildfire, electric circuits for PSPS zones will be disconnected from power, leaving all cities inside in blackout contingency.
Evaluation of the PSPS zones indicated that a large number of PSPS overlaid with each other, causing some cities to be serviced by two or more different circuits, as presented in Figure 2b. For cities serviced by two or more PSPS, when any section of the circuit is under CPUC threat, the complete zone will be disconnected in the event of fire risk. Therefore, cities located in larger PSPS or serviced by a significant number of overlaid circuits have a higher probability of disconnection. Results from Table 1 classifies cities by population levels and indicates the characteristics of the PG&E’s PSPS that service those cities, including the PSPS area sizes, proportion of areas affected by tier 2 and 3 threat, and the number of overlaid zones that affect each area. This analysis shows that most of the cities in these PSPS under fire threat are below population 10,000, having large PSPS areas when compared with PSPS for larger cities. Additionally, many of these cities are serviced by two or more PSPS. For cities served by several PSPS the risk of blackout increases. This is a good indicator on the increased risk of blackout because if any of the PSPS areas serving a city is disconnected that city will experience partial or total blackout. For instance, Monterrey (population above 28,000) is served by nine PSPS and San Rafael (population almost 59,000) is served by seven PSPS. Both cities are examples of increased blackout risks. It is important to highlight that to perform future focused analysis on particular cities this methodology will require higher resolution population data for each city subdivision and transmission lines layouts should be applied to evaluate the optimal final sitting for wind farms.
Southern California Edison (SCE) made PSPS available for their service area in south California and a PSPS-city analysis for them is presented in Table 2. Results indicate that although average PSPS are smaller when compared with PG&E’s PSPS, the number of PSPS cities with larger populations grows significantly. Large cities (population > 60,000) are affected by 99 PSPS and several cities are served by more than four PSPS. The risk of blackout increases significantly for these cities as the number of the PSPS serving them grows. For instance, three cities in the population ranges 30–40 (thousands) are simultaneously served by seven PSPS (Culver City), 11 PSPS (Beverly Hills), and 12 PSPS (West Hollywood). On the other hand, Table 1 and Table 2 indicate that small cities (population < 10,000) are affected in larger numbers by PSPS that have high average areas. The combination of these factors means that smaller cities are at higher risk of blackout due to wildfire threat. Additionally, since a significant number of cities are situated in overlaid PSPS zones, their combined population, affected by blackout risks, can reach hundreds of thousands.
The fraction of PSPS areas that are affected by CPUC Fire-Threat is presented in Figure 6. Most of the PSPS have less than 5% of their areas affected by Fire Threats; however, in case of a fire, the whole PSP will be disconnected. This reinforces the criteria that a significant number of cities, not contained in the CPUC Fire-Threat areas, will be affected by blackouts. Therefore, cities would benefit from applying nearby wind energy, to reduce its dependence on large PSPS circuit areas.
3.2. Existing Wind Farms to Supply Local PSPS Cities
California is home to more than 8000 wind turbines, grouped in almost 140 wind farms, of which more than 25 farms have at least a 100 MW of installed capacity each. In fact, California is ranked second in the US in terms of installed wind turbines and the fourth considering the installed capacity [29,30]. This abundance of wind energy resources prefigures the opportunity for a potential number of PSPS cities to benefit from local supply of existing wind farms. However, detailed GIS analysis should be performed for each case [31,32] because most commercial wind farms are designed to provide electricity to remote locations and are not interconnected with local communities [33,34]. In those cases, transmission lines bypass local communities to take electricity to far away areas [33]. Therefore, it is important to evaluate if a wind farm has a nearby local population affected by wildfire blackouts to justify the installation of interconnecting power lines.
A general analysis of wind farms and cities inside PSPS in California is presented in Figure 7. The cumulative population of PSPS closer than 100 km in represented in Figure 7a. The GIS analysis indicated that almost 10 million people reside in PSPS areas and a little over 80% of this population is closer than 100 km from wind farms. Since in most cases new underground transmission lines will be required, distance to wind farms is an important decision criterion. Figure 7b will aid in understanding the effect of performing analysis at different distance thresholds. Under 50 km threshold results indicate that more than 200 PSPS cities, with almost 5.5 million people, could be served by existing wind farms. Twelve of those cities have populations larger than 100,000 and 30 of them populations between 50,000 and 100,000. More than 100 PSPS cities have populations smaller than 10,000. For a 30 km threshold, the analysis reveals that almost 2.9 million people, living in 103 PSPS cities, could be served by existing wind farms. Of those cities, eight cities have populations larger than 100,000 and more than 50 have population smaller than 10,000 thousand. The overall analysis indicates that a small number of existing wind farms will be able to serve larger cities (>100,000) at close distances. However, small PSPS cities (<10,000) are situated at farther distances from existing wind farms.
GIS analysis for existing wind farms, local PSPS cities and population will aid in gaining a better understanding on how these communities may benefit from the wind resource. Two case studies for existing wind farms were evaluated, expanding the GIS methodology developed in this research. For the first case study, 280 Vestas V90-3 wind turbines, installed in Alta Wind Farm (Kern county) in Southern California, were evaluated, as presented in Figure 8a. Result indicated that 58 cities are closer than 100 km, with a cumulative population of almost one million people. When the distance is reduced to 50 km, the results indicate that 12 PSPS cities, with a cumulative population of almost 235,000, can be served by this wind farm. As distance is reduced to 30 km, six cities, with a cumulative population of 70,000, would benefit.
Figure 9 showcases results for Hatchet Ridge wind farm, located in Northern California, with 101.2 MW installed capacity and 44 Siemens 2.3-93 wind turbines [21,30]. Figure 9a displays the wind farms overlaid with PSPS cities, with corresponding population labels. Results from the GIS proximity analysis in Figure 9b indicate that 50 PSPS cities with cumulative population above 80,000 are located less than 120 km from the wind farm. Furthermore, 25 cities with cumulative population of almost 50,000 are less than 80 km from the wind installation. The cost of direct underground interconnection with the wind farm for many cities could be potentially lower than undergrounding the complete PSPSs areas servicing those cities. Individual GIS analysis for each wind farms should be performed to evaluate their suitability on serving PSPS cities.
4. Discussion
4.1. Proposed Onshore Wind Turbines
The GIS proximity analysis from Section 3.2 highlights the challenges on serving PSPS cities from existing wind farms. Alternative wind energy sources may be found from new onshore and offshore turbines to serve local PSPS cities. Data from DTU’s Wind Atlas and NOAA’s CFSR was combined with the power table for the proposed wind turbine model to calculate the hourly average wind power output per month for diverse locations. For a first analysis, placement for the new wind turbines was considered north of San Francisco area, as shown in Figure 10a, applying the proximity and population analyses, considering wind energy potential and proximity to PSPS cities. In Figure 10b, each month contains 24 bars in the chart representing the hourly average power output. Results indicate that a wind turbine installed in this area would generate variable power output in ranges from 0.8 to 2.5 GW. For the months that reflect high nighttime energy production with significant hourly variability (March to October), an energy storage system could be an effective solution to provide a stable electricity supply [35].
Twenty-four cities, at a range of 50 km, with a combined population of almost 400,000, would be served by the proposed wind turbines, as indicated by Figure 11. Cities with a cumulative population of more than 300,000 would be served at a shorter distance of 40 km. This would represent a good option to supply electricity to local communities that are at risk of blackouts due to wildfire curtailment. The shorter distances reflected in the results would entail smaller cost for the undergrounding of transmission lines. Furthermore, since several of these cities overlap two and even three PSPS areas, the cost of undergrounding all transmission lines in these PSPS is much higher and the risk of blackout due to wildfire curtailment increases. The power output indicated in Figure 10b can be increased by installing additional wind turbines in layouts that minimize wake interference.
A second proposed new wind farm site was evaluated for rural northeast California, in Plumas county, as indicated in Figure 12. The same wind turbine model, Vestas V136-3.45, was also considered for the analysis. The low population density region for this new wind turbine contains many small PSPS cities, as displayed in Figure 12a. Figure 12b represents the average hourly power output for one wind turbine per month. From November to February, the peak production is during morning and early afternoon hours, while March and October show two daily peaks at midnight and noon times. High variability is observed from April to September, with higher power production at nighttime. As indicated in previous case studies, if several wind turbines were installed, the power output would multiply, and with optimum layouts, the losses due to wakes would be minimized. Accounting for the power output high variability, an energy storage system would be needed.
Given the low-density population for these communities, it was anticipated to have longer distances from PSPS cities to wind resource. However, the proposal might be feasible considering the lower cost for rural transmission lines. Ninety cities with a cumulative population slightly over 200,000 are located at less than 200 km, as presented in Figure 13. Sixty-three communities, with cumulative population of 100,000, would be 80 km away. For a lower threshold of 44 km, a cumulative population of 50,000 people, living in 30 PSPS cities, would benefit. This case study highlights how smaller rural PSPS cities could face challenges related with distance to optimal wind energy locations. Nevertheless, GIS analyses might be performed to develop a distributed system, identifying several good wind locations. On each distributed location, fewer wind turbines will be installed to serve a small number of nearby rural PSPS cities, reducing the overall transmission costs. The main challenge will be selecting feasible locations with optimal wind conditions.
4.2. Proposed Offshore Wind Farms
California is home to some of the best offshore wind energy resources in the United States. It has been estimated that it has a potential offshore wind energy production of 392 TWh/year, equivalent to one and a half times California’s 2014 energy consumption [36]. However, California’s steep bathymetry in optimal offshore wind energy locations has thus far prevented the installation of wind turbines [37]. As floating wind turbines are deployed in locations all over the world, overcoming water depth issues, opportunities for offshore wind energy in California have expanded [38,39]. The installation of floating wind turbines in California is expected in the near future [40]. Wind energy has significant offshore and onshore applications, and its use is expanding constantly [41]. A large number of PSPS cities are located close to the coast in California, creating a potential to supply them with offshore wind energy to prevent wildfire blackouts. For this analysis, the Vestas V136-3.45 MW will continue to be used. Criteria in the selection of the offshore turbines site include placement of areas of maximum wind potential as indicated by Data from DTU’s Wind Atlas and NOAA’s CFSR. Additional criteria include minimizing distance to the coast, considering high cost of subsea cable, and minimizing distance to PSPS cities [42].
The first analysis for offshore application of wind energy to PSPS cities was at Point Arena, in northern California, as indicated in Figure 14a. A number of PSPS cities, identified by blue dots and population in red labels, are in proximity to the proposed location. The blue star in the coast represents the onshore substation that will connect the subsea cable, which will distribute the transmission lines to the cities. The length of the proposed subsea cable would be 11.80 km for this location. Figure 14b presents the average hourly power output for each month from one proposed wind turbine in that location. Results indicate that for all periods there is good power output, ranging from 50–70% capacity factor. From May to August, this location generates the best power output with small hourly variability. From September to February, the power output increases variability with the power capacity factor in ranges of 50–60%. March and April increase the power output, but variability increases significantly. On variable months, higher power output is present at night times. The system will require an energy storage system to provide a constant electricity supply to PSPS cities.
A maximum distance of 165 km was considered for this analysis (from the onshore substation). This distance range encompasses 123 PSPS cities with more than 1,100,000 cumulative population, as displayed in Figure 15. If a shorter threshold of 140 km (from the substation) is evaluated, 90 PSPS cities, with a cumulative population of half a million, can be served. A further reduction to 100 km will bring the number of PSPS cities to 40 with a cumulative population of 100,000. However, if we reduce the distance to 70 km, the number of PSPS cities that can be served was significantly reduced to 20 with a cumulative population of almost 50,000. This analysis demonstrates the challenges on the placement of offshore turbines, on which optimum wind locations close to the coast might be at significant distance from PSPS cities. A suitable balance must be found between distance to PSPS cities, which affects power transmission costs, and optimal power locations, which determines power output.
Considering the complex constraints for offshore wind energy to supply PSPS cities in California, as highlighted in previous sections, a multisite analysis was performed as presented in Figure 16. Three locations that have optimal wind potential, closeness to the coast, and proximity to PSPS cities were evaluated. The GIS methodology evaluated locations along California’s coast, evaluating the proximity to generation and consumption, while simultaneously reducing the distance to the coast, minimizing subsea cable costs. Each location will have a restricted number of offshore wind turbines to satisfy the demand of local PSPS cities and potentially could be used to supply remote locations with excess power, to leverage total installation and operation costs. Considering the large number of cities with small populations and their spatial dispersion, a distributed system with several wind turbines serving the location may be a good solution. Option 2 had fewer PSPS cities in their vicinity but better wind potential in proximity to the coast. Potentially, a location to the south of Option 2 might have reduced the distance to PSPS cities, but the reduction on the wind power potential or the extension of the subsea cable would have made the location suboptimal. The subsea cable dimensions for the three locations would be 19.5 km (Option 1), 15.5 km (Option 2), and 9 km (Option 3), which are important criteria to evaluate the economic feasibility of the proposed distributed system.
Average hourly power output per month for one wind turbine at each of the three locations are represented in the bar charts in Figure 17. A general comparison between the three options indicate that Options 2 and 3 have higher power output with smaller variation than Option 1. However, as indicated by Figure 16, Option 1 has a larger number of high population PSPS cities in proximity. On the other hand, Option 2 provides higher wind power output, but PSPS cities are located farther away. Figure 17a indicates that the power output for Option 1 has a lower power output from September to February and a higher power output and high variability from March to August. Option 2 provides an overall higher power output, as highlighted by Figure 17b, with summer months (May to August) reaching capacity factors higher than 80%, for several hourly periods. This option displays large variability from September to November and low overall values in winter. Results presented in Figure 17c for Option 3 indicate an overall high-power output, with some average hourly values from June to August reaching almost 3 MW. From September to November and from March to April power output ranges from 2–2.5 MW, with higher variability. December and January present the lowest power output of the year with medium variability. All systems will require energy storage to handle variability and provide interconnected cities with stable power.
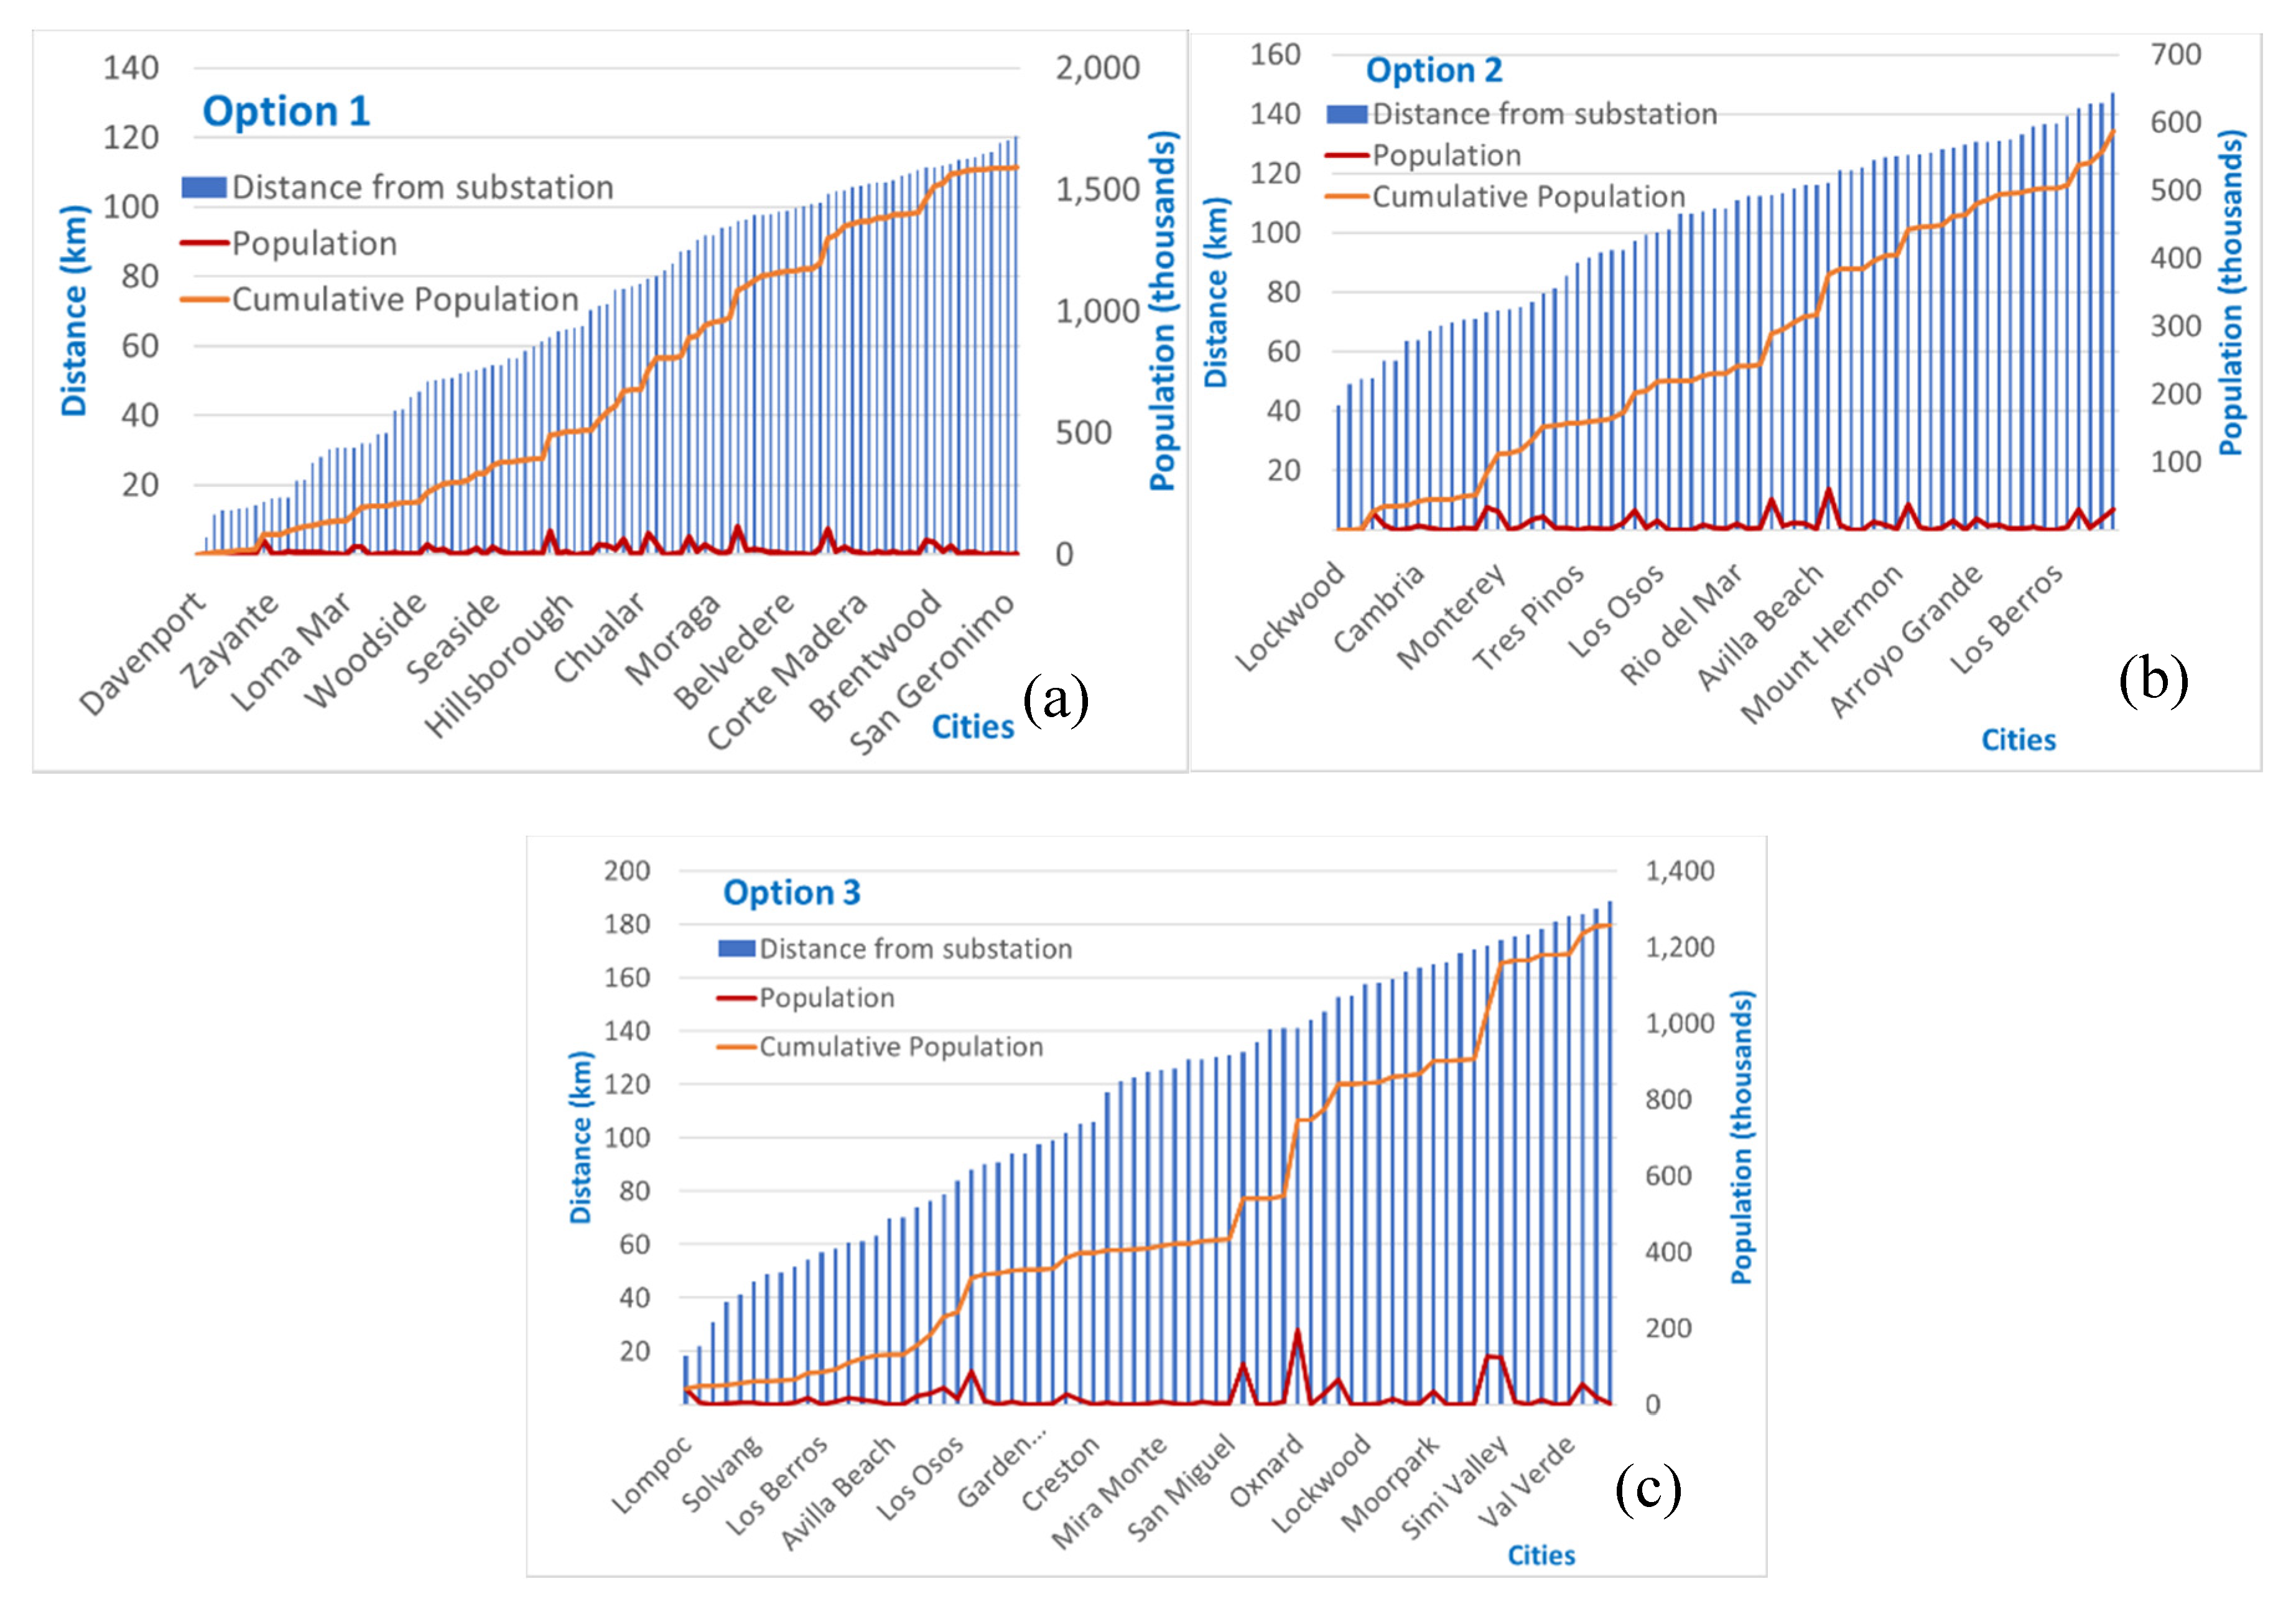
A GIS distance and population analysis from onshore substation to PSPS cities highlights important results, as presented in Figure 18. For the three alternatives, Option 1 benefits the largest cumulative population of PSPS cities at the shortest distances. Option 1 serves more than a hundred PSPS cities, with a cumulative population of 1.5 million, with a distance threshold 120 km from the onshore substation, as displayed by Figure 18a. Furthermore, at ranges of 50 km more than 30 cities with a cumulative population of almost 300,000 can be served by this option. On the other hand, Option 2, despite having the highest power output performance of the considered options, has disadvantages in the distance analysis, as exhibited in Figure 18b. In this case, only 70 cities, with a lower cumulative population of almost 600,000, are in a range of 150 km. If the distance drops to 100 km, the population served is cut by one third. This situation showcases the complexities of the application of offshore wind to serve PSPS cities. The last option considered has a very good power output performance and it is an improvement in the distance analysis when compared with Option 2. The results for Option 3 are exhibited in Figure 18c, with 50 PSPS cities, with a cumulative population of almost 900,000 at less than 150 km. When the distance decreases to 100 km, the served cumulative population is almost 400,000, twice as much when compared with Option 2. Option 3 is capable to serve a population of 100,000 in PSPS cities at a 60 km distance, which is an improvement when compared with Option 2.
The presented analysis highlights how balancing optimum offshore wind power output, reducing distance with the coast and minimizing separation from PSPS cities, creates a complex GIS analysis. Further inclusion of economic factors will be beneficial to better assess the optimal mix of wind energy for each location [43]. Some locations may benefit from the supply of existing wind farms as well as onshore and offshore new wind turbines. Other PSPS cities might be better served by one or a combination of two of the proposed wind energy resources. The GIS methodology developed in this research will be ideally placed to aid in the decision for the best alternative for each location. Since wind resources have high seasonal and hourly variability, as indicated in this research, the implementation of a correctly sized storage system will aid to avoid power intermittency and provide a stable source of electricity for local communities.
5. Conclusions
This research identified a significant number of cities in California that have good local wind energy potential, and high blackout and wildfire risks. The wildfire risks and blackout risks were evaluated, finding that more than 52% of all the cities in California are at risk of blackout, while less than 24% are at risk of wildfire. Therefore, the risk of blackout is higher and more prevalent than the wildfire risk. In fact, many cities with no wildfire risk have high blackout risk due to the design of transmission grids and circuits in electric systems in California, finding that up to 80% of all high voltage (higher than 200 kV) transmission lines are at risk of disconnection due to wildfires. The GIS analysis developed in this research overlaid data for cities, PSPS areas, CPUC areas, and wind energy optimal locations, as well as infrastructure data to identify communities that would significantly benefit from the implementation of local wind energy projects. The electricity generated from the wind is capable of supplying them to avoid blackouts. Utilization of energy storage systems increases the reliability on the supply of electricity to many communities.
General and particular GIS analysis on the diverse opportunities to supply PSPS cities with existing wind farms or potential new onshore and offshore wind turbines was performed. Results indicated that many smaller cities (population < 10,000) are affected by PSPS with high areas, making them more susceptible to wildfire blackouts. Although 10 million people reside in PSPS and over 80% has wind farms closer than 100 km, many small cities are at longer distances, making larger cities better candidates to connect with existing wind farms. A significant number of smaller PSPS cities (population > 10,000) have, therefore, a more complex situation, farther away from existing wind farms. Installing new wind turbines in optimal onshore and offshore locations may aid many of these communities to avoid blackouts. GIS analysis on the benefits that PSPS cities may receive from California’s premium offshore wind energy potential were evaluated (capacity factor > 50% for significant periods). For all cases, the use of distributed wind systems, with a small number of wind turbines installed in a large number of optimal locations, was suggested as a better solution. The GIS system developed in this research will provide a good tool to perform analysis on these distributed systems.
The research indicated that interconnecting local wind resources with PSPS cities will generate shorter transmission lines than the current power lines in PSPS and CPUC areas. Results indicated that more than 200 cities, with a cumulative population higher than 5’500,000, can be served by existing onshore wind farms at a threshold of 50 km. An analysis for future offshore wind farms indicated that one offshore wind farm may benefit more than 100 cities, with a cumulative population of more than one million. The research suggest that investments required for the proposed distributed local wind systems would be lower than the cost required to upgrade the outdated local electrical grid, considering that it will cost between $1–$23 million dollars per mile to underground power lines. The development of these projects, coupled with subterranean transmission lines and energy storage capabilities, could improve the safety of the communities, reduce the risk of wildfires caused by transmission lines, and generate electricity from sustainable sources. The methodologies proposed in this research could be applied to evaluate local wind energy potential for a wide range of locations in the United States and all over the world.
Future research will need to include the financial and economic analysis for the interconnection with the existing wind farms or new offshore and onshore wind turbines indicated by the GIS methodology developed in this research. Many PSPS cities could decrease their upgrade cost for transmission lines by interconnecting with local wind energy resources. The GIS framework developed in this research will be a useful tool to perform specific analyses for each wind energy location to supply cities inside PSPS zones.
Funding
This research received no external funding.
Acknowledgments
I would like to gratefully acknowledge the support of the College of Business Administration at Texas A&M University Kingsville.
Conflicts of Interest
The author declares no conflict of interest.
Abbreviations
| CFSR | Climate Forecast System Reanalysis |
| CPUC area | Fire-Threat areas (2 and 3) according to the California Public Utilities Commission |
| DTU | Technical University of Denmark |
| GIS | Geographic Information Systems |
| NOOA | U.S. National Oceanic and Atmospheric Administration |
| PG&E | Pacific Gas and Electric Company–providing electric power in Northern California |
| PSPS | Public Safety Power Shutoff area |
| QGIS | Quantum GIS. Open-source GIS application |
| SCE | Southern California Edison-providing electric power in Southern California |
References
- Mitchell, J.W. Power line failures and catastrophic wildfires under extreme weather conditions. Eng. Fail. Anal. 2013, 35, 726–735. [Google Scholar] [CrossRef]
- Kousky, C.; Greig, K.; Lingle, B.; Kunreuther, H. Wildfire Costs in California: The Role of Electric Utilities. Wharton Risk Center, 2018. Available online: https://riskcenter.wharton.upenn.edu/wp-content/uploads/2018/08/Wildfire-Cost-in-CA-Role-of-Utilities-1.pdf (accessed on 2 January 2020).
- Cal Fire. GIS Data. 2019. Available online: https://frap.fire.ca.gov/mapping/gis-data/ (accessed on 2 January 2020).
- CalFire. Top 20 Most Destructive California Wildfires. 2019. Available online: https://www.fire.ca.gov/media/5511/top20_destruction.pdf (accessed on 2 January 2020).
- Rice, D. USA had world’s 3 costliest natural disasters in 2018, and Camp Fire was the worst. USA TODAY. 8 January 2019. Available online: https://www.usatoday.com/story/news/2019/01/08/natural-disasters-camp-fire-worlds-costliest-catastrophe-2018/2504865002/ (accessed on 2 January 2020).
- Sommer, L. Are Blackouts the Future for California? National Public Radio (NPR). Energy 2019. Available online: https://www.npr.org/2019/10/21/771280208/are-blackouts-the-future-for-california (accessed on 2 January 2020).
- Most, W.B.; Weissman, S. Trees and Power Lines: Minimizing Conflicts between Electric Power Infrastructure and the Urban Forest; Center for Law, Energy & the Environment Berkeley Law: University of California, Berkeley, CA, USA, 2012. [Google Scholar]
- Garcetti, E.; Feuer, M.H.M. Re: It Only Takes a Spark: Enhancing DWP’s Wildfire Prevention Strategy; LA Comptroller Office: Los Angeles, CA, USA, 2019. [Google Scholar]
- Syphard, A.; Keeley, J. Location, timing and extent of wildfire vary by cause of ignition. Int. J. Wildland Fire 2015, 24, 37–47. [Google Scholar] [CrossRef]
- Hall, K.L. Out of Sight, Out of Mind 2012: An Updated Study on the Undergrounding of Overhead Power Lines. A Report Prepared for Edison Electric Institute. 2013. Available online: http://www.eei.org (accessed on 2 January 2020).
- Sandler, R. PG&E Says Faulty Power Lines May Have Sparked 2 California Wildfires. Forbes Magazine. 28 October 2019. Available online: https://www.forbes.com/sites/rachelsandler/2019/10/28/pge-says-faulty-power-lines-may-have-sparked-2-california-wildfires/#2a7f34bf2584 (accessed on 2 January 2020).
- PG&E Public Safety Power Shut off (PSPS) Planning Maps. 2020. Available online: https://www.pge.com/en_US/safety/emergency-preparedness/natural-disaster/wildfires/psps-planning-maps.page (accessed on 4 December 2019).
- SCE. Southern California Edison Company’s Progress Report on the Implementation of De-energization Guidelines set forth in Appendix “A” of Decision 19-05-042. 2019. Available online: https://www.cpuc.ca.gov/uploadedFiles/CPUCWebsite/Content/News_Room/NewsUpdates/2019/SCE_PSPSProgressReport.pdf (accessed on 31 March 2020).
- SCE. Public Safety Power Shut off (PSPS) Planning Maps. SCE Document library, 2020. Available online: http://www.sce.com/maps (accessed on 31 March 2020).
- CPUC. FireMap Tier 2 and Tier 3 Fire-Threat Areas GIS Data. 2020. Available online: https://ia.cpuc.ca.gov/firemap/ (accessed on 9 December 2019).
- USCB-US Census Bureau Mapping Files. TIGER/Line Shapefiles; U.S. Department of Commerce Geography Division, U.S. Census Bureau, 2019. Available online: https://www.census.gov/geographies/mapping-files/time-series/geo/tiger-line-file.html (accessed on 6 January 2020).
- USCB-US Census Bureau Centers of Population. 2010. Available online: https://www.census.gov/geographies/reference-files/time-series/geo/centers-population.html (accessed on 6 January 2020).
- Vestas Wind Systems. General Description 3MW Platform. In Power curves. Eastern Fields Wind Power Project; Design and Operations Report; Vestas Wind Systems A/S: Aarhus, Denmark, 2017.
- Vestas-Vestas Wind Systems 4 MW Platform. 02/2020-EN. 2020. Available online: http://nozebra.ipapercms.dk/Vestas/Communication/Productbrochure/4MWbrochure/4MWProductBrochure/?page=2 (accessed on 2 March 2020).
- Onea, F.; Rusu, E. An Assessment of Wind Energy Potential in the Caspian Sea. Energies 2019, 12, 2525. [Google Scholar] [CrossRef] [Green Version]
- AWEA-American Wind Energy Association. WindIQ Database; American Wind Energy Association: Washington, DC, USA, 2020; Available online: https://windiq.awea.org/ (accessed on 6 March 2020).
- Rampion. Rampion Offshore Wind Farm. Presentation Overview. October 2017. Available online: https://www.rampionoffshore.com/app/uploads/2017/11/General-Rampion-Presentation (accessed on 3 March 2020).
- Rojowsky, K.; Beaucage, P.; Johanson, C. Generation Profiles for Operational Plants. Ref. No.: 17-12-019252; Technical report. ERCOT Wind Patterns for Existing Sites, 1980–2017; Electric Reliability Council of Texas (ERCOT): Taylor, TX, USA, 6 September 2018; Available online: http://www.ercot.com/gridinfo/resource (accessed on 3 February 2020).
- NOAA. Climate Forecast System Reanalysis CFSR. NARR, 2019. Available online: https://www.ncdc.noaa.gov/data-access/model-data/model-datasets/reanalysis (accessed on 9 September 2019).
- DTU. Global Wind Atlas 3.0; Technical University of Denmark: Lyngby, Denmark; World Bank Group; Vortex, 2019; Available online: https://globalwindatlas.info/ (accessed on 13 November 2019).
- Hayajneh, H.S.; Zhang, X. Logistics Design for Mobile Battery Energy Storage Systems. Energies 2020, 13, 1157. [Google Scholar] [CrossRef] [Green Version]
- Boretti, A. Energy storage requirements to address wind energy variability. Energy Storage 2019, 1, 77. [Google Scholar] [CrossRef] [Green Version]
- HIFLD-Homeland Infrastructure Foundation Level Data. Electric Power Transmission Lines; GeoPlatform-Federal Geographic Data Committee (FGDC), 24 September 2019. Available online: https://hifld-geoplatform.opendata.arcgis.com/datasets/electric-power-transmission-lines (accessed on 13 November 2019).
- Haces-Fernandez, F.; Martinez, A.; Camacho, L.; Ramirez, D.; Su, H.; Li, H. GIS based tool for analyzing US wind farms development. IIE Annual Conference. Proceedings; Institute of Industrial and Systems Engineers (IISE), 2017; pp. 109–114. Available online: https://search.proquest.com/openview/0ed61cba9a9f510d9d1c10352bc65b9d/1?pq-origsite=gscholar&cbl=51908 (accessed on 13 November 2019).
- Hoen, B.D.; Diffendorfer, J.E.; Rand, J.T.; Kramer, L.A.; Garrity, C.P.; Hunt, H.E. United States Wind Turbine Database. U.S. Geological Survey, American Wind Energy Association, and Lawrence Berkeley National Laboratory data release: USWTDB V2.3; January 2020. Available online: https://eerscmap.usgs.gov/uswtdb (accessed on 14 January 2020).
- Díaz-Cuevas, P. GIS-Based Methodology for Evaluating the Wind-Energy Potential of Territories: A Case Study from Andalusia (Spain). Energies 2018, 11, 2789. [Google Scholar] [CrossRef] [Green Version]
- Ali, S.; Jang, C.-M. Selection of Best-Suited Wind Turbines for New Wind Farm Sites Using Techno-Economic and GIS Analysis in South Korea. Energies 2019, 12, 3140. [Google Scholar] [CrossRef] [Green Version]
- Gold, R. Superpower: One Man’s Quest to Transform American Energy Hardcover; Simon & Schuster: New York, NY, USA, 2019; Chapter 1; pp. 3–7. [Google Scholar]
- Sun, Y.; Ma, X.; Xu, J.; Bao, Y.; Liao, S. Efficient utilization of wind power: Long-distance transmission or local consumption? Front. Mech. Eng. 2017, 12, 440–455. [Google Scholar] [CrossRef]
- Jankowiak, C.; Zacharopoulos, A.; Brandoni, C.; Keatley, P.; MacArtain, P.; Hewitt, N. The Role of Domestic Integrated Battery Energy Storage Systems for Electricity Network Performance Enhancement. Energies 2019, 12, 3954. [Google Scholar] [CrossRef] [Green Version]
- Musial, W.; Beiter, P.; Tegen, S.; Smith, A. Potential Offshore Wind Energy Areas in California: An Assessment of Locations, Technology, and Costs (No. NREL/TP-5000-67414); National Renewable Energy Lab (NREL): Golden, CO, USA, 2016. [Google Scholar]
- Haces-Fernandez, F.; Li, H.; Jin, K. investigation into the possibility of extracting wave energy from the texas coast. Int. J. Energy A Clean Environ. 2019, 20, 23–41. [Google Scholar] [CrossRef]
- Haces-Fernandez, F.; Li, H.; Ramirez, D. Assessment of the Potential of Energy Extracted from Waves and Wind to Supply Offshore Oil Platforms Operating in the Gulf of Mexico. Energies 2018, 11, 1084. [Google Scholar] [CrossRef] [Green Version]
- Zheng, X.; Zheng, H.; Lei, Y.; Li, Y.; Li, W.; Zheng, L. An Offshore Floating Wind–Solar–Aquaculture System: Concept Design and Extreme Response in Survival Conditions. Energies 2020, 13, 604. [Google Scholar] [CrossRef] [Green Version]
- Penn, Ivan; Reed, Stanley (2018) Something New May Be Rising Off California Coast: Wind Farms. The New York Times. 19 October 2018. Available online: https://www.nytimes.com/2018/10/19/business/energy-environment/california-coast-wind-farms.html (accessed on 2 April 2020).
- Haces-Fernandez, F.; Li, H.; Ramirez, D. Assessment of Wind Energy in the United States Gulf of Mexico Area as Power Supply for Offshore Oil Platforms. In Proceedings of the Offshore Technology Conference, Houston, TX, USA, 30 April–3 May 2018; Society of Petroleum Engineers (SPE), 2018. Available online: https://www.onepetro.org/conference-paper/OTC-29044-MS (accessed on 2 April 2020).
- Kucuksari, S.; Erdogan, N.; Cali, U. Impact of Electrical Topology, Capacity Factor and Line Length on Economic Performance of Offshore Wind Investments. Energies 2019, 12, 3191. [Google Scholar] [CrossRef] [Green Version]
- Alabdullatif, A.; Gerding, E.; Perez-Diaz, A. Market Design and Trading Strategies for Community Energy Markets with Storage and Renewable Supply. Energies 2020, 13, 972. [Google Scholar] [CrossRef] [Green Version]
Figure 1.
Wildfires by power line failures (a) Proportion through time. (b) Acres burned. (c) Structures destroyed. Data from CalFire [3,4].

Figure 2.
Cities under Public Safety Power Shutoff (PSPS) zones with Tier 2 (Elevated) or Tier 3 (Extreme) California Public Utilities Commission (CPUC) Fire-Threat; (a) complete extend (b) zoom-in to selected red square.
Figure 2.
Cities under Public Safety Power Shutoff (PSPS) zones with Tier 2 (Elevated) or Tier 3 (Extreme) California Public Utilities Commission (CPUC) Fire-Threat; (a) complete extend (b) zoom-in to selected red square.

Figure 3.
(a) Power table Vestas V136-3.45. (b) California wind speeds Global Wind Atlas.
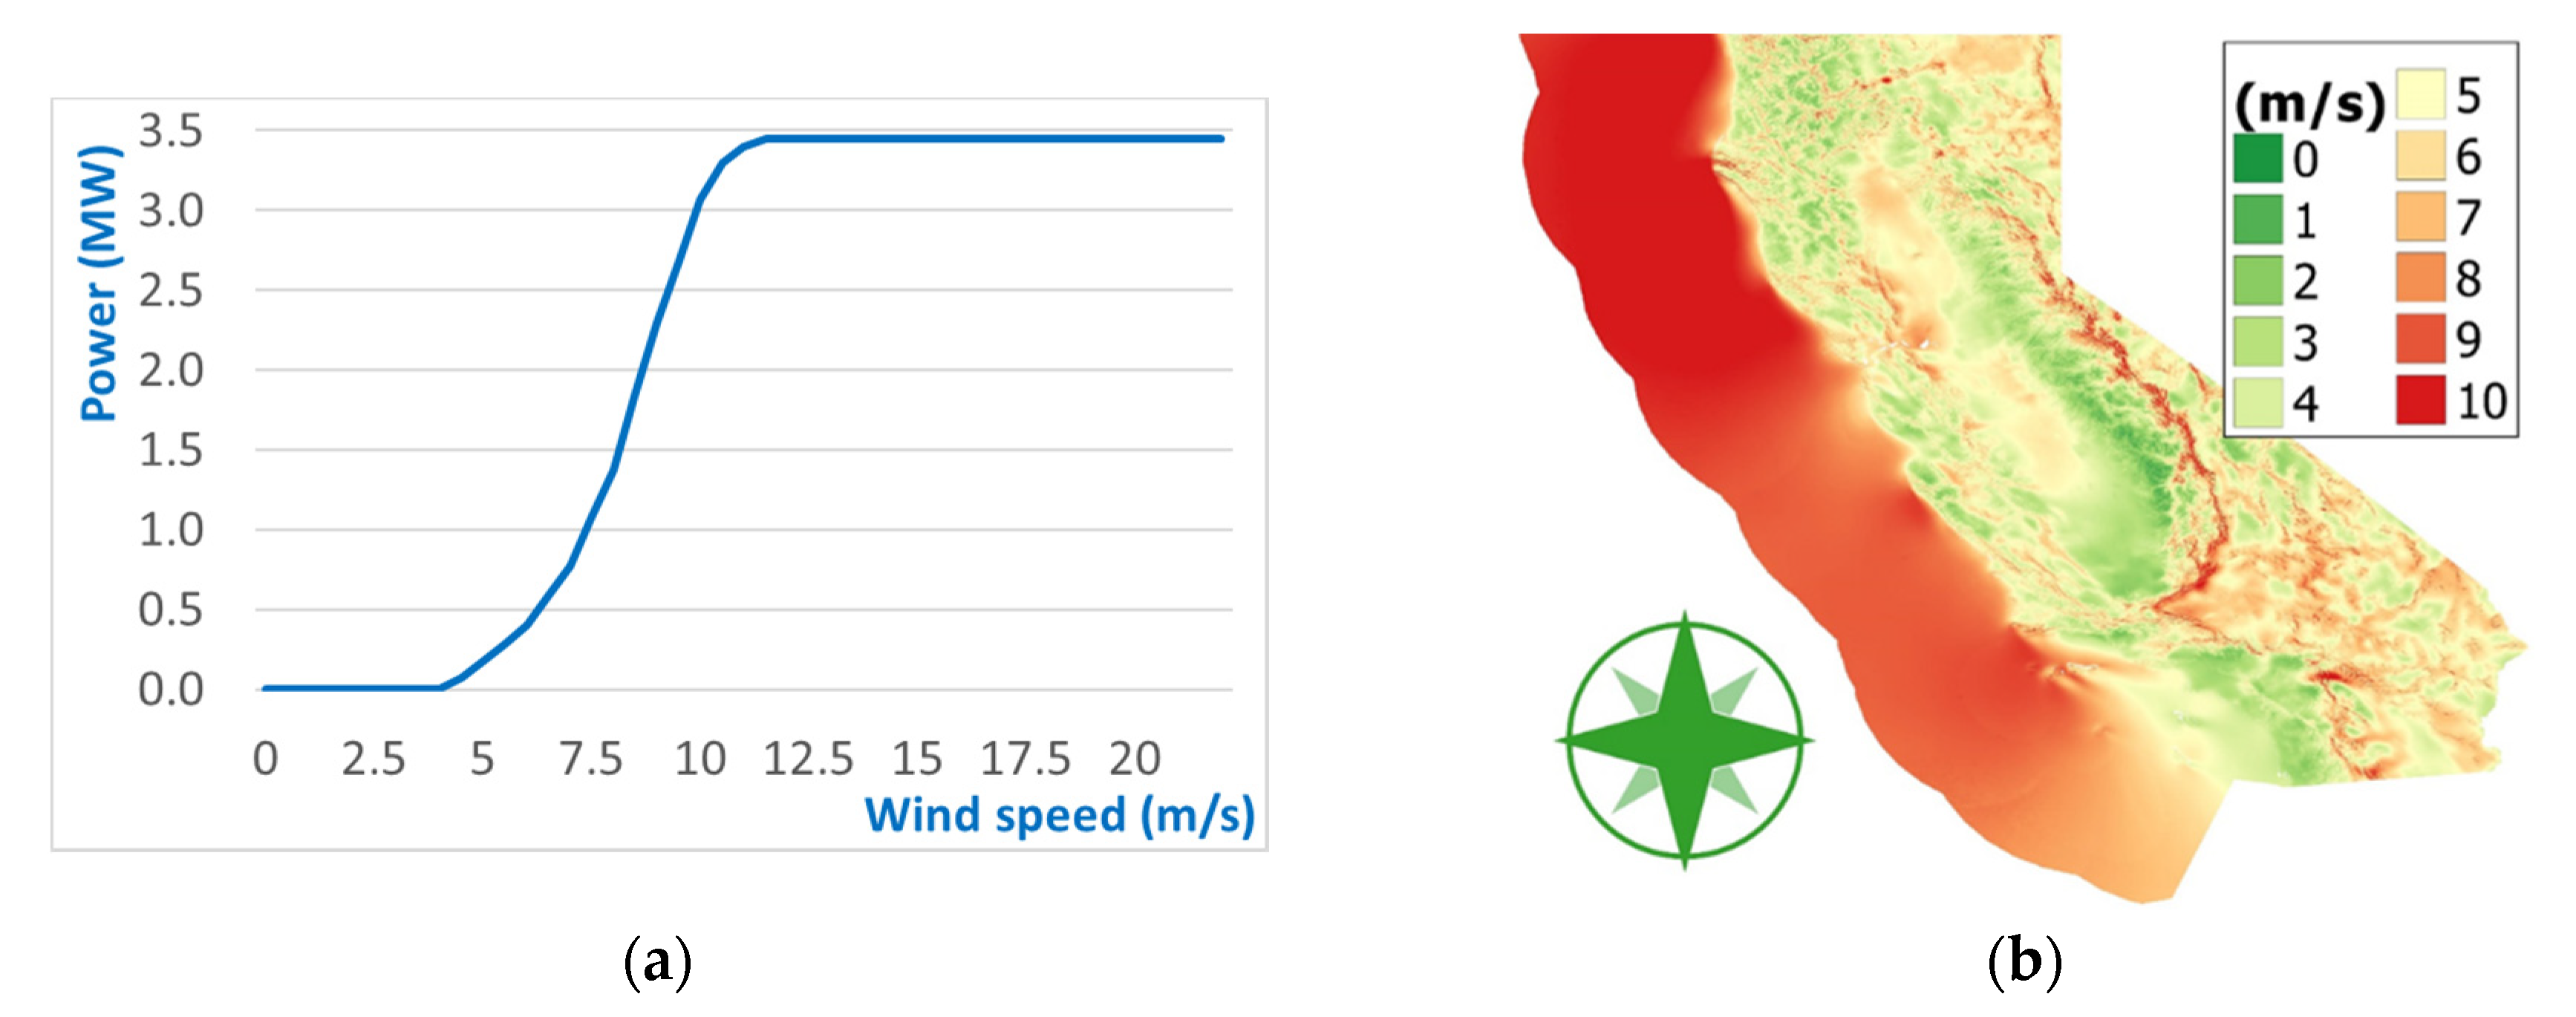
Figure 4.
Proportion of cities in California classified by population overlapping with (a) CPUC Fire-Threat areas and (b) PSPS by Pacific Gas and Electric Company (PG&E) and Southern California Edison (SCE).
Figure 4.
Proportion of cities in California classified by population overlapping with (a) CPUC Fire-Threat areas and (b) PSPS by Pacific Gas and Electric Company (PG&E) and Southern California Edison (SCE).

Figure 5.
(a) Map overlaying transmission lines with affected CPUC Threat 2 and 3 areas. (b) Stacked column bar chart with transmission lines (in thousands of km) affected by CPUC Threat 2 and 3 areas.
Figure 5.
(a) Map overlaying transmission lines with affected CPUC Threat 2 and 3 areas. (b) Stacked column bar chart with transmission lines (in thousands of km) affected by CPUC Threat 2 and 3 areas.

Figure 6.
Percentage of the areas of PSPS locations that are under (a) Tier 2 (Elevated) or (b) Tier 3 (Extreme) Fire-Threat according to the California Public Utilities Commission (CPUC).
Figure 6.
Percentage of the areas of PSPS locations that are under (a) Tier 2 (Elevated) or (b) Tier 3 (Extreme) Fire-Threat according to the California Public Utilities Commission (CPUC).

Figure 7.
Distance from closest wind farms for PSPS cities considering (a) cumulative population (b) number of cities classified by population.
Figure 7.
Distance from closest wind farms for PSPS cities considering (a) cumulative population (b) number of cities classified by population.

Figure 8.
Cities (with population label) close to the Alta Wind Farm. (a) Location map; (b) Geographic Information System (GIS) proximity and population analyses.
Figure 8.
Cities (with population label) close to the Alta Wind Farm. (a) Location map; (b) Geographic Information System (GIS) proximity and population analyses.

Figure 9.
Cities (with population label) close to the Hatchet Ridge. (a) Location map; (b) GIS proximity and population analyses.
Figure 9.
Cities (with population label) close to the Hatchet Ridge. (a) Location map; (b) GIS proximity and population analyses.
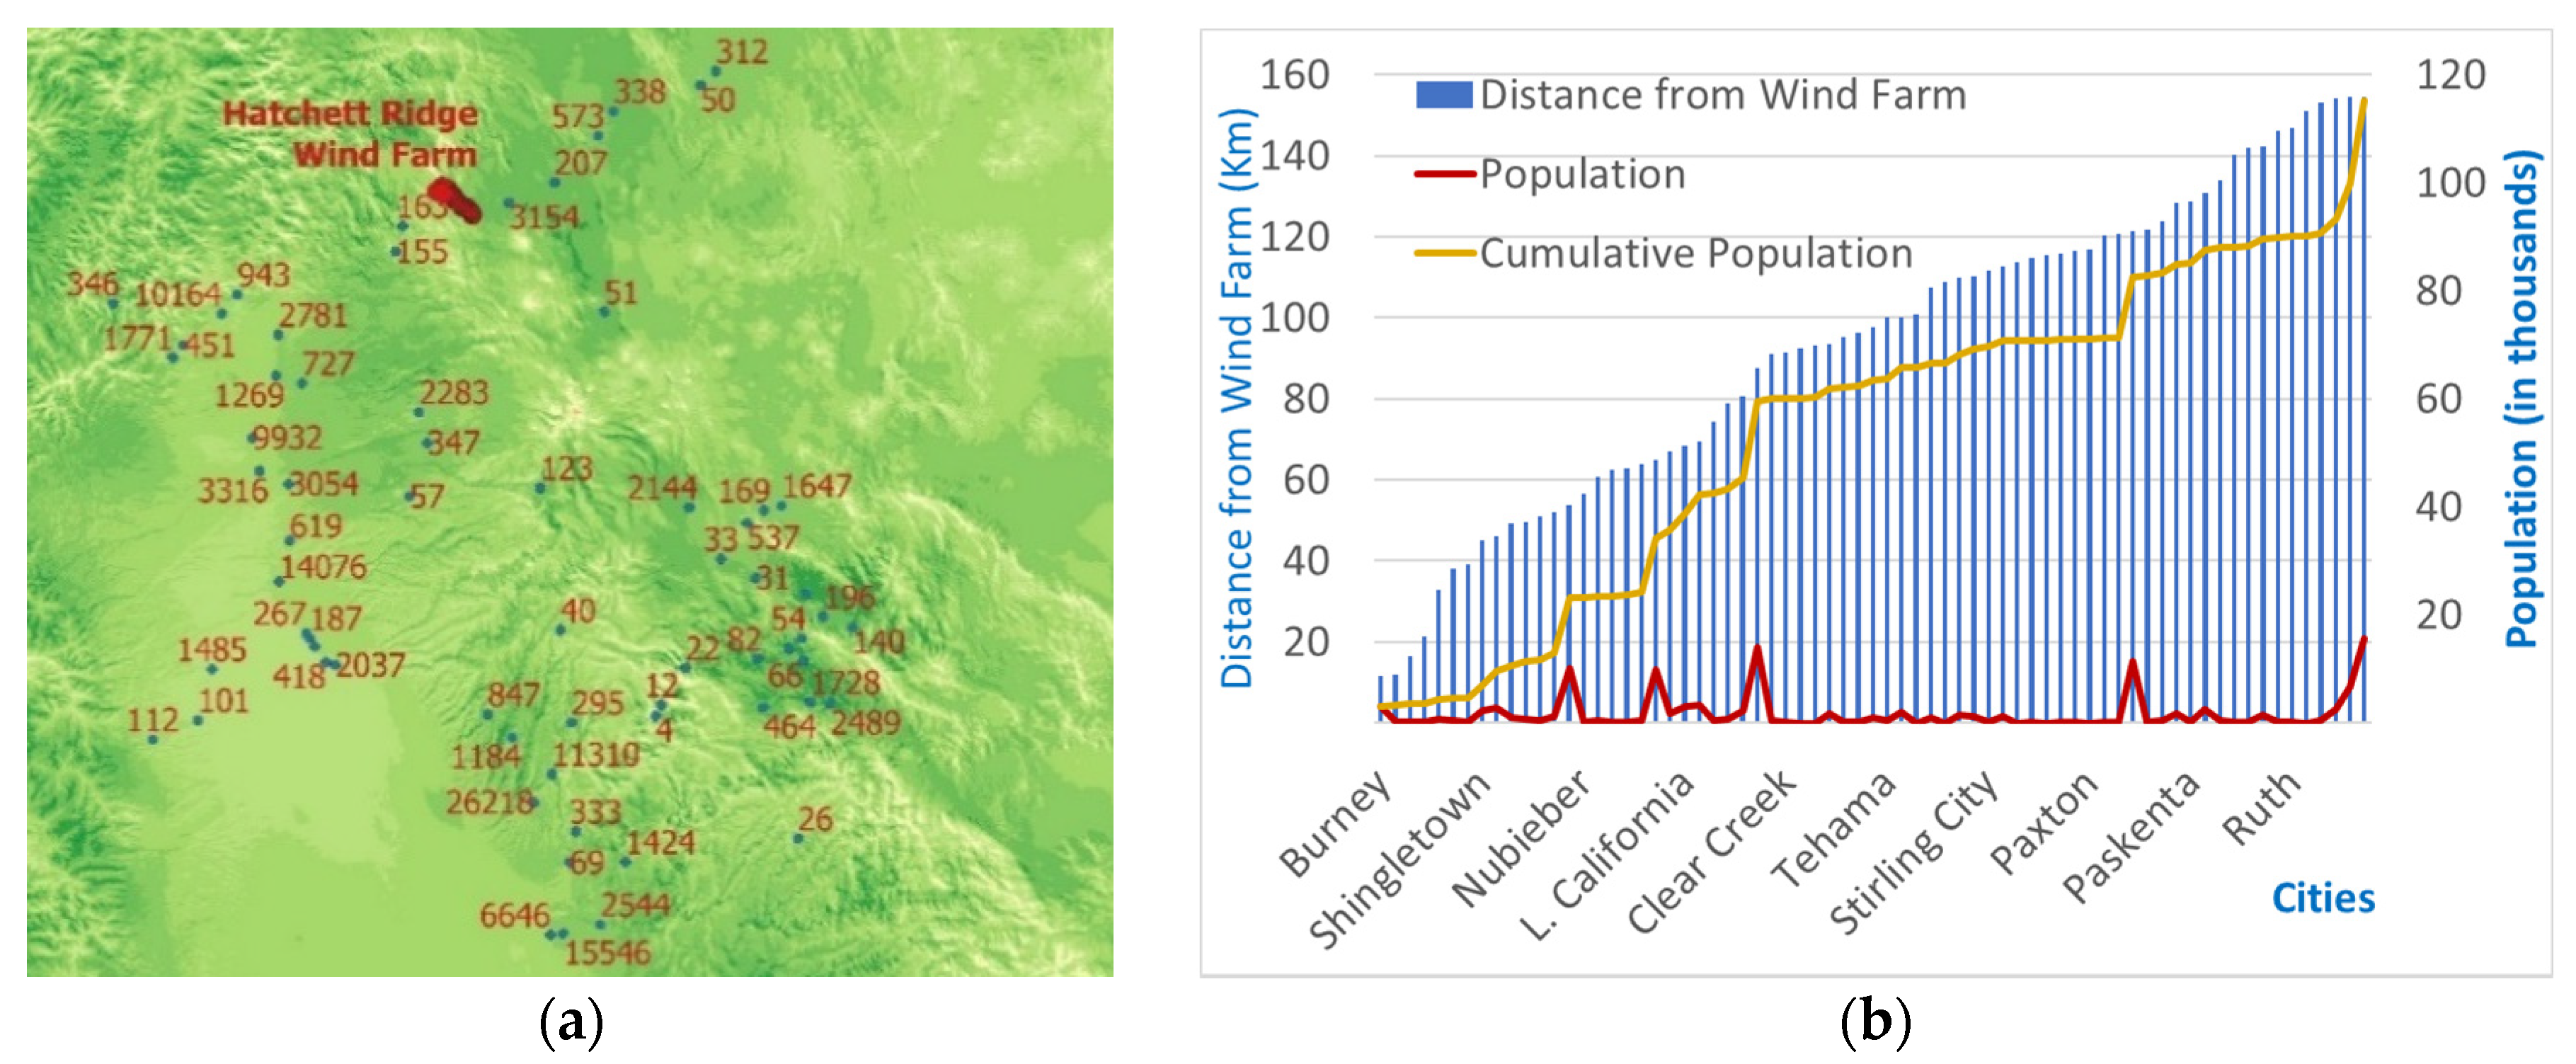
Figure 10.
PSPS Cities near to the proposed new wind turbines. (a) Location map; (b) average hourly power output per month for one wind turbine.
Figure 10.
PSPS Cities near to the proposed new wind turbines. (a) Location map; (b) average hourly power output per month for one wind turbine.

Figure 11.
Analysis of distance and population for proposed new wind turbine north of San Francisco area.
Figure 11.
Analysis of distance and population for proposed new wind turbine north of San Francisco area.
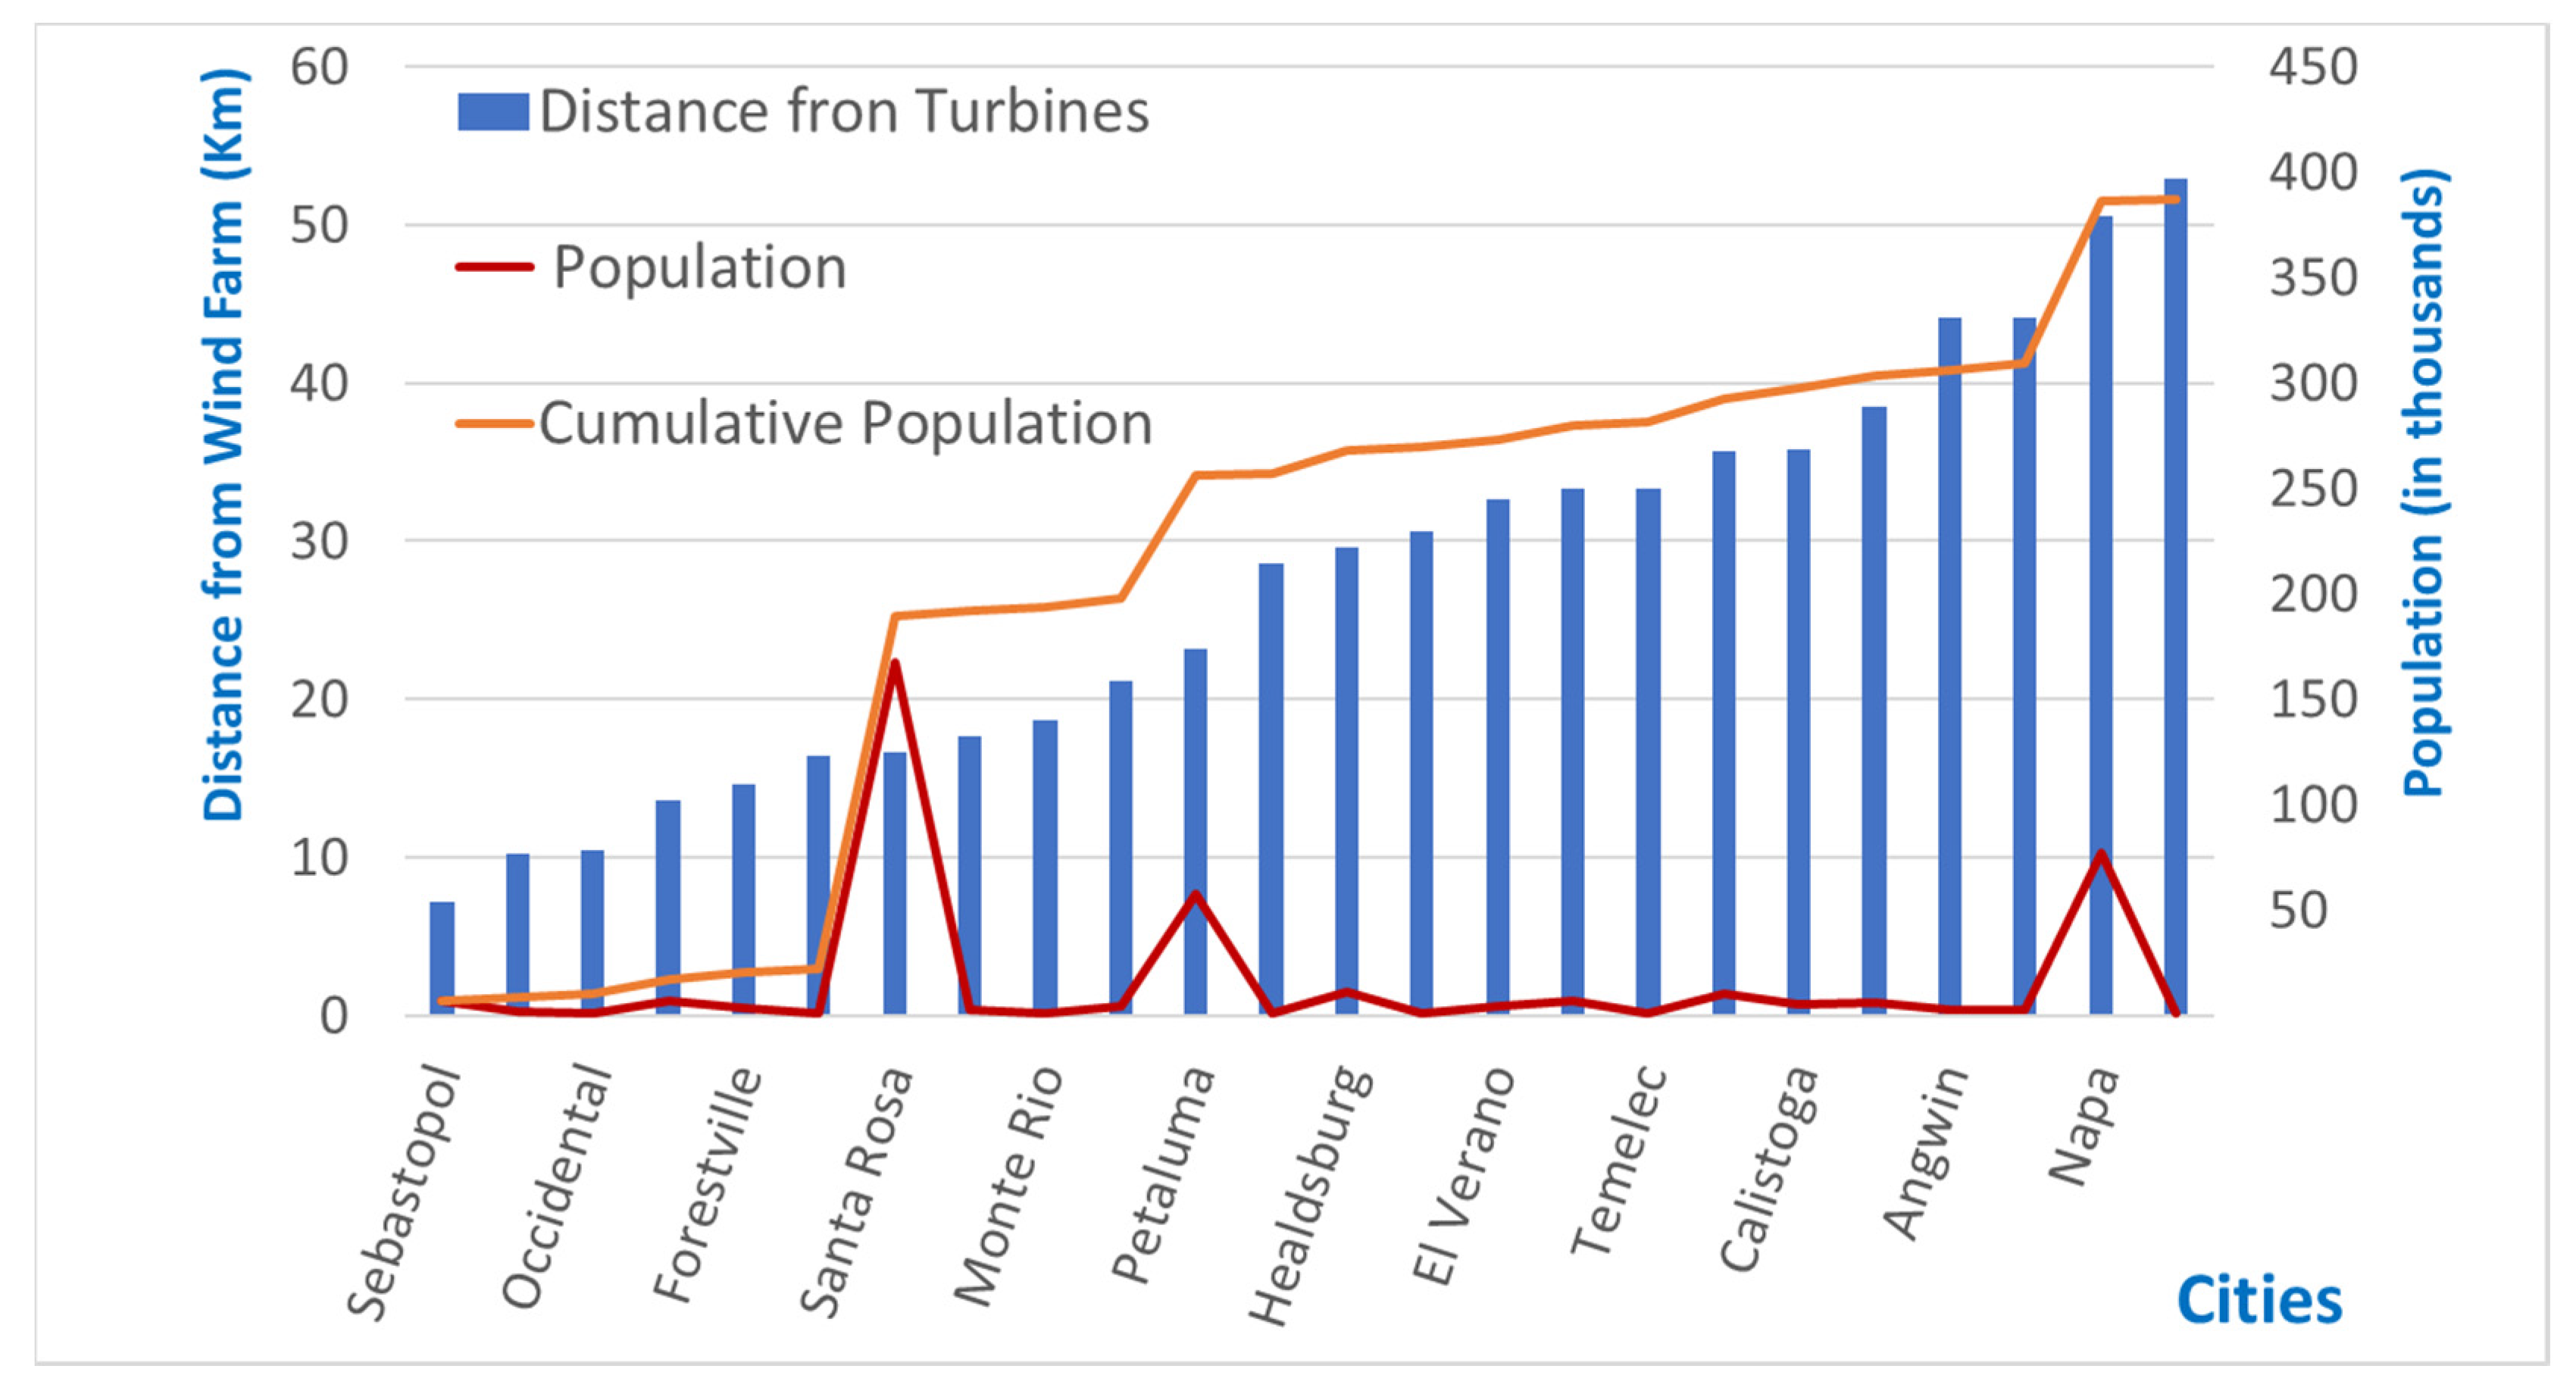
Figure 12.
PSPS Cities near to the proposed new wind turbines in Northeast California. (a) Location map; (b) average hourly power output per month for one wind turbine.
Figure 12.
PSPS Cities near to the proposed new wind turbines in Northeast California. (a) Location map; (b) average hourly power output per month for one wind turbine.
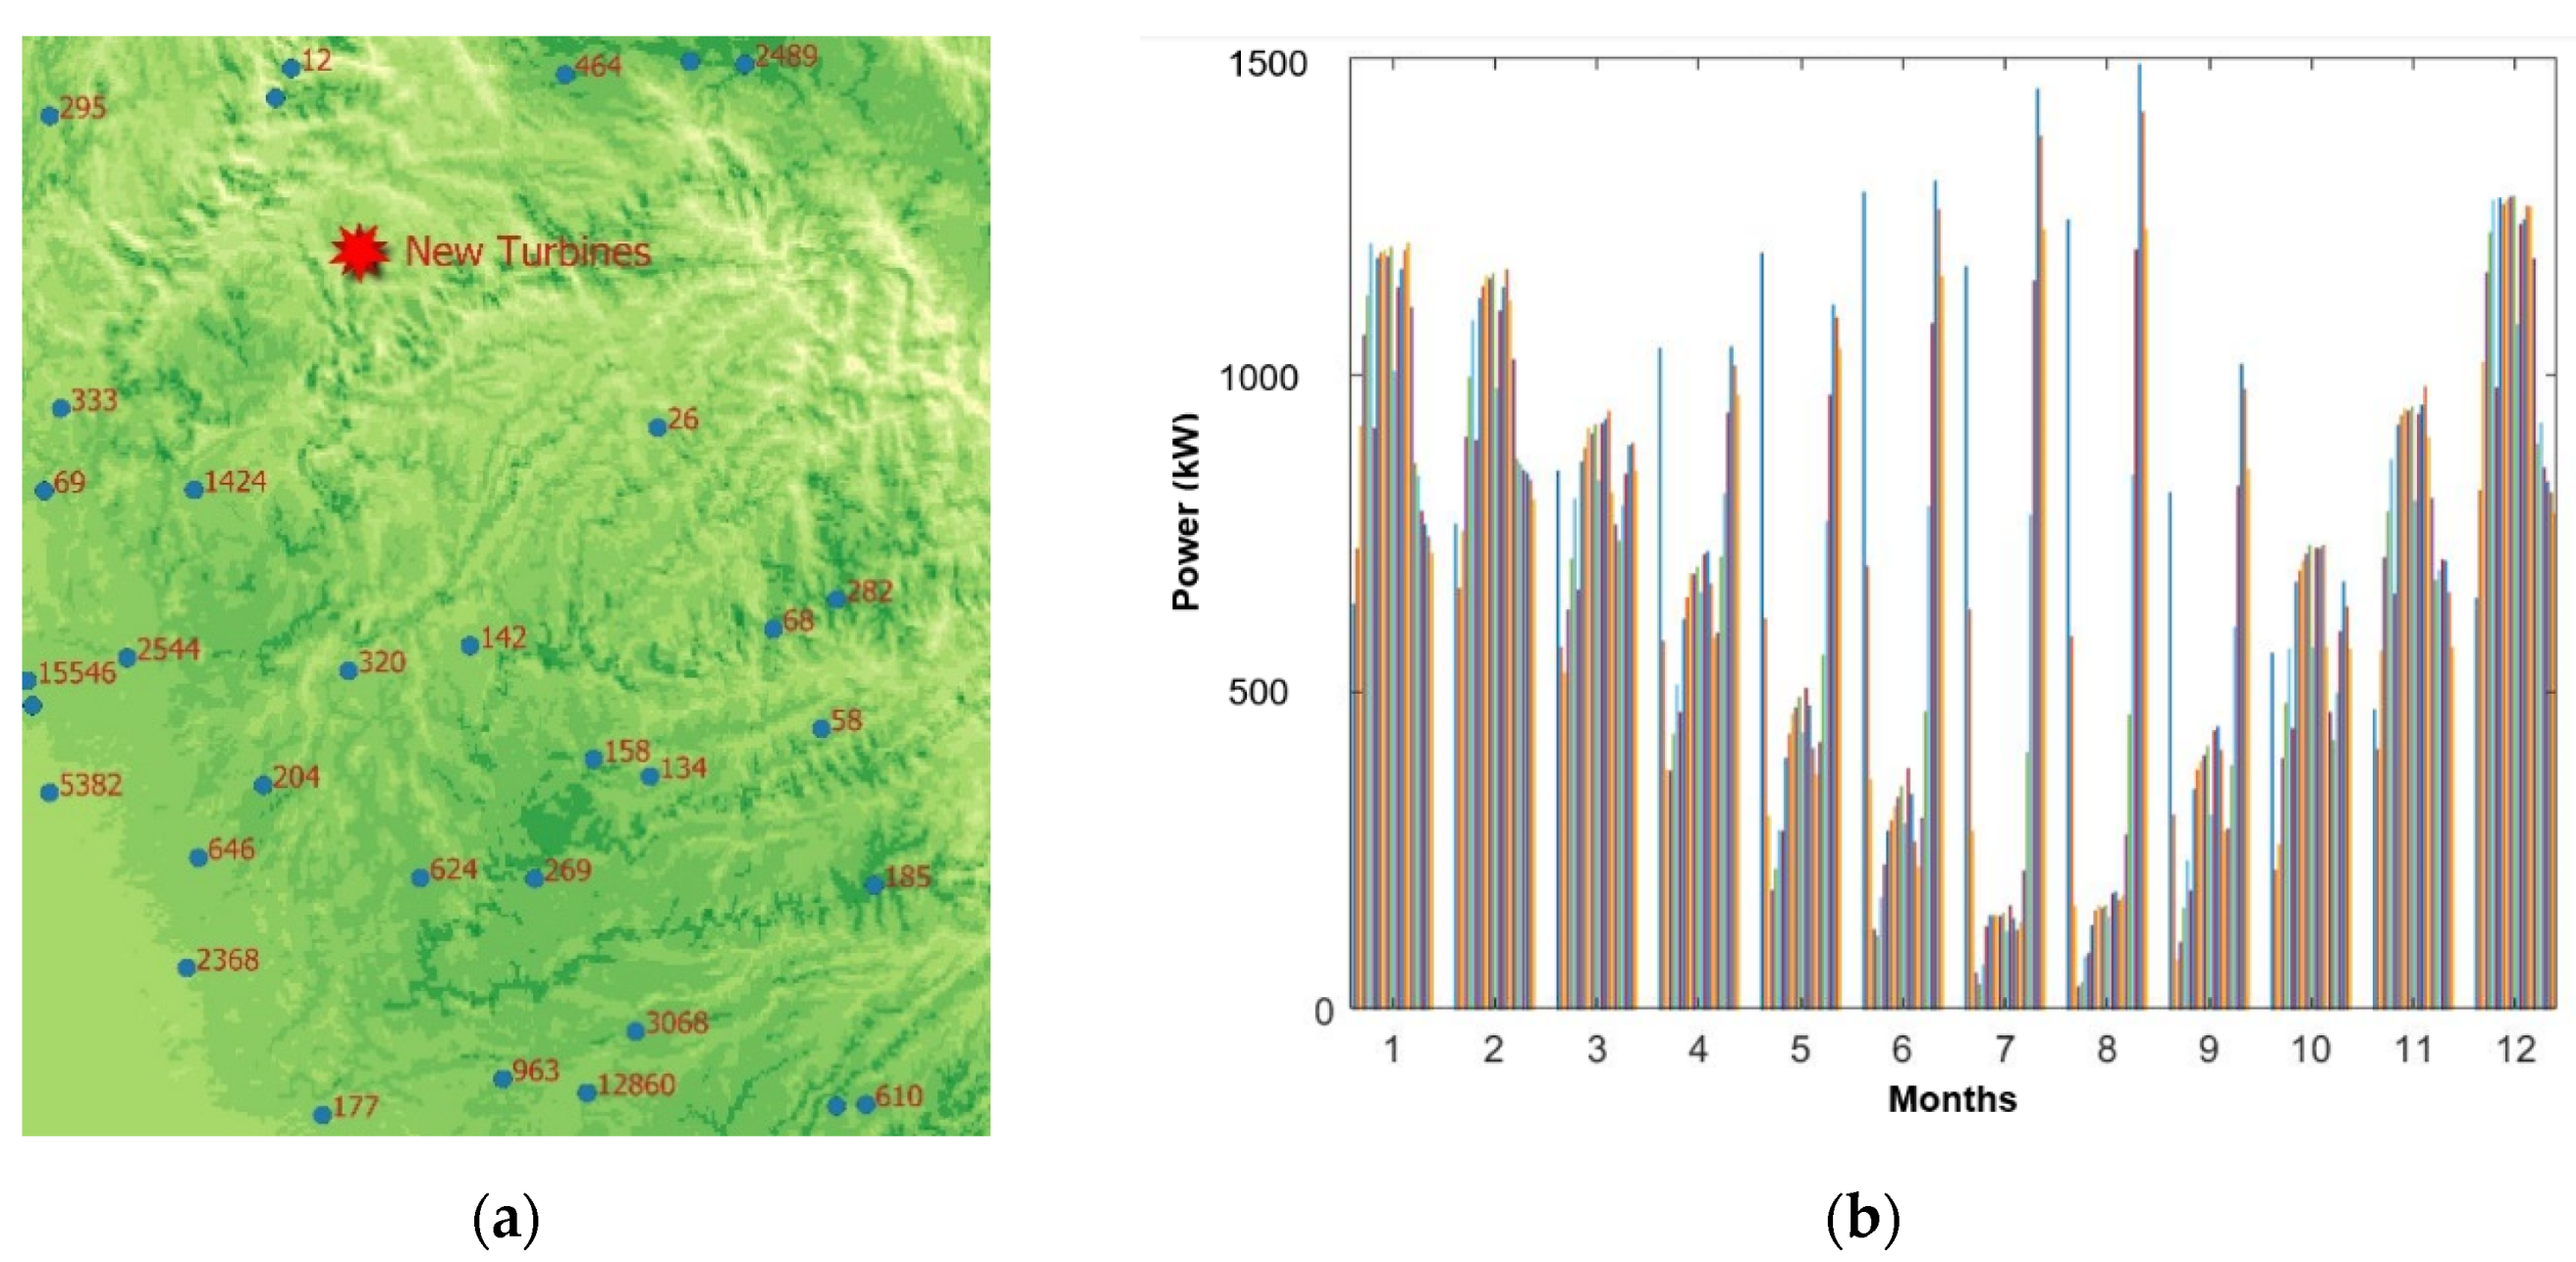
Figure 13.
Analysis of distance and population for proposed onshore wind turbines in Northeast California.
Figure 13.
Analysis of distance and population for proposed onshore wind turbines in Northeast California.
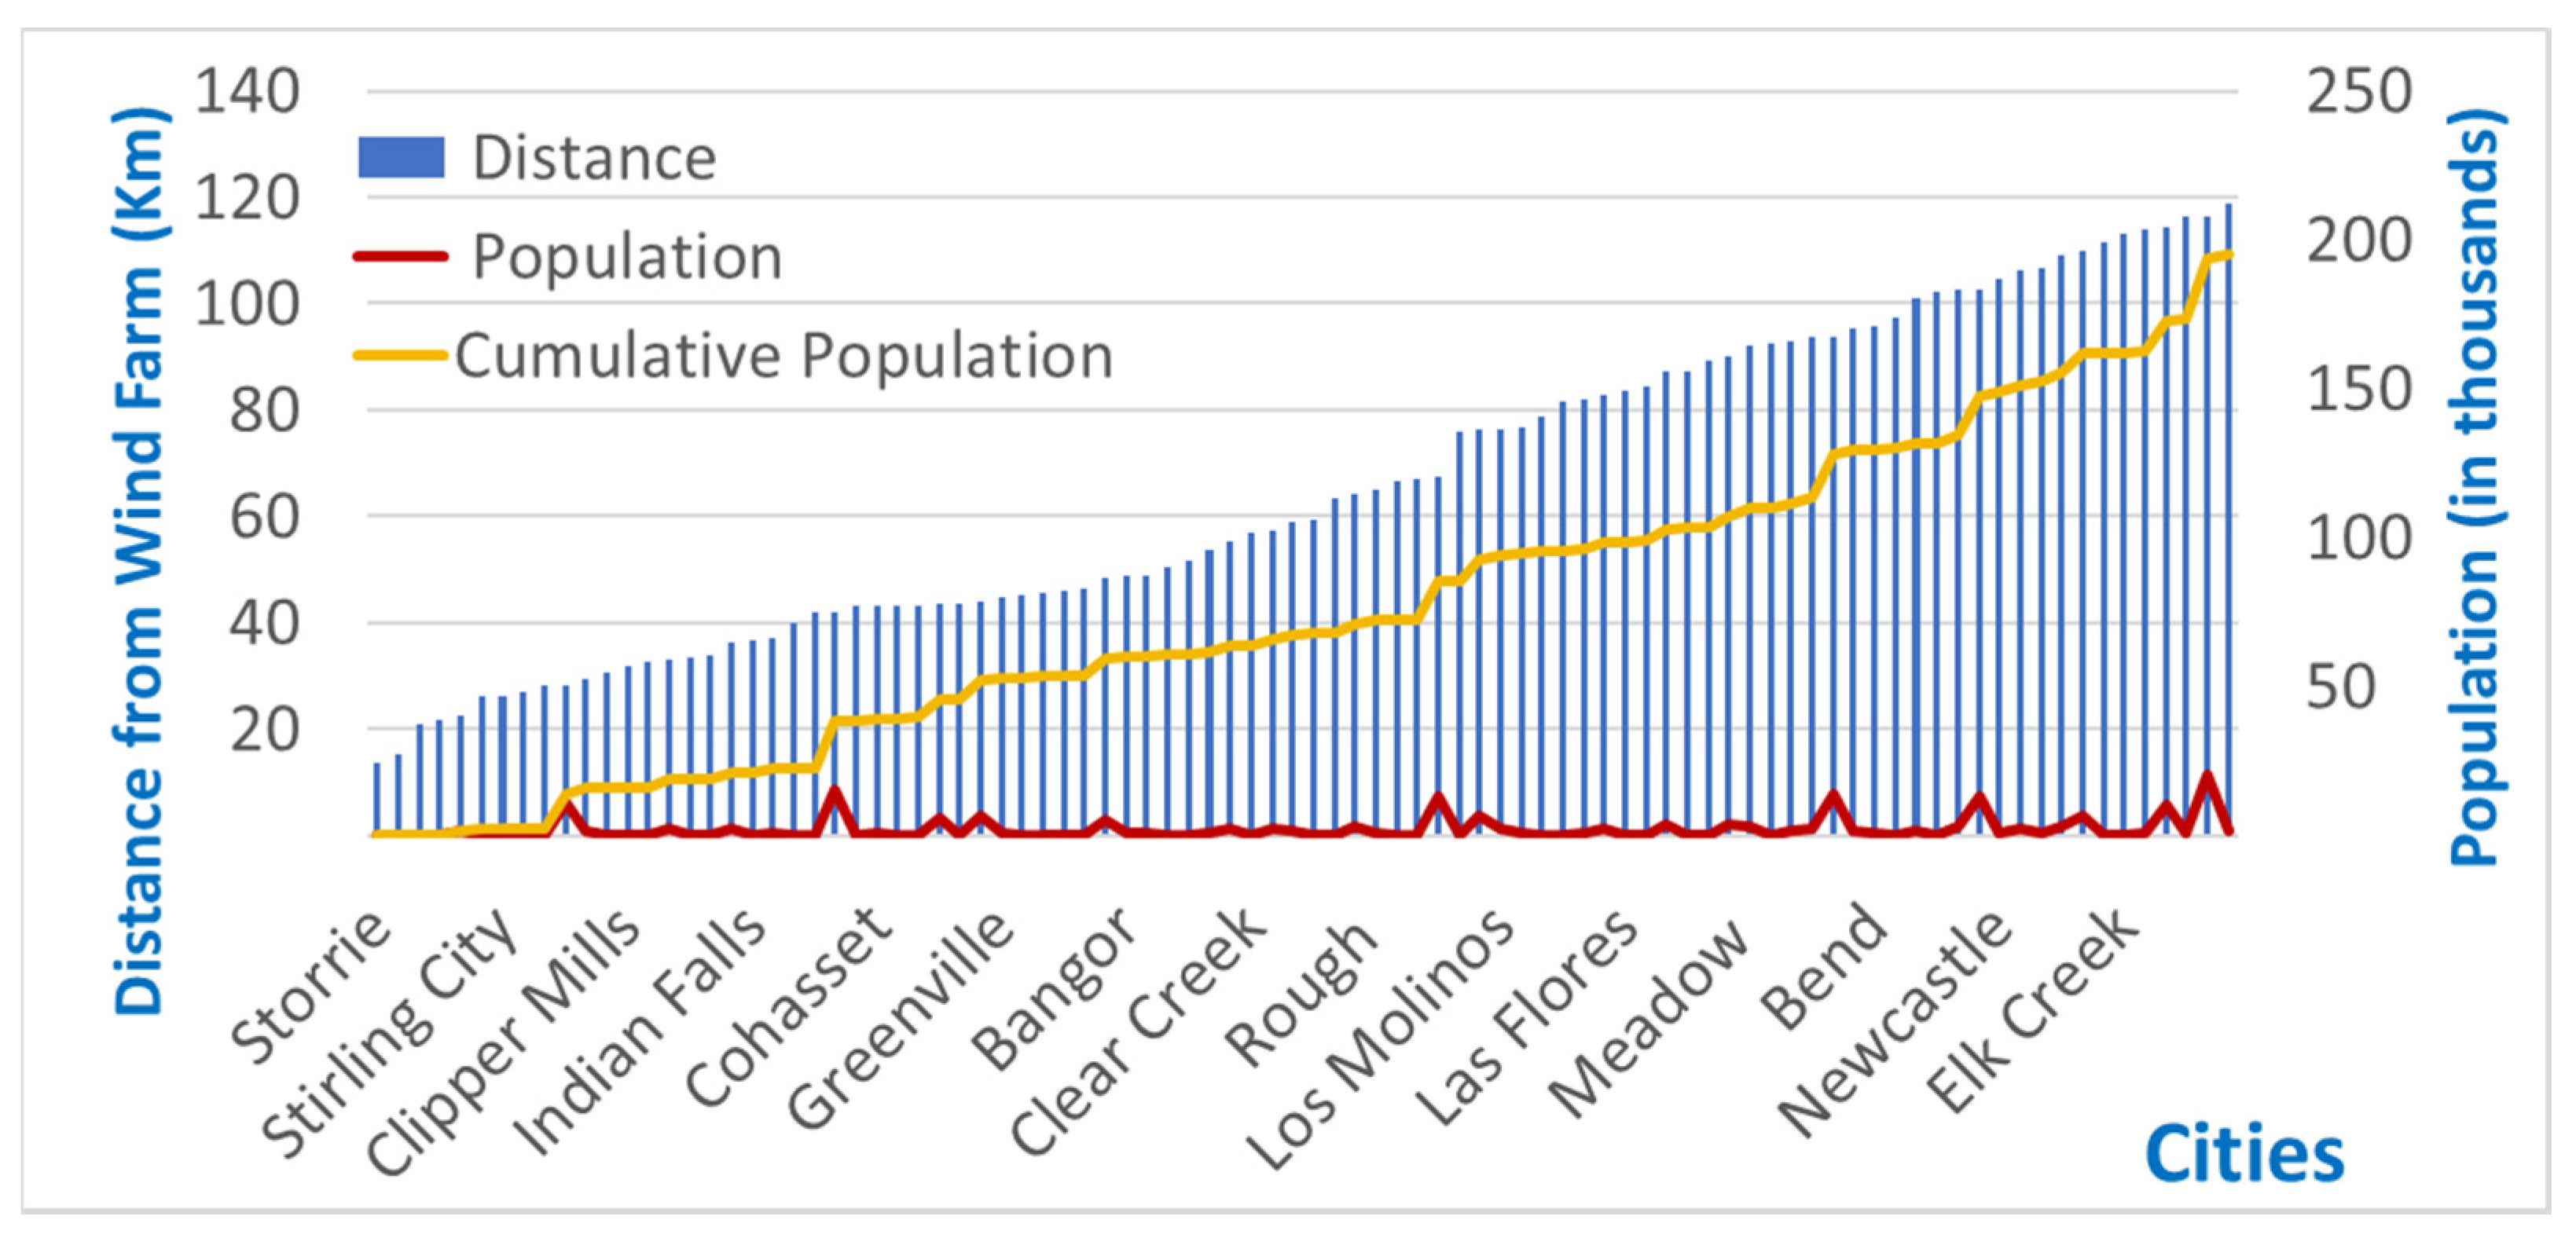
Figure 14.
PSPS Cities near the proposed new wind turbines in Point Arena, Northern California. (a) Location map; (b) average hourly power output per month for one wind turbine.
Figure 14.
PSPS Cities near the proposed new wind turbines in Point Arena, Northern California. (a) Location map; (b) average hourly power output per month for one wind turbine.

Figure 15.
Analysis of distance from onshore substation and population for proposed offshore wind turbines in Point Arena, Northern California.
Figure 15.
Analysis of distance from onshore substation and population for proposed offshore wind turbines in Point Arena, Northern California.
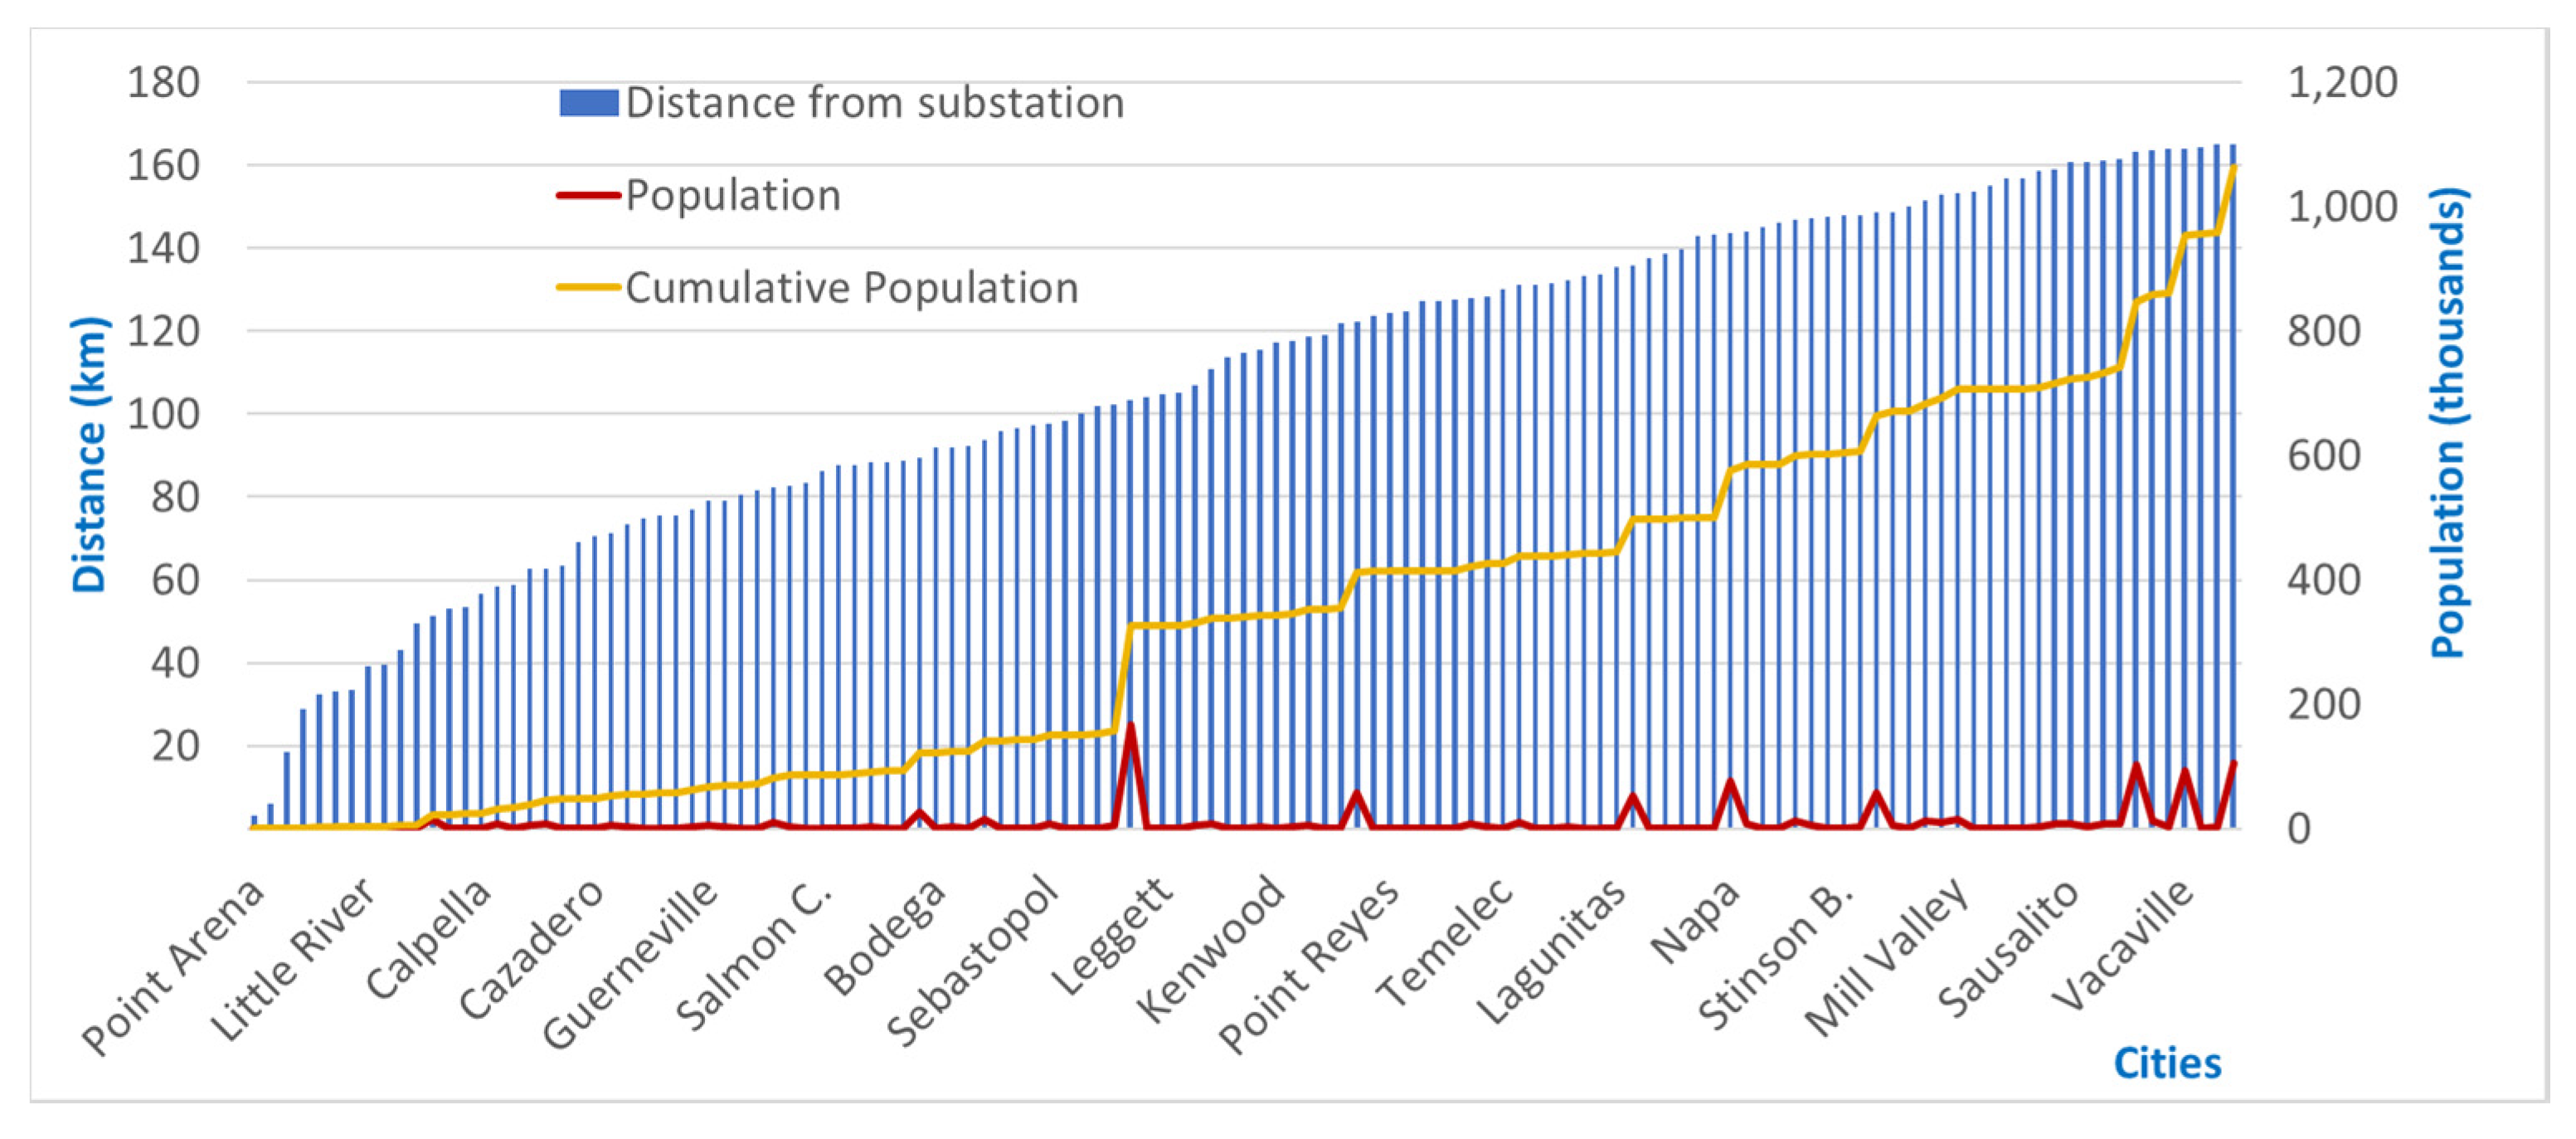
Figure 16.
Location maps PSPS Cities near the three proposed offshore wind turbines sites between Davenport and Lompoc, Central California.
Figure 16.
Location maps PSPS Cities near the three proposed offshore wind turbines sites between Davenport and Lompoc, Central California.
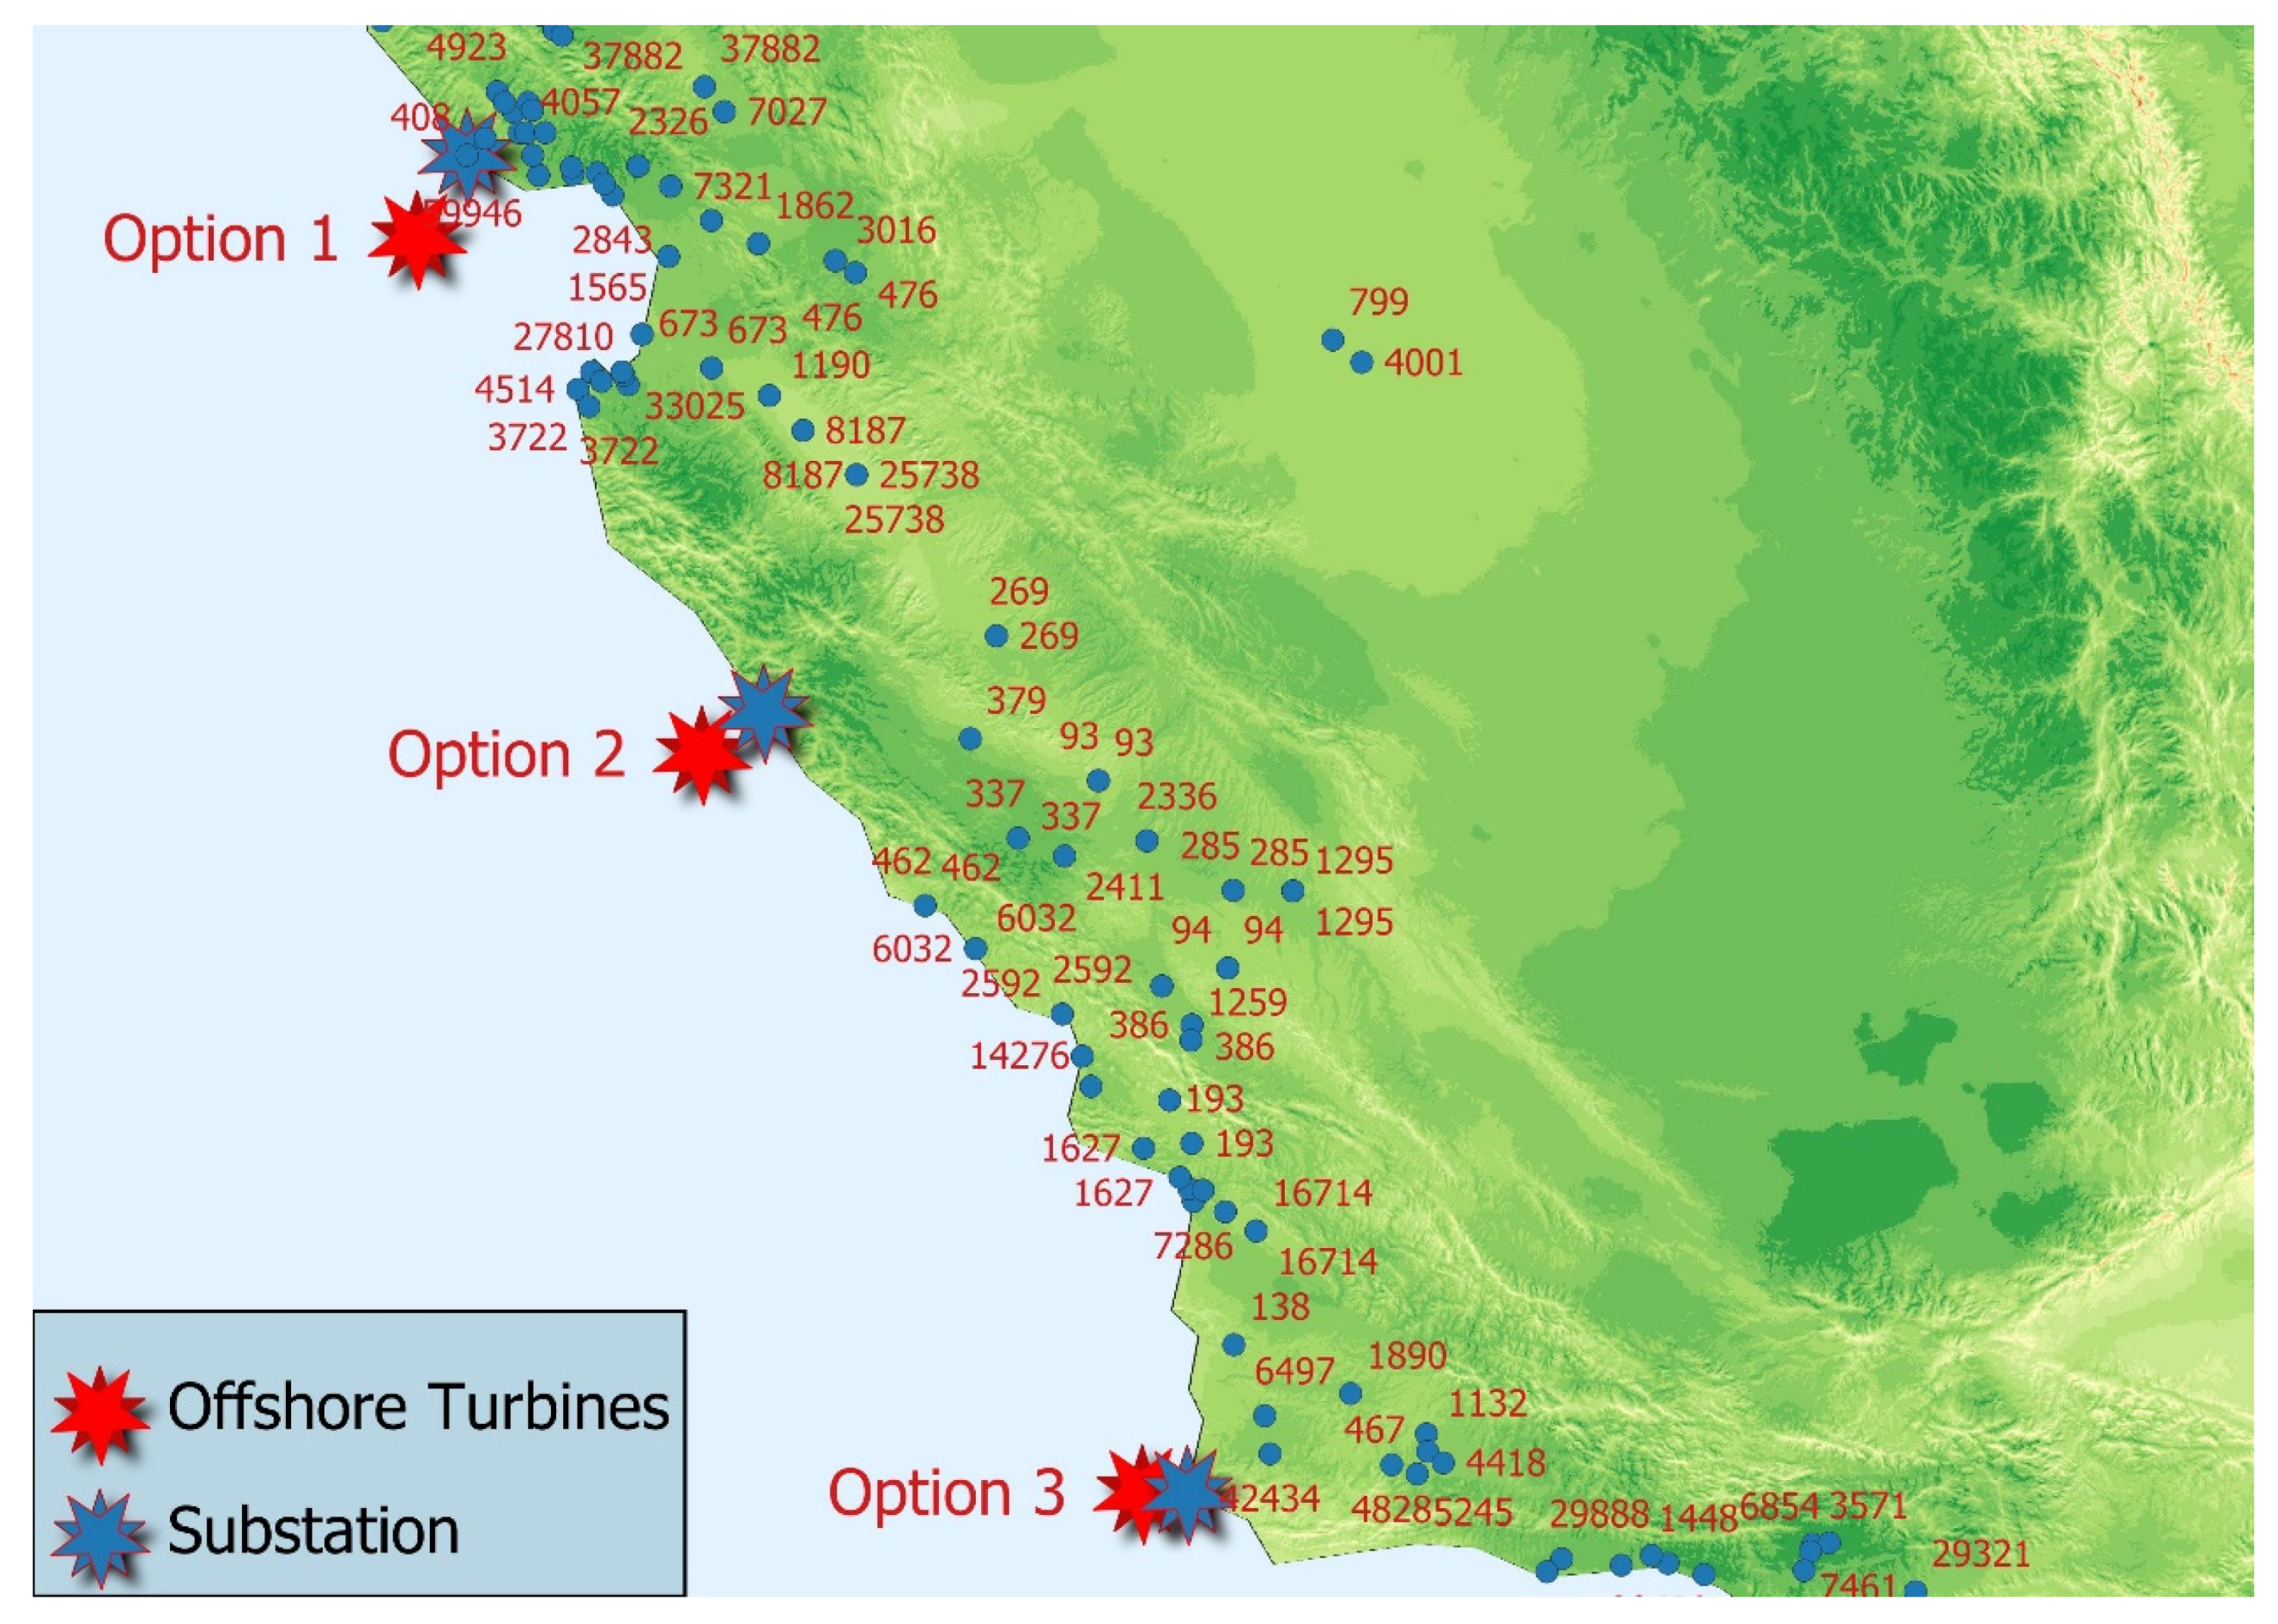
Figure 17.
Average hourly power output per month for one wind turbine in three locations under consideration. (a) Option 1. (b) Option 2. (c) Option 3.
Figure 17.
Average hourly power output per month for one wind turbine in three locations under consideration. (a) Option 1. (b) Option 2. (c) Option 3.
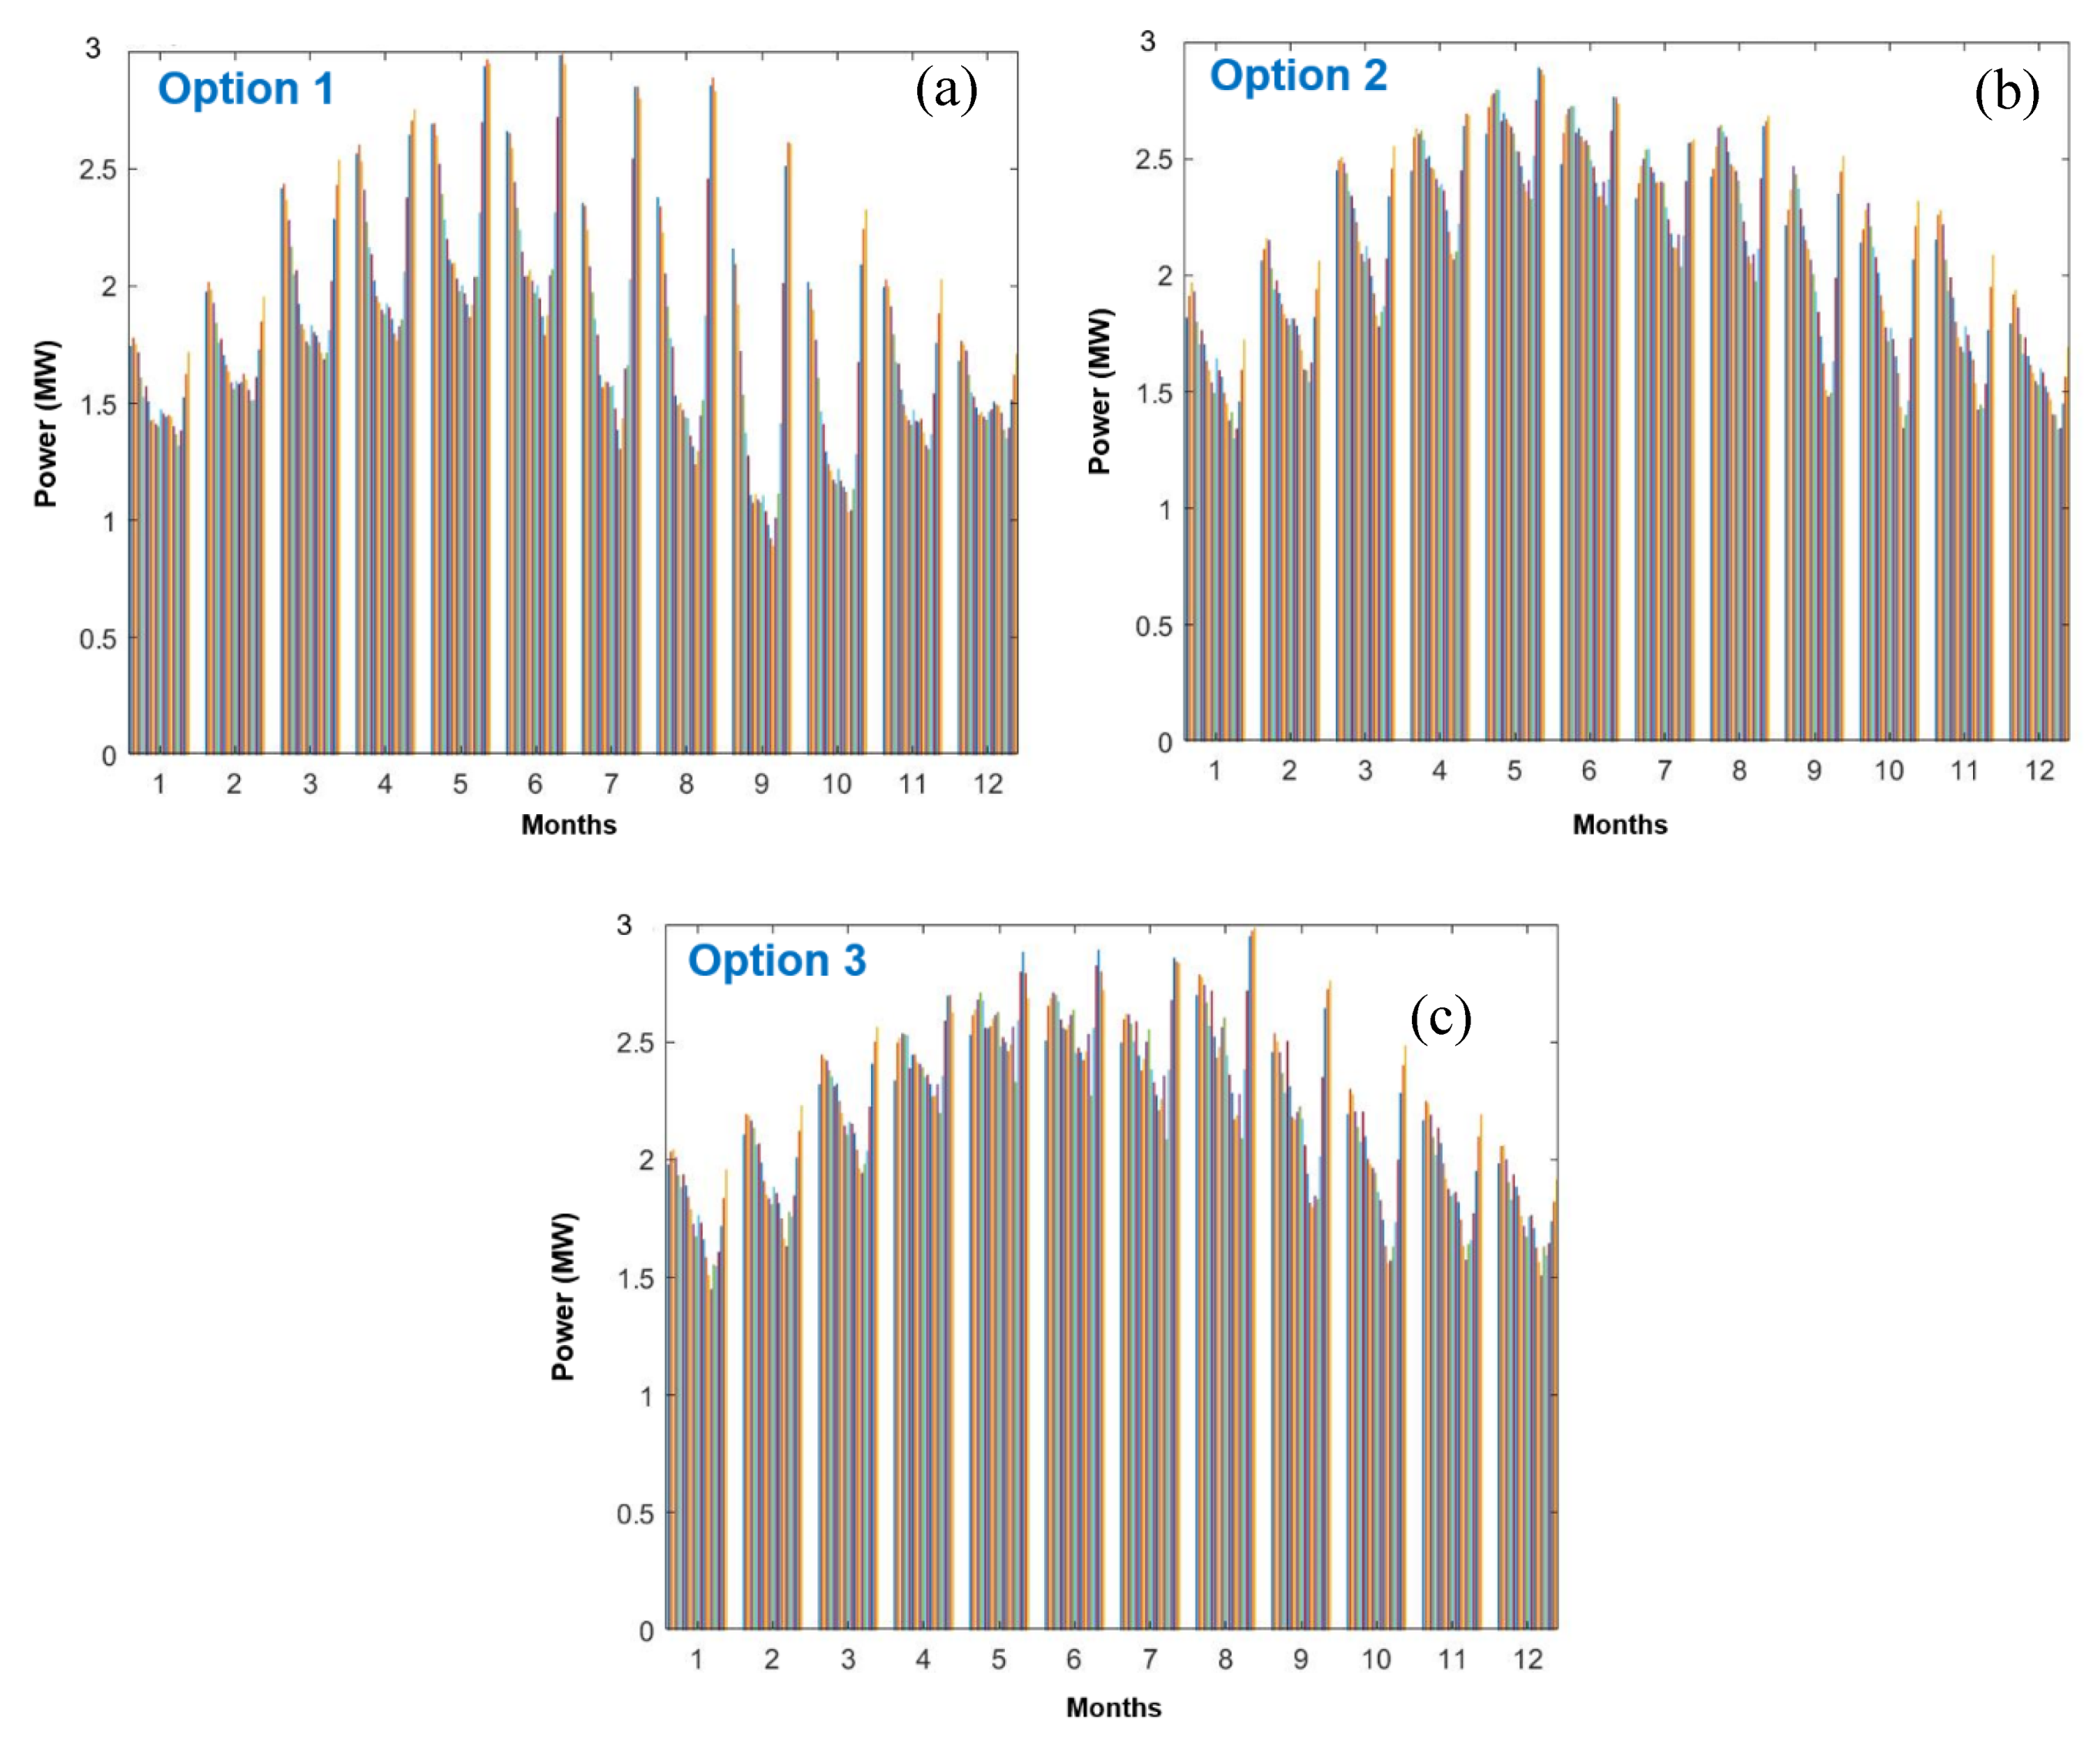
Figure 18.
Analysis of distance form onshore substation and population for proposed offshore wind turbines in three locations under consideration. (a) Option 1. (b) Option 2. (c) Option 3.
Figure 18.
Analysis of distance form onshore substation and population for proposed offshore wind turbines in three locations under consideration. (a) Option 1. (b) Option 2. (c) Option 3.

Table 1.
Cities in PG&E PSPS under Tier 2 (Elevated) or Tier 3 (Extreme) Fire-Threat.
| Pop (Thousands) | Num of PSPS | PSPS Area (Km2) | PSPS Affected (%) | Cities Affected by Several PSPS | ||||||||||
|---|---|---|---|---|---|---|---|---|---|---|---|---|---|---|
| Avg | Max | Min | Tier 2 | Tier 3 | 1 | 2 | 3 | 4 | 5 | 6 | 7 | 9 | ||
| 0–10 | 315 | 126 | 1034 | 2 | 48 | 23 | 216 | 113 | 33 | 6 | 1 | - | - | - |
| 10–20 | 75 | 59 | 500 | 5 | 32 | 21 | 9 | 12 | 5 | 4 | 3 | 1 | - | - |
| 20–30 | 40 | 48 | 614 | 2 | 30 | 23 | 3 | 3 | 1 | 2 | 2 | - | - | 1 |
| 30–40 | 12 | 68 | 179 | 16 | 32 | 10 | 3 | - | 2 | - | - | - | - | - |
| 40–50 | 17 | 47 | 216 | 6 | 27 | 15 | 1 | 2 | 1 | 1 | - | - | - | - |
| 50–60 | 12 | 41 | 127 | 5 | 26 | 16 | 1 | - | 3 | - | - | - | 1 | - |
| >60 | 21 | 28 | 72 | 6 | 20 | 9 | 6 | 2 | 2 | - | - | - | - | - |
Table 2.
Cities in SCE PSPS zones under Tier 2 (Elevated) or Tier 3 (Extreme) Fire-Threat.
| Pop (Thousands) | Num of PSPS | PSPS Area (Km2) | PSPS Affected (%) | Cities Affected by Several PSPS | |||||||||||
|---|---|---|---|---|---|---|---|---|---|---|---|---|---|---|---|
| Avg | Max | Min | Tier 2 | Tier 3 | 1 | 2 | 3 | 4 | 5 | 6 | 7 | 11 | 12 | ||
| 0–10 | 161 | 41 | 551 | 1 | 43 | 27 | 50 | 45 | 13 | 7 | 0 | 0 | 0 | 0 | 0 |
| 10–20 | 74 | 21 | 192 | 1 | 11 | 34 | 5 | 10 | 7 | 3 | 1 | 1 | 1 | 0 | 0 |
| 20–30 | 64 | 17 | 128 | 0.88 | 11 | 27 | 3 | 7 | 6 | 5 | 1 | 0 | 0 | 0 | 0 |
| 30–40 | 62 | 3 | 19 | 0.40 | 6 | 19 | 1 | 3 | 3 | 3 | 0 | 1 | 1 | 1 | 1 |
| 40–50 | 29 | 6 | 16 | 0.79 | 32 | 4 | 1 | 1 | 5 | 0 | 0 | 2 | 0 | 0 | 0 |
| 50–60 | 36 | 12 | 143 | 0.54 | 7 | 36 | 1 | 4 | 3 | 2 | 1 | 1 | 0 | 0 | 0 |
| >60 | 99 | 10 | 86 | 0.334 | 11 | 18 | 5 | 9 | 10 | 5 | 2 | 1 | 1 | 0 | 0 |
© 2020 by the author. Licensee MDPI, Basel, Switzerland. This article is an open access article distributed under the terms and conditions of the Creative Commons Attribution (CC BY) license (http://creativecommons.org/licenses/by/4.0/).
Share and Cite
MDPI and ACS Style
Haces-Fernandez, F. Wind Energy Implementation to Mitigate Wildfire Risk and Preemptive Blackouts. Energies 2020, 13, 2421. https://doi.org/10.3390/en13102421
AMA Style
Haces-Fernandez F. Wind Energy Implementation to Mitigate Wildfire Risk and Preemptive Blackouts. Energies. 2020; 13(10):2421. https://doi.org/10.3390/en13102421
Chicago/Turabian StyleHaces-Fernandez, Francisco. 2020. "Wind Energy Implementation to Mitigate Wildfire Risk and Preemptive Blackouts" Energies 13, no. 10: 2421. https://doi.org/10.3390/en13102421
Note that from the first issue of 2016, this journal uses article numbers instead of page numbers. See further details here.