Thermal Simulation of Close-Fitting Sportswear


1
Institute of Textile Machinery and High Performance Material Technology (ITM), TU Dresden, 01069 Dresden, Germany
2
Hohenstein Institute for Textile Innovation GmbH (HIT), 74357 Bönnigheim, Germany
*
Author to whom correspondence should be addressed.
Energies 2020, 13(10), 2419; https://doi.org/10.3390/en13102419
Submission received: 27 March 2020
/
Revised: 28 April 2020
/
Accepted: 7 May 2020
/
Published: 12 May 2020
Abstract
:A novel and intelligent product development approach is required in this fast-growing and advanced technological era. Therefore, textile researchers have worked intensively to create efficient and transparent solutions for complex developments by using advanced modeling and simulation tools and techniques. This paper addresses a process for the thermal simulation of sportswear by considering the human thermophysiological model and important thermal properties of fabrics, i.e., thermal resistance, evaporative resistance, and permeability index. The results of the simulation are illustrated in terms of core body and mean skin temperatures. Moreover, results are validated by wear trials showing good consistency. This study is beneficial to the development of clothing for specific sports and the evaluation of comfort and heat stress during different sports activities.

1. Introduction
Within the past two decades, clothing has become a crucial success factor for professional as well as amateur athletes. The performance of sportswear can be measured based on its comfort properties [1]. For active and endurance sports like running, cycling, and marathon, thermophysiological comfort is a primary concern due to the high metabolic rate generating heat of approximately 800–1300 W. This heat can increase the body core temperature (by 1.5–2 °C), enhance heat storage, and affect the mean skin temperature [2]. In a worst case scenario, this type of heat stress leads to heat stroke, which is a severe heat illness that causes the body temperature exceed 40 °C, hot and dry skin, and acute mental confusion (loss of linear thinking and memory) [3]. Exhausting situations like these may even cause athletes to quit the sport. Thus, not only an athlete’s performance but also his or her physical and mental health can be affected by heat stress.
The human body interacts with the consistently changing environment by trying to maintain its body core temperature within a narrow temperature range of 37 ± 0.5 °C. The transfer of heat between the human body and the surrounding environment depends on many factors, e.g., environmental conditions, the activity level of the human body, and clothing characteristics. Out of these factors, only the clothing properties can be managed according to their end-use. Thus, sportswear acting as interface and barrier has a great influence on the thermal transmission between the human body and the environment; thus, material selection is an essential part in the development process of sportswear. Researchers generally agree that air permeability, thermal insulation, and water vapor resistance of clothing are the most decisive factors in terms of thermal comfort [4,5]. In order to achieve a holistic product that can protect not only against external elements like wind, rain, and sun but also can maintain the heat balance of the wearer by releasing or preserving heat, clothing technicians must follow empirical methods of development.
Analyses of heat transfer and the thermal response of the human body through modeling and simulation is an interesting topic explored by many researchers, as a result, a variety of human thermal response models have been developed. Since the output of these models (body core and skin temperatures) are used for investigating thermal comfort and sensation, thermal comfort models are associated with human thermophysiological models [6]. The first model of heat transportation mechanism in living tissues was developed by Pennes in 1948 [7]. He developed a Bio-Heat-Equation for the human arm in order to calculate the steady-state temperature distribution. After that, numerous human thermoregulation model were developed by other scientists. The well-known and established models include a simple human model by Gagge [8], a thermal comfort model by Fanger [9], a detailed human model by Wissler [10], a popular human model by Stolwijk developed for NASA [11], a reliable and significant human model by Fiala [12,13], and a human model by Tanabe [14]. Most of the thermophysiological models consist of two systems, i.e., a passive system and an active system [12]. The passive system is responsible for the simulation of heat flow within the human body and between human body and environment [15]. The heat that is continuously produced by metabolism is dissipated over the body by blood circulation. The transportation of heat to different body parts very much depends on the thermal properties of blood, muscle, fat, and bones [16]. Heat that reaches the skin is transferred to the environment by passing through air gaps and clothing. This exchange of heat between body and environment is based on a complex combination of different heat transfer phenomena; conduction, convection, radiation, sweating, and evaporation [17]. The active system is a thermoregulatory system of the human body, which can simulate cutaneous vasomotion (vasoconstriction and vasodilation), sweat excretion, and shivering. The main parameters that direct the active system are the mean skin temperature, core temperature, and gradient of mean skin temperature [15]. Vasodilation is activated if the brain temperature exceed the setpoint (37 °C) and sweating starts if vasodilation is insufficient to dissipate the heat to the environment. In contrast, vasoconstriction is caused by a reduction in mean skin temperature. If vasoconstriction is insufficient to preserve body heat, shivering generates energy by muscle movement [16].
The application of thermophysiological models has been proven successful in various fields or disciplines directly involving human activities. Thermophysiological models have been used in many fields, e.g., in biometeorology for the development of the universal climate index (UTCI) [15], the analysis of thermal assessment of human body against different clothing ensemble [18,19], the prediction of thermophysiological responses of anesthetic patients during open-heart surgery [20], the development of thermophysiological human simulator for apparel comfort analysis by coupling the thermophysiological model with a thermal manikin [21,22,23], the prediction of human thermal responses to design sports stadia and buildings [24,25] and the assessment of thermal comfort of driver during driving in car cabins [6,26].
Despite all these developments in the field of thermophysiological models and their application, they have not yet been fully adopted by the clothing industry. This is due to the lack of interfaces between the computational modeling/simulation of product development and its thermal analysis. Thus, a method that enables the clothing industry to implement a thermal physiological model in their currently used software for modeling and simulation must be developed. The aim of this study was to determine a method for the simulation of heat transfer and the physiological responses of the human body wearing tight-fitting clothing, i.e., sportswear.
2. Methodology for Thermal Simulation
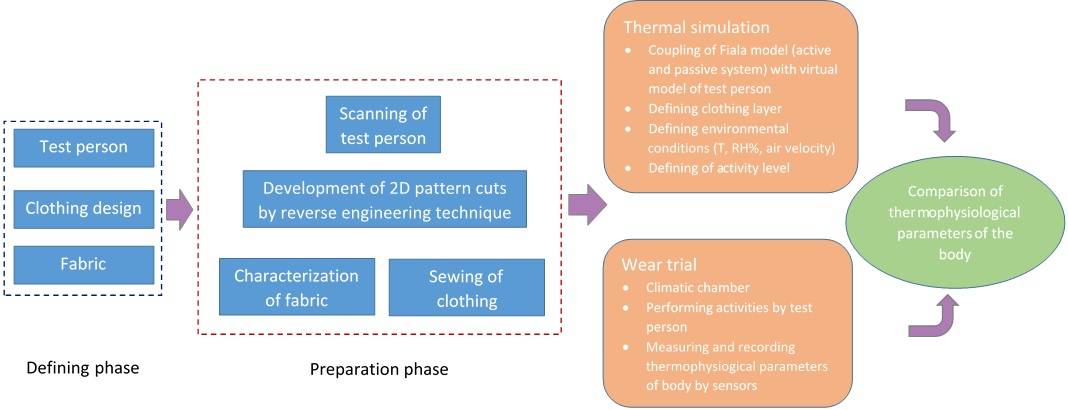
This study includes the selection and measurement of the essential thermal characteristics of a textile material, the scanning of a test person, the development of 2D pattern cuts, the sewing of close-fitting sportswear, and thermal simulations. The wear trials for the validation of simulation results were performed at the high-tech laboratory of the Hohenstein Institut für Textilinnovation.
2.1. Selection of Test Person
A test person, who volunteered to take part in this study, was selected for performing the thermophysiological simulation and wear trials. The test person is a student, who actively participates in sports like jogging, cycling, and running. He is 28 years old, was medically examined and declared healthy, weighs 83.4 kg and is 183.5 cm tall. In order to execute the simulations, virtual data of the test person was required. Thus, 3D virtual data of the test person was generated by means of 3D scanning using a 3D-body scanner VITUS [27]. As a result of scanning, a point cloud was achieved, which was further used to produce the polygon model by triangulation. It is the fact that scanning of the shaded areas of the body like crotch, armpit do not fulfill the required quality. Therefore, this polygon model was refined and repaired in the software Geomagic Studio [28] so that it can be used for development of close-fitted clothing and thermal simulation. The polygonal model is a facet model, whose surface involves a huge number of planar triangles. Figure 1a shows the polygon model of the test person. The surface reconstruction of the polygon model was carried out to develop the NURBS (Non-uniform rational B-splines) model (Figure 1b), which is defined by combinations of vertices, node vectors, and transition conditions. For body surface modeling, NURBS is an industry-standard tool [29], which is mostly used for parametric representations.
2.2. Material and Its Characterization
A 100% polyester knitted fabric (R/R knit) was selected for this study, which is usually utilized for outdoor gear (trekking, jogging, cycling, hiking, etc.) and was requested from a well-known sportswear manufacturer. The physical, mechanical, and thermal characteristics that are essential for thermal simulation were measured (Table 1).
2.3. Construction of Sportswear
A close-fitted clothing system was selected that is usually worn by sportsmen during running, cycling, etc. This clothing system consists of a close-fitted long sleeve shirt and close-fitted trousers. By use of reverse engineering techniques, the 2D patterns of the clothing system were generated. Also, the software 3D DesignConcept [30] was employed for this purpose. The NURBS model of the test person was imported into this software. The required design was constructed directly on the surface of the model with the help of the integrated drawing tool and the resulting curves are called region curves (Figure 2a). In order to generate the 2D pattern cuts, 3D regions were identified according to the design by region curves and the regions were produced (Figure 2b). A region is an entity that represents an approximation of a partial 3D shape. It consists of a triangular mesh that is limited by one or more boundaries [31]. The 2D pattern cuts were generated automatically by flattening (Figure 2c). The flattened regions are called patterns.
The 2D pattern cuts that were generated by flattening were further processed in the software Modaris V8 [30], thus straightening the lines and removing the sharp edges, which facilitates the assembling process of pattern cuts.
These 2D patterns were cut and sewn to assembly the clothing system for the wear trial (as shown in Figure 3).
3. Wear Trial
Wear trials were conducted to validate the simulation results of the thermophysiological response of the selected test person. For this purpose, the test person performed two trials in a climatic chamber providing a temperature of 23 °C and a relative humidity of 50%. The test procedure lasted for 125 min in total (as shown in Table 2) and was carried out by the test person on a motor-driven treadmill (Kettler Track Experience, Kettler GmbH & Co. KG, Germany).
During the wear trials, the physiological parameters of the test person such as skin temperature and wetness were measured with help of temperature and humidity sensors (MSR Electronics GmbH, Switzerland), and heart rate with the pulse belt (Polar Wearlink, Polar Electo Oy, Finland). The MSR 345 Datalogger (MSR Electronics GmbH, Switzerland) was used to record the data that was measured by the sensors. The temperature and humidity sensors were attached to the body of the test person at nine different points according to ISO 9886 [32], as mentioned in Table 3. The average skin temperature was calculated based on the eight-point method from ISO 9886. A SpotOn system (3M Medica, Neuss, Germany) was used to measure the body core temperature. The SpotOn sensor was placed on forehead and connected to the control unit for recording and digital display. It measures the body core temperature by isolating the temperature of attachment zone and preventing the heat loss to environment. Furthermore, the total amount of sweat that was produced by the test person, was calculated by weighing the nude subject before and after the wear trial. The amount of sweat the clothing contained was determined as the weight difference of the clothing before and after the trial. The clothing was washed and conditioned for 24 h prior to the next trial.
4. Thermal Simulation of the Test Person
The thermal simulation was carried out with the software Theseus-FE [33] that allows users to employ the Fiala Model (developed at HFT Stuttgart and De Monfort University, UK [13]) for thermal simulation. The NASTRAN (NASA Structure Analysis) format of the virtual model of the test person was imported into this software and the Fiala Model was coupled with the corresponding virtual model. Thus, a thermophysiological virtual model of a test person was developed, which can perform all active and passive thermoregulation processes according to the Fiala Model (Figure 4).
In software Theseus-FE, a clothing layer can be defined on each body element of the model in term of thermal properties of clothing as clo values. One clo can be defined as “the thermal insulation required to keep a sedentary person comfortable at 21 °C”, which has an average value of 0.155 m2K/W [34]. Thus, the clothing properties, i.e., thermal and evaporative resistance, that were already measured, were used to calculate the Icl and Icl/icl (where, Icl is the thermal resistance and icl is the moisture permeability index):
The dimensionless values as shown in Table 4 were used to define the clothing layer all over the body except face, head, neck, hands, and feet as shown in Figure 5. Hence, a virtual model of the test person was generated that wears clothing with thermal properties that are identical with the clothing worn during the wear trials.
Prior to simulations, the following boundary conditions were defined:
- An environment of 23 °C and a 50% relative humidity with an air velocity of 0.3 m/s was defined.
- The metabolic rates were defined according to the activities (sitting, walking at 4 km/h, walking at 6 km/h) that were followed by the test person during the wear trial. The metabolic rate of the test person was calculated by the following relation [35]:where, M is the metabolic rate, W is the body weight, L is the carried load, V is the walking speed, ɳ is the nature of the terrain, and G is the walking grade. Table 5 shows the metabolic rates that were calculated based on the above mentioned equation.
- The boundary conditions for heat transfer due to convection between external environment and outer surface of the clothing/model were determined by defining the linear convection (a function of velocity).
- The view factor cavity was defined in order to consider the radiative heat flux due to longwave radiation. In this regard, radiation characteristics were also defined as well.
5. Results and Discussion
The test person’s physiological response during the wear trial was recorded as changes in physiological parameters (mean and local skin temperature, core body temperature). A comparison between simulation and wear trial results can be seen in Figure 6 and Figure 7. Figure 6 presents the mean skin and core body temperatures measured during wear trial and simulation. The core body temperature was accurately reproduced by means of simulation so that only minor discrepancies occur in comparison to wear trial results. However, a significant difference of 1–2 °C between simulation and wear trial results is revealed in the case of mean skin temperature. Nevertheless, both graphs follow an almost identical trend throughout the course of simulation and wear trial except in the sitting phase showing a slightly different tendency.
In Figure 7, the local skin temperatures of different body parts of the test person during wear trial and simulation are compared. The majority of simulation results is in good agreement with wear trial results, i.e., the skin temperatures of forehead, chest left, calf left, and front thigh right (Figure 7a,c,g,h) generally show similar trends with only minor variations compared to wear trial results. Nevertheless, some simulation results differ from wear trial results by 1–2 °C, e.g., in the case of the upper arm right, shoulder blade right, and lower back left (Figure 7d,b,i). The skin temperatures of left hand and forearm left during simulation exhibit a trend that is similar to the wear trial but with a significant variation of up to 4 °C and 2.5 °C, respectively (Figure 7e,f). The reason of this significant difference is behavior of skin temperatures, which declines during the second and the fourth phases of wear trials. This decline in skin temperatures is due to the forced convection that occurs on the moving body parts (hands, arms, legs, and feet). Since the thermal simulation cannot be realized the body movement, therefore the simulation results consist of relatively smooth curves compare to the wear trials. Furthermore, skin temperature of left hand shows more variation compared to forearm left during wear trial. This difference is due to the thermal insulation of the fabric layer between forearm skin and the outer environment. In case of left hand, no fabric layer is present.
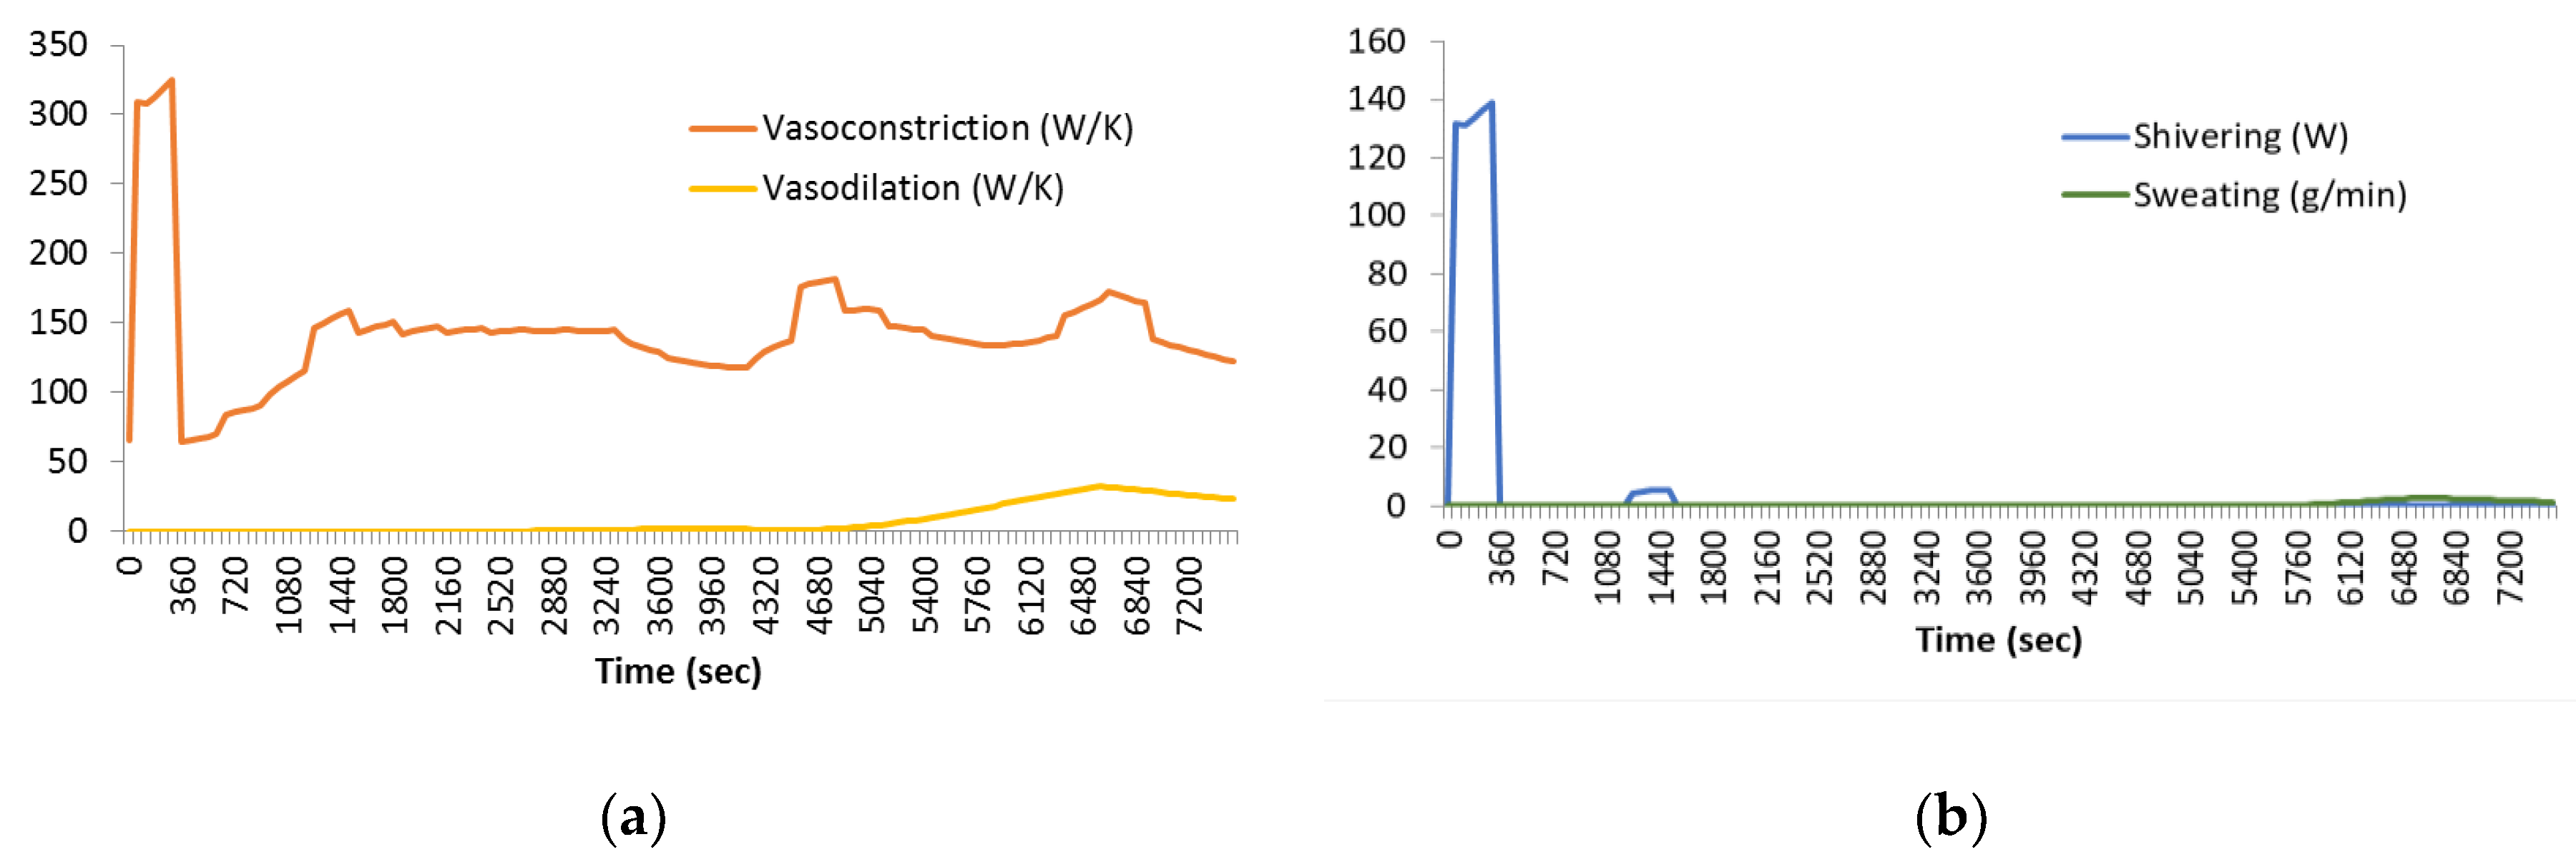
Figure 8a,b introduces the function of the active system during simulation. Once the simulation starts, the body releases heat to the environment due to the influence of the environmental temperature (23 °C) causing the mean skin temperature to decrease (Figure 6). Vasoconstriction depends on a declining mean skin temperature; thus, vasoconstriction and shivering are activated at the beginning of the simulation to preserve/produce body heat. After a few minutes, both processes start to decline. The shivering graph meets the horizontal line at 360 s, whereas simultaneously, vasoconstriction begins to increase at the same time after a sudden fall. This gradual increase in vasoconstriction continues even in the second phase (900–3300 s; walking at 4 km/h). Moreover, the body produces more heat due to the higher metabolic rate in the second phase, whereas body releases heat to the environment more rapidly as compared to the previous phase. The reason for this phenomenon is a higher temperature difference between body surface and environment that is due to higher metabolic rate in the second and fourth phases. Vasoconstriction stops increasing, but maintains a constant level throughout this phase. With the start of the third phase (3300–4200 s; sitting), the mean skin and body core temperatures rise (Figure 6) and as a result, vasoconstriction decreases. These increments in temperatures results from the large amount of energy produced by the test person in the second phase due to high metabolism that must be released to the environment in order to achieve a neutral condition. In the fourth phase (4200–6600 s; 6 km/h), once again the body produces more heat because of the higher metabolic rate and dissipates more heat due to higher temperature differences. In this complex situation, the body tries to maintain its core temperature by combining functions of vasoconstriction, sweating, and vasodilation. With the beginning of the fourth phase, vasoconstriction starts to increase, as the mean skin temperature declines. In the middle of the fourth phase, the core temperature rises because of higher metabolism that activates the vasodilation. It can also be observed that at the end of 4th phase sweating starts, which shows that vasodilation is not enough to release enough heat to the environment. Therefore, the most effective cooling processes sweating and evaporation are activated to achieve setpoint temperature (37°). With the start of the fifth phase (6600–7500 s; sitting), the vasodilation and sweating decreases as metabolism and core temperature of the body declines because of resting. The vasoconstriction, which was increased at the end of phase 4 also goes down, as the mean skin temperature starts to increase.
6. Conclusions
This research work presents a simulation method that is able to predict the thermophysiological response of humans close-fitting clothing according to different activity levels. The proposed method considers all important thermal properties of the fabric, e.g., thermal insulation, evaporative resistance, and moisture permeability index during the simulation process. Moreover, the Fiala model is combined with a virtual model of the test person so that the thermoregulation of the human body with respect to a defined environment can be analyzed. Moreover, simulation results are validated by a wear trial, thus proving the reliability of the proposed process.
Author Contributions
M.A. and S.K. conceived the presented idea, developed the theory and performed thermal simulation. B.-M.W. and E.C. characterized the fabric properties and performed the wear trial in order to validate the simulation results. M.A. processed the experimental data, performed the analysis, drafted the manuscript and designed the figures under the supervision of S.K. All authors discussed the results and contributed to the final manuscript. All authors have read and agreed to the published version of the manuscript.
Funding
The authors would like to thank the institution AiF for providing the funding. The IGF research project 19472 BG of the Forschungsvereinigung Forschungskuratorium Textil e. V. is funded through the AiF within the program for supporting the “Industrielle Gemeinschaftsforschung (IGF)” from funds of the Federal Ministry for Economic Affairs and Energy (BMWi) by a resolution of the German Bundestag.
Conflicts of Interest
The authors declare no conflict of interest.
References
- Shishoo, R. Textiles in Sport; Woodhead Publishing Limited: Sawston, UK; Cambridge, UK, 2005. [Google Scholar]
- Brotherhood, J.R. Heat stress and strain in exercise and sport. J. Sci. Med. Sport 2008, 11, 6–19. [Google Scholar] [CrossRef] [PubMed]
- Galloway, S.D.; Maughan, R.J. Effects of ambient temperature on the capacity to perform prolonged cycle exercise in man. Med. Sci. Sports Exerc. 1997, 29, 1240–1249. [Google Scholar] [CrossRef] [PubMed]
- Das, A.; Ishtiaque, S.M. Comfort Characteristics of Fabrics Containing Twist-less and Hollow Fibrous Assemblies in Weft. J. Text. Apparel. Technol. Manag. 2014, 3, 1–7. [Google Scholar]
- Havenith, G. Heat balance when wearing protective clothing. Ann. Occup. Hyg. 1999, 43, 289–296. [Google Scholar] [CrossRef] [Green Version]
- Katic, K.; Li, R.; Zeiler, W. Thermophysiological models and their applications: A review. Build. Environ. 2016, 106, 286–300. [Google Scholar] [CrossRef] [Green Version]
- Pennes, H.H. Analysis of Tissue and Arterial Blood Temperatures in the Resting Human Forearm. J. Appl. Physiol. 1948, 1, 5–34. [Google Scholar] [CrossRef] [PubMed]
- Gagge, A.; Stolwijk, J.A.; Nishi, Y. An Effective Temperature Scale Based on a Simple Model of Human Physiological Regulatory Response. SHRAE Trans. 1971, 77, 247–262. [Google Scholar]
- Fanger, P. Thermal Comfort: Analysis and Applications in Environmental Engineering; Danish Technical Press: København, Denmark, 1970. [Google Scholar]
- Wissler, E.H. Mathematical simulation of human thermal behavior using whole body models. Heat Transf. Med. Biol. 1985, 1, 325–373. [Google Scholar]
- Stolwijk, J.A.; Nadel, E.R.; Wenger, C.B.; Roberts, M.F. Development and application of a mathematical model of human thermoregulation. Arch. Sci. Physiol. (Paris) 1973, 27, 303. [Google Scholar] [PubMed]
- Fiala, D.; Lomas, K.J.; Stohrer, M. A computer model of human thermoregulation for a wide range of environmental conditions: The passive system. J. Appl. Physiol. 1999, 87, 1957–1972. [Google Scholar] [CrossRef] [PubMed]
- Fiala, D.; Lomas, K.J.; Stohrer, M. Computer prediction of human thermoregulatory and temperature responses to a wide range of environmental conditions. Int. J. Biometeorol. 2001, 45, 143–159. [Google Scholar] [CrossRef] [PubMed]
- Huizenga, C.; Hui, Z.; Arens, E. A model of human physiology and comfort for assessing complex thermal environments. Build Environ. 2001, 36, 691–699. [Google Scholar] [CrossRef] [Green Version]
- Fiala, D.; Havenith, G.; Bröde, P.; Kampmann, B.; Jendritzky, G. UTCI-Fiala multi-node model of human heat transfer and temperature regulation. Int. J. Biometeorol. 2012, 56, 429–441. [Google Scholar] [CrossRef] [PubMed] [Green Version]
- Parsons, K. Human Thermal Environments, 2nd ed.; Taylor and Francis Group: London, UK; New York, NY, USA, 2003. [Google Scholar]
- Taleghani, M.; Tenpierik, M.; Kurvers, S.; van den Dobbelsteen, A. A review into thermal comfort in buildings. Renew. Sustain. Energy Rev. 2013, 26, 201–215. [Google Scholar] [CrossRef]
- Awais, M.; Wendt, E.; Krzywinski, S. Analysis of Thermal Comfort of Clothing with Different Textile Material through Thermal Simulation. In Proceedings of the 3DBODY.TECH, Lugano, Switzerland, 22–23 October 2019; pp. 127–136. [Google Scholar]
- Fojtlín, M.; Psikuta, A.; Fišer, J.; Toma, R.; Annaheim, S.; Jícha, M. Local clothing properties for thermo-physiological modelling: Comparison of methods and body positions. Build Environ. 2019, 155, 376–388. [Google Scholar] [CrossRef]
- Severens, N.M.W.; van Marken Lichtenbelt, W.D.; Frijns, A.J.H.; Van Steenhoven, A.A.; De Mol, B.A.J.M.; Sessler, D.I. A model to predict patient temperature during cardiac surgery. Phys. Med. Biol. 2007, 52, 5131–5145. [Google Scholar] [CrossRef] [PubMed] [Green Version]
- Psikuta, A. Development of an ‘Artificial Human’ for Clothing Research; De Montfort University Leicester: Leicester, UK, 2009. [Google Scholar]
- Psikuta, A.; Richards, M.; Fiala, D. Single- and Multi-Sector Thermophysiological Human Simulators For Clothing Research. In Proceedings of the 7th International Thermal Manikin and Modelling Meeting, Coimbra, Portugal, 2–5 September 2018; pp. 1–5. [Google Scholar]
- Fiala, D.; Psikuta, A.; Jendritzky, G.; Paulke, S.; Nelson, D.A.; van Marken Lichtenbelt, W.D.; Frijns, A.J. Physiological modeling for technical clinical and research applications. Front. Biosci. S 2010, 2, 112. [Google Scholar] [CrossRef] [PubMed] [Green Version]
- Yang, T.; Cropper, P.C.; Cook, M.J.; Yousaf, R.; Fiala, D. A new simulation system to predict human-environment thermal interactions in naturally ventilated buildings. In Proceedings of the 10th International Building Performance Simulation Association Conference and Exhibition (BS2007), Beijing, China, 3–6 September 2007; pp. 751–756. [Google Scholar]
- Fiala, D.; Lomas, K.J. Application of a computer model predicting human thermal responses to the design of sports stadia. In Proceedings of the CIBSE ’99, Harrogate, UK, 3–5 October 1999; pp. 492–499. [Google Scholar]
- Paulke, S.; Wagner, S. Some Considerations on Global and Local Thermal Comfort Based on Fiala ‘ S Thermal Manikin in Theseus-Fe. In Proceedings of the 6th EUROSIM Congr Model Simul, Ljubljana, Slovenia, 9–13 September 2007. [Google Scholar]
- Vitronic. Available online: https://www.vitronic.com/industrial-and-logistics-automation/sectors/3d-body-scanner.html (accessed on 10 October 2017).
- 3D Scanning, Design and Reverse Engineering Software From 3D Systems Geomagic. Available online: http://www.geomagic.com/en/ (accessed on 7 September 2016).
- Rogers, D.F. An Introduction to NURBS With Historical Perspective; Morgan Kaufmann: Burlington, MA, USA, 2001. [Google Scholar]
- Lectra. Available online: http://www.lectra.com/en (accessed on 10 June 2017).
- Girdauskaite, L. Lokale Strukturfixierung im Preformherstellungsprozess für Komplex Gekrümmte Faserkunststoffverbundbauteile; TUDpress: Dresden, Germany, 2011. [Google Scholar]
- International Standard Organization, ISO 9886 Ergonomics-Evaluation of Thermal Strain by Physiological Measurements; International Standard Organization: Geneva, Switzerland, 2004.
- Theseus, F.E. Available online: http://www.theseus-fe.com/simulation-software/human-thermal-model (accessed on 3 October 2017).
- Duncan, S.; McLellan, T.; Dickson, E.G. Improving Comfort in Clothing; Elsevier: Amsterdam, The Netherlands, 2011. [Google Scholar]
- Pandolf, K.; Givoni, B.; Goldman, R. Predicting energy expenditure with loads while standing or walking very slowly. J. Appl. Physiol. 1977, 43, 577–581. [Google Scholar] [CrossRef] [PubMed]
Figure 1.
(a) Polygon model and (b) NURBS (Non-uniform rational B-splines) model of a test person.

Figure 2.
(a) Drawing of the region curves, (b) feneration of triangulated meshes, and (c) 2D patterns of long sleeve shirt and trousers generated by the flattening process.
Figure 2.
(a) Drawing of the region curves, (b) feneration of triangulated meshes, and (c) 2D patterns of long sleeve shirt and trousers generated by the flattening process.

Figure 3.
Close fitted long sleeve shirt and trousers.
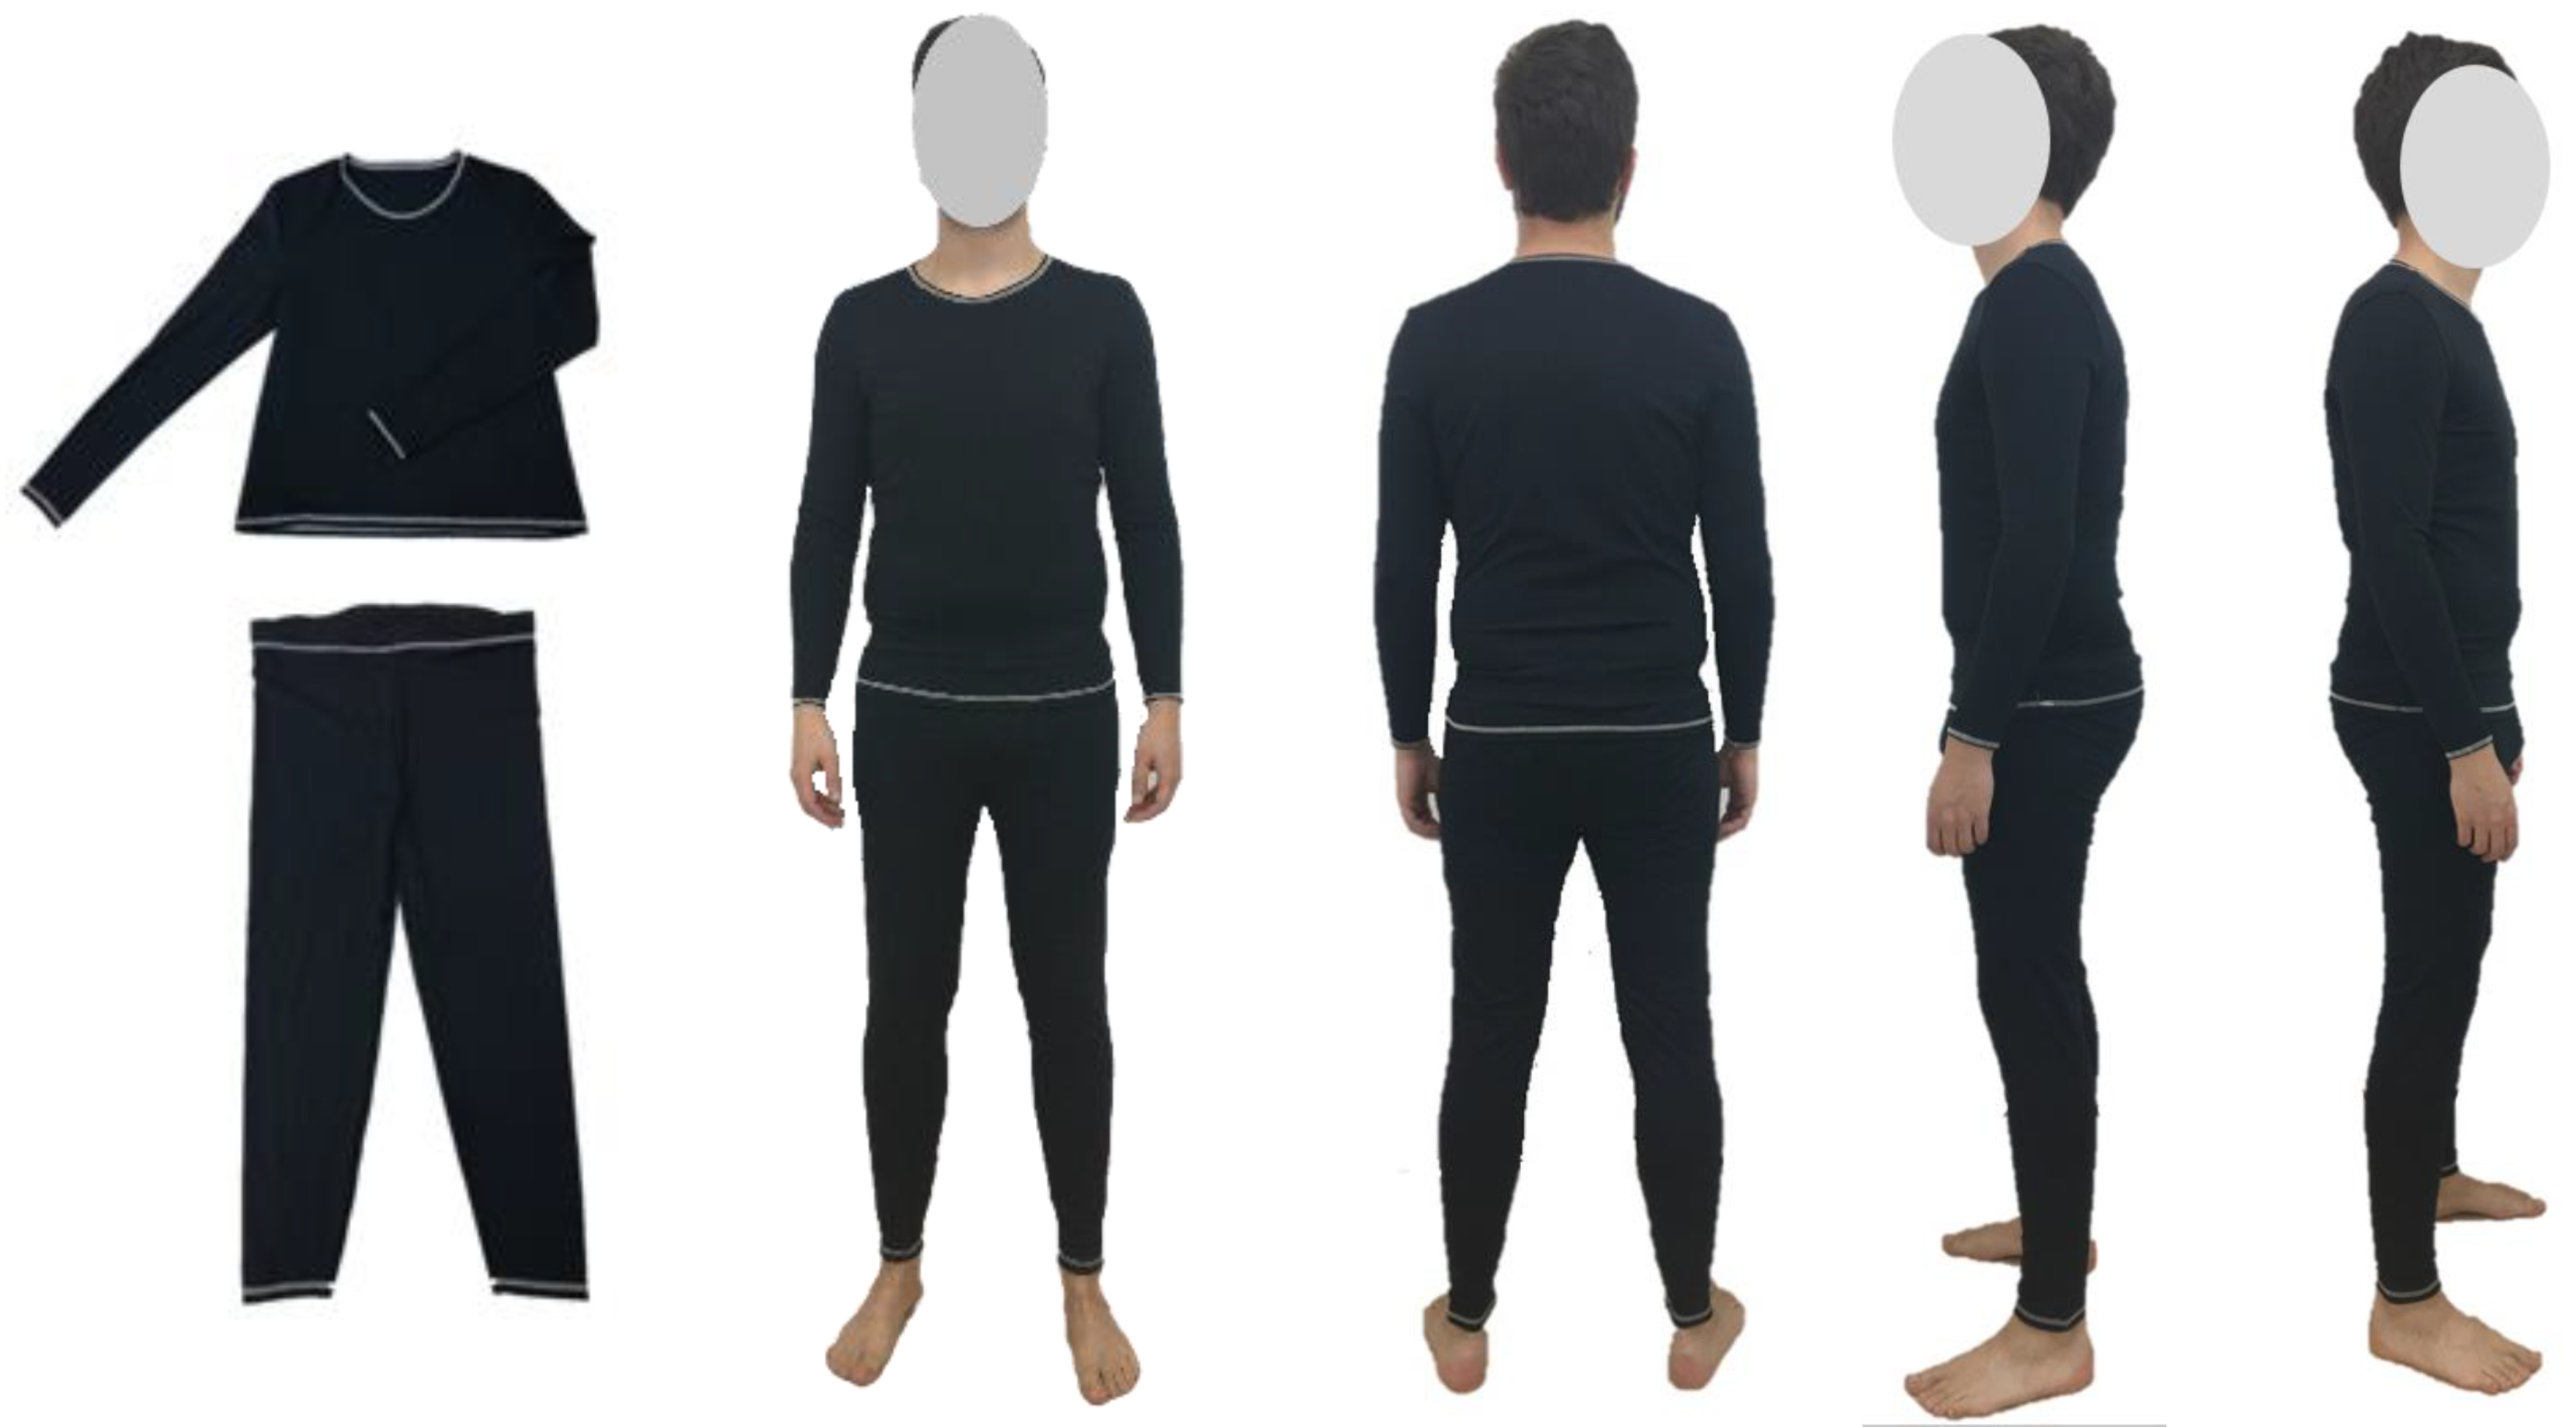
Figure 4.
Development of a thermophysiological virtual model of the test person, (a) 3D virtual model of the test person, (b) Fiala Model [26], and (c) thermophysiological model of the test person.
Figure 4.
Development of a thermophysiological virtual model of the test person, (a) 3D virtual model of the test person, (b) Fiala Model [26], and (c) thermophysiological model of the test person.

Figure 5.
(a) Closed-fitted clothing worn by test person, (b) the colored area of the virtual model shows where the clothing layer is defined.
Figure 5.
(a) Closed-fitted clothing worn by test person, (b) the colored area of the virtual model shows where the clothing layer is defined.

Figure 6.
Mean skin and body core temperature during wear trial and simulation.
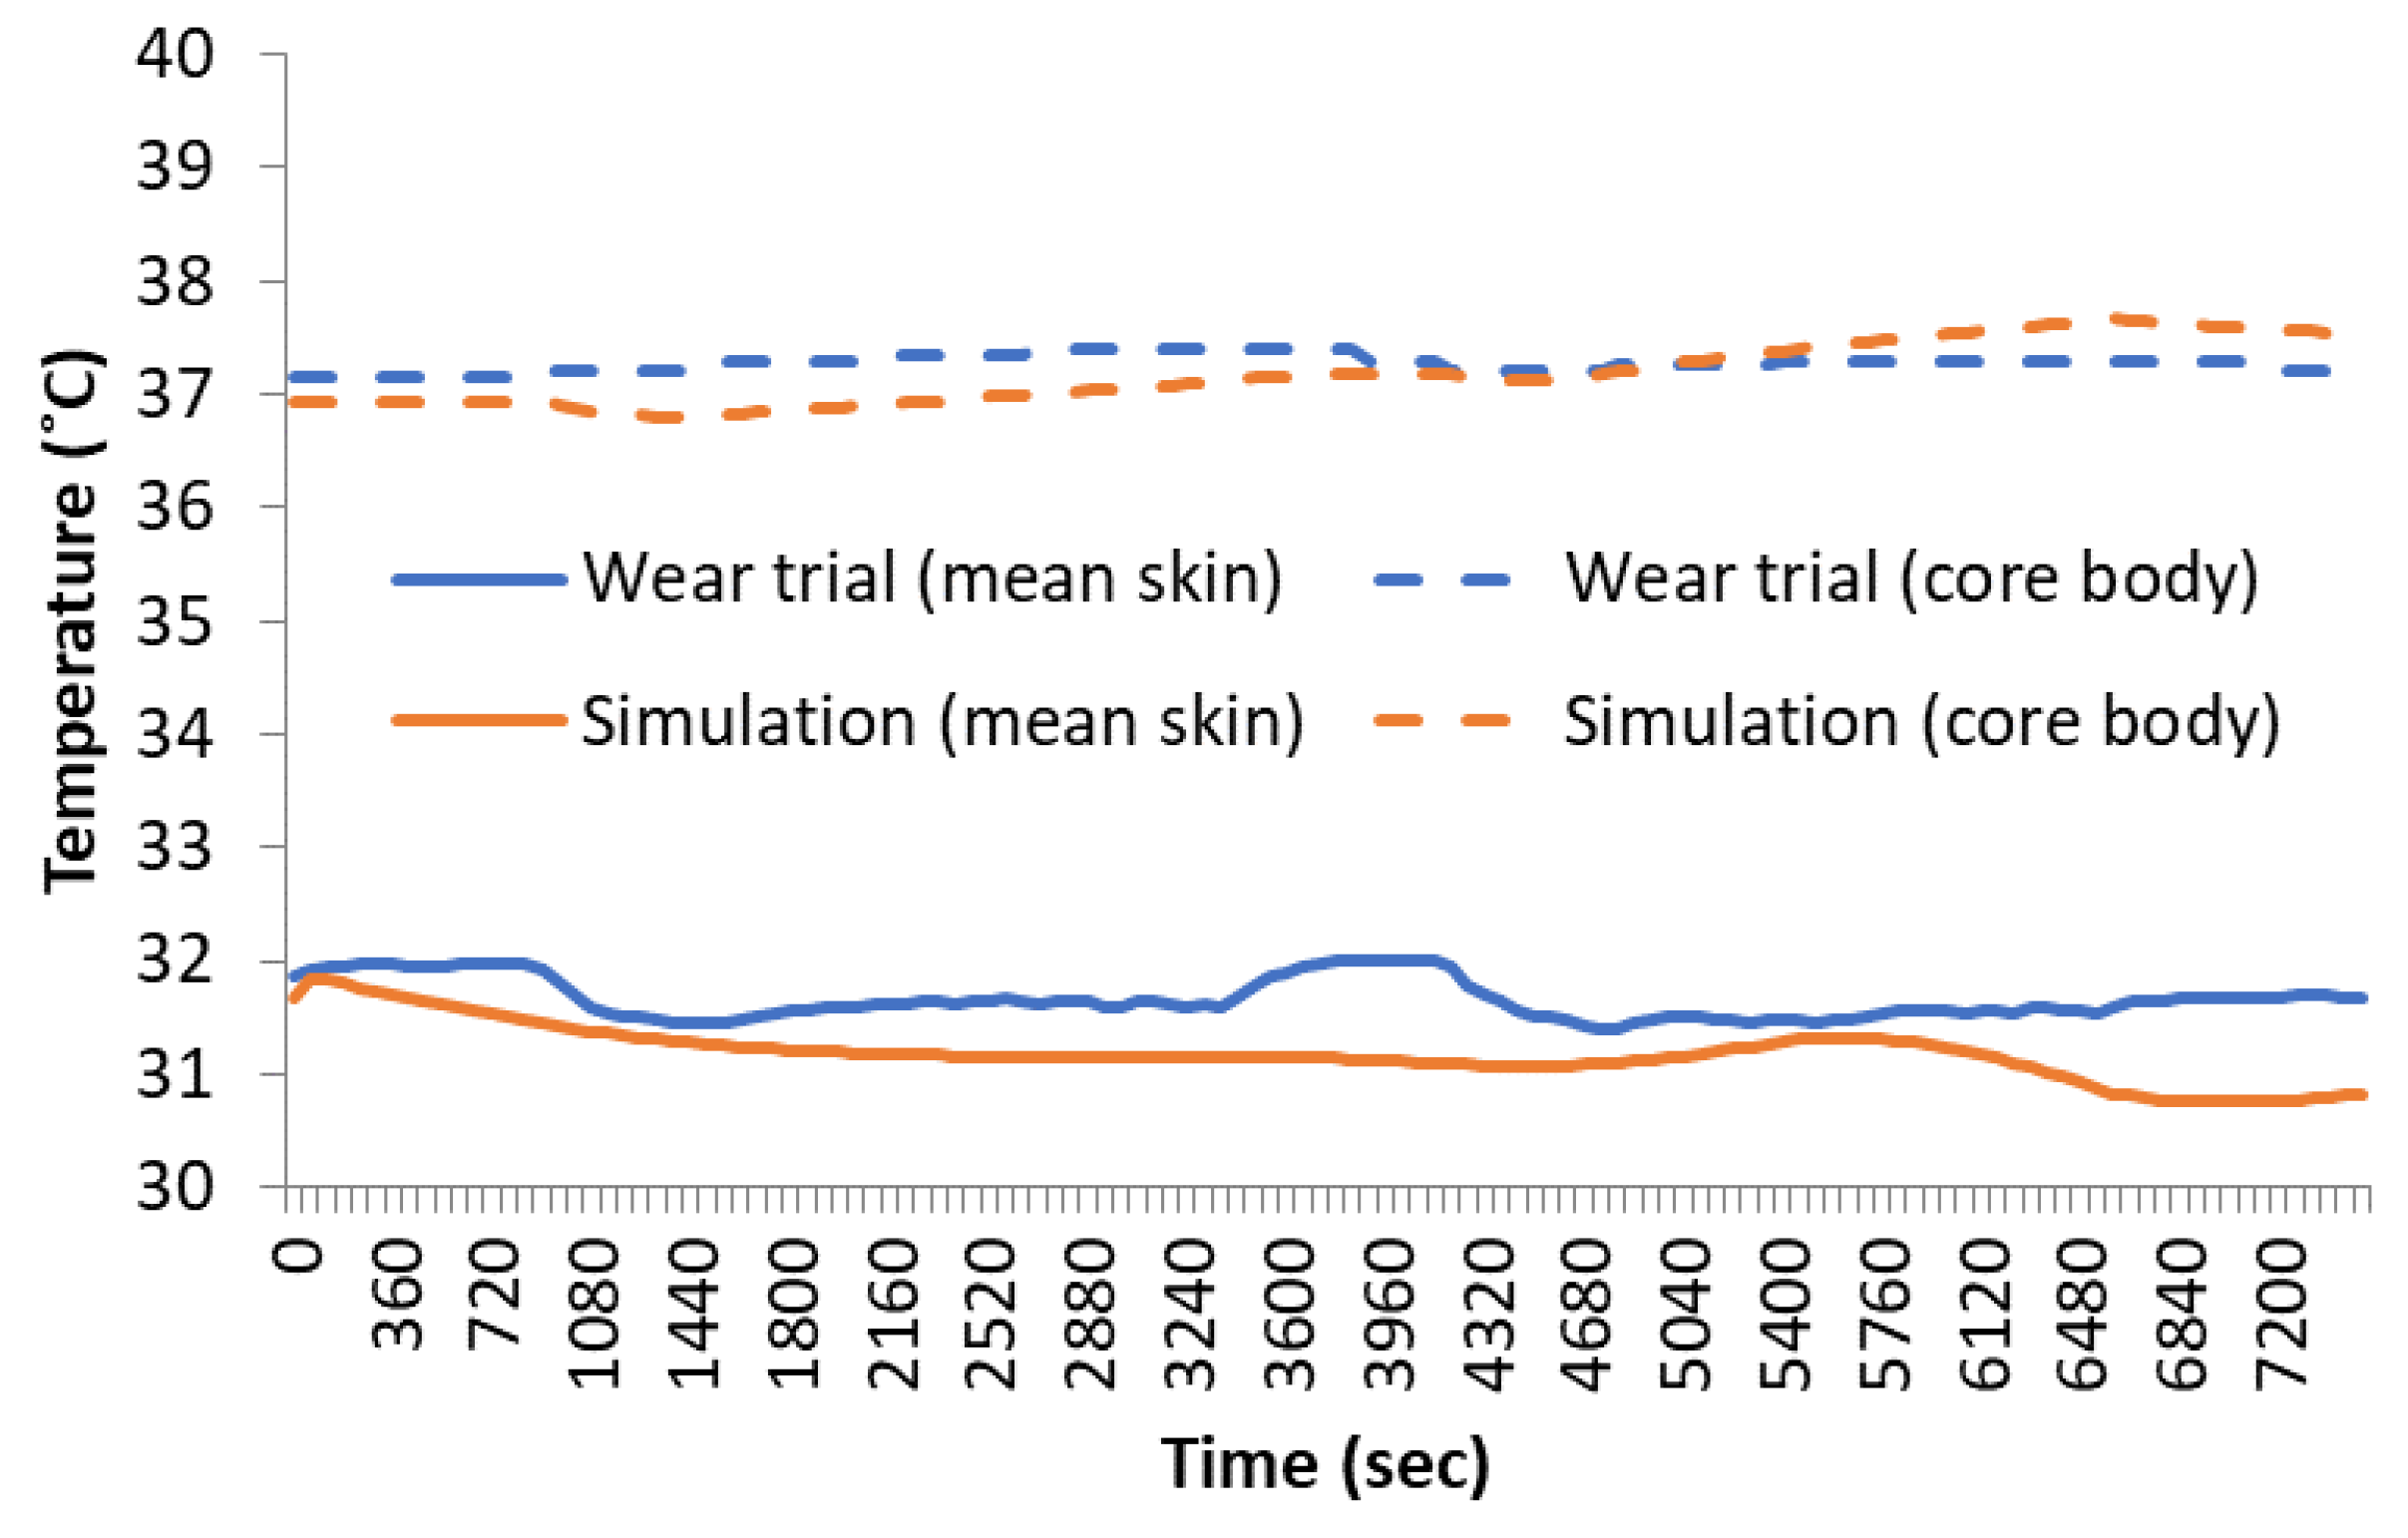
Figure 7.
Comparison of skin temperature at different places of the body during wear trial and simulation.
Figure 7.
Comparison of skin temperature at different places of the body during wear trial and simulation.


Figure 8.
Functioning of active system during simulation; (a) shows the vasoconstriction and vasodilation and (b) shows the sweating and shivering.
Figure 8.
Functioning of active system during simulation; (a) shows the vasoconstriction and vasodilation and (b) shows the sweating and shivering.

Table 1.
Characteristics of fabric.
| Properties | Instruments | Values |
|---|---|---|
| Fabric thickness [mm] | Karl Schröder KG Material tester | 0.56 |
| Average mass per unit area of the fabrics [g m−2] | GSM cutter and weighing balance | 184 |
| Thermal resistance [m2KW−1] | Skin model | 0.0059 |
| Water vapor resistance [m2PaW−1] | Skin model | 2.01 |
| Air permeability [mm s−1] | Air permeability Tester FX 3300 LABOTESTER III | 221 |
Table 2.
Phases during wear trials.
| Phase | Activity | Duration |
|---|---|---|
| 1 | Sitting | 15 min |
| 2 | Walking at 4 km/h | 40 min |
| 3 | Sitting | 15 min |
| 4 | Walking at 6 km/h | 40 min |
| 5 | Sitting | 15 min |
Table 3.
Details of sensor position during wear trials and weighting factor for overall skin temperature and humidity (ISO 9886).
Table 3.
Details of sensor position during wear trials and weighting factor for overall skin temperature and humidity (ISO 9886).
| No. | Positioning of the Sensors | Type of Sensors | Weight Factor (ISO 9886) |  | |
|---|---|---|---|---|---|
| 1 | Forehead | T | 0.070 | ||
| 3 | Shoulder | Right | RH, T | 0.175 | |
| 4 | Chest | Left | RH, T | 0.175 | |
| 5 | Upper arm | Right | RH, T | 0.070 | |
| 6 | Lower arm | Left | T | 0.070 | |
| 7 | Hand | Left | T | 0.050 | |
| 10 | Front of the upper thigh | Right | RH, T | 0.190 | |
| 9 | Lower back | Left | T | - | |
| 13 | Calf | Left | RH, T | 0.200 | |
Table 4.
Calculation of dimensionless parameters for defining the clothing layer.
| Description | Formula for Calculating the Parameters | Values [clo] |
|---|---|---|
| Icl | 0.03225 | |
| Icl/icl | 0.21306 |
Table 5.
Metabolic rate of test person during different levels of activity.
| Activity | Metabolic Rate (Met) |
|---|---|
| Sitting | 1 |
| Walking at 4 km/h | 2.7 |
| Walking at 6 km/h | 4.3 |
© 2020 by the authors. Licensee MDPI, Basel, Switzerland. This article is an open access article distributed under the terms and conditions of the Creative Commons Attribution (CC BY) license (http://creativecommons.org/licenses/by/4.0/).
Share and Cite
MDPI and ACS Style
Awais, M.; Krzywinski, S.; Wölfling, B.-M.; Classen, E. Thermal Simulation of Close-Fitting Sportswear. Energies 2020, 13, 2419. https://doi.org/10.3390/en13102419
AMA Style
Awais M, Krzywinski S, Wölfling B-M, Classen E. Thermal Simulation of Close-Fitting Sportswear. Energies. 2020; 13(10):2419. https://doi.org/10.3390/en13102419
Chicago/Turabian StyleAwais, Muhammad, Sybille Krzywinski, Bianca-Michaela Wölfling, and Edith Classen. 2020. "Thermal Simulation of Close-Fitting Sportswear" Energies 13, no. 10: 2419. https://doi.org/10.3390/en13102419
Note that from the first issue of 2016, this journal uses article numbers instead of page numbers. See further details here.