Natural Polymers for Green Supercapacitors
by

Giovanni Emanuele Spina
†, 
Federico Poli
†,
Alessandro Brilloni
,
Daniele Marchese
and
Francesca Soavi
* Department of Chemistry “Giacomo Ciamician”, Alma Mater Studiorum Universita’ di Bologna, Via Selmi 2, 40126 Bologna, Italy
*
Author to whom correspondence should be addressed.
†
These authors contributed equally.
Energies 2020, 13(12), 3115; https://doi.org/10.3390/en13123115
Submission received: 11 May 2020
/
Revised: 3 June 2020
/
Accepted: 10 June 2020
/
Published: 16 June 2020
(This article belongs to the Special Issue Advances in Supercapacitor Technology and Applications Ⅱ)
Abstract
:Water-processable natural polymers represent a valuable alternative for the sustainable manufacturing of electrical double layer capacitors (EDLCs). Here, we demonstrate for the first time the feasibility of the use of pullulan to produce high mass loading electrodes (>10 mg cm−2) at low binder content (10%) for ionic-liquid based EDLCs. Pullulan has also been processed as a porous separator by electrospinning. Its ionic resistance and thermal stability have been evaluated in different electrolytes and were found to be superior compared to those of a cellulose triacetate electrospun separator. Pullulan-ionic liquid EDLCs were, thus, assembled and charged up to 3.2 V. The EDLCs delivered specific energy and power of 7.2 Wh kg−1 and 3.7 kW kg−1 and featured good cycling stability over 5000 cycles.
1. Introduction
Today one of the biggest challenges our society is facing is how to replace the use of fossil energy sources (coal, oil, gas) with renewable ones (solar and wind). The inherent intermittence of the latter sources requires the development of efficient energy storage systems. Among all the possibilities, electrochemical energy storage by secondary batteries and electrical double layer capacitors (EDLCs) is one of the most efficient approach [1,2,3,4]. EDLCs are receiving great attention for their unique characteristics of outstanding power and cycle life, that are related to their electrostatic operating mechanism. However specific energies of EDLCs are one order of magnitude lower than that of batteries.
Commercial EDLCs feature activated carbon (AC) electrodes, a porous polymer separator, and an organic electrolyte, typically a solution of alkylammonium salts in acetonitrile or propylene carbonate. The use of the organic electrolyte enables cell voltages as high as 2.5 V [5].
The energy density of EDLCs can be improved by increasing: (i) the operating voltage window, (ii) electrodes specific capacitance, and (iii) the mass loading of the electrodes.
High operating voltage can be achieved by using an electrolyte with a wide electrochemical stability window, like ionic liquids (ILs) or highly concentrated aqueous electrolytes [6,7,8,9]. Electrode specific capacitance can be improved by tailoring carbon porosity to the electrolyte, in order to enhance ion access to the carbon surface. An alternative strategy is represented by the use of redox (pseudocapacitive) electrode materials, like metal oxides or electronically conductive polymers, in asymmetric or hybrid supercapacitors. Regarding the third approach, literature provides a very limited number of publications. Achieving mass loading higher than 5–10 mg cm−2 is considered a great challenge. Indeed, thick electrodes might delaminate from the current collector that is detrimental for cycling stability. Furthermore, high mass loading may lead to worse ionic and electronic connection between the carbon particles, leading to higher internal resistance [10,11,12].
Ionic liquids, thanks to their low flammability, represent an even safer alternative to the more volatile acetonitrile solutions. In addition, ILs are known for their high thermal stability, good conductivity and wide electrochemical stability window (>3 V). Despite these interesting properties, they cannot be considered as totally green and strategies to recover them after use are needed. The most investigated ILs for EDLCs are based on the bis(trifluoromethanesulfonyl)imide (TFSI) anion [13,14,15]. ILs feature bulky ions, therefore in order to promote a high and efficient exploitation of the electron carbon surface of the double layer, the porosity of the carbon has to be properly designed [16,17]. Furthermore, it has been demonstrated that the chemistry of ILs affects the double layer thickness and permittivity, and hence, the electrode capacitance. Indeed, in Ref. [1,2], the capacitive response of different carbon electrodes in N-butyl-N-methylpyrrolidinium bis(trifluoromethane-sulfonyl)imide (PYR14TFSI), 1-ethyl-3-methylimidazolium bis(trifluoromethanesulfonyl)imide (EmimTFSI) and PYR(2O1)TFSI was compared. In EmimTFSI, all the tested electrodes featured a specific capacitance that was double than that exhibited in the other ILs.
In EDLCs the biggest share of the cost is related to electrodes (28%) and electrolytes (27%). Electrodes are processed by casting slurries made of AC, conductive carbon, binder, and suitable solvents on metal current collectors. The binder material itself does not contribute significantly to the overall cost. However, its chemistry drives the selection of the solvent used for electrode processing, that has a great economic and environmental impact on EDLCs manufacturing [18]. Indeed, nowadays, commercial AC electrodes are mostly fabricated with F-based polymers as binders, such as poly (vinylidene difluoride) (PVdF) which needs N-methyl-2-pyrrolidone (NMP) as solvent/dispersant, both very toxic for humans and environment. This process requires expensive atmosphere-controlled environments [19].
In light of that and to meet the requirements of sustainable and cheaper production processes, much effort is being devoted to the substitution of F-based components with alternative ones. Transition to aqueous electrode preparation by non-toxic binders is expected to provide a great step forward towards an ideally sustainable and environmentally friendly technology for energy storage systems [20,21].
Carboxymethyl cellulose (CMC) represents the state of the art of water-soluble binders [10,21,22,23,24]. One of the first attempts of substituting F-based compounds with CMC, was reported by Bonnefoi et al. in 1999 [25]. Two of the major drawbacks in the use of CMC, are: (i) the relatively low achievable electrode mass loading, and (ii) the brittleness shown after the drying step. Winter et al. [23], first proposed Natural Cellulose (NC). While NC is cheaper (0.5–1.5 EUR kg−1 vs. 1–2 EUR kg−1) and more abundant than CMC, it cannot be dissolved in water nor in almost all organic solvents while being soluble in certain ionic liquids [26,27,28,29]. Varzi et al. dissolved NC in 1-ethyl-3-methylimidazolium acetate (EmimAc) and demonstrated that NC has enhanced stability at high voltages. An EDLC assembled with electrodes featuring 10% NC binder and a mass loading of ca. 3 mg cm−2 and PYR14TFSI ionic liquid electrolyte, exhibited a specific capacitance of ca. 13 F g−1 at 10 mA cm−2, and a capacitance retention of 52%, after cycling for 750 h at 3.7 V [30]. Pursuing the research of even more eco-friendly binders, potato starch, a highly abundant polysaccharide that can be extracted from non-edible potatoes, was also proposed. By the use of this polysaccharide, the production of thick electrodes (240 µm, 9.3 mg cm−2) was demonstrated [18]. These electrodes were used to assemble a 2.5 V-EDLC with 1 M Et4NBF4 in propylene carbonate (PC) electrolyte, that delivered 0.36 F cm−2 at 10 mA cm−2.
Recently, we demonstrated the use of the biodegradable biopolymer pullulan (Pu) as a water processable separator and binder for EDLCs. Specifically, the separator was obtained by electrospinning and the EDLCs featured EmimTFSI electrolyte and pepper seed derived biochar carbon. The EDLC was able to operate at 3.2 V and delivered up to 5 kW kg−1 specific power and 27.8 Wh kg−1 specific energy. Its performances were compared with that of conventional electrical double-layer capacitor, with the added value of being eco-friendly and cheap.
Furthermore, the smart combination of the water-soluble, biodegradable Pu with the hydrophobic ionic liquid EmimTFSI, enabled a novel and easy approach for the recovery of EDLC components at the end-of-life. Indeed, the IL and carbon easily separate when immersed in water. The expensive IL can therefore be recollected for a second use [31].
Following these preliminary results, here we report the challenging study that aims to demonstrate the feasibility of the use of Pu to process electrodes at low binder content (10%) and high mass loading (>10 mg cm−2). In the first part of our work we compare the electrochemical response and thermal stability of Pu and cellulose triacetate (CTA) in different electrolytes, namely EmimTFSI, 0.5 m LiTFSI TEGDME, PYR14TFSI. The two natural polymers have been processed by electrospinning and their contribution to ionic resistance of the electrolyte has been investigated by Electrochemical Impedance Spectroscopy (EIS) at different temperatures. On the basis of this investigation, Pu and EmimTFSI were selected to assemble two different EDLCs, one with low electrode mass loading and high binder content (HBLME) and a second one with high mass loading and low binder content (LBHME). The EDLCs have been tested by cyclic voltammetry, EIS and galvanostatic charge/discharge cycles. A deep analysis of the EDLCs performance is reported and discussed to demonstrate that natural polymers and, specifically Pu, may pave the way towards a new approach for a green manufacturing of EDLCs.
2. Materials and Methods
2.1. Materials
N-butyl-N-methylpyrrolidinium bis(trifluoromethanesulfonyl)imide (PYR14TFSI, purity >99.9%) was purchased from Solvionic (Toulouse, France). 1-Ethyl-3-methylimidazolium bis(trifluoromethanesulfonyl)imide (EmimTFSI, purity >99%) was purchased from Solvent Innovation (Köln, Germany). Lithium bis(trifluoromethanesulfonyl)imide and tetraethylene glycol dimethyl ether (TEGDME) (purity >99%) were both purchased from Sigma-Aldrich (St. Louis, MO, USA). Activated carbon PICACTIF was purchased from PICA (Basiano, Italy). Conductive carbon additive (SUPER C45) was purchased from TIMCAL (Bodio, Switzerland). Pullulan (P0978, η = 15.0 ÷ 180.0 mPa s, 10% in H2O at 30 °C) was purchased from TCI Europe (Zwijndrecht, Belgium). Cellulose triacetate (CTA, Mw = 74,000 g/mol, DS 3.0) was purchased from Honeywell Fluka (Charlotte, NC, USA). Glycerol (purity >99%) was purchased from Sigma-Aldrich. Nickel foam was purchased from Alantum (Munich, Germany).
2.2. Preparation of the Electrospun Separator
Electrospinning was used to prepare the non-woven separator. In particular an home-made electrospinning apparatus has been used, this consisted of a high-voltage power supply (SL 50 P 10/CE/230, Spellman, West Sussex, UK), a syringe pump (200 series, KD Scientific, Holliston, MA, USA), a glass syringe containing the polymer solution and connected to a stainless-steel blunt-ended needle (inner diameter = 0.51 mm) through a polytetrafluoroethylene (PTFE) tube. The Pu membrane was electrospun starting from a 23% w/v solution of pullulan in Milli-Q water. The solution was spun at 18 kV at 20 cm from the collector with a flow rate of 1 mL h−1. The cellulose triacetate (CTA) separator has been electrospun starting from a 6% w/v. solution in DCM/EtOH 80/20 solution. The solution was spun at 15 kV and at a 15 cm distance from the collector with a flowrate of 2 mL/h, at room temperature (RT) with a relative humidity of 40–50%. After electrospinning the mat has been soaked into a 0.1 M solution of sodium hydroxide in a mixture of Ethanol and water 4:1 v/v for 24 h. In the end the electrospun separator was washed in MilliQ water twice for fifteen minutes each.
2.3. Membrane Characterization
Electrospun membranes have been characterized at first by scanning electron microscopy (SEM) using an EVO 50 apparatus (Zeiss, Oberkochen, Germany). The feasibility of the use of the electrospun mats as separators was evaluated by EIS. Swagelok-type cells with two stainless steel blocking electrodes (0.9 cm diameter), separated by the membranes (dried overnight before use at RT) soaked in the different investigated electrolytes, were used. The EIS spectra were collected by a VSP multichannel potentiostat/galvanostat/FRA (BioLogic, Seyssinet-Pariset, France) within 500 kHz–100 mHz frequency range and 5 mV AC perturbation, acquiring 10 points per decade. The cells were thermostated at 30, 40 and 60 °C by a thermostatic oven. The bulk conductivity of the electrolytes without membranes were measured by a CDM 210 Conductivity Meter (MeterLab, Milano, Italy) with an Amel standard cell (platinum electrodes). The temperature was controlled by a DC50 K40 thermocryostat (Haake, Thermo Fisher Scientific, Karlsruhe, Germany) with an accuracy of 0.1 °C. Samples were thermostated for 1 h before every measurement.
2.4. Preparation of the Electrodes
Electrodes were prepared using the mesoporous carbon PICACTIF from PICA (BP10) as reported in [8] and described in Figure S1a. BP10 featured a Brunauer, Emmett and Teller (BET) specific surface >2000 m2 g−1 and a pores size distribution centered at 2.7 nm [8]. Two water processable formulations have been studied. A first one with 70% BP10, 10% Carbon black, 20% pullulan-glycerol (1:1 wt) and low mass loading (3.6–4.6 mg cm−2) is referred in the following text as high binder low mass electrode (HBLME). A second one with 85% BP10, 5% Carbon black, 10% pullulan-glycerol and higher mass loading is labelled as low binder high mass electrode (LBHME). Electrodes have been obtained by casting on pre-cut nickel foams (diameter 0.9 cm) a slurry containing 23.5 mg of BP10, 3.5 mg of carbon black (as conducting additive), 6.7 mg of pullulan (P0978, TCI) and glycerol in 0.8 g of MilliQ water for HBLME. For LBHME the ink was composed of 40.2 mg of BP10, 2.3 mg of carbon black (as conducting additive), 4.7 mg of pullulan and glycerol in 0.57 g of MilliQ water. The electrodes were then dried in an oven (under vacuum) overnight at room temperature (Büchi glass oven B-585). The composite electrode loadings (excluding the nickel foam mass) are reported in Table 1.
2.5. Supercapacitor Assembly
A T Swagelok-type cell assembly (BOLA Cell made from Teflon, BOLA GmbH, Grünsfeld, Germany) with a silver quasi-reference electrode disk and stainless-steel current collectors was used. Cells were assembled in a dry box (Labmaster 130, H2O, and O2 <0.1 ppm MBraun, Garching, Germany). The separator (12 mm diameter) and the electrodes (9 mm diameter) were soaked under vacuum together with the IL before the assembly. The ratio of the positive to negative electrode composite loading was >1 to achieve cell voltages higher than 3 V [32]. EDLCs were assembled with two carbon based composite electrodes alienated by a circular sheet of electrospun pullulan separator, with 1-ethyl-3-methylimidazolium bis(trifluoro-methylsulfonyl) imide IL (EmimTFSI) as the electrolyte, as described in Figure S1b.
2.6. Supercapacitor Characterization
The electrochemical tests consisted in EIS, cyclic voltammetry (CV) and galvanostatic (GCPL) tests and were performed in a thermostatic oven at 30 °C using a BioLogic VSP multichannel potentiostat/galvanostat/FRA. EIS was performed with a 100 kHz–100 mHz frequency range and 5 mV AC perturbation, acquiring 10 points per decade. To evaluate the impedance of each of the EDLC electrodes, three electrode measurements, have been done. A silver disk has been used as pseudo reference. Here, the working electrode was the tested one and counter the other. To evaluate the complete cell impedance, two electrode measurement have been done. For two electrode measurements, the silver disk was disconnected, the EDLC positive electrode was the working, and the EDLC negative electrode was connected to the counter and reference instrument plugs.
CV discharge curves were analyzed to get a first evaluation of the EDLC specific capacitance (CEDLC). Specifically, CEDLC was calculated from the slope of the voltammetric plots of the discharge capacity vs. cell voltage. The capacity was calculated by the integral of the CV current over time. The slope values were divided by the total composite mass of the two electrodes (mtot).
The GCPL curves were analyzed to quantify the equivalent series resistance (ESR) and the CEDLC, the specific energy and power of the devices at different discharge currents. ESR was calculated according to Equation (1), where ΔVohmic is the ohmic voltage drop at the beginning of discharge, and is the current density (A cm−2):
ESR = ΔVohmic/(2 × i)
CEDLC was calculated from the reciprocal of the slope of the GCPL voltage profile during the discharge (dt/dV) by Equation (2):
CEDLC = i × dt/dV/mtot
The single electrode specific capacitance (Celectrode) was therefore calculated from the EDLC’s one by Equation (3)
Celectrode = 4 × CEDLC
The EDLCs specific energy (E) and power (P) were calculated from the GCPL discharge curves through Equations (4) and (5):
where Δt is the discharge time in seconds.
E = i ∫V × dt/(3600 × mtot)
P = 3600 × E/Δt
3. Results
3.1. Electrospun Separator and Electrolyte Selection
Figure 1a,b report the SEM images of the electrospun Pu and CTA membranes, respectively. They feature interconnected fibers, randomly deposited, with a low number of defects. The Pu mat thickness was 55 µm and the mean fiber diameter was around 0.3 µm. The CTA mat thickness was 22 μm and the mean fiber diameter was around 0.6 μm. The fiber thickness of the two mats is in line with the value already reported for electrospun separators obtained with different polymers [33]. Furthermore, the PU and CTA mat thicknesses were adequate for an easy handling and assembly of the EDLCs. In addition to the difference in fiber diameter, the two polymers differ in terms of fiber diameter distribution, the CTA fibers being less homogeneous with a broader distribution.
Before the evaluation of the ionic conductivity response of the membranes, at first bulk conductivity of the electrolytes was measured. The values at different temperatures are reported in Table 2. The ionic conductivity of all the tested electrolytes grows with temperature. Among the considered electrolytes, the most conductive one is the EmimTFSI. Specifically, at 30 °C EmimTFSI features 12.6 mS cm−1, which is 5-fold higher than the conductivity of 0.5 m LiTFSI in TEGDME (2.05 mS cm−1) and PYR14TFSI (3.01 mS cm−1).
The separators of the EDLCs should be designed in order to achieve low ESR. This can be obtained by minimizing their hindrance to the ion flow during the charge/discharge, while guaranteeing the electronic separation of the two electrodes.
In order to evaluate the contribution of the investigated separators and electrolytes to ESR, EIS measurements were performed. The tests were carried out using cells with stainless steel blocking electrodes separated by the separator soaked with the electrolyte. EIS was carried out at constant interval of time (24 h) and at different temperature (30 °C, 40 °C and 60 °C) to check the chemical and electrochemical stability of the different membranes in the tested electrolytes.
As an example, Figure 2 reports the Nyquist plots of the electrospun pullulan separator in EmimTFSI over time at the different tested temperatures. The Nyquist plots for all the combination of Pu and CTA membranes with the different electrolytes are reported in Figure S2.
In Figure 2, the impedance spectra of the Pullulan membrane resemble a straight line. This response can be modelled with a resistance (R) in series with a constant phase element (Q), therefore the resulting impedance is given by the following equation:
Z = R − 1/(j ω Q)n
In Equation (6), R is the equivalent resistance of the separator soaked in the electrolyte and can be evaluated from the intercept with the real axis in the 150–300 kHz frequencies region. It includes the electronic resistance of the current collectors and the ionic resistance of the cell which reasonably dominates the response. When n = 1, the plot is a line parallel to the imaginary axis and Q represents the capacitive response of the cell. When n = 0.5, the plot is a line with a slope of 45° and Q corresponds to the Warburg element that is representative of diffusion-controlled processes.
Figure 2 shows that the temperature increase leads to the decrease of the resistance of the cell that is related to the increase of the electrolyte conductivity (cf. Table 2). In parallel, it is noticeable that the slope of the Nyquist plot decreases, unvealing that ion diffusion through the membrane becomes more sluggish.
This behaviour could be explained with the swelling of the membrane at the highest temperature that, in turn, brings about thickening of the fibres and narrowing of the inter-fibre voids. This might result in a more tortuous path for ion conduction.
Tables S1 and S2 and Figure 3a,b report the values of resistance of Pu and CTA membrane respectively, at different temperatures over time, in the different electrolytes. The values are in the same order of magnitude and span between ca. 2 and 5 ohm cm2. The first day at 30 °C, Pu features 2, 3 and 3.5 Ohm cm2 when soaked with EmimTFSI, 0.5 m LiTFSI TEGDME and PYR14TFSI, respectively. CTA exhibits 2, 3 and 3.5 Ohm cm2 with EmimTFSI, 0.5 m LiTFSI TEGDME and PYR14TFSI. Therefore, resistance values are similar for both membranes in the same electrolytes, with EmimTFSI accounting for the smallest values. A more straightforward comparison must consider the mat thickness of both separators and can be carried out referring to the effective resistivity (ρeff) of the membrane-electrolyte system. The value of ρeff can be obtained by Equation (7):
where R is the resistance (in Ohm), L is the membrane thickness (cm), and S is the current collector area (cm2).
ρeff = S × R/L
As commented above, Pu separator features a thickness of 55 μm that is almost 2.5 times larger than the CTA’s that is 22 μm. Therefore, ρeff of Pu at 30 °C in EmimTFSI results 450 Ohm cm and is almost half than CTA’s (over 1000 Ohm cm). This can be related to the thinner fibres of the former membrane (0.3 μm) vs. the latter (0.6 μm). Thinner fibres provide a greater surface area and a greater density of free volume that can be exploited by ions to achieve higher conductivity. Noticeably, the resistance values of Pu at the different temperatures keep almost constant during time. At the contrary, those of CTA membrane gradually increase achieving 5 Ohm cm2 at 60 °C, after 5 days, a value that doubles the Pu ones. Furthermore, after six day, the temperature was lowered to 30 °C. The resistance of Pu-EmimTFSI went back to its initial value while the CTA-EmimTFSI ones doubled (4 Ohm cm2). This indicates that the swelling process promoted by the increase of temperature is reversible for Pu but not for CTA. Overall, the data of Figure 2 suggest that Pu membrane is more stable than CTA.
In order to get further insight into the contribution of the separator to the ESR, the Mac Mullin number (NM) has been calculated for all the tested systems. Indeed, NM quantifies the increase of resistivity of the separator soaked in the electrolyte (ρeff) with respect to the bulk resistivity of the electrolyte solution (ρ0), and it is calculated after Equation (8):
where ρeff has been evaluated by Equation (6) using the resistance values listed in Tables S3 and S4. In turn, ρ0 is the reciprocal of the electrolyte conductivity (σ0) and is calculated by Equation (9):
NM = ρeff/ρ0
ρ0 = 1/σ0
The NM values for the different separator/electrolyte combinations at the different temperatures are reported in Tables S5 and S6 and in Figure 3c,d as comparative histograms.
The values of the Pu are always smaller than those of the CTA in all the tested condition. For both membranes, in all the tested conditions, EmimTFSI holds the greater values of NM, while the smaller ones are exhibited by 0.5 m LiTFSi in TEGDME. The first day at 30 °C, Pu features NM of 5, 1 and 2 when soaked with EmimTFSI, 0.5 m LiTFSI TEGDME and Pyr14TFSI, respectively. For CTA, NM is 13, 3 and 5 with EmimTFSI, 0.5 m LiTFSI and PYR14TFSI. These trends indicate that EmimTFSI is the electrolyte that has a conductivity that is more affected by the presence of the membranes. In turn, this can be explained taking into account the protic behaviour of EmimTFSI. Indeed, unlike the other electrolytes, EmimTFSI features an acidic proton in alpha position in the imidazolium ring, that contributes to its bulk ionic conductivity. When EmimTFSI is in contact with the membranes this proton drives specific acid-base interactions that decrease its activity. Specifically, it can be claimed that hydrogen bond with the carboxyl functionalities of the membranes are formed (Figure 1).
For both separators soaked with EmimTFSI, NM increases with temperature. In case of Pu, it reaches a maximum of 11 on the day 3 at 60 °C. For CTA NM is 65 during the day 5 at the same temperature. Once cooled at 30 °C (day 6), Pu-EmimTFSI’s NM reversibly reduces to 4 that is even smaller than its initial value, in agreement with the resistance trend (Figure 3a). At the contrary CTA-EmimTFSI’s NM does not recover its initial value and doubles (25).
To conclude this section, EmimTFSI-Pu featured a resistance considerably smaller than the one obtained with the other electrolytes. Pu ehibited a lower McMullin number than CTA along with a better thermal behaviour. Therefore, the pullulan based electrospun membrane and EmimTFSI were selected to assemble and test EDLCs as described in the next section below.
3.2. Supercapacitor Testing
The EDLCs featured the commercial high surface area carbon BP10 and the conductive additive Super C45. We already demonstrated the good binding properties of the pullulan: glycerol mixtures, that was therefore selected for the aqueous processing of the carbon composite electrodes [31].
The following sections report the electrochemical characterization of EDLCs assembled with 20% binder and low composite electrode mass loading (3.6–4.6 mg cm−2), referred as high binder low mass electrode (HBLME, Section 3.2.1), and with 10% binder and higher mass loading, labelled as low binder high mass electrode (LBHME, Section 3.2.2). The first composition was meant to verify the feasibility of the use of Pu binder and Pu membrane in the tested electrolyte while the second is meant to reach a formulation closer to that exploited commercial EDLCs. Section 3.2.3 compares the performances of HBLME and LBHME based EDLCs.
The electrochemical tests at first included EIS measurements of both the individual electrodes and of the full cell. These tests enable the evaluation of the EDLCs ESR that accounts for the contributions of (i) the contact resistance between composite material and current collector and (ii) the ionic resistance of the separator/electrolyte. Two electrodes cyclic voltammetry (CV) experiments have been carried out between 0 V and 3.2 V to evaluate the electrochemical stability and the capacitance of the EDLC as function of the scan rate. Galvanostatic (GCPL) charge/discharge measurements between 0 and 3.2 V (GLV) at different specific currents were subsequently performed to evaluate the specific energy and power. Finally, GCPL cycling has carried out at 1 A g−1 in order to evaluate the stability of the proposed EDLCs.
3.2.1. High Binder Low Mass Loading Electrodes (HBLME)
In this section, the results of the electrochemical characterization of the HBLME-EDLCs are reported. Figure 4a shows the Nyquist plots of the HBLME-EDLC single electrodes and the full cell. The three Nyquist plots share all the same shape. They can be divided into three components: (i) a high frequencies semicircle, (ii) a middle frequencies line with a slope of ca. 45°, and (iii) a low frequency line that approaches a slope of 90°. The intercepts at the highest frequencies of the semicircles represents the ohmic resistances (electronic and ionic) of the electrodes and electrolyte-separator system. Values of 1.4, 1.5 and 3.3 Ohm cm2 have been measured, respectively for the negative, the positive electrode and the full cell. The small semicircle has been attributed to (i) the ion transport at the electrolyte-carbon interface and (ii) the contact between the electrode and the current collector [34]. For the full cell the semicircle diameter is 0.3 Ohm cm2. The middle frequency line with 45° slope is representative of diffusion limited phenomenon. Specifically, it refers to diffusion of ions required to charge inner pores of the carbon electrodes. The low frequency line represents the capacitive behavior of the electrodes and the EDLC. For an ideal EDLC, a vertical line is expected. In Figure 4a the lines deviate from this ideal behavior because of the presence of different class of pores [35]. The real axis intercept of the linear fit of the cell low frequency line gives the ESR that was quantified in 6.4 ohm cm2.
Figure 4b reports the CVs of the full HBLME-EDLC cell at different scan rate, between 0 and 3.2 V. The voltammogram are symmetric and box shaped, which indicates the absence of faradic secondary process and an electrical double layer driven process. The maximum current of 3 A g−1 (25 mA cm−2) is reached with a scan rate of 200 mV s−1, this value is comparable with the ILs based EDLC already reported in literature [8]. Figure 4c reports the trend of CEDLC versus the scan rate. The highest specific capacitance of HBLME-EDLC is 18 F g−1 at 5 mV s−1 and decreases to 14 F g−1 at 200 mV s−1. This trend has been widely discussed in literature and is attributed to the ionic diffusion limitation upon the double layer formation in the smallest pores at fast scan rates [36]. Indeed, micropores with an internal area less exposed to the electrolytes need more time for the creation of the electrical double layer than bigger pores. At low scan rate, the polarization is slow and ions have enough time to access the internal area of micro-pores. Increasing the scan rate, only the external surface of the pores becomes easily accessible. This process also explains the 45° Warburg line of the Nyquist plot of Figure 4a.
Figure 4d reports selected voltage profiles of the HBLME-EDLC under galvanostatic charge/discharge cycles at different current density, between 0 and 3.2 V. The voltage profile of the cell has a symmetric, triangular shape which is characteristic of electrical double layer driven process. Increasing the current from 0.5 to 4 A g−1 leads, as expected, to the decrease of the charge/discharge time. Coulombic efficiency (ηc), i.e., the ratio between the charge released during discharge and the charge stored during charge, is reported as inset in Figure 3d. This quantity is always greater than 98% and reaches the highest value of 100% at 4 A g−1. The GCPL ohmic drops were analyzed to quantify ESR of the device and resulted in 5.9 Ohm cm2, that well compares with the value obtained by EIS. EDLC. Specific capacitance CEDLC has been calculated from the slope of the GCPL discharge profile and for HBLM-EDLC resulted in 15.9, 15.4, 14.6 and 13.7 F g−1 at 0.5, 1, 2 and 4 A g−1, respectively. The corresponding single electrode specific capacitances (Celectrode) are 63, 61, 58 and 54.8 F g−1. These values well compare with those of electrodes featuring the same electrolyte and carbon but employing a fluorinated binder [8]. Table 3 reports the ESR and CEDLC at 0.5 A g−1 of the HBLME-EDLC along with the EDLC areal capacitance.
3.2.2. Lower Binder High Mass Loading Electrodes (LBHME)
In this section, the results of the electrochemical characterization of the LBHME-EDLCs are reported. Figure 5a shows the Nyquist plots of the LBHME-EDLC single electrodes and full cell.
Like for HBLME, the three Nyquist plots share all the same shape. For the physical interpretation of the Nyquist plots, the considerations that have been drawn in the previous section are still valid. The high frequency intercepts with the real axis of the semicircles are 0.8, 0.9 and 1.7 Ohm cm2 for the positive and negative electrodes and full cell, respectively. Noticeably these values are halved with respect to those of the HBLME electrodes and EDLC (cf. Figure 4a). In LBHME formulation, the quantity of binder and conductive carbon are halved compared to the HBLME one. Therefore, the decrease of the high frequency impedance achieved by LBHME can be explained with the decrease of the insulating component of the electrode, i.e., the binder. Comparing the high frequency semicircles in Figure 4a and Figure 5a, it is possible to notice that the LBHME’s is wider than HBLME’s. Indeed, the LBHME-EDLC semicircle diameter is 1.3 Ohm cm2 while the HBLME’s is 0.3 Ohm cm2. This difference is due to the high mass loading of LBHME with respect to HBLME (1.5-fold), that brings about a worse ionic and electronic connection between the carbon particles [10]. The LBHME-EDLC middle frequency line (45° slope) span across the same range of resistance with respect to the HBLME-EDLC. The ESR of the LBHME-EDLC was evaluated from the real axis intercept of the low frequency line and resulted in 7.6 Ohm cm2.
Figure 5b reports the CVs of the full LBHME-EDLC cell at different scan rate, between 0 and 3.2 V. From these measurements, voltammetric specific capacitance values have been calculated and are reported as function of the scan rate in Figure 5c. The highest specific capacitance is 14 F g −1 at 5 mV s−1 and decreases to 7 F g−1 at 200 mV s−1. Therefore, from 5 mV s−1 to 200 mV s−1 there is a 50% specific capacitance reduction, that is higher than what observed for HBLME-EDLC (22%). This can be related to a not optimized electronic and ionic connection of the electrodes carbon particles that has been highlighted by the Nyquist plot analysis reported above (Figure 5a).
The LBHME-EDLC galvanostatic charge/discharge profiles at different current are reported in Figure 5d. The coulombic efficiency was 98.3%, 99.6%, 100%, 100% at 0.5, 1, 2, 5 A g−1, respectively. These values are slightly higher than those that have been observed for the HBLME. The ESR was 7.9 Ohm cm2 in agreement with the EIS value. The CEDCL was 6.2, 5.8, 5.3 and 4.2 F g−1 at 0.5, 1, 2 and 5 A g−1. These values are lower than those featured by HBLME-EDLC and this can be explained with the not optimized ionic and electronic connection highlighted by Table 3 that reports the ESR and CEDLC at 0.5 A g−1 of LBHME-EDLC. The EDLC areal capacitance is also reported in the Table 3.
3.2.3. Cycling Stability, Energy and Power of HBLME- and LBHME-EDLCs
Figure 6a reports the trends of the specific capacitance of the two EDLCs over cycling at 1 A g−1. The values are normalized by the value of the specific capacitance of the first cycle. Both devices show a good stability with capacitance retention of 90% at the 2000th cycle. This result demonstrates the feasibility of the use of pullulan as alternative separator and binder for green supercapacitors.
Note that the cycling stability of LBHME-EDLC at low binder content was further evaluated even over 5000 cycles (Figure S3). The test indicated that also over prolonged cycling, a capacitance retention of 77% can be obtained.
The specific energy and power values of the two EDLCs, calculated through Equations (4) and (5) are compared in the Ragone plot reported in Figure 6b. Both devices deliver the maximum specific energy at the lowest current, and the maximum power is delivered at the highest current.
Indeed, at 0.5 A g−1, the specific energy is 19.6 Wh kg−1 and 7.2 Wh kg−1 for HBLME-EDLC and LBHME-EDLC, respectively. At 4 A g−1, the specific power is 4.7 kW kg−1 for the HBLME EDLC and 3.8 kW kg−1 for the LBHME-EDLC. These values are reported in Table 3. If energy and power are normalized by the electrode area, they become 182 µWh cm−2 and 42.8 mW cm−2 for the HBLME-EDLC, and 99.4 µWh cm−2 and 51 mW cm−2 for the LBHME-EDLC (Table 3). These results clearly demonstrate that increasing electrode thickness is detrimental for energy and power performance. Indeed, specific energy of LBHME-EDLC is lower than HBLME-EDLC and this is mainly related to an inefficient exploitation of the electrode carbon surface. This is highlighted by the comparison of the area capacitance of HBLME-EDLC (148 mF cm−2) and LBHME-EDLC (85.5 mF cm−2). Therefore, in LBHME-EDLC, the increase of the electrode mass is not enough to offset such specific energy decrease, and the areal energy density keeps lower than that of HBME-EDLC. However, power performance of the two EDLCs are comparable, suggesting that the decrease of the binder content has a positive effect.
4. Discussion
Today many efforts are being devoted to increasing the specific energy of supercapacitors by different strategies. Among them promises are held by the use of ionic liquids, thick electrodes and pseudocapacitive active materials [2,6,12]. Ionic liquids enable high practical voltage (>3 V) and therefore energy density, but their major drawbacks are the greater ESR respect to commercial electrolytes and high cost. The use of thick electrodes (>10 mg cm−2) may seem the simpler solution, but the achieving high performance ith thick electrodes is still an unsolved problem [10,11]. Indeed, thick electrodes suffer of poor electronic and ionic connection between the particles, and only the external portion of the electrodes take part in the charge/discharge processes.
The increasing market for supercapacitors requires that sustainable manufacturing processes and materials are exploited to manufacture green supercapacitors. Aqueous processable bio-derived polymers represent a valuable alternative to today’s fluorinated separators and binders. Furthermore, we have already demonstrated that the smart combination of a water processable binder and separator (like pullulan) and a hydrophobic ionic liquid electrolyte (EmimTFSI) enables an easy recovery of the expensive ionic liquid [31]. Indeed, the pullulan-IL-based EDLC can be readily separated into each of its components by immersion in water. After these very interesting but preliminary results, in this paper we have carried out a study to get further insight into the impact of the use of natural polymer in supercapacitors performance. We have investigated the use of cellulose, which is the most widely studied bio-based polymer for green supercapacitors, and pullulan, that we have proposed for the first time in [31]. CTA and Pu separators were processed as self-standing mats by electrospinning. Their permeability to different electrolytes (EmimTFSI, 0.5 m LiTFSI TEGDME, PYR14TFSI), which is critical in the formation of the electrical double layer, has been evaluated by EIS and quantified referring to the Mac Mullin number. This characterization has been done at different temperatures over one week, in order to get insight on the thermal and chemical stability of the tested bio-polymer in the selected electrolytes. Both membranes at 30 °C featured the lower resistance (Pu 2 Ohm cm2 CTA 2 Ohm cm2) when soaked with EmimTFSI. However, given that the thickness of Pu (55 µm) was higher than that of CTA (22 µm), the resistivity of the Pu-EmimTFSI system was considerably smaller (0.407 kOhm cm vs. 1.041 kOhm cm). Furthermore, Pu-EmimTFSI exhibited a better thermal stability respect to the CTA-EmimTFSI. Notably, the NM for the Pu is always smaller than that of CTA, in particular, in EmimTFSI values of 5 and 12 were found, respectively. Overall, this study highlighted the presence of different and specific interactions between the tested electrolytes and the membranes that affect the ionic permeability and stability. It also indicated Pu-EmimTFSI as the best system. Indeed, Pu-EmimTFSI was the combination capable to minimize the ESR and avoid performance degradation due to temperature changes.
On the basis of these results, Pu was selected as separator and binder for EmimTFSI-based EDLCs. The big challenge we faced in this study was to reach high electrode mass loading at low binder content.
Two EDLCs have been assembled featuring two different formulations, one with lower mass loading and high binder content (HBLME) and a second one with higher mass loading and lower binder content (LBHME). These have been characterized electrochemically to evaluate how binder decrease and mass loading increase affect performance. In particular, these devices have been characterized at first by EIS. Analysis of the Nyquist plots highlighted an increase of the ESR moving from the HBLME-EDLC to the LBHME-EDLC, (5.9 Ohm cm2 vs. 7.6 Ohm cm2). This trend was mainly related to the increase of the ionic and electronic contact resistances between carbon particles with the increase of electrode mass loading (1.5-fold from HBLME-EDLC to LBHME-EDLC).
For both devices’ CVs have shown the absence of faradaic parasitic reactions within the cell voltage range 0 to 3.2 V. This wide range is feasible thanks to the good electrochemical stability of Pu-EmimTFSI. Specific capacitances have been calculated for both EDLCs. The highest specific capacitance was featured at the lowest scan rate of 5 mV s−1 for both devices and was 18 F g−1 and 14 F g−1 for HBLME-EDLC and LBHME-EDLC, respectively. Both supercapacitors featured a good capacitance retention with the increase of the scan rate that however was higher for HBLME-EDLC (22%) than LBHME-EDLC (50%).
GLV cycling with high coulombic efficiency (higher than 98%) was demonstrated for both devices at the high cell voltage of 3.2 V. Noticeably, the EDLC featured a very good cycling behaviour demonstrated over more than 2000 cycles even at low binder content, confirming the stability of the Pu-polymer in EmimTFSI.
The high cell voltage and good specific capacitance provided specific energy of 19.6 Wh kg−1 and 7.2 Wh kg−1 at 0.5 A g−1 that well compare with those of EDLCs featuring the same electrolyte and active carbon but employing a fluorinated binder and fiber glass separators [16]. The highest specific power was 4.6 kW kg−1 and 3.7 kW kg−1 at 4–5 A g−1 respectively for HBLME-EDLC and for the LBHME-EDLC
The gravimetric performance of the HBLME-EDLC is superior respect to that of the LBHME-EDLC. This is due to the lower specific capacitance of the latter vs. the former. In turn, this is due to an inefficient ionic electronic contact between electrode carbon particles that leads to a partial exploitation of the electrodes surface.
5. Conclusions
This work demonstrates that aqueous processable biodegradable polymers such as pullulan can be effectively exploited for the development of the major components (separator and binder) of ionic-liquid-based green EDLCs. After studying different combinations of biopolymer and organic electrolyte, pullulan-EmimTFSI was found to be the best system in terms of resistivity and thermal behavior. Therefore, we assembled Pu-based EDLCs with EmimTFSI as electrolyte. Our study demonstrates for the first time the feasibility of the use of pullulan to produce high mass loading electrodes at low binder content for high voltage EDLCs. We prepared electrodes with mass loadings up to 13.84 mg cm−2 with 10% binder content. Pullulan-EmimTFSI EDLCs were charged up to 3.2 V with good cycling stability over 5000 cycles. Pullulan-EmimTFSI EDLCs featured specific energy and power comparable with those of supercapacitors based on the same activated carbon and ionic liquid, but with fluorinated binder and fiberglass separator.
Further work is in progress to improve the specific capacitance of these thick electrodes by using high surface area carbons with tailored porosity, different conductive carbon additives, and by exploring different electrolytes.
Supplementary Materials
The following are available online at https://www.mdpi.com/1996-1073/13/12/3115/s1, Figure S1. Schemes of the casting preparation of the pullulan-based electrodes and of the supercapacitor assembly, Figure S2. Nyquist plot of Pullulan electrospun membrane soaked with (a) PYR14TFSI, (c) EmimTFSI, (e) 0.5 m LiTFSI TEGDME and Cellulose triacetate electrospun membrane soaked with (b) PYR14TFSI, (d) EmimTFSI, (f) 0.5 m LiTFSI TEGDME, Figure S3. Trend of the capacitance percentage normalized by the value at first cycle the as function of the cycle number (at 1 A g−1, cell voltage cut-off: 0 V–3.2 V), Table S1. Resistance normalized by the plain area of Pullulan electrospun separator in different tested electrolytes, Table S2. Resistance normalized by the plain area of Cellulose triacetate electrospun separator in different tested electrolytes, Table S3. Resistivity of Pullulan electrospun separator in different tested electrolytes, Table S4. Resistivity of Cellulose triacetate electrospun separator in different tested electrolytes, Table S5. Mac Mullin number of Pullulan electrospun separator in different tested electrolytes, Table S6. Mac Mullin number of Cellulose triacetate electrospun separator in different tested electrolytes.
Author Contributions
Conceptualization: F.S. Data curation: G.E.S., F.P. Formal analysis: G.E.S., F.P., Funding acquisition: F.S. Investigation: G.E.S., F.P. Project administration: F.S. Supervision: F.S., Writing–original draft: G.E.S., F.P., A.B., D.M., F.S. Writing—review & editing: G.E.S., F.P., A.B., D.M, F.S. All authors have read and agreed to the published version of the manuscript.
Funding
This research was funded by the Italy-South Africa joint Research Programme 2018–2020 (Italian Ministers of Foreign Affairs and of the Environments) and “Piano Triennale di Realizzazione 2019–2021, Accordo di Programma Ministero dello Sviluppo Economico”—ENEA.
Acknowledgments
Maria Letizia Focarete (University of Bologna) and her research group are acknowledged for their precious contribution and support on electrospinning of natural polymers.
Conflicts of Interest
All The authors declare no conflict of interest for this manuscript.
References
- Dunn, B.; Kamath, H.; Tarascon, J.M. Electrical energy storage for the grid: A battery of choices. Science 2011, 334, 928–935. [Google Scholar] [CrossRef] [PubMed] [Green Version]
- Yang, Z.; Zhang, J.; Kintner-Meyer, M.C.W.; Lu, X.; Choi, D.; Lemmon, J.P.; Liu, J. Electrochemical energy storage for green grid. Chem. Rev. 2011, 111, 3577–3613. [Google Scholar] [CrossRef] [PubMed]
- Chen, G.Z. Supercapacitor and supercapattery as emerging electrochemical energy stores. Int. Mater. Rev. 2017, 62, 173–202. [Google Scholar] [CrossRef] [Green Version]
- Siwach, P.; Sharma, K.; Arora, A.; Tripathi, S.K. Review of supercapacitors: Materials and devices. J. Energy Storage 2019, 21, 801–825. [Google Scholar] [CrossRef]
- Schütter, C.; Pohlmann, S.; Balducci, A. Industrial Requirements of Materials for Electrical Double Layer Capacitors: Impact on Current and Future Applications. Adv. Energy Mater. 2019, 9, 1900334. [Google Scholar] [CrossRef]
- DeVos, N.; Maton, C.; Stevens, C.v. Electrochemical Stability of Ionic Liquids: General Influences and Degradation Mechanisms. ChemElectroChem 2014, 1, 1258–1270. [Google Scholar] [CrossRef]
- González, A.; Goikolea, E.; Barrena, J.A.; Mysyk, R. Review on supercapacitors: Technologies and materials. Renew. Sustain. Energy Rev. 2016, 58, 1189–1206. [Google Scholar] [CrossRef]
- Lazzari, M.; Mastragostino, M.; Soavi, F. Capacitance response of carbons in solvent-free ionic liquid electrolytes. Electrochem. Commun. 2007, 9, 1567–1572. [Google Scholar] [CrossRef]
- Mauger, A.; Julien, C.M.; Paolella, A.; Armand, M.; Zaghib, M. A comprehensive review of lithium salts and beyond for rechargeable batteries: Progress and perspectives. Mater. Sci. Eng. R Rep. 2018, 134, 1–2110. [Google Scholar] [CrossRef]
- Ruschhaupt, P.; Varzi, A.; Passerini, S. Natural Polymers as Green Binders for High-Loading Supercapacitor Electrodes. ChemSusChem 2020, 13, 763–770. [Google Scholar] [CrossRef]
- Arbizzani, C.; Yu, Y.; Li, J.; Xiao, J.; Xia, Y.; Yang, Y.; Santato, C.; Raccichini, R.; Passerini, S. Good practice guide for papers on supercapacitors and related hybrid capacitors for the Journal of Power Sources. J. Power Sources 2020, 450, 227636. [Google Scholar] [CrossRef]
- Stojanovska, E.; Kilic, A. Carbon nanofibers as thick electrodes for aqueous supercapacitors. J. Energy Storage 2019, 26, 100981. [Google Scholar] [CrossRef]
- Krause, A.; Balducci, A. High voltage electrochemical double layer capacitor containing mixtures of ionic liquids and organic carbonate as electrolytes. Electrochem. Commun. 2011, 13, 814–817. [Google Scholar] [CrossRef]
- Krummacher, J.; Balducci, A. Al(TFSI)3 as a Conducting Salt for High-Voltage Electrochemical Double-Layer Capacitors. Chem. Mater. 2018, 30, 4857–4863. [Google Scholar] [CrossRef]
- Krummacher, J.; Hess, L.H.; Balducci, A. Al(TFSI) 3 in Acetonitrile as Electrolytes for Electrochemical Double Layer Capacitors. J. Electrochem. Soc. 2019, 166, A1763–A1768. [Google Scholar] [CrossRef]
- Lazzari, M.; Soavi, F.; Mastragostino, M. Mesoporous carbon design for ionic liquid-based, double-layer supercapacitors. Fuel Cells 2010, 10, 840–847. [Google Scholar] [CrossRef] [Green Version]
- Chmiola, J.; Largeot, C.; Taberna, P.L.; Simon, P.; Gogotsi, Y. Desolvation of ions in subnanometer pores and its effect on capacitance and double-layer theory. Angew. Chem. Int. Ed. 2008, 47, 3392–3395. [Google Scholar] [CrossRef]
- Varzi, A.; Passerini, S. Enabling high areal capacitance in electrochemical double layer capacitors by means of the environmentally friendly starch binder. J. Power Sources 2015, 300, 216–222. [Google Scholar] [CrossRef]
- Ahmed, S.; Nelson, P.A.; Gallagher, K.G.; Dees, D.W. Energy impact of cathode drying and solvent recovery during lithium-ion battery manufacturing. J. Power Sources 2016, 322, 169–178. [Google Scholar] [CrossRef] [Green Version]
- Mauger, A.; Julien, C.; Paolella, A.; Armand, M.; Zaghib, K. Recent Progress on Organic Electrodes Materials for Rechargeable Batteries and Supercapacitors. Materials 2019, 12, 1770. [Google Scholar] [CrossRef] [PubMed] [Green Version]
- Bresser, D.; Buchholz, D.; Moretti, A.; Varzi, A.; Passerini, S. Alternative binders for sustainable electrochemical energy storage-the transition to aqueous electrode processing and bio-derived polymers. Energy Environ. Sci. 2018, 11, 3096–3127. [Google Scholar] [CrossRef] [Green Version]
- Yamagata, M.; Ikebe, S.; Soeda, K.; Ishikawa, M. Ultrahigh-performance nonaqueous electric double-layer capacitors using an activated carbon composite electrode with alginate. RSC Adv. 2013, 3, 1037–1040. [Google Scholar] [CrossRef]
- Böckenfeld, N.; Jeong, S.S.; Winter, M.; Passerini, S.; Balducci, A. Natural, cheap and environmentally friendly binder for supercapacitors. J. Power Sources 2013, 221, 14–20. [Google Scholar] [CrossRef]
- Dühnen, S.; Betz, J.; Kolek, M.; Schmuch, R.; Winter, M.; Placket, T. Toward Green Battery Cells: Perspective on Materials and Technologies. Small Methods 2020, 2000039. [Google Scholar] [CrossRef]
- Bonnefoi, L.; Simon, P.; Fauvarque, J.F.; Sarrazin, C.; Sarrau, J.F.; Dugast, A. Electrode compositions for carbon power supercapacitors. J. Power Sources 1999, 80, 149–155. [Google Scholar] [CrossRef]
- Phillips, D.M.; Drummy, L.F.; Conrady, D.G.; Fox, D.M.; Naik, R.R.; Stone, M.O.; Trulove, P.C.; de Long, H.C.; Mantz, R.A. Dissolution and regeneration of Bombyx mori silk fibroin using ionic liquids. J. Am. Chem. Soc. 2004, 126, 14350–14351. [Google Scholar] [CrossRef]
- Swatloski, R.P.; Spear, S.K.; Holbrey, J.D.; Rogers, R.D. Dissolution of Cellose with Ionic Liquids. J. Am. Chem. Soc 2002, 124, 4974–4975. [Google Scholar] [CrossRef]
- Recham, N.; Armand, M.; Tarascon, J.M. Novel low temperature approaches for the eco-efficient synthesis of electrode materials for secondary Li-ion batteries. Comptes Rendus Chim. 2010, 13, 106–116. [Google Scholar] [CrossRef]
- Heinze, T.; Dorn, S.; Schöbitz, M.; Liebert, T.; Köhler, S.; Meister, F. Interactions of Ionic Liquids with Polysaccharides—2: Cellulose. Macromol. Symp. 2008, 262, 8–22. [Google Scholar] [CrossRef]
- Varzi, A.; Balducci, A.; Passerini, S. Natural Cellulose: A Green Alternative Binder for High Voltage Electrochemical Double Layer Capacitors Containing Ionic Liquid-Based Electrolytes. J. Electrochem. Soc. 2014, 161, A368–A375. [Google Scholar] [CrossRef]
- Poli, F.; Momodu, D.; Spina, G.E.; Terella, A.; Mutuma, B.K.; Focarete, M.L.; Manyala, N.; Soavi, F. Pullulan-ionic liquid-based supercapacitor: A novel, smart combination of components for an easy-to-dispose device. Electrochim. Acta 2020, 338, 135872. [Google Scholar] [CrossRef]
- Arbizzani, C.; Lazzari, M.; Soavi, F.; Mastragostino, M.; Conte, M. ILHYPOS Ionic Liquid-Based Supercapacitors. ECS Trans. 2010, 25, 25–30. [Google Scholar]
- Li, Y.; Li, Q.; Tan, Z. A review of electrospun nanofiber-based separators for rechargeable lithium-ion batteries. J. Power Sources 2019, 443, 227262. [Google Scholar] [CrossRef]
- Yoo, H.D.; Jang, J.H.; Ryu, J.H.; Park, Y.; Oh, S.M. Impedance analysis of porous carbon electrodes to predict rate capability of electric double-layer capacitors. J. Power Sources 2014, 267, 411–420. [Google Scholar] [CrossRef]
- Conway, B.E. Electrochemical Supercapacitors: Scientific Fundamentals and Technological; Springer Science & Business Media: Berlin, Germany, 2013. [Google Scholar]
- Kötz, R.; Carlen, M. Principles and applications of electrochemical capacitors. Electrochim. Acta 2000, 45, 2483–2498. [Google Scholar] [CrossRef]
Figure 1.
SEM images of electrospun membrane of (a) pullulan and (b) cellulose triacetate with their molecular structures.
Figure 1.
SEM images of electrospun membrane of (a) pullulan and (b) cellulose triacetate with their molecular structures.

Figure 2.
Nyquist plot of Pullulan electrospun membrane in EmimTFSI electrolyte.
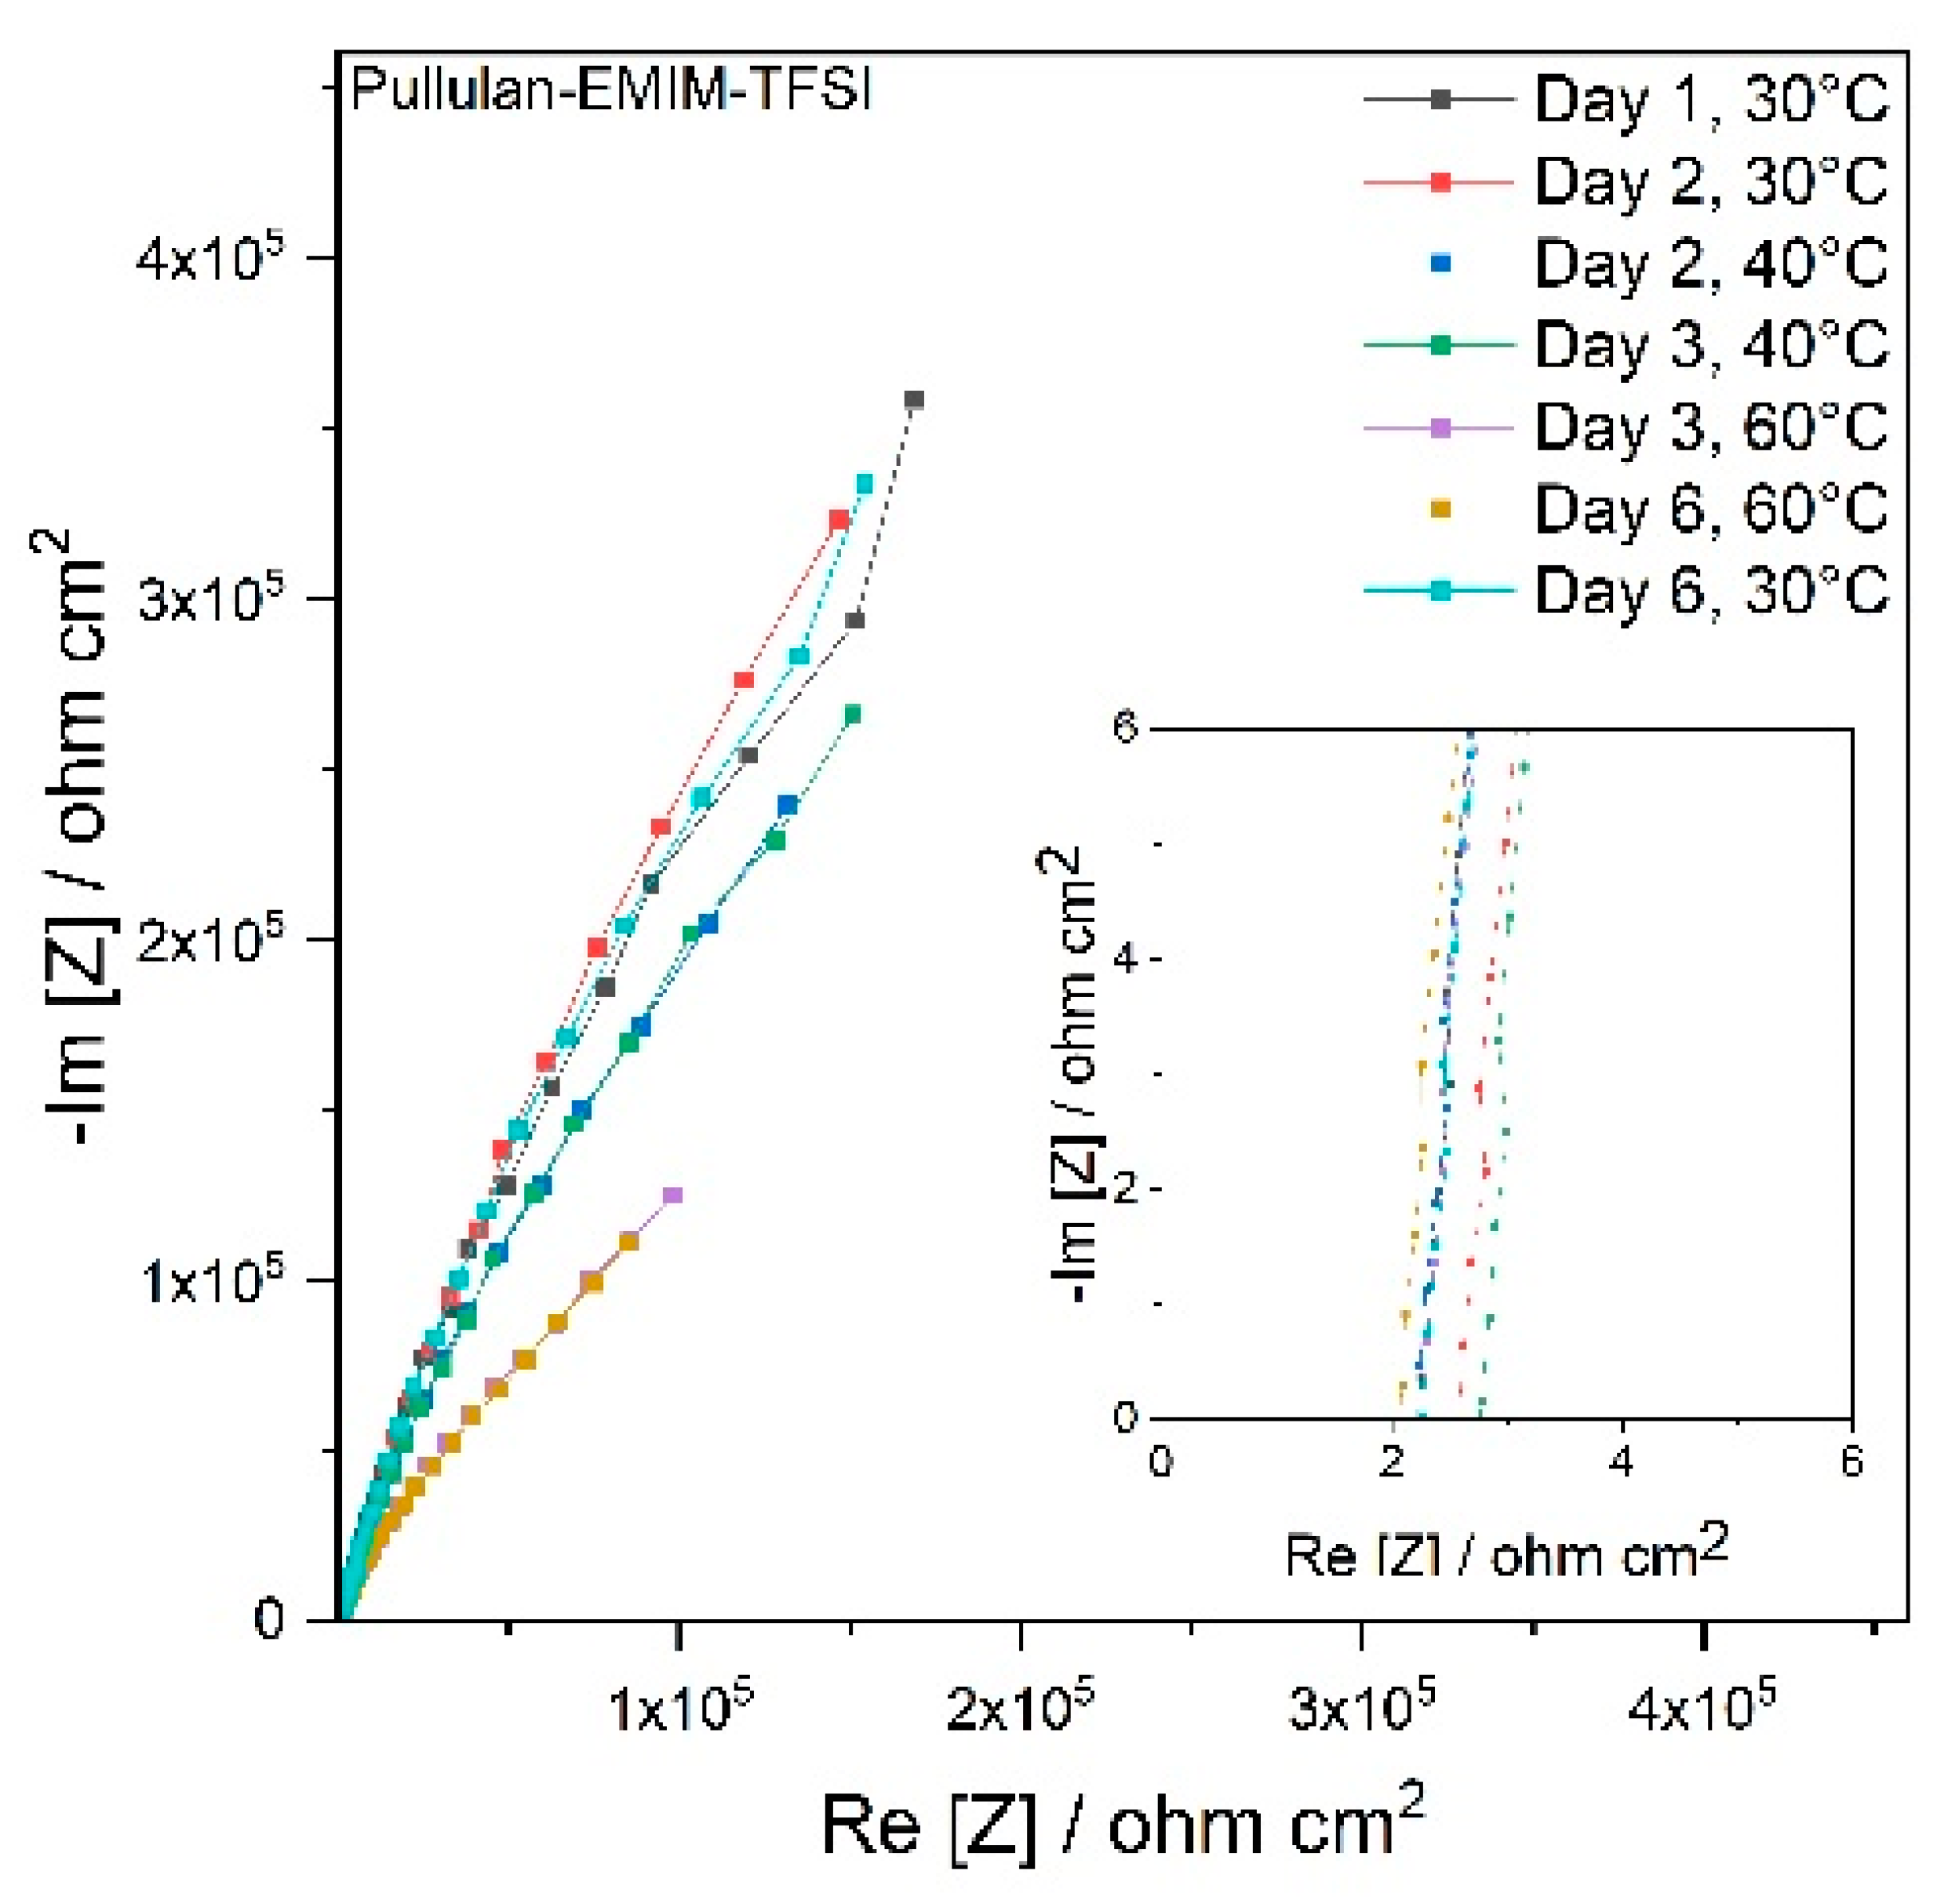
Figure 3.
Resistance normalized by the plain area and MacMullin number of (a,c) Pullulan and (b,d) Cellulose triacetate electrospun separators in different tested electrolytes.
Figure 3.
Resistance normalized by the plain area and MacMullin number of (a,c) Pullulan and (b,d) Cellulose triacetate electrospun separators in different tested electrolytes.

Figure 4.
Electrochemical characterization of HBLME-EDLC (a) Nyquist plots of the (black) full cell, (red) positive and (blue) negative electrodes (500 kHz and 100 mHz), (b) 2-electrode CVs at different scan rate from 5 mV s-1 to 200 mV s-1, between 0 V and 3.2 V, (c) Capacitance of the EDLC evaluated by CV reported as function of the scan rate; and (d) selected galvanostatic charge/discharge cycles between 0 V and 3.2 V at different current densities from 0.5 A g-1 to 4 A g-1.
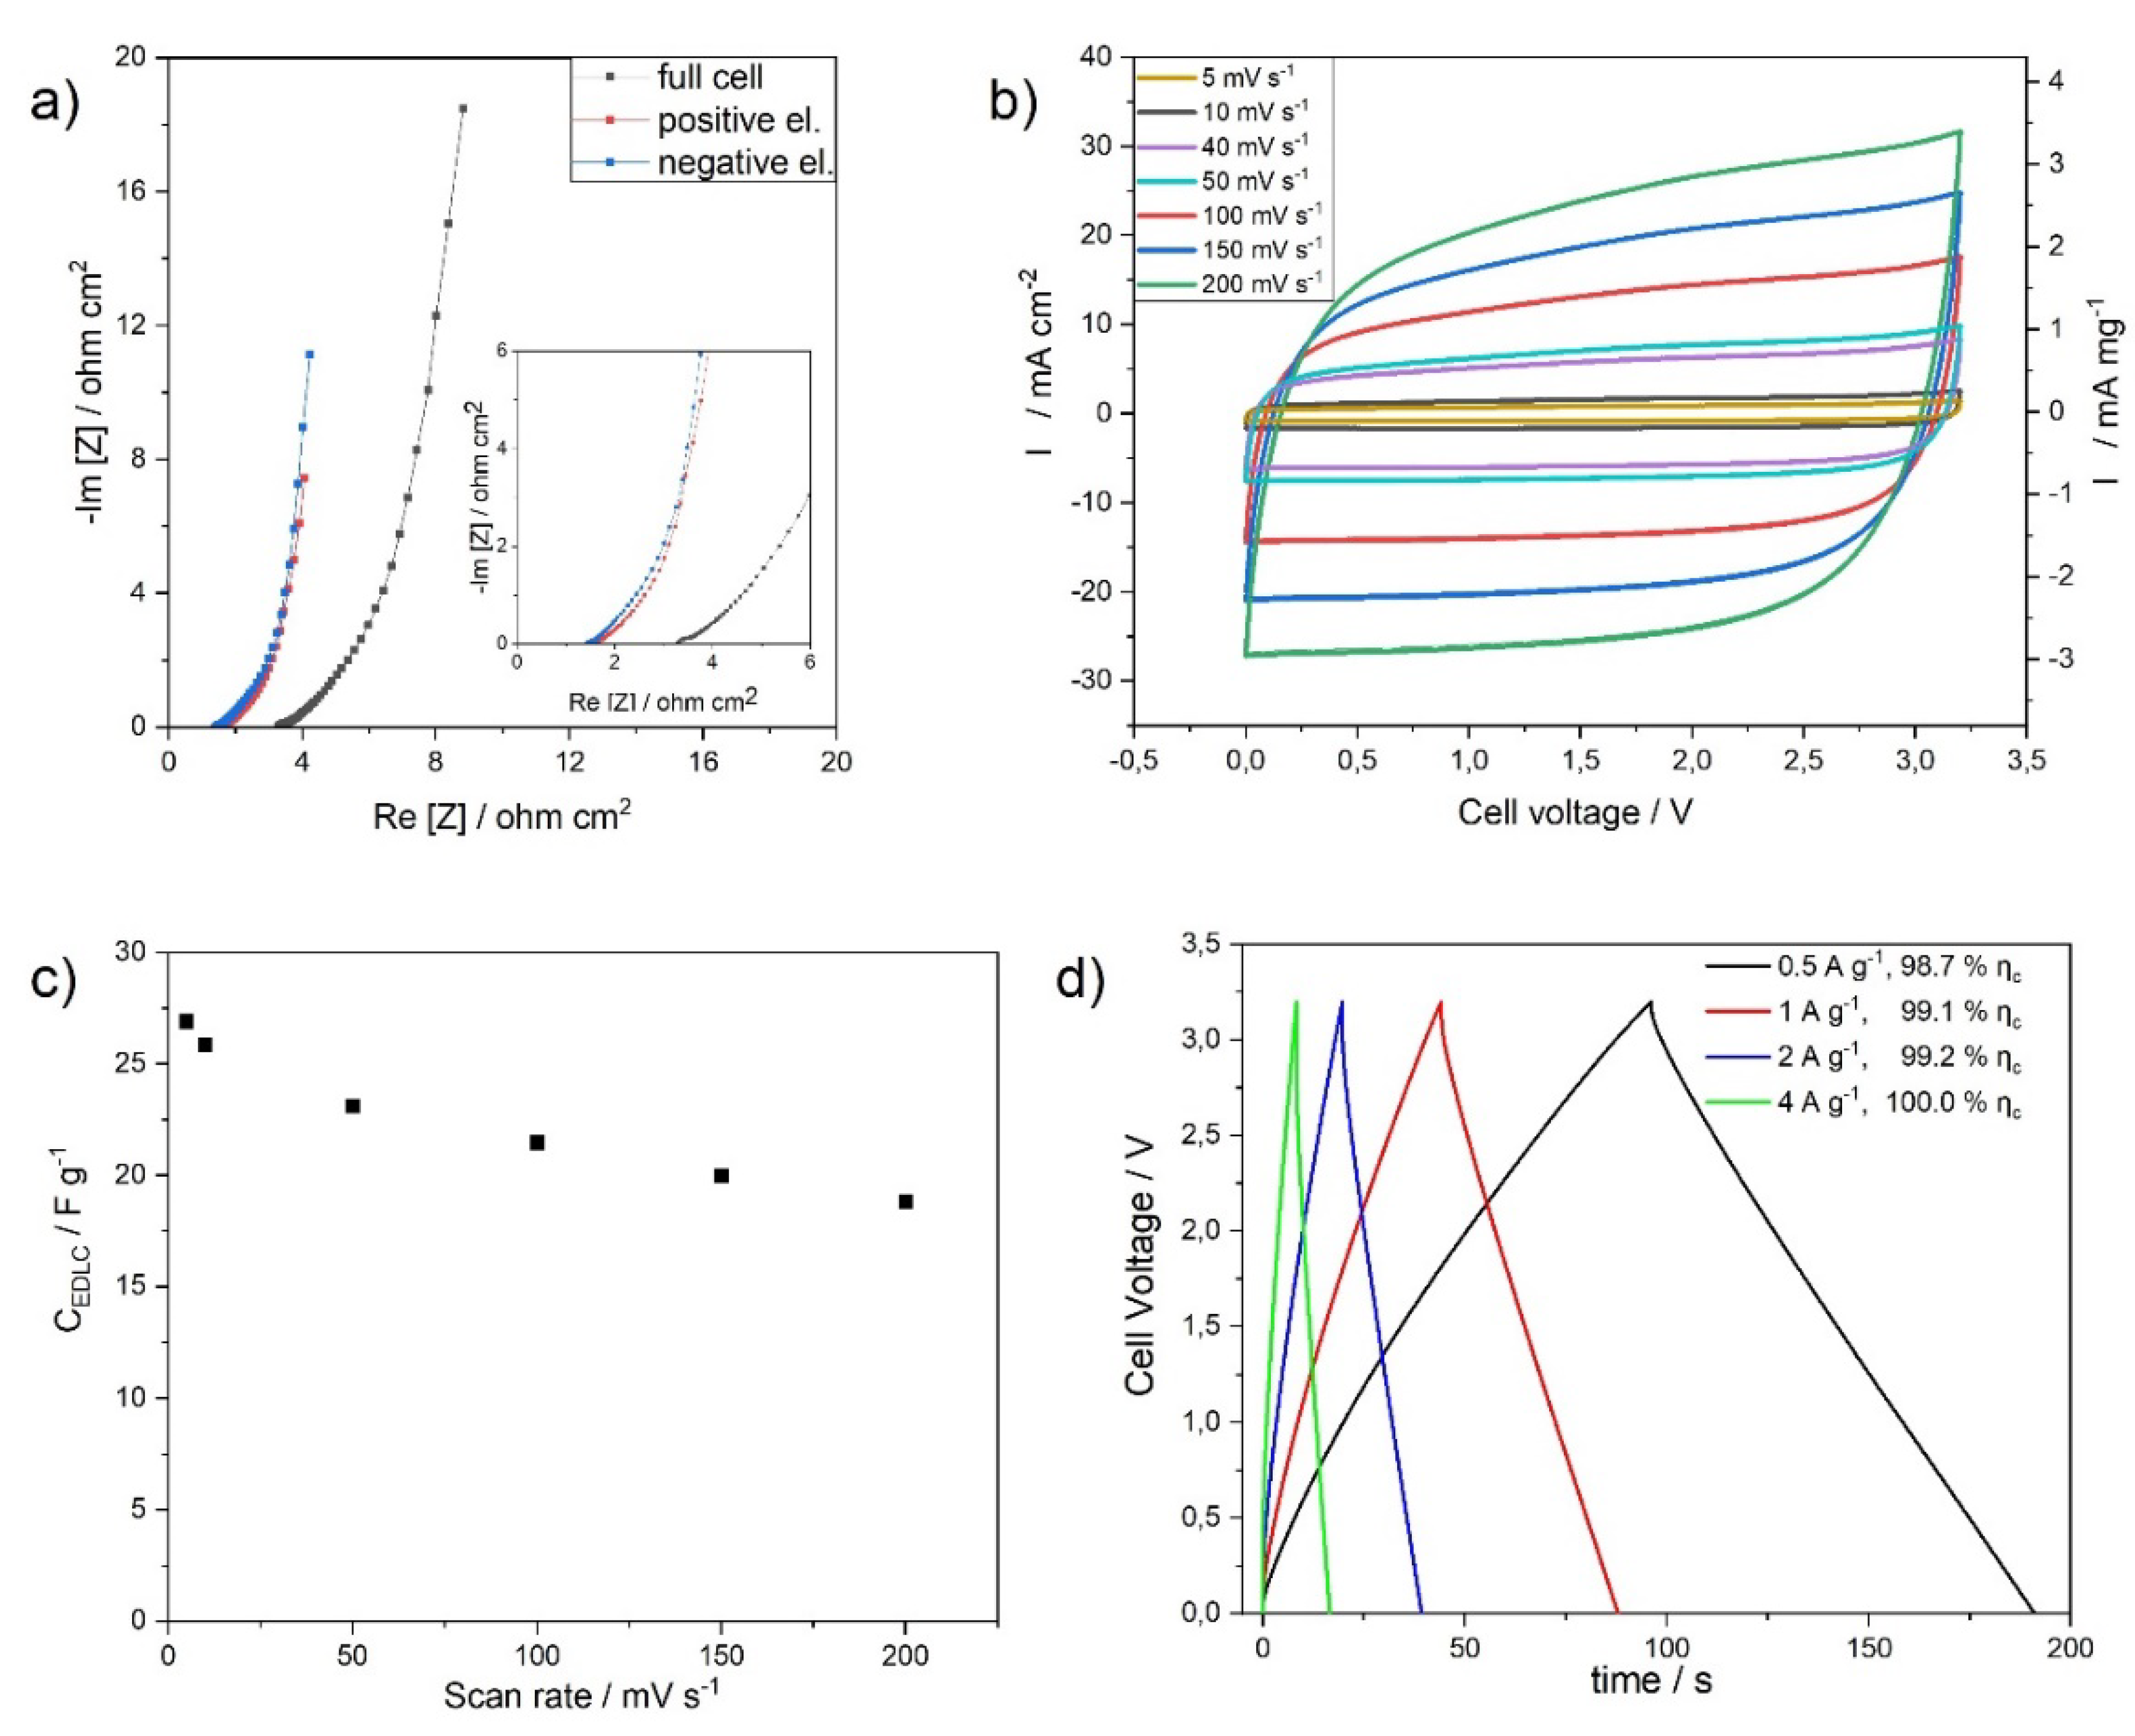
Figure 5.
Electrochemical characterization of LBHME-EDLC (a) Nyquist plots of the (black) full cell, (red) positive and (blue) negative electrodes (500 kHz and 100 mHz), (b) 2-electrode CVs at different scan rate from 5 mV s-1 to 200 mV s-1, between 0 V and 3.2 V, (c) Capacitance of the EDLC evaluated by CV reported as function of the scan rate; and (d) selected galvanostatic charge/discharge cycles between 0 V and 3.2 V at different current densities from 0.5 A g-1 to 5 A g-1.
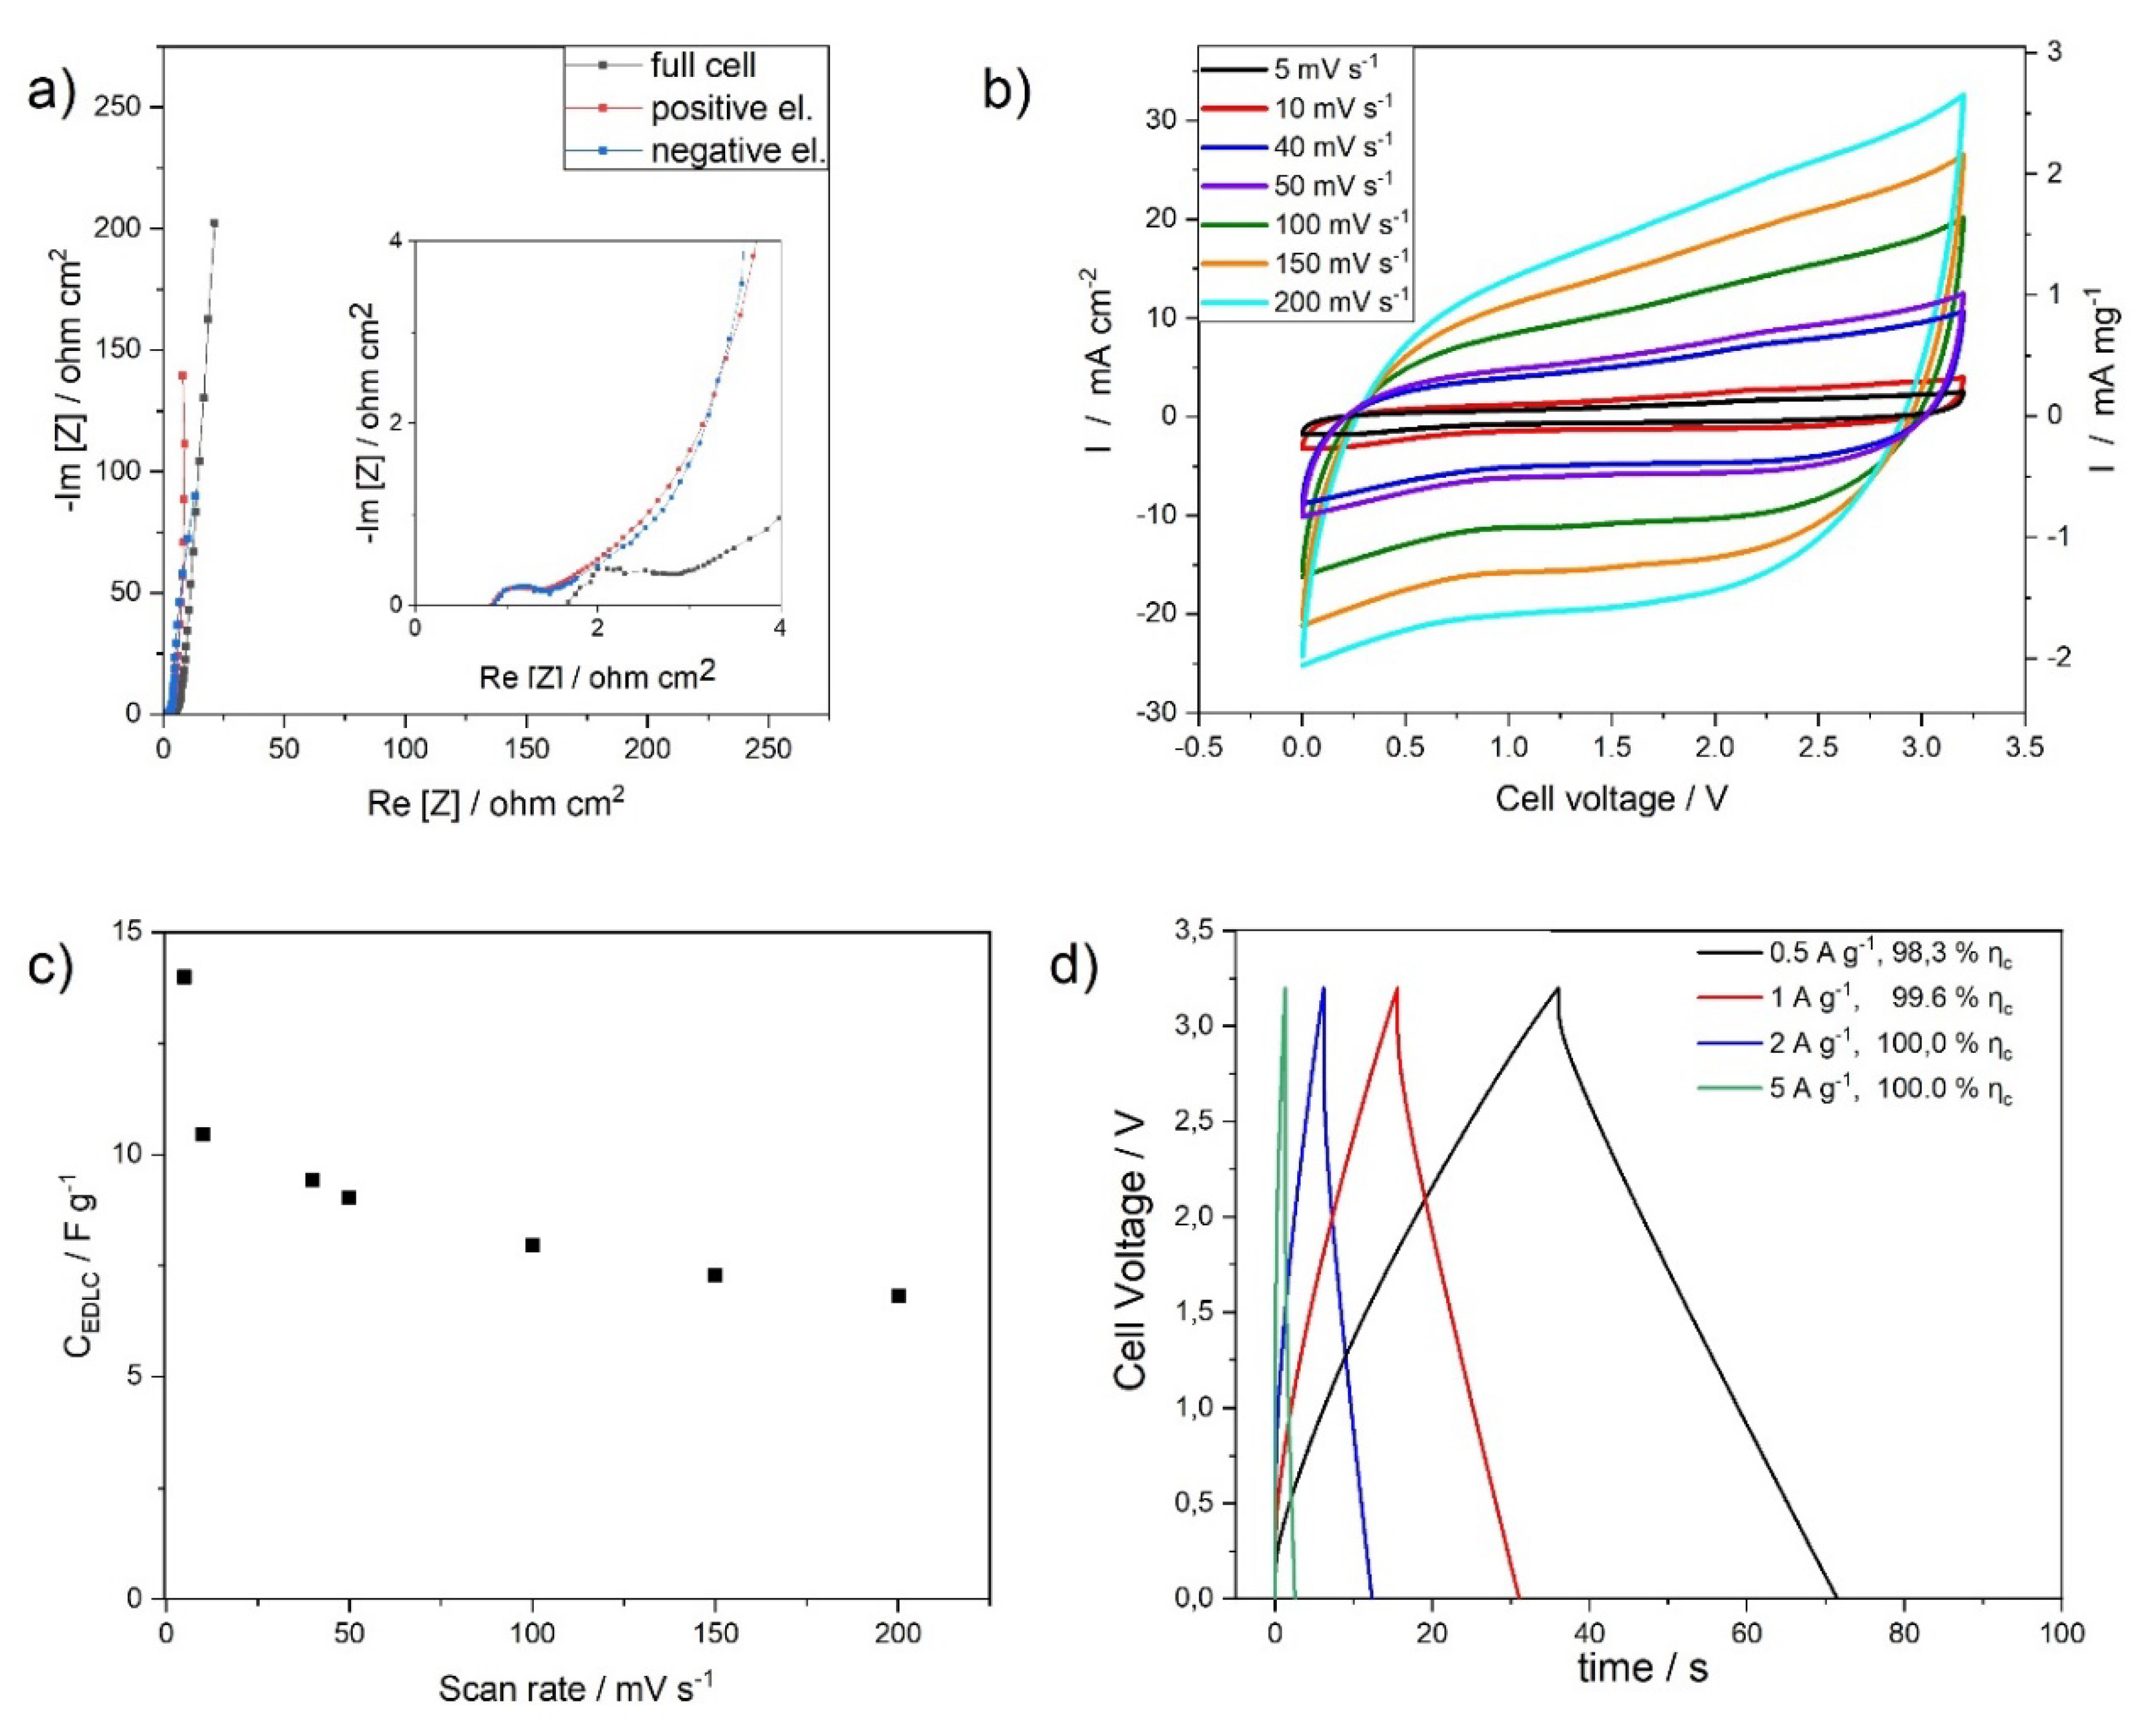
Figure 6.
EDLC comparison by galvanostatic tests. (a) Trend of the capacitance percentage normalized by the value at first cycle the as function of the cycle number (at 1 A g−1, cell voltage cut-off: 0 V–3.2 V) and (b) Ragone plots of HBLME-EDLC and LBHME-EDLC.
Figure 6.
EDLC comparison by galvanostatic tests. (a) Trend of the capacitance percentage normalized by the value at first cycle the as function of the cycle number (at 1 A g−1, cell voltage cut-off: 0 V–3.2 V) and (b) Ragone plots of HBLME-EDLC and LBHME-EDLC.


Table 1.
Composition and mass loading of High Binder Low Mass Electrode (HBLME) and Low Binder High Mass Electrode (LBHME).
Table 1.
Composition and mass loading of High Binder Low Mass Electrode (HBLME) and Low Binder High Mass Electrode (LBHME).
| Name | Composition | Mass Loading Range * |
|---|---|---|
| HBLME | 70% BP10/10% CB/20% binder | 3.6–4.6 mg cm−2 |
| LBHME | 85% BP10/5% CB/10% binder | 6.3–7.5 mg cm−2 |
* single electrodes mass loading.
Table 2.
Ionic conductivity of the tested electrolytes at different temperatures.
| Conductivity (mS cm−1) | σ (30°) | σ (40°) | σ (60°) |
|---|---|---|---|
| EmimTFSI | 12.60 | 15.10 | 25.70 |
| 0.5 m LiTFSI in TEGDME | 2.05 | 2.63 | 4.82 |
| PYR14 TFSI | 3.01 | 3.90 | 6.30 |
Table 3.
Gravimetric and surface quantities of HBLME-EDLC and LBHME-EDLC.
| Electrode Label | HBLME-EDLC | LBHME-EDLC |
|---|---|---|
| Mass loading (mg cm−2) | 9.3 | 13.8 |
| ESR (ohm) | 5.9 | 7.9 |
| Capacitance * (F g−1) | 15.9 | 6.2 |
| Areal capacitance (mF cm−2) | 148.0 | 85.5 |
| Specific energy ** (Wh kg−1) | 19.6 | 7.2 |
| Specific power *** (kW kg−1) | 4.6 | 3.7 |
| Areal energy density (µWh cm−2) | 182.3 | 99.4 |
| Areal power density (mW cm−2) | 42.8 | 51.1 |
* Capacitance has been calculated from the CV at 50 mV s−1, ** Specific energy has been calculated from GCPL at minimum current (0.5 A g−1), *** Specific power has been calculated at maximum current (4 and 5 A g−1).
© 2020 by the authors. Licensee MDPI, Basel, Switzerland. This article is an open access article distributed under the terms and conditions of the Creative Commons Attribution (CC BY) license (http://creativecommons.org/licenses/by/4.0/).
Share and Cite
MDPI and ACS Style
Spina, G.E.; Poli, F.; Brilloni, A.; Marchese, D.; Soavi, F. Natural Polymers for Green Supercapacitors. Energies 2020, 13, 3115. https://doi.org/10.3390/en13123115
AMA Style
Spina GE, Poli F, Brilloni A, Marchese D, Soavi F. Natural Polymers for Green Supercapacitors. Energies. 2020; 13(12):3115. https://doi.org/10.3390/en13123115
Chicago/Turabian StyleSpina, Giovanni Emanuele, Federico Poli, Alessandro Brilloni, Daniele Marchese, and Francesca Soavi. 2020. "Natural Polymers for Green Supercapacitors" Energies 13, no. 12: 3115. https://doi.org/10.3390/en13123115
Note that from the first issue of 2016, this journal uses article numbers instead of page numbers. See further details here.