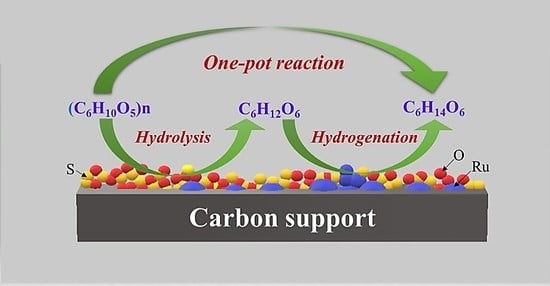
Mesoporous Activated Carbon Supported Ru Catalysts to Efficiently Convert Cellulose into Sorbitol by Hydrolytic Hydrogenation


Abstract
:
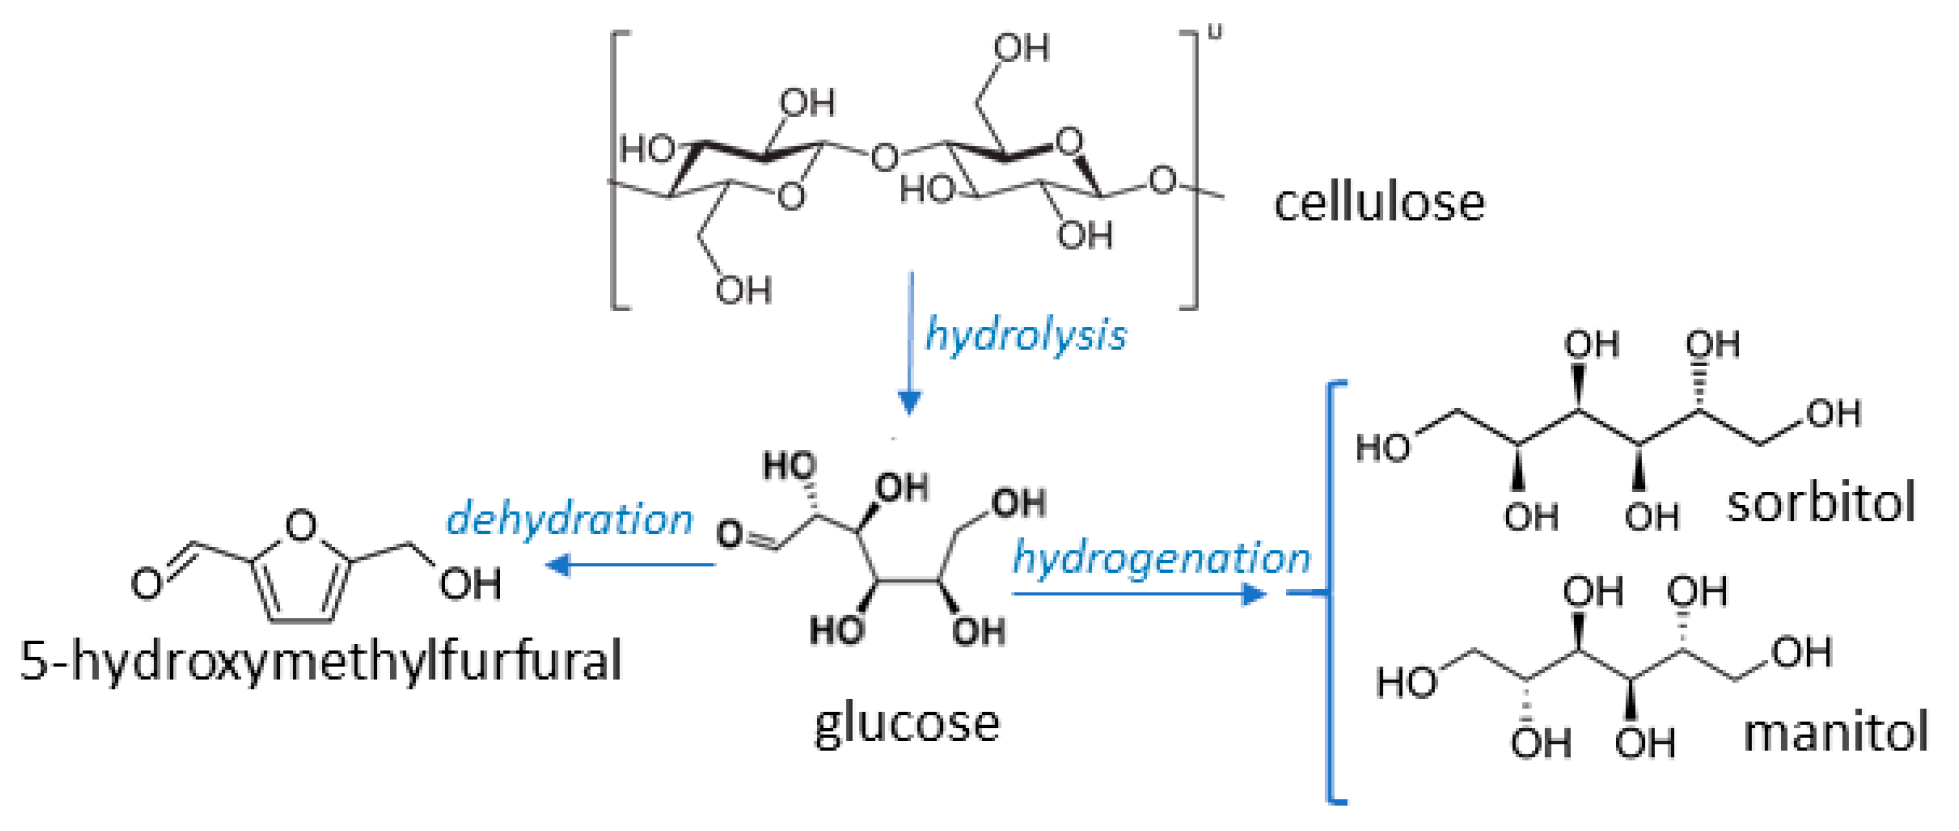
1. Introduction
2. Materials and Methods
2.1. Catalysts Preparation and Characterization
2.2. Cellulose Hydrolytic Hydrogenation
3. Results
3.1. Textural Properties
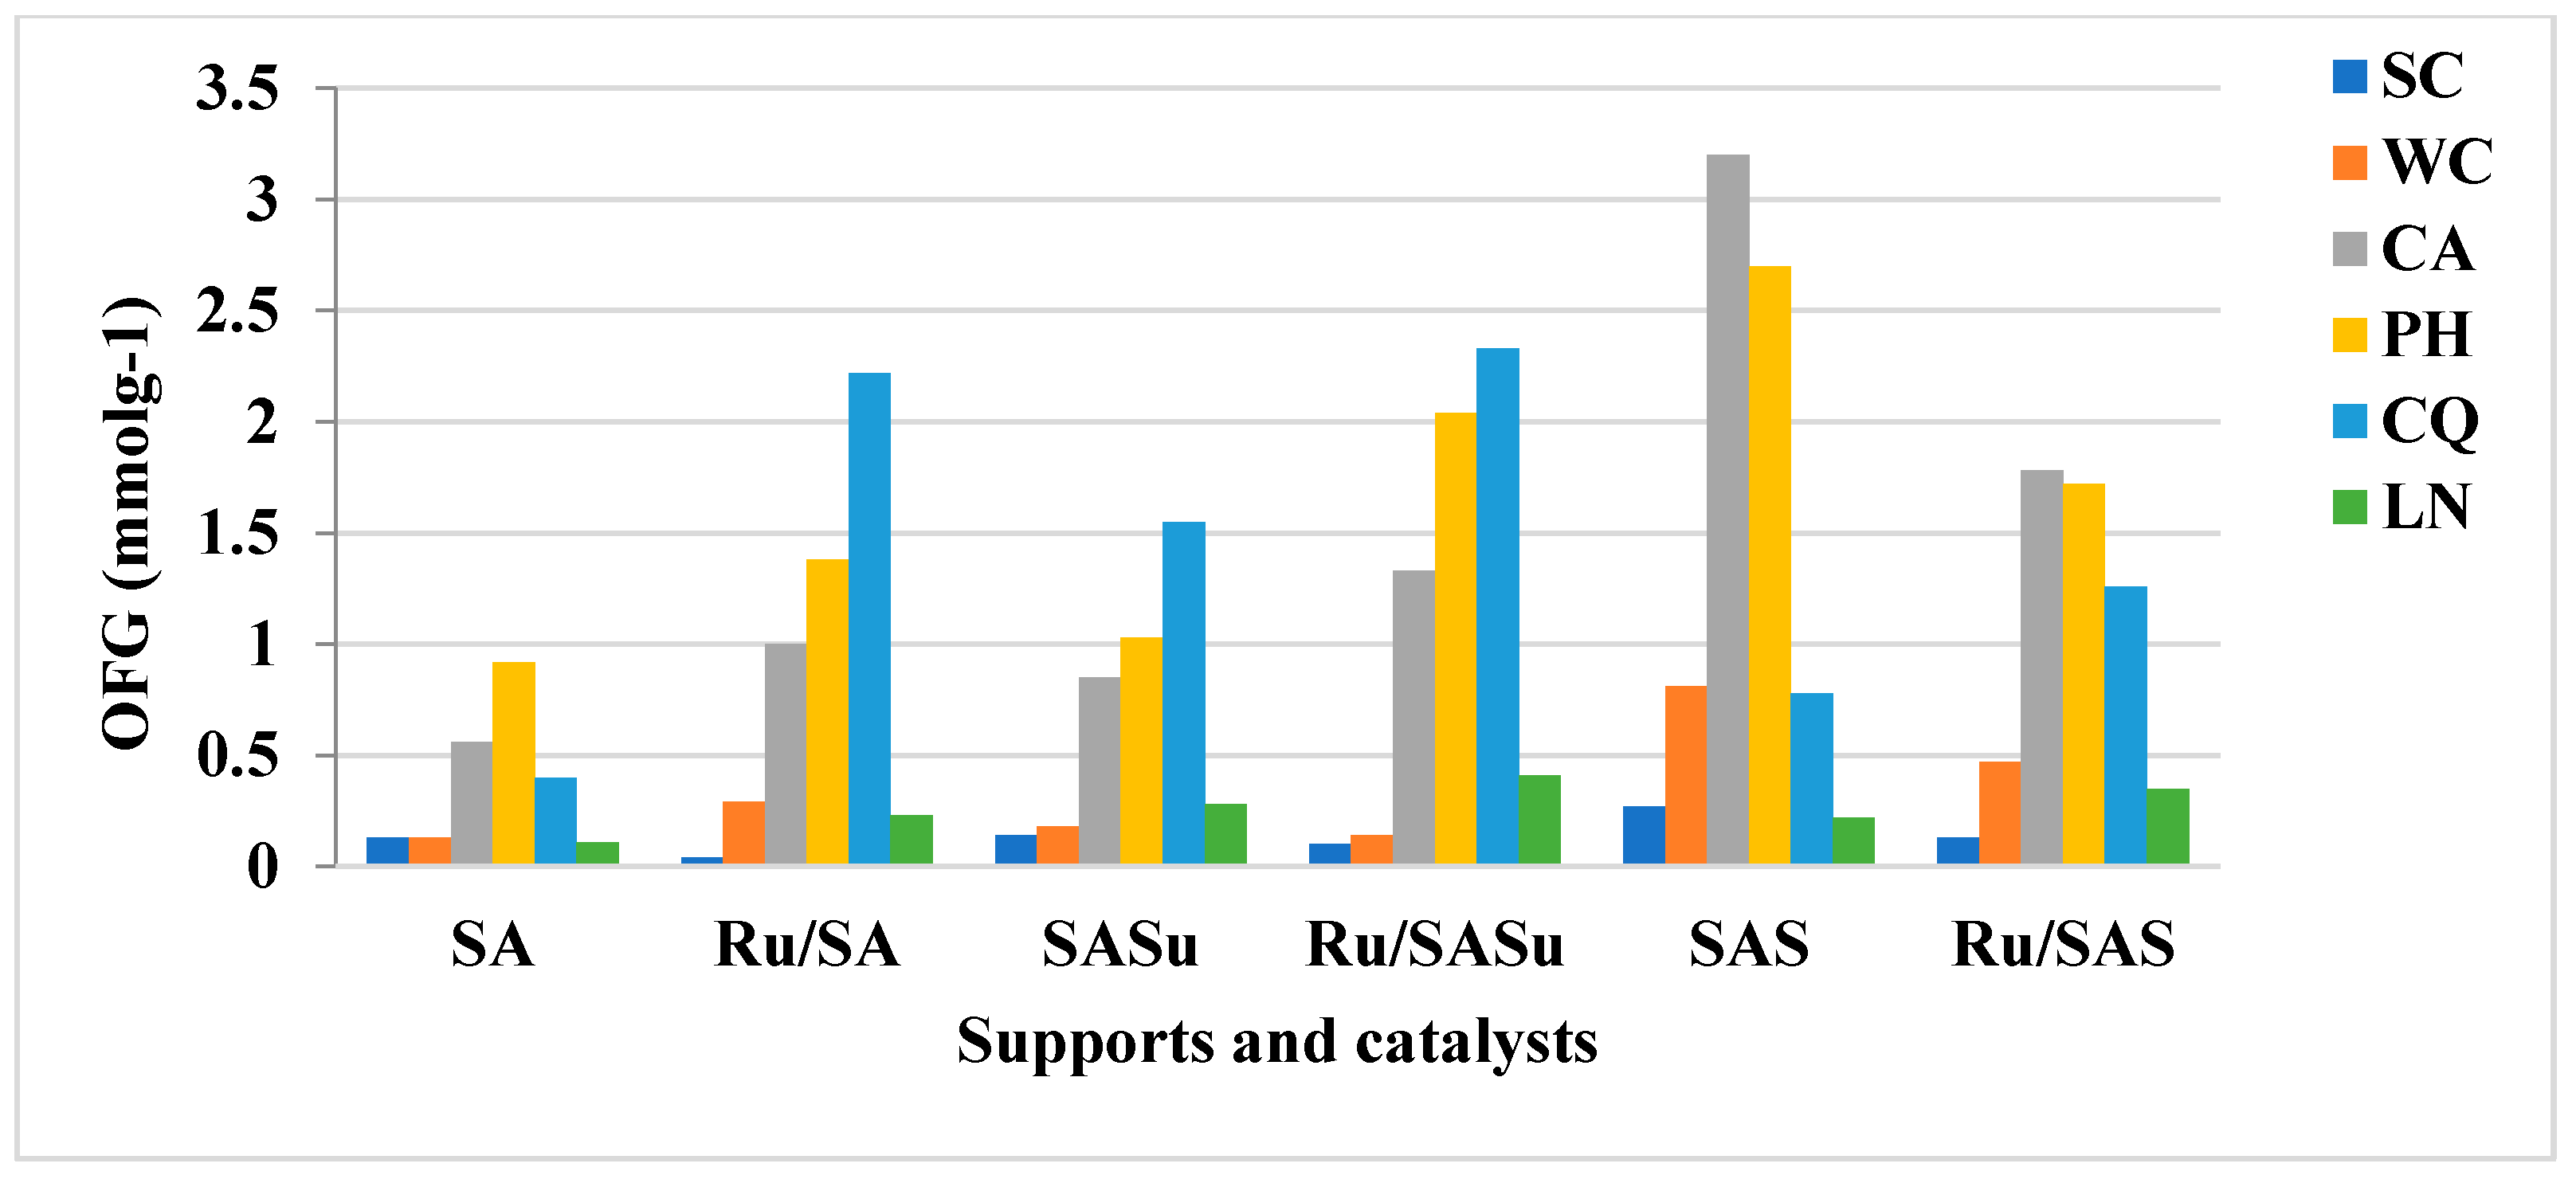
3.2. Surface Chemistry
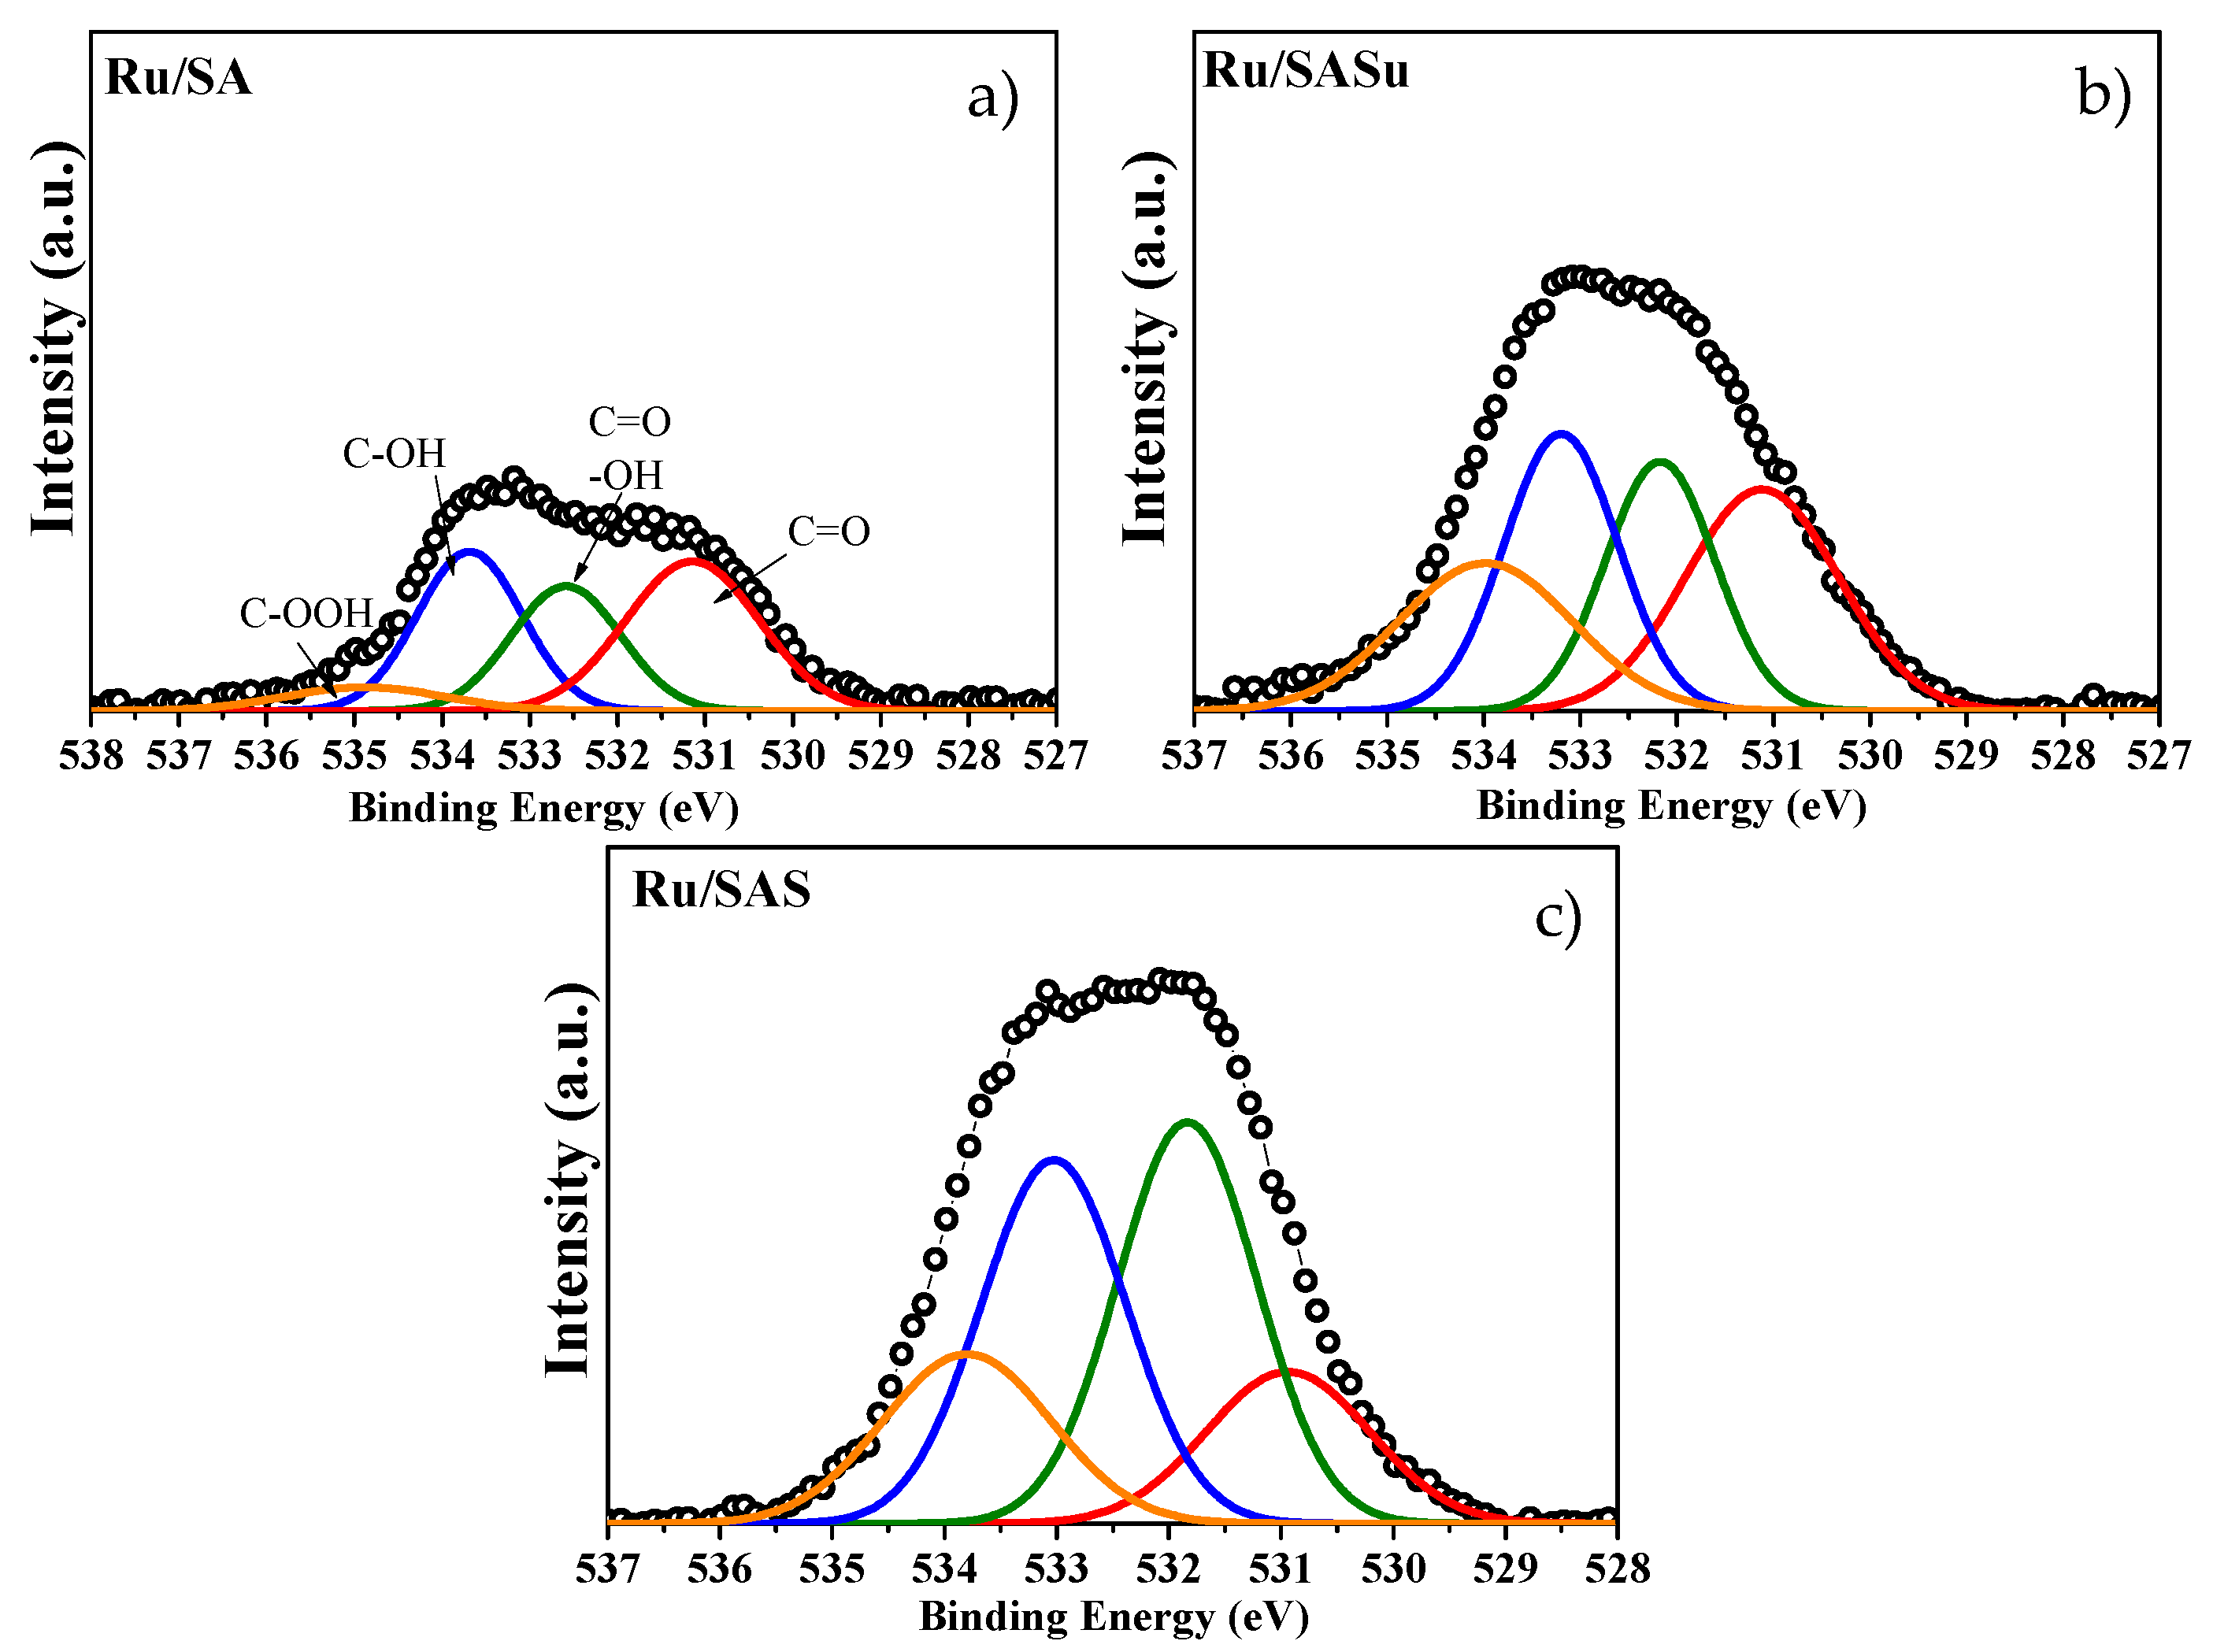
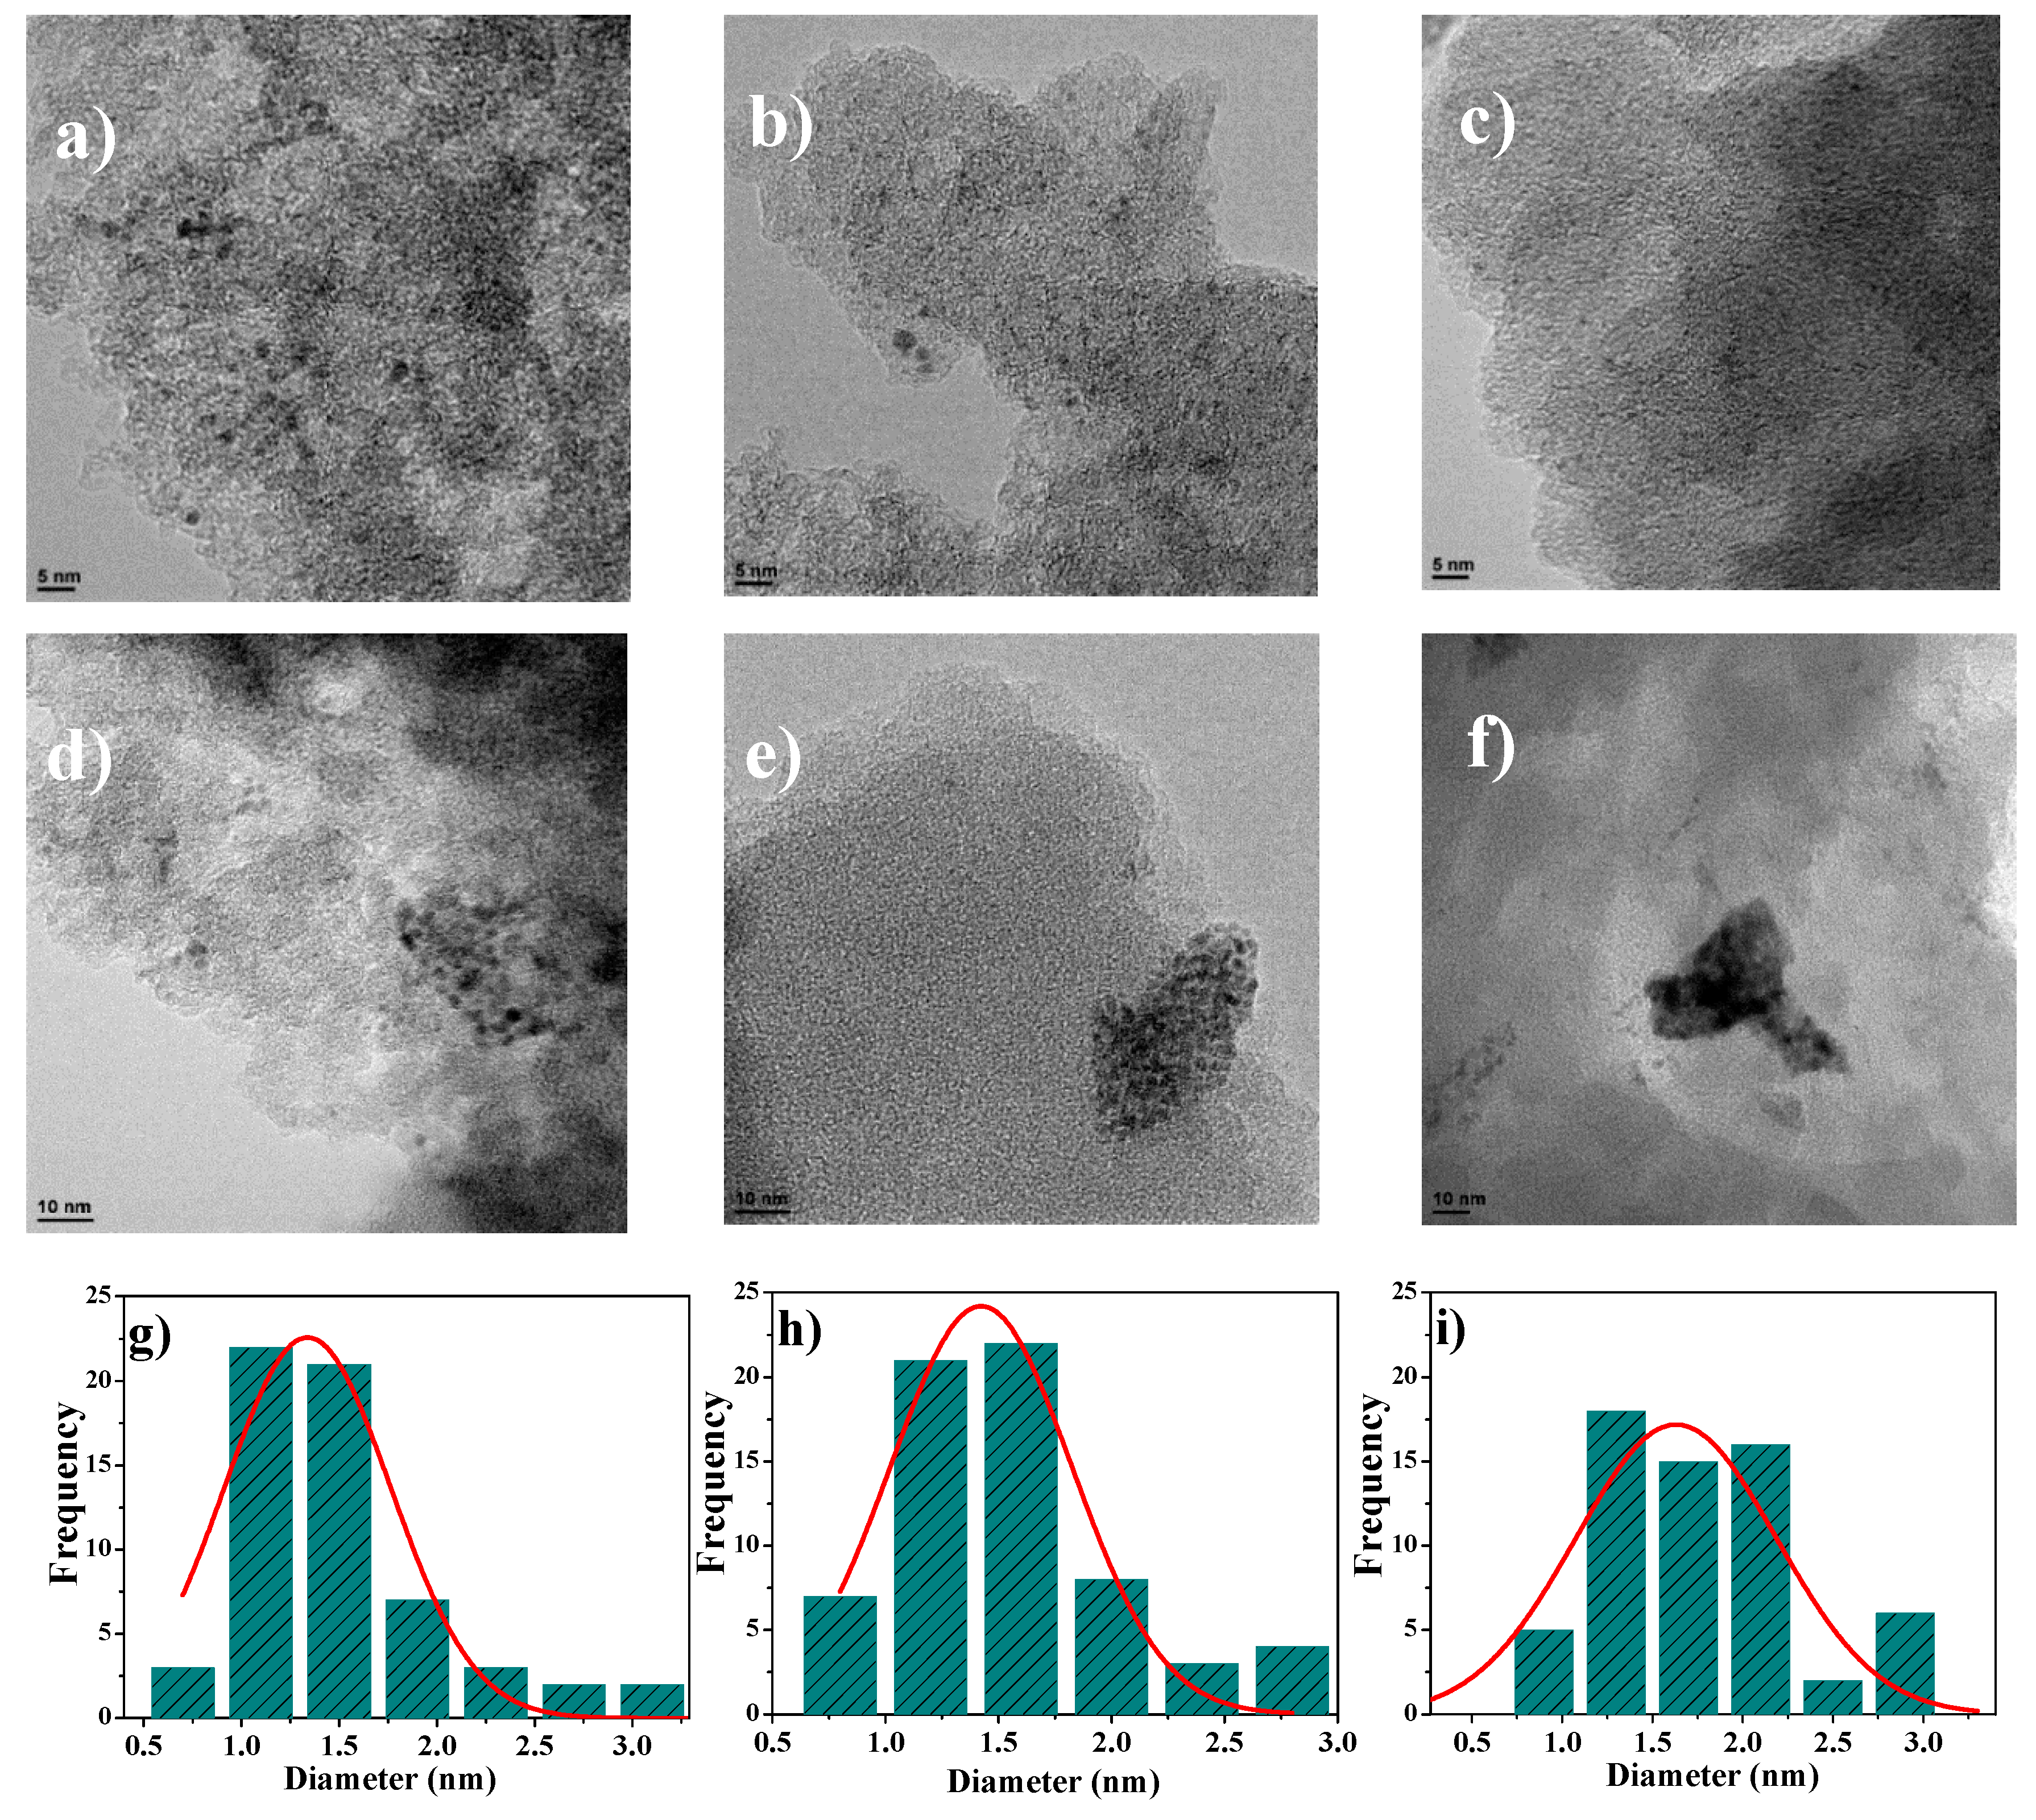
3.3. XPS and TEM Analysis
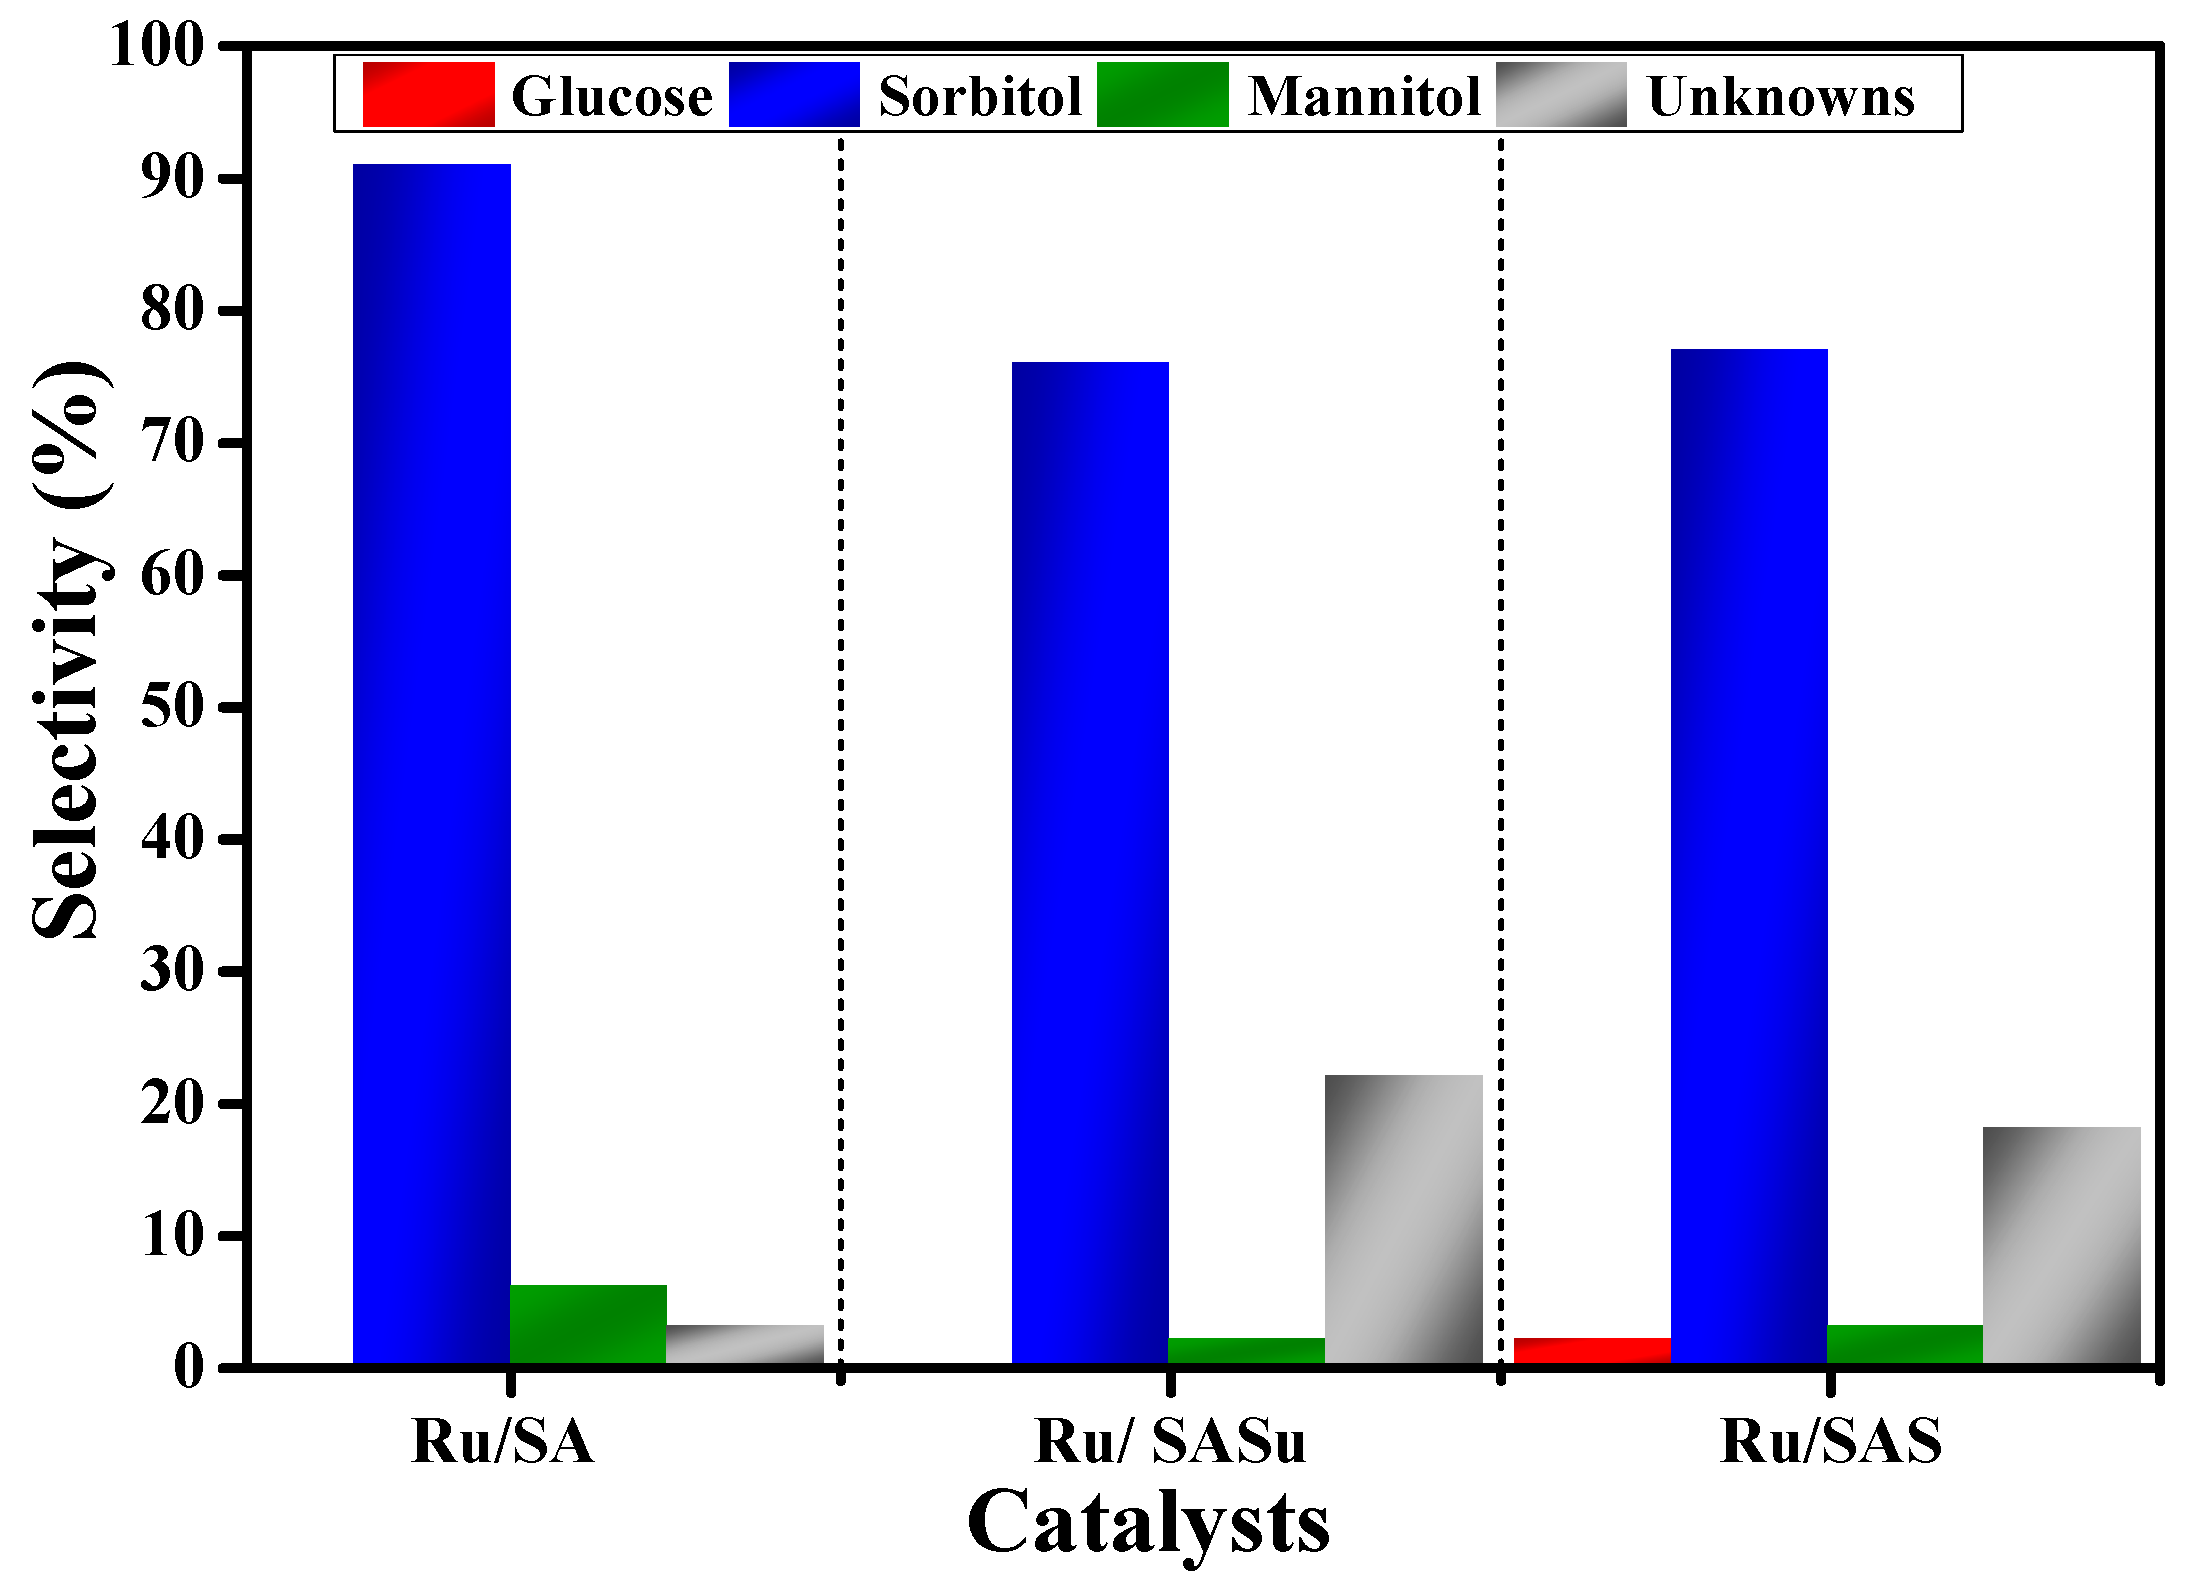
3.4. Catalytic Conversion of Cellulose
4. Conclusions
Supplementary Materials
Author Contributions
Funding
Acknowledgments
Conflicts of Interest
References
- Satinder, K.B.; Saurabh, J.S.; Kannan, P. Platform Chemical Biorefinery. Future Green Industry; Brar, S.K., Sarma, S.J., Pakshirajan, K., Eds.; Elsevier: Amsterdam, The Netherlands, 2017; ISBN 9780128029800. [Google Scholar]
- Fang, Z.; Smith, R.L., Jr.; Li, H. (Eds.) Production of Biofuels and Chemicals with Bifunctional Catalysts; Springer: Berlin/Heidelberg, Germany, 2017. [Google Scholar]
- De Wild, P.; Reith, H.; Heeres, E. Biomass pyrolysis for chemicals. Biofuels 2011, 2, 185–208. [Google Scholar] [CrossRef]
- Sheldon, R.A. Green and sustainable manufacture of chemicals from biomass: State of the art. Green Chem. 2014, 16, 950–963. [Google Scholar] [CrossRef]
- Paone, E.; Tabanelli, T.; Mauriello, F. The rise of lignin biorefinery. Curr. Opin. Green Sustain. Chem. 2020, 24, 1–6. [Google Scholar] [CrossRef]
- Vilcocq, L.; Cabiac, A.; Especel, C.; Guillon, E.; Duprez, D. Transformation of sorbitol to biofuels by heterogeneous catalysis: Chemical and industrial considerations. Oil Gas Sci. Technol.–Rev. d’IFP Energies Nouv. 2013, 68, 841–860. [Google Scholar] [CrossRef]
- Awuchi, C.G. Sugar alcohols: Chemistry, production, health concerns and nutritional importance of mannitol, sorbitol, xylitol, and erythritol. Int. J. Adv. Acad. Res. Sci. Technol. Eng. 2017, 3, 31–66. [Google Scholar]
- Brar, S.K.; Sarma, S.J.; Pakshijaran, K. Sorbitol production from biomass and its global market. In Platform Chemical Biorefinery; Elsevier: Amsterdam, The Netherlands, 2016; pp. 217–227. [Google Scholar]
- Van de Vyver, S.; Geboers, J.; Jacobs, P.A.; Sels, B.F. Recent advances in the catalytic conversion of cellulose. ChemCatChem 2011, 3, 82–94. [Google Scholar] [CrossRef]
- Besson, M.; Gallezot, P.; Pinel, C. Conversion of biomass into chemicals over metal catalysts. Chem. Rev. 2014, 114, 1827–1870. [Google Scholar] [CrossRef]
- Rinaldi, R.; Schüth, F. Design of solid catalysts for the conversion of biomass. Energy Environ. Sci. 2009, 2, 610–626. [Google Scholar] [CrossRef]
- Huang, Y.-B.; Fu, Y. Hydrolysis of cellulose to glucose by solid acid catalysts. Green Chem. 2013, 15, 1095–1111. [Google Scholar] [CrossRef]
- Li, Z.; Liu, Y.; Liu, C.; Wu, S.; Wei, W. Direct conversion of cellulose into sorbitol catalyzed by a bifunctional catalyst. Bioresour. Technol. 2019, 274, 190–197. [Google Scholar] [CrossRef]
- Gromov, N.V.; Medvedeva, T.B.; Taran, O.P.; Timofeeva, M.N.; Said-Aizpuru, O.; Panchenko, V.N.; Gerasimov, E.Y.; Kozhevnikov, I.V.; Parmon, V.N. The main factors affecting the catalytic properties of Ru/Cs-HPA systems in one-pot hydrolysis-hydrogenation of cellulose to sorbitol. Appl. Catal. A Gen. 2020, 595, 117489. [Google Scholar] [CrossRef]
- Rey-Raap, N.; Ribeiro, L.S.; Órfão, J.J.d.M.; Figueiredo, J.L.; Pereira, M.F.R. Catalytic conversion of cellulose to sorbitol over Ru supported on biomass-derived carbon-based materials. Appl. Catal. B Environ. 2019, 256, 117826. [Google Scholar] [CrossRef]
- Zhang, G.; Chen, T.; Zhang, Y.; Liu, T.; Wang, G. Effective Conversion of Cellulose to Sorbitol Catalyzed by Mesoporous Carbon Supported Ruthenium Combined with Zirconium Phosphate. Catal. Lett. 2020, 150, 2294–2303. [Google Scholar] [CrossRef]
- Arunajatesan, V.; Chen, B.; Möbus, K.; Ostgard, D.J.; Tacke, T.; Wolf, D. Carbon-Supported Catalysts for the Chemical Industry. In Carbon Materials for Catalysis; Serp, P., Figueiredo, J.L., Eds.; John Wiley & Sons Inc.: Hoboken, NJ, USA, 2009; pp. 535–572. ISBN 9780470178850. [Google Scholar]
- Besson, M.; Gallezot, P.; Perrard, A.; Pinel, C. Active carbons as catalysts for liquid phase reactions. Catal. Today 2005, 102–103, 160–165. [Google Scholar] [CrossRef]
- Kobayashi, H.; Ito, Y.; Komanoya, T.; Hosaka, Y.; Dhepe, P.L.; Kasai, K.; Hara, K.; Fukuoka, A. Synthesis of sugar alcohols by hydrolytic hydrogenation of cellulose over supported metal catalysts. Green Chem. 2011, 13, 326–333. [Google Scholar] [CrossRef] [Green Version]
- Manaenkov, O.V.; Kislitsa, O.V.; Matveeva, V.G.; Sulman, E.M.; Sulman, M.G.; Bronstein, L.M. Cellulose Conversion Into Hexitols and Glycols in Water: Recent Advances in Catalyst Development. Front. Chem. 2019, 7, 834. [Google Scholar] [CrossRef]
- Komanoya, T.; Kobayashi, H.; Hara, K.; Chun, W.J.; Fukuoka, A. Kinetic study of catalytic conversion of cellulose to sugar alcohols under low-pressure hydrogen. ChemCatChem 2014, 6, 230–236. [Google Scholar] [CrossRef]
- Deng, W.; Tan, X.; Fang, W.; Zhang, Q.; Wang, Y. Conversion of cellulose into sorbitol over carbon nanotube-supported ruthenium catalyst. Catal. Lett. 2009, 133, 167–174. [Google Scholar] [CrossRef] [Green Version]
- Ribeiro, L.S.; Delgado, J.J.; Órfão, J.J.M.; Pereira, M.F.R. Carbon supported Ru-Ni bimetallic catalysts for the enhanced one-pot conversion of cellulose to sorbitol. Appl. Catal. B Environ. 2017, 217, 265–274. [Google Scholar] [CrossRef]
- Chung, P.-W.; Charmot, A.; Click, T.; Lin, Y.; Bae, Y.; Chu, J.-W.; Katz, A. Importance of Internal Porosity for Glucan Adsorption in Mesoporous Carbon Materials. Langmuir 2015, 31, 7288–7295. [Google Scholar] [CrossRef]
- Rodríguez-Reinoso, F.; Linares-Solano, Á. Microporous structure of activated carbon as revealed by adsorption methods. In Chemistry and Physics of Carbon; Marcel Dekker Inc.: New York, NY, USA, 1989; Volume 21, pp. 1–146. [Google Scholar]
- Rouquerol, F.; Rouquerol, J.; Sing, K. Adsorption by Powders & Porous Solids-Principles, Methodology and Applications; Academic Press: London, UK, 1999. [Google Scholar]
- Thommes, M.; Kaneko, K.; Neimark, A.V.; Olivier, J.P.; Rodríguez-Reinoso, F.; Rouquerol, J.; Sing, K.S.W. Physisorption of gases, with special reference to the evaluation of surface area and pore size distribution (IUPAC Technical Report). Pure Appl. Chem. 2015, 87, 1051–1069. [Google Scholar] [CrossRef] [Green Version]
- Rufete-Beneite, M.; Román-Martínez, M.C.; Linares-Solano, A. Insight into the immobilization of ionic liquids on porous carbons. Carbon 2014, 77, 947–957. [Google Scholar] [CrossRef] [Green Version]
- Figueiredo, J.L.; Pereira, M.F.R.; Freitas, M.M.A.; Órfão, J.J.M. Modification of the surface chemistry of activated carbons. Carbon 1999, 37, 1379–1389. [Google Scholar] [CrossRef]
- Zhou, J.-H.; Sui, Z.-J.; Zhu, J.; Li, P.; Chen, D.; Dai, Y.-C.; Yuan, W.-K. Characterization of surface oxygen complexes on carbon nanofibers by TPD, XPS and FT-IR. Carbon 2007, 45, 785–796. [Google Scholar] [CrossRef]
- Silva, A.M.T.; Machado, B.F.; Figueiredo, J.L.; Faria, J.L. Controlling the surface chemistry of carbon xerogels using HNO3-hydrothermal oxidation. Carbon 2009, 47, 1670–1679. [Google Scholar] [CrossRef]
- Li, N.; Ma, X.; Zha, Q.; Kim, K.; Chen, Y.; Song, C. Maximizing the number of oxygen-containing functional groups on activated carbon by using ammonium persulfate and improving the temperature-programmed desorption characterization of carbon surface chemistry. Carbon 2011, 49, 5002–5013. [Google Scholar] [CrossRef]
- Adsuar-García, M.D.; Flores-Lasluisa, J.X.; Azar, F.Z.; Román-Martínez, M.C. Carbon-black-supported Ru catalysts for the valorization of cellulose through hydrolytic hydrogenation. Catalysts 2018, 8, 572. [Google Scholar] [CrossRef] [Green Version]
- Machado, B.F.; Oubenali, M.; Rosa Axet, M.; Trang Nguyen, T.; Tunckol, M.; Girleanu, M.; Ersen, O.; Gerber, I.C.; Serp, P. Understanding the surface chemistry of carbon nanotubes: Toward a rational design of Ru nanocatalysts. J. Catal. 2014, 309, 185–198. [Google Scholar] [CrossRef] [Green Version]
- Szymański, G.S.; Karpiński, Z.; Biniak, S.; Światkowski, A. The effect of the gradual thermal decomposition of surface oxygen species on the chemical and catalytic properties of oxidized activated carbon. Carbon 2002, 40, 2627–2639. [Google Scholar] [CrossRef]
- Figueiredo, J.L.; Pereira, M.F.R.; Freitas, M.M.A.; Órfão, J.J.M. Characterization of active sites on carbon catalysts. Ind. Eng. Chem. Res. 2007, 46, 4110–4115. [Google Scholar] [CrossRef] [Green Version]
- Folkesson, B. ESCA Studies on the charge distribution in some dinitrogen complexes of Rhenium, Iridium, Ruthenium, and Osmium. Acta Chem. Scand. 1973, 27, 287–302. [Google Scholar] [CrossRef]
- Shen, J.Y.; Adnot, A.; Kaliaguine, S. An ESCA study of the interaction of oxygen with the surface of ruthenium. Appl. Surf. Sci. 1991, 51, 47–60. [Google Scholar] [CrossRef]
- KÖtz, R. XPS Studies of Oxygen Evolution on Ru and RuO2 Anodes. J. Electrochem. Soc. 1983, 130, 825–829. [Google Scholar] [CrossRef]
- Oh, Y.J.; Yoo, J.J.; Kim, Y.I.; Yoon, J.K.; Yoon, H.N.; Kim, J.-H.; Park, S. Bin Oxygen functional groups and electrochemical capacitive behavior of incompletely reduced graphene oxides as a thin-film electrode of supercapacitor. Electrochim. Acta 2014, 116, 118–128. [Google Scholar] [CrossRef] [Green Version]
- Velo-Gala, I.; López-Peñalver, J.J.; Sánchez-Polo, M.; Rivera-Utrilla, J. Surface modifications of activated carbon by gamma irradiation. Carbon 2014, 67, 236–249. [Google Scholar] [CrossRef]
- Lin, Z.; Cai, X.; Fu, Y.; Zhu, W.; Zhang, F. Cascade catalytic hydrogenation–cyclization of methyl levulinate to form g -valerolactone over Ru nanoparticles supported on a sulfonic acid-functionalized UiO-66 catalyst. RSC Adv. 2017, 7, 44082–44088. [Google Scholar] [CrossRef] [Green Version]
- Li, H.-X.; Zhang, X.; Wang, Q.; Zhang, K.; Cao, Q.; Jin, L. Preparation of the recycled and regenerated mesocarbon microbeads-based solid acid and its catalytic behaviors for hydrolysis of cellulose. Bioresour. Technol. 2018, 270, 166–171. [Google Scholar] [CrossRef]
- Peng, G.; Gramm, F.; Ludwig, C.; Vogel, F. Effect of carbon surface functional groups on the synthesis of Ru/C catalysts for supercritical water gasification. Catal. Sci. Technol. 2015, 5, 3658–3666. [Google Scholar] [CrossRef] [Green Version]
- Román-Martínez, M.C.; Cazorla-Amorós, D.; Linares-Solano, A.; De Lecea, C.S.-M.; Yamashita, H.; Anpo, M. Metal-support interaction in Pt/C catalysts. Influence of the support surface chemistry and the metal precursor. Carbon 1995, 33, 3–13. [Google Scholar] [CrossRef]
- Azar, F.-Z.; Lillo-Ródenas, M.A.; Román-Martínez, M.C. Cellulose hydrolysis catalysed by mesoporous activated carbons functionalized under mild conditions. SN Appl. Sci. 2019, 1, 1739. [Google Scholar] [CrossRef] [Green Version]
- Shrotri, A.; Kobayashi, H.; Fukuoka, A. Cellulose Depolymerization over Heterogeneous Catalysts. Acc. Chem. Res. 2018, 51, 761–768. [Google Scholar] [CrossRef] [PubMed] [Green Version]


| Sample | SBET [a] (m2g−1) | Vmicro [b] (cm3g−1) | Vmeso [c] (cm3g−1) |
|---|---|---|---|
| SA | 1464 | 0.73 | 0.74 |
| SASu | 1522 | 0.78 | 0.60 |
| SAS | 1274 | 0.65 | 0.48 |
| Ru/SA | 1416 | 0.71 | 0.66 |
| Ru/SASu | 1406 | 0.68 | 0.63 |
| Ru/SAS | 1218 | 0.60 | 0.47 |
| Sample | CO2 (mmolg−1) | CO (mmolg−1) | CO + CO2 (mmolg−1) | O [a] (wt %) | Acidic OFG [b] (mmol/g) |
|---|---|---|---|---|---|
| SA | 0.5 | 2.8 | 3.3 | 5.7 | 1.9 |
| Ru/SA | 0.7 | 4.5 | 5.2 | 8.6 | 2.9 |
| SASu | 0.7 | 3.6 | 4.3 | 7.4 | 2.5 |
| Ru/SASu | 0.9 | 5.3 | 6.2 | 10.2 | 4.0 |
| SAS | 2.2 | 6.3 | 8.5 | 14.6 | 7.2 |
| Ru/SAS | 1.2 | 6.0 | 7.2 | 11.8 | 4.5 |
| O wt % | Acidic OFG [b] (mmol/g) | |||||
| Peak | 1 | 2 | 3 | 4 | O in acidic OFG [a] | |
| B.E. (eV) | 531 ± 0.4 | 532 ± 0.2 | 533 ± 0.3 | 534 ± 0.5 | ||
| Sample | C=O | C=O or OH | C-OH | C-OOH | ||
| Ru/SA | 3.32 | 2.26 | 2.77 | 0.62 | 3.39 | 1.93 |
| Ru/SASu | 3.63 | 2.91 | 3.36 | 2.75 | 6.11 | 2.99 |
| Ru/SAS | 3.34 | 7.51 | 7.05 | 3.83 | 10.88 | 5.60 |
| Catalyst | Conversion % | Yield % | |||
|---|---|---|---|---|---|
| Glucose | HMF | Sorbitol | Mannitol | ||
| Blank | 35 | 13 | 10 | - | - |
| Ru/SA | 52 | - | - | 48 | 3 |
| Ru/SASu | 46 | - | - | 35 | 1 |
| Ru/SAS | 43 | 1 | - | 33 | 1 |
| Entry | Cat. Name | Pret. [a] | S/Ru [b] | T (°C) | P (Bar) | T (h) | Xcellulose (%) | Ysorbitol (%) | Ref. |
|---|---|---|---|---|---|---|---|---|---|
| 1 | Ru/BP2000 | BM-2d | 1620 | 190 | 50 | 24 | 86 | 37 | [19] |
| 2 | Ru/AC(N) | - | 324 | 190 | 9 | 3 | 51 | 17 | [21] |
| 3 | Ru/AC(N) | MM-4d | 324 | 190 | 9 | 3 | 89 | 58 | [21] |
| 4 | Ru/CNT | H3PO4-MM | 320 | 185 | 50 | 24 | - | 69 | [22] |
| 5 | Ru/MC | - | 556 | 190 | 50 | 1.5 | 35.4 | 20 | [16] |
| 6 | Ru/CCD | BM-1d | 25 | 180 | 40 | 10 | 32.7 | - | [13] |
| 7 | Ru/CCD-SO3H | BM-1d | 25 | 180 | 40 | 10 | 100 | 63.8 | [13] |
| 8 | Ru/AG-CNT | BM | 556 | 205 | 50 | 5 | 100 | 60.4 | [15] |
| 9 | Ru/SA | BM-7h | 400 | 190 | 50 | 3 | 52 | 48 | this work |
© 2020 by the authors. Licensee MDPI, Basel, Switzerland. This article is an open access article distributed under the terms and conditions of the Creative Commons Attribution (CC BY) license (http://creativecommons.org/licenses/by/4.0/).
Share and Cite
Azar, F.-Z.; Lillo-Ródenas, M.Á.; Román-Martínez, M.C. Mesoporous Activated Carbon Supported Ru Catalysts to Efficiently Convert Cellulose into Sorbitol by Hydrolytic Hydrogenation. Energies 2020, 13, 4394. https://doi.org/10.3390/en13174394
Azar F-Z, Lillo-Ródenas MÁ, Román-Martínez MC. Mesoporous Activated Carbon Supported Ru Catalysts to Efficiently Convert Cellulose into Sorbitol by Hydrolytic Hydrogenation. Energies. 2020; 13(17):4394. https://doi.org/10.3390/en13174394
Chicago/Turabian StyleAzar, Fatima-Zahra, M. Ángeles Lillo-Ródenas, and M. Carmen Román-Martínez. 2020. "Mesoporous Activated Carbon Supported Ru Catalysts to Efficiently Convert Cellulose into Sorbitol by Hydrolytic Hydrogenation" Energies 13, no. 17: 4394. https://doi.org/10.3390/en13174394