Monitoring System of Transmission Line in Mountainous Area Based on LPWAN


1
School of Electrical and Automation Engineering, East China Jiaotong University, Nanchang 330013, China
2
School of Electrical Engineering, Beijing Jiaotong University, Beijing 100044, China
*
Authors to whom correspondence should be addressed.
Energies 2020, 13(18), 4898; https://doi.org/10.3390/en13184898
Submission received: 15 July 2020
/
Revised: 11 September 2020
/
Accepted: 16 September 2020
/
Published: 18 September 2020
(This article belongs to the Collection Smart Grid)
Abstract
:In light of the difficulty of the inspection and maintenance of a transmission line condition monitoring system in remote mountainous areas, this paper proposes a long-term online monitoring scheme based on a low power wide area network (LPWAN). Considering different failure rates, three monitoring periods of transmission lines in mountainous areas are proposed. An online monitoring framework of transmission lines in mountainous areas was designed based on long range radio (LoRa) and a cellular mobile network, and a dynamic group network model of LoRa was established. The multi-objective particle swarm optimization algorithm can be used to optimize the energy and delay of the system, and then the suitable working mode for the three monitoring periods can be obtained. The simulation results showed that the minimum packet loss rate of the system could be less than 1%, the energy consumption of the system was 80% lower than the existing monitoring system, and the service life of the system can reach 15.13 years under the normal failure rate. Compared with the existing schemes, the proposed work shows the advantages of high reliability transmission, low cost and long-term monitoring, which is especially for transmission line monitoring in mountainous areas.
1. Introduction
The reliability of power grid transmission largely depends on the reliability of the transmission line working state [1]. Compared with the populated urban areas, transmission lines in remote mountainous areas are difficult to monitor and maintain due to their special geographical location. Traditional methods of transmission line monitoring generally adopt manual inspection, which is time-consuming and laborious. In [2,3,4,5], robots and unmanned aerial vehicles (UAVs) were proposed for automatic line inspection, showing the advantages of low cost and high efficiency compared with manual inspection. However, these methods are still not real time and are difficult to operate in mountainous area.
The online monitoring systems of transmission line can be usually divided into wired systems and wireless systems. Although the cable communication technology exhibits the merits of large capacity and fast speed [6,7], its application in mountainous areas is limited by the expensive installation and maintenance cost. For a wireless monitoring system based on a mobile cellular network [8,9], it can achieve a high wireless transmission speed, large communication bandwidth and wide communication coverage. However, the cost of a mobile cellular network is expensive and its communication coverage is hard to reach in some remote mountainous areas. Due to the merits of simple deployment, low cost, no on-site maintenance, etc., wireless sensor networks (WSNs) are rapidly applied in various monitoring fields since its emergence [10]. There are already many reports on transmission line monitoring systems based on WSN such as wire galloping [11,12], icing warning [13,14,15,16], and tower tilt [17,18,19,20]. However, the communication distance of WSN is relatively short and its work life is limited, which is not suitable for long-term monitoring of transmission lines in mountainous areas.
Low power wide area network (LPWAN) is a new emerging internet of things (IoT) communication technology, which complements between mobile cellular technology and WSN. Compared to the WSN, LPWAN technology shows a longer work life (up to 10 years) and larger communication distance (up to 10 km) [21], hence it is regarded as the mainstream communication technology in the era of 5G IoT [22,23]. Narrow band Internet of Things (NB-IoT) and long range radio (LoRa) are two typical technologies of LPWAN. NB-IoT is built on the cellular network and works in the authorized spectrum [24,25,26,27], LoRa works in unauthorized spectrum and can self-organize a communication network like WSN [28,29]. In [30], a monitoring system based on LoRa was proposed and achieved a maximum transmission distance of 8.33 km. Although NB-IoT can provide higher quality of service (QoS), LoRa is more suitable for application in mountainous areas due to the communication blind area of the cellular mobile network. Zhang X [31] proposed an information monitoring method combining NB-IoT and LoRa, which not only improved the transmission distance, but reduced the operation cost of the monitoring system. However, the low communication speed of LoRa makes it hard to satisfy the demand of the transmission line monitoring system. The hybrid monitoring networks in [32,33] provided us with an excellent choice in achieving the balance between the network performances and network cost.
Compared with ordinary schemes, the monitoring schemes in mountainous areas exhibit great differences in monitoring scheme selection, measurement accuracy, daily monitoring operation maintenance, and implementation [34]. Single working mode is difficult in terms of satisfying the requirements of the online monitoring of transmission lines in mountainous areas [35]. This paper proposes a long-term online monitoring scheme based on LPWAN. Considering the different failure rates, three monitoring periods of transmission lines in mountainous areas were proposed. According to the requirements of energy consumption and time delay, an online monitoring framework of transmission lines in mountainous areas was designed based on the hybrid network integrating LoRa and cellular mobile network, and a dynamic group network model of LoRa was also established. The multi-objective particle swarm optimization algorithm was used to optimize the energy consumption and time delay of the system, and then the suitable working mode for the three monitoring periods can be obtained.
The structure of the paper is as follows. Section 2 introduces the scheme design of the online monitoring system for mountain transmission lines and the network architecture based on LPWAN in detail. In Section 3, the proposed dynamic network grouping method was obtained by establishing various models. The experimental results are discussed in Section 4 and three working modes suitable for mountainous transmission lines were obtained. Our conclusions are presented in Section 5.
2. Transmission Line Monitoring Network Architecture in Mountainous Areas
According to the analysis of the fault rate of transmission lines in mountainous areas [35], we defined three monitoring states: low-risk state, high-risk state, and fault maintenance state. The failure rate of the transmission line showed low or high under low-risk condition or high-risk state, respectively. Under the fault maintenance state, the transmission line fault has occurred and is waiting for location maintenance. Obviously, the communication quality requirements of the three monitoring states are different, and a monitoring system with a single working mode cannot solve the data transmission problem of the system.
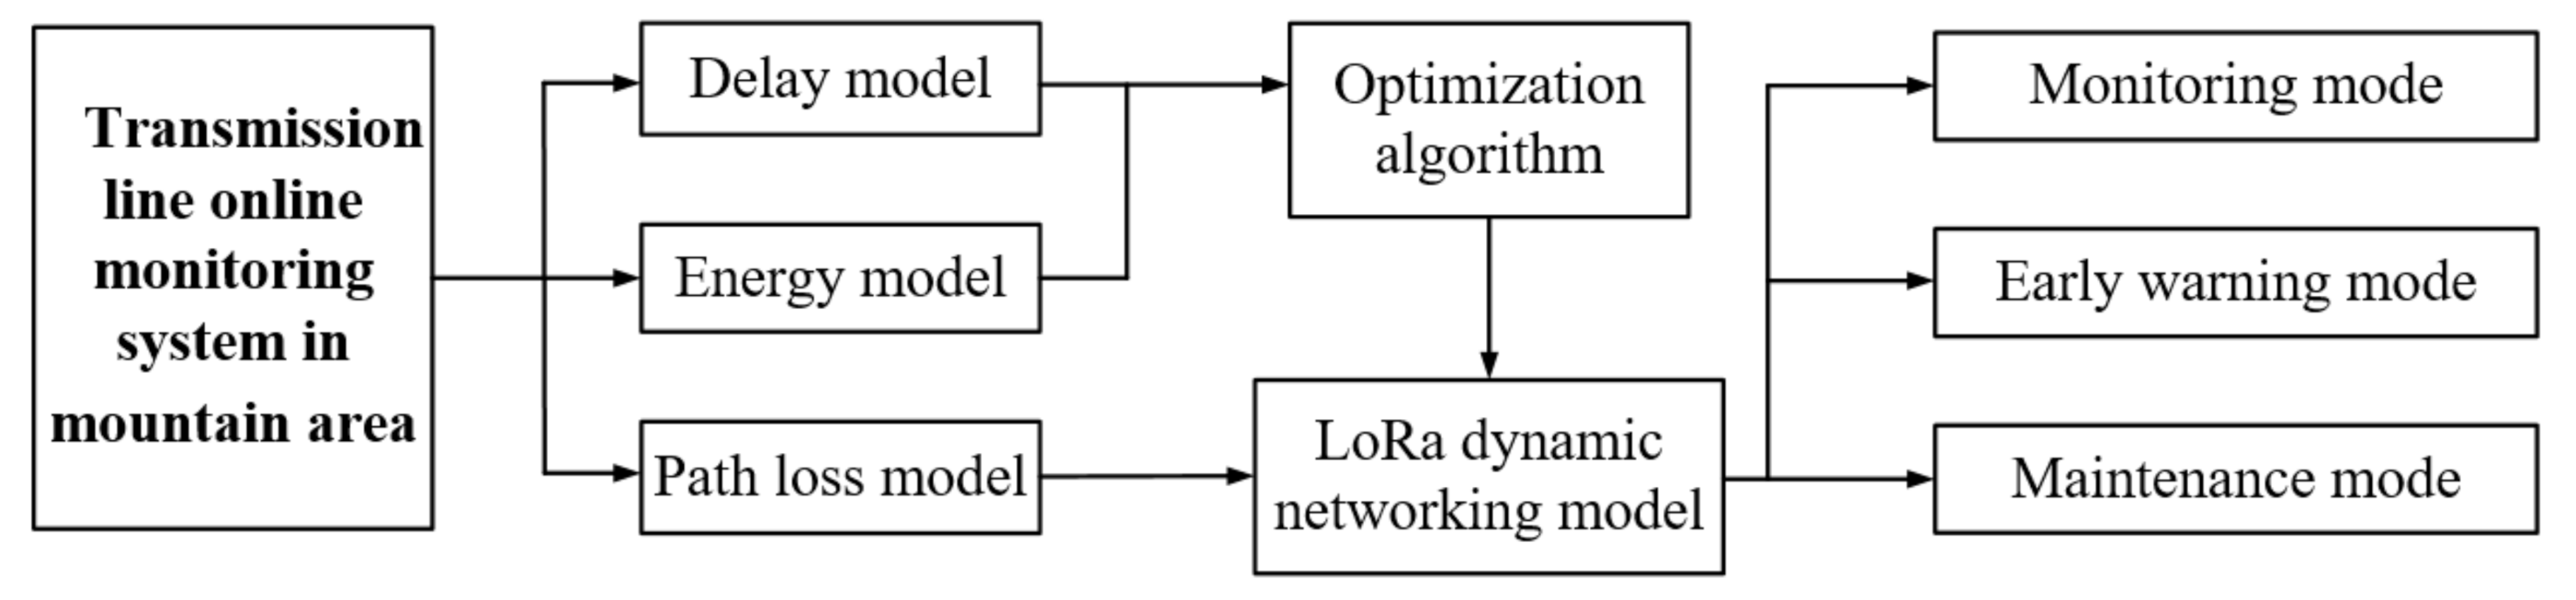
As shown in Figure 1, this paper first proposed an online monitoring system of a transmission line in a mountainous area. Then, we established the delay model, energy model, and path loss model of the monitoring system. The optimal solution to balance the delay and the energy can be obtained through an optimization algorithm. Combining the LoRa transmission model established by the path loss model with the optimal solution of the optimization algorithm, the LoRa dynamic packet model can be obtained. Finally, three working modes can be achieved according to the LoRa dynamic grouping model, which includes the monitoring mode, early warning mode, and maintenance mode.
Figure 2 shows the proposed three-layer monitoring network structure of a transmission line in a mountainous area. Considering the network cost, LoRa was adopted in the first layer to collect massive sensor data and then transmit it to the sink node. In order to satisfy the delay time requirement, a cellular mobile network was employed in the second layer to transmit the data of the sink node to the monitoring center. The third layer was composed of the monitoring center, which can collect data transmitted through wired and cellular mobile networks.
In order to make the proposed monitoring network structure suitable for a mountainous environment, this paper proposed a LoRa dynamic networking model based on the multi-objective optimization algorithm and path loss model, which can change the networking mode under the different conditions of delay and energy consumption. In the network grouping mode of low-risk state, the energy consumption constraint of each terminal node is given priority while the delay consumption constraint is given priority in the fault maintenance state. In the high-risk state, the terminal node and the sink node consider the delay and energy consumption constraints at the same time.
3. Model and Method
3.1. Path Loss Model Design
The transmission line environment in a mountainous area has the characteristics of a deep valley, curved line, and rich surrounding vegetation. Therefore, the interference of radio signals in a mountainous area is stronger than that in a plain area, and the path loss is higher [36]. The transmission of a LoRa signal in a mountainous environment is easily affected by electromagnetic interference [37], mountain shelter, vegetation reflection and absorption, and other factors. It can be seen from [38] that in the mountain monitoring environment, mountain occlusion had the greatest interference on the LoRa signal. Therefore, the path loss model was established according to the influence of mountain shelter on the LoRa signal.
The signal strength of the LoRa transceiver module at a certain point is the difference between the field strength excited by the base station at the antenna and the field strength loss when the signal propagates to the point:
where ET is the field strength excited by the LoRa transceiver module at the antenna and Lps is the median path loss caused by signal propagation. When the signal has no direct propagation path, the diffraction effect will occur, as shown in Figure 3. The distance of the diffraction path is calculated as follows:
where dD is the diffraction distance; d1 is the distance between the LoRa transceiver module antenna and the mountain; d2 is the distance between the receiving antenna and the mountain; hm is the altitude of the mountain; hT is the altitude of the LoRa transceiver module antenna; and hr is the altitude of the receiver antenna. In order to display the diffraction principle of a wireless signal in a mountainous area more intuitively, the schematic diagram, as shown in Figure 3, was constructed by simulating the topography of the southwest mountainous area.
Figure 3 shows the LoRa signal transmission diffraction model established according to the western mountain environment. The LoRa signal passes through the diffraction path ① from point a to point b, and its diffraction law and signal field strength can be analyzed by the Egli model. The Egli propagation model is a simplified wireless propagation model on irregular terrain, which is a statistical model based on a large number of test data, which can reflect the attenuation law and signal trend in an irregular environment. Compared with other terrains, the Egli model can be used to evaluate hilly and mountainous areas as the field strength of the shape is more accurate. The empirical equation of the Egli wireless signal transmission loss is as follows:
where f is the radio frequency; ht is the height of transmitting antenna of LoRa transceiver module; hr is the height of receiving antenna; d is the distance between receiving and transmitting antennas; and Kh is terrain correction factor. When the average relief height Kh of the terrain around the test point was equal to 15 m, Kh was taken as 0; when the terrain relief height H around the test point was greater than or less than 15 m, the terrain correction factor should be added. For the 150 MHz frequency band, the terrain correction factor Kh can be obtained by the following equation:
where H is the average relief height of the terrain around the test point.
3.2. Network Model Design
In this section, the mathematical modeling of the transmission line architecture design is carried out, and a priority multi-objective optimization model of LoRa dynamic grouping is proposed. The optimal installation location and usage quantity of the cellular wireless transmission module under the specified delay conditions were found through the algorithm, and different networking modes can be realized under the constraint of different system energy consumption and delay transformation.
In this paper, the network architecture diagram can be modeled as a data directed graph. The transmission tower near the substation can realize end-to-end data transmission directly through the LoRa transmission module. Therefore, the directional graph mainly considers the transmission tower that needs to transmit data through the cellular wireless transmission module. As shown in Figure 4, suppose that a transmission line contains N transmission line towers, where i represents the end-to-end data transmission link between transmission poles and towers, and j represents the data transmission link of towers through cellular wireless communication. Therefore, any data transmission link can be expressed as a vector (i,j), and P is the set of all wireless transmission communication links, that is, all communication link vectors (i,j) are included in P, . The purpose of this model is to find a feasible communication link for each communication path used, minimize the delay caused by multiple links, and consider the energy constraint of each link.
First, it is necessary to limit the delay generated in any communication link to be less than or equal to the maximum communication delay required, as shown in Equation (5):
where Di,j,k denote that the communication node k uses the data link (i,j) as the generated delay; Mi,j,k are binary variables; if node k uses the data link (i,j) as the communication link, Mi,j,k = 1; otherwise, it is 0; and Dmax represents the maximum transmission delay required by the system administrator.
Equation (6) ensures that there are towers using cellular wireless transmission modules regardless of transmission mode. Where Gi and Li are binary variables, if the i tower uses thee cellular wireless transmission module, then Gi = 1, otherwise it is 0; if tower i uses the LoRa transmission module, then Li = 1, otherwise it is 0.
Equation (7) ensures that each communication link is reused and the link cost is calculated at most once, where Oi,j are binary variables. If the data transmission link (i,j) is used, Oi,j = 1, otherwise it is 0.
Equation (8) determines that the decision variables Mi,j,k, Gi, Li, and Oi,j are binary variables.
The delay function of the network is composed of Equations (5)–(8). The binary variables in the equation are decision variables. Oi,j indicates that the link is used by at least one node. If node k chooses link (i,j) as its transmission path, Mi,j,k = 1, and when there is a delay constraint, the frequency of the cellular wireless transmission access path j of transmission tower i is significantly higher than that of other transmission towers, then the cellular wireless transmission module must be installed on the tower. Therefore, the network delay function is shown in Equation (9):
where is the network energy consumption function; d and b represent the energy consumption of a single cellular wireless transmission module and LoRa transmission module, respectively; and Ci,j represents the communication energy consumption generated on the data link (i,j). The energy consumption function mainly includes transmission module energy consumption and wireless communication energy consumption, and the path loss function Lps must be included in the energy consumption of wireless communication. As shown in Equation (10), system energy consumption is the sum of all communication energy consumption used for data transmission during the whole operation period and the energy consumption and path loss of installing the LoRa transmission module or cellular wireless transmission module on the selected tower.
According to the above equation, the LoRa dynamic networking model of transmission lines in mountainous areas is shown in Equation (11):
3.3. Delay Model and Energy Consumption Model Design
According to [39], if the spread spectrum factor (SF), coding rate (CR), and signal bandwidth (BW) are known, the calculation formula issued by the Semtech company can calculate the air transmission time of a single LoRa node packet. By understanding the key parameters that users can control and according to the definition of the symbol rate, the LoRa symbol rate Rs and symbol period Ts can be calculated by the following formula:
The LoRa data transmission time is equal to the sum of preamble time and packet transmission time. The length of the preamble can be calculated by the following formula:
where np represents the set preamble length, and its value is determined by two registers in the transmission chip.
The payload transfer time can be calculated by the following formula:
where ɛ is the number of payload symbols, which can be calculated by the following formula:
where PL is the number of bytes of payload; when the header is used, H = 0, otherwise H = 1; DE is determined by the chip register; and CR is the coding rate, and the value range is 1–4.
Finally, the data transmission time of LoRa is equal to the preamble transmission time plus the payload transmission time. The formula is as follows:
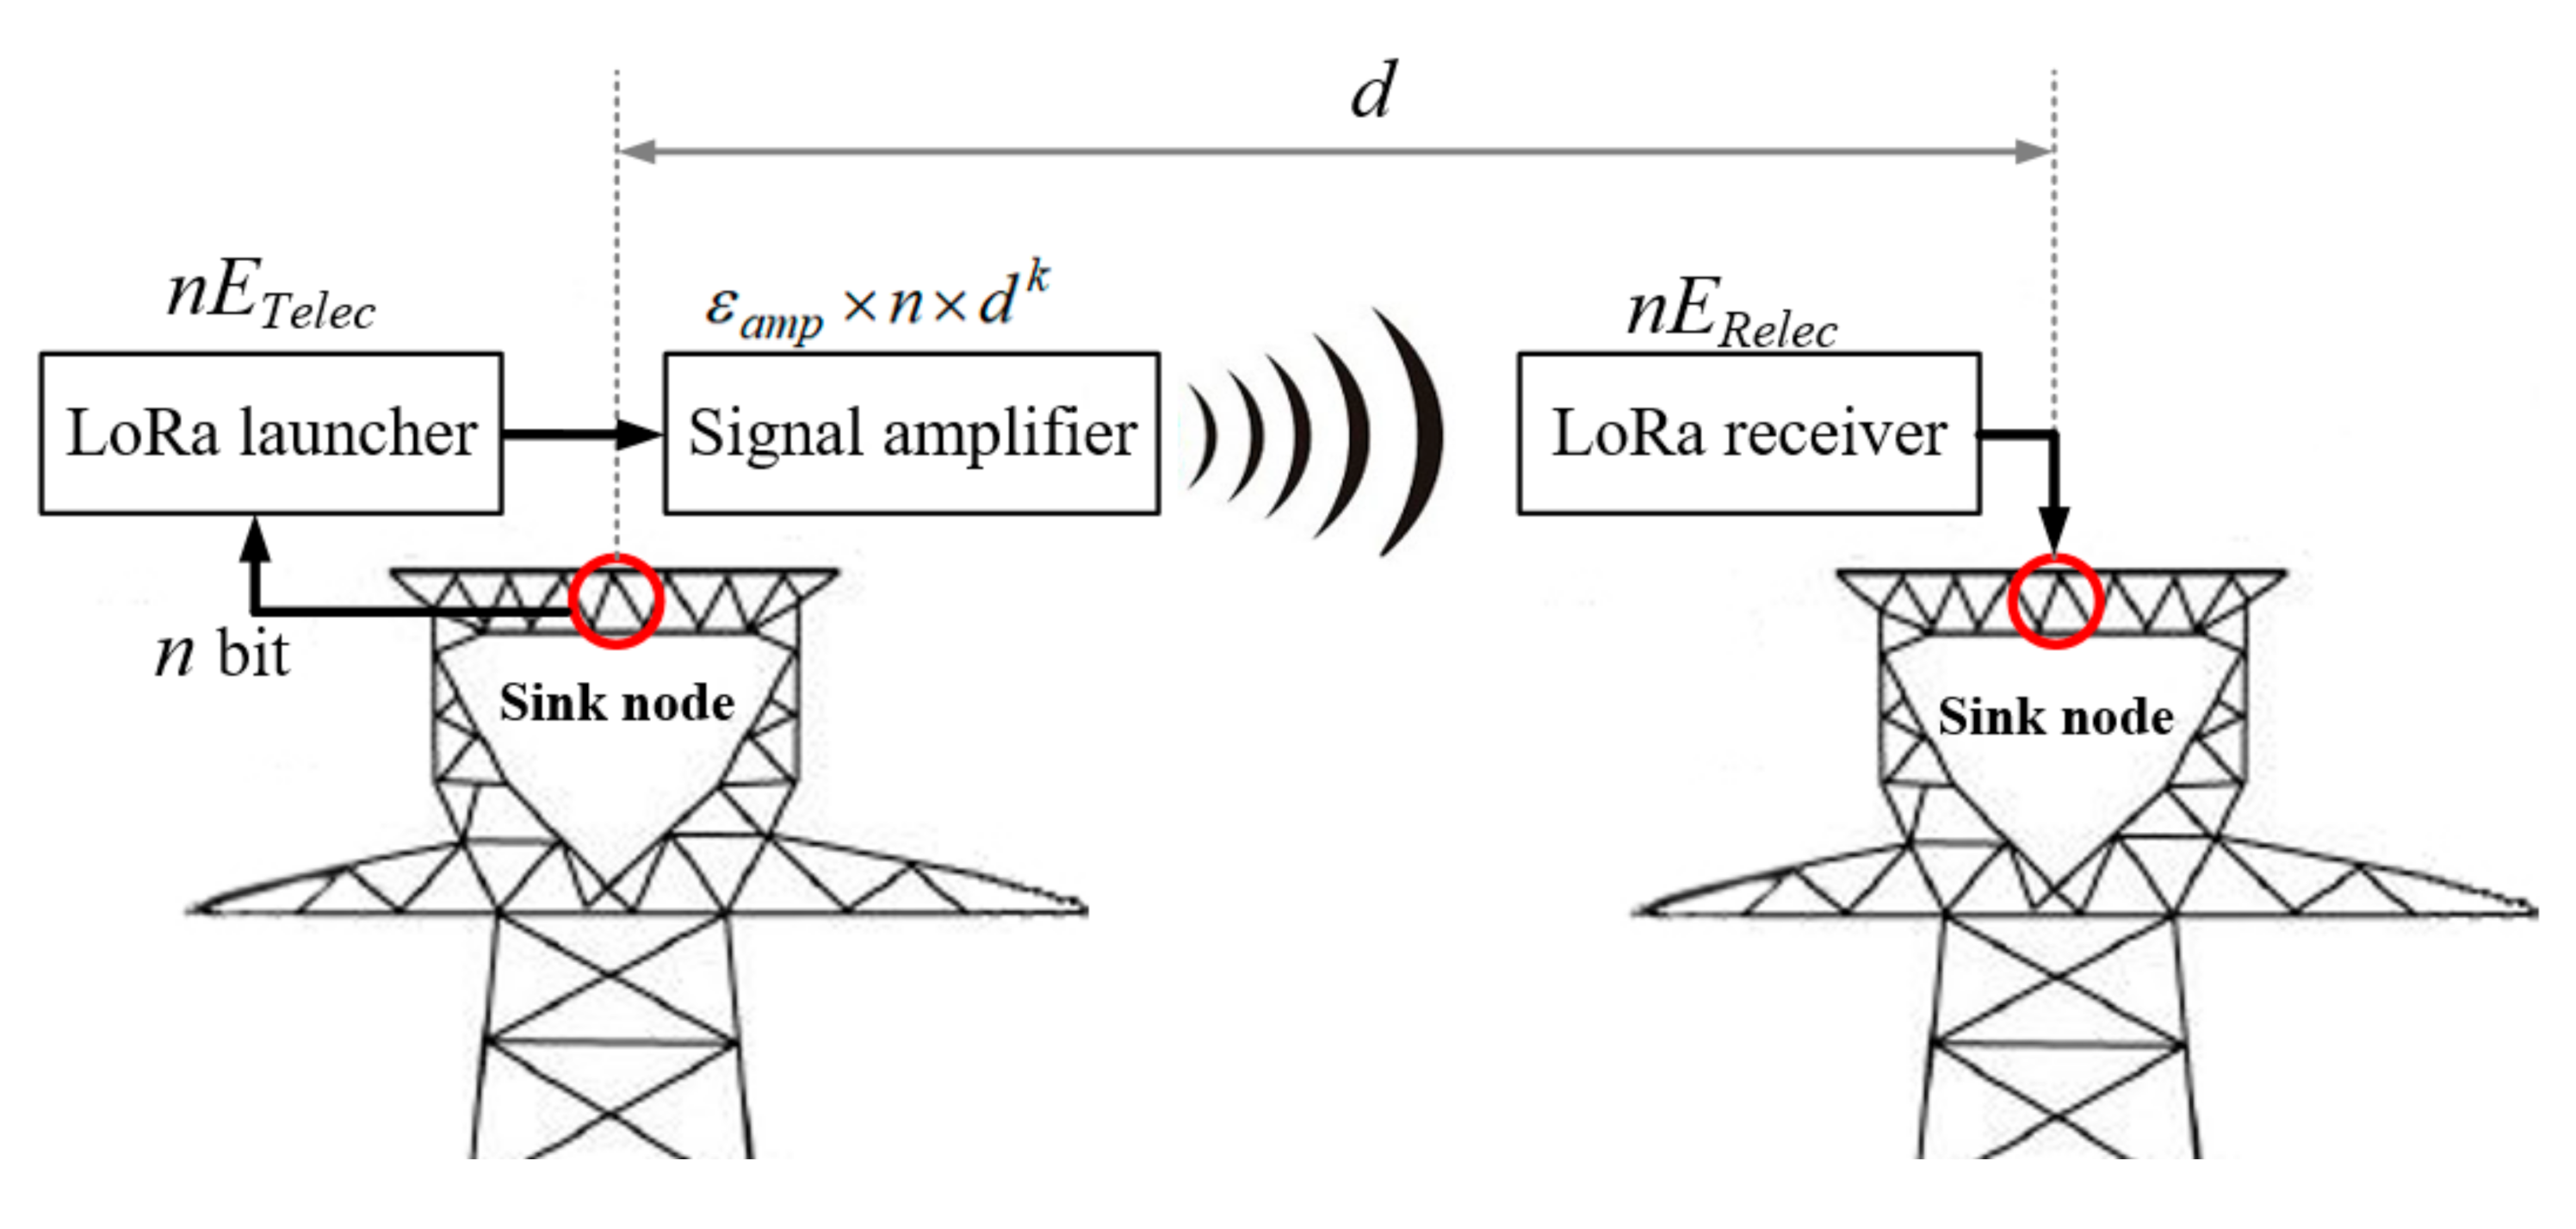
The energy generation process of LoRa data transmission is shown in Figure 5. In this paper, the energy consumption model was established based on the calculation method of communication equipment.
If ETX is the transmission energy consumption, ERX is the receiving energy consumption, n is the data size, and d is the data transmission distance, then:
Among them, ETelec and ERelec, respectively, represent the energy consumption of LoRa communication equipment for sending and receiving data; εamp is the energy consumption of power amplifier transmitting data per unit distance; k is the propagation attenuation index of transmission environment with the value range of 2 ≤ k ≤ 5; k should be taken as 4 in a mountain environment; and Ecc(n) refers to the energy consumption of cellular wireless data transmission module when transmitting n byte data.
3.4. Multi Objective Particle Swarm Optimization Algorithm
Through the modeling of delay and energy consumption, it can be seen that the delay model is mainly related to the parameters of LoRa transmission equipment and the amount of data transmitted. The energy consumption model is mainly related to the receiving and sending power of the LoRa module, the wireless transmission power of the cellular, the amount of data transmitted, and the transmission distance. Low delay and low energy consumption are contradictory goals. In order to meet the design requirements of the transmission line online monitoring system, particle swarm optimization (PSO) [40] can be used to optimize the delay Tall and energy consumption Eall.
The model of the multi-objective optimization algorithm with d-dimension decision variables and m-objective is defined as follows:
where x is the decision vector; X is the decision space; y is the target vector; and Y is the target space.
In the PSO algorithm, each particle is a solution in the solution space. It adjusts its flight according to its own flight experience and the flight experience of its peers. The best position each particle has experienced in the flight process is the optimal solution found by the particle itself. The best position that the whole group has experienced is the optimal solution found by the whole group at present.
Let be the dimensional position of particle a(a = 1,2,...,s), be the flight speed of particle a, be the individual optimal solution of particle a, and be the global optimal solution of the whole population.
In each iteration, the velocity and position of each particle are updated with Equations (23) and (24):
where a = 1, 2,..., s, s is the number of particles in the population, b = 1, 2,..., D, hab ∈ [Lb, Ub], Lb and Ub represent the lower bound and last term of the search space, i ∈ [vmin, D, vmax, D], vmin and vmax respectively represent the minimum and maximum speed of particle flight; c1 and c2 are learning factors; r1 and r2 are random numbers between 0 and 1; and θ is inertia weight.
4. Experiment and Simulation Analysis
In this paper, the parameters of the sensors used are shown in Table 1. In general, the communication energy consumption was far greater than other energy consumption, so the calculation, data fusion, information maintenance, and packet transceiver were not considered in the simulation. The transmission rate of the LoRa module used in the experiment was 5 kb~30 kb, and the transmission distance was 1 km–5 km. The transmission distance is inversely proportional to the transmission rate. The transmission rate of the cellular wireless transmission module was 125 m/s. In this paper, a 500 kV double circuit line on the same tower in southwest mountain area was taken as an example. The delay caused by the state transition delay, access delay, and handover of the cellular link was taken as 50 ms. The transmission tower was located at the top of a narrow slope with an absolute altitude of 2600 m and a relative height difference of about 400 m. Assuming that there are 100 transmission towers with a fixed distance of one kilometer between transmission towers, each transmission tower is equipped with a sensor group. According to the data in Table 1, the sensor group generates 2.73 kb of data each time [41].
4.1. Model Validation and Calibration
In the experimental simulation, according to the Egli path loss mathematical model established in the previous chapter, the simulation parameters were applied to the model to evaluate the path loss of mountain transmission lines in the application of LoRa transmission module networking. The LoRa operating frequency was set at 474 MHz, the height of transceiver antenna was 40 m, the transmission power was 27 dBm, the gain of the transmitting antenna and receiving antenna were 5 and 2 dB, respectively, and the feeder loss was 0.5 dB. The relationship between the path loss obtained by the program and the distance between the transmitter and receiver of LoRa is shown in Figure 6.
Figure 6 shows the relationship between the strength of the LoRa signal and the transmission distance in the Egli model. It can be seen from the figure that the actual and theoretical LoRa signal field strength monotonically decreases with the increase in transmission distance, which is consistent with the trend that the field strength decreases with the increase in distance in the Egli model. By comparing the theoretical field strength with the actual field strength, it was found that the actual measured value was significantly lower than the theoretical calculation value, and the decline amplitude of the actual field strength curve was also lower than the theoretical field strength curve, indicating that there were still other factors affecting the LoRa signal transmission. It can be concluded that the Egli model can reflect the distribution trend of the LoRa signal intensity in mountainous areas, but there is a large error, so the model has to be modified. Through the curve fitting toolbox of MATLAB(2016a, MathWorks, Boston) Simulink, the error fitting formula is as follows:
By introducing Equation (25) into Equations (1) and (3), the relationship between the field strength and the transmission distance of the LoRa signal in the case of mountain shelter can be obtained:
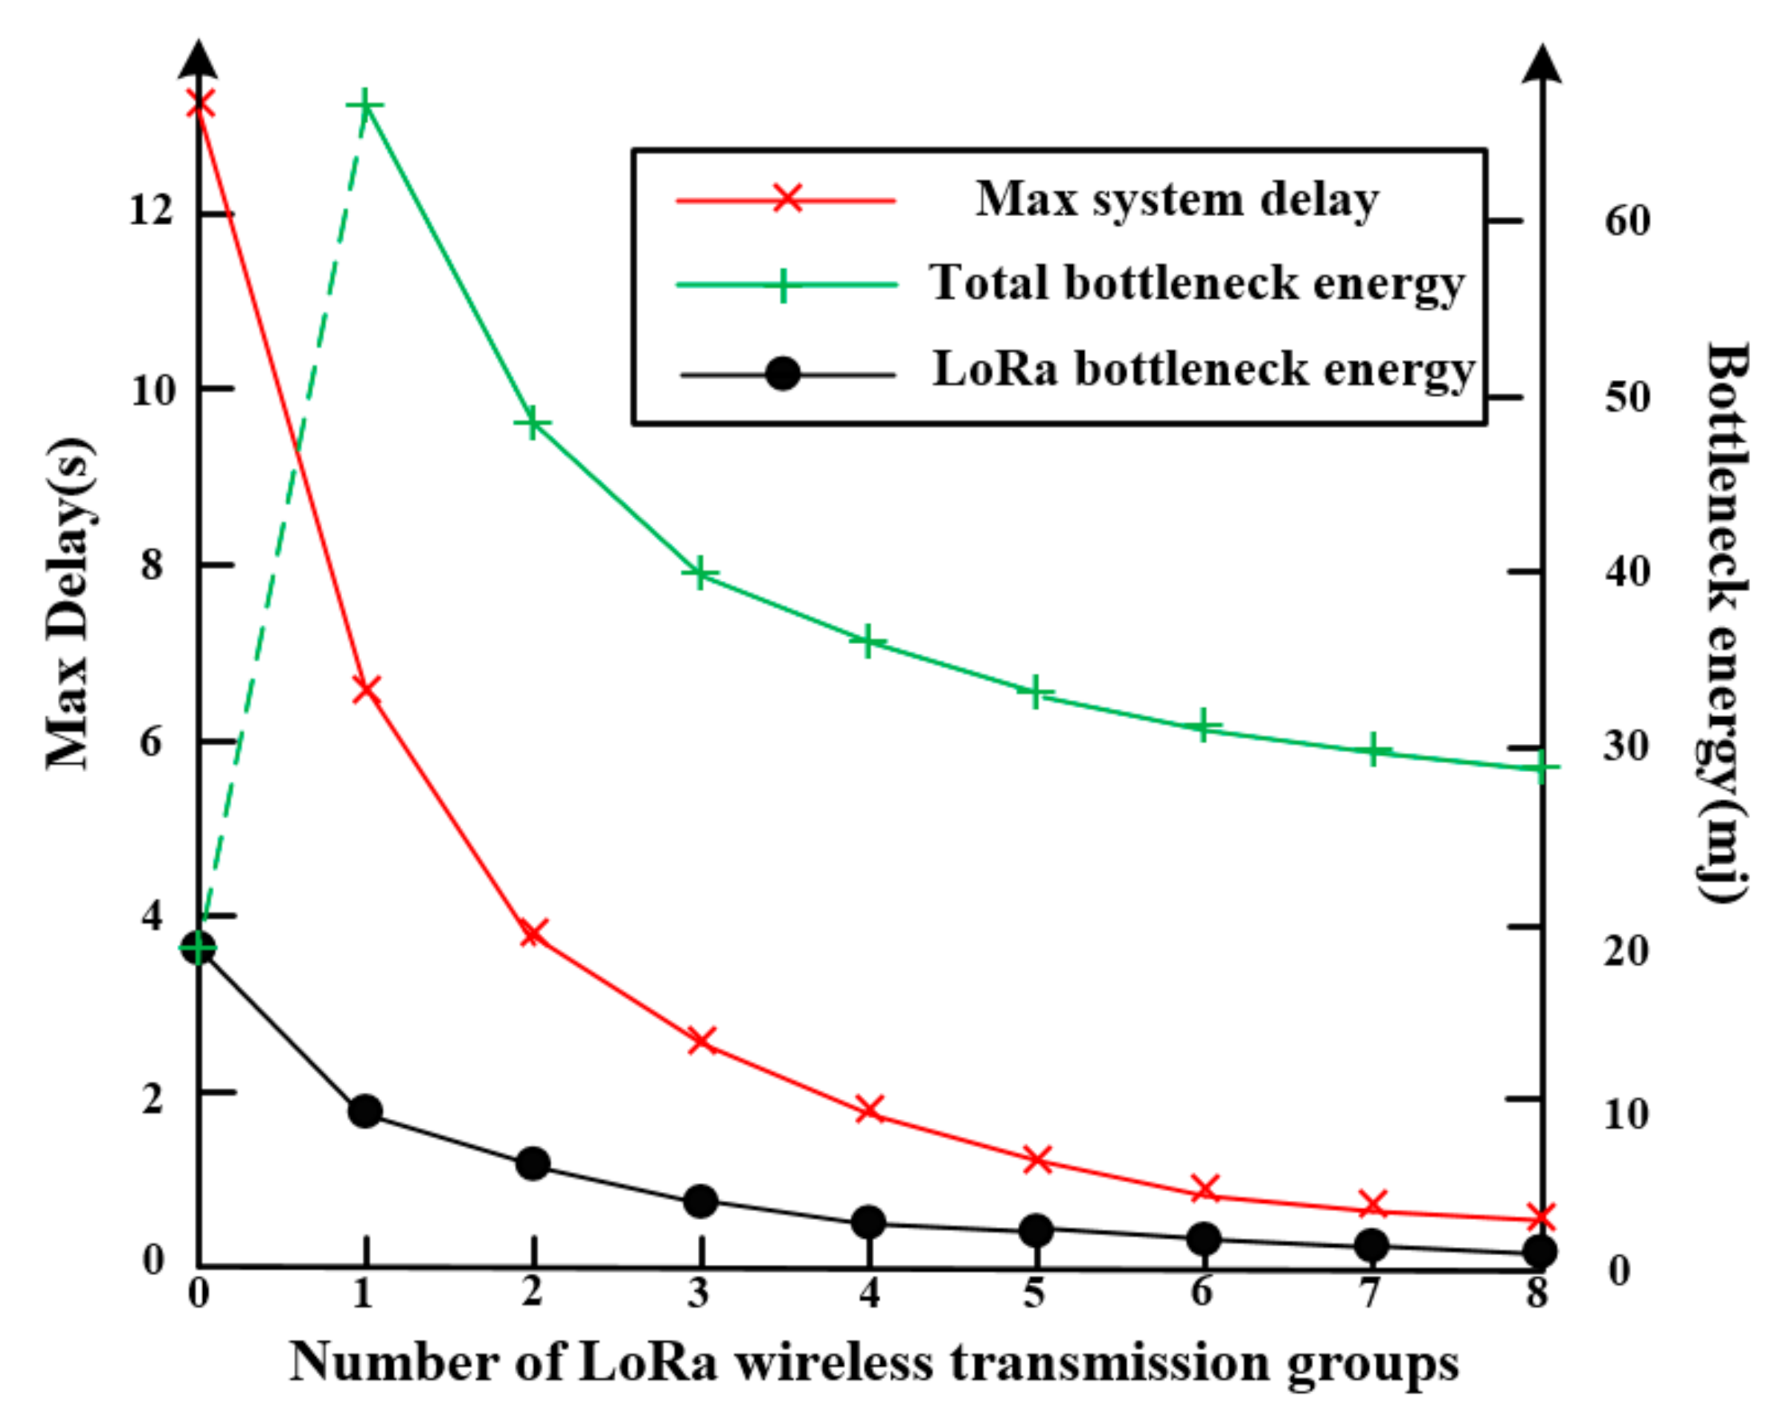
The establishment of a delay model and energy consumption model was the key of this paper. In the delay model, the system delay is determined by the terminal node with the highest transmission delay, so in the experimental simulation, we used the maximum delay DM to represent the system delay model; similarly, the system life was determined by the terminal node with the highest energy consumption, so the energy consumption of this terminal node was called the bottleneck energy EB of the system. In this paper, the RHF78-052 LoRa experimental platform was used to test the relationship between the maximum delay and bottleneck energy of the system based on different LoRa wireless transmission groups. In the simulation experiment, the LoRa module works in the same SF and BW and transmits the same byte data at the same time.
The number of LoRa wireless transmission groups is the key for the design of a monitoring network. Therefore, this paper used the number of LoRa wireless transmission groups to analyze the relationship between the maximum delay and bottleneck energy of the system. As shown in Figure 7, when the number of packets was 0, there was no cellular mobile transmission mode in the network, and the whole network used LoRa to transmit data directly. Transmission towers No. 50 and No. 51, which are the farthest away from the substation supervisory control and data acquisition (SCADA) transmission system, have the longest transmission distance, so their delay was the maximum system delay. The No. 1 transmission tower nearest to the substation SCADA transmission system needs to transmit the most data, so the energy consumed is the bottleneck energy of the system. When the number of LoRa wireless transmission groups is greater than 1, a cellular transmission mode is added in the network, so the system delay is significantly reduced, but the bottleneck energy of the system is greatly increased. As the number of LoRa wireless packets continues to increase, the decline trend of the maximum delay and bottleneck energy gradually decreases, and it may reach a stable value in the future. According to the above analysis, when the system only uses the LoRa transmission mode, it can achieve the minimum system energy consumption; when using cellular mobile transmission and LoRa transmission, it can achieve the minimum system delay.
4.2. Working Mode Selection
In the multi-objective particle swarm optimization, the delay model and energy consumption model are optimized as individuals, and the maximum delay and bottleneck energy are still used as the embodiment of the delay model and energy consumption model. The simulation platform can be established by MATLAB 2016a software to calculate the optimal solution set. The parameter setting of the MATLAB algorithm is shown in Table 2, in which zero-ductility transition (ZDT) and Deb, Thiele, Laumanns and Zitzler(DTLZ) are standard test functions. After the system delay and energy consumption are brought in, the following solution set diagram is obtained:
As shown in Figure 8, there was a contradiction between the delay model and the energy consumption model. It can also be seen that the maximum delay was inversely proportional to the bottleneck energy. However, there was no single objective optimization in the multi-objective particle swarm optimization. It is necessary to weigh the delay and energy consumption and find the optimal solution set in line with the objective function. Through the optimization of the delay model and energy consumption model, the red circle is the required optimal solution set.
It can be seen from Figure 8 that the system delay is inversely proportional to the system energy consumption. In order to find the parameters suitable for the proposed three working modes in the optimal solution set of system delay and energy consumption, it is necessary to evaluate the communication revenue of the system. Therefore, this paper used the indirect constraint optimization method to construct the objective function by introducing the weight ω. The revenue function can be expressed as:
In order to analyze the influence of weight ω in monitoring mode, early warning mode, and maintenance mode on the optimal solution set of the multi-objective particle swarm optimization algorithm, this paper used sx1272calculator UI simulation software to change the network parameters, maximum delay, and bottleneck energy under different ω. The results are shown in Table 3.
According to the requirements of smart grid communication performance in [42], the data transmission period under monitoring mode can be set to 5 min. From the experimental results in Table 2, we can obtain the lowest system energy consumption that the system can achieve when the communication quality is met when ω = 0.2. Therefore, it is defined that the system works in the monitoring mode when ω = 0.2. Similarly, the system revenue function Q(xk) reaches the maximum value when ω = 0.5, so it is defined that the system works in the early warning mode when ω = 0.5. The system delay reaches the minimum value at ω = 0.9, so it is defined that the system works in maintenance mode when ω = 0.9.
After the definition of working mode is completed, the system delay and energy consumption of each working mode are brought into Equation (11) to get the system networking mode under different working modes. In this paper, the OMNeT++(5.0, Simulcraft, NYC) network simulation tool was used to simulate the transmission network of transmission lines. The results are shown in Figure 9.
It can be seen from Figure 9 that when ω = 0.2, the system gives priority to energy consumption constraints. In order to achieve the minimum energy consumption, each terminal node must choose the shortest communication path. Therefore, the networking mode of the monitoring mode is LoRa point by point transmission. When ω = 0.9, the system gives priority to the delay constraint. In order to minimize the delay, the sink node adds the cellular mobile transmission function, and each terminal node carries out point-to-point transmission with the maximum transmission distance. Therefore, the networking mode of the system in the maintenance mode is a hybrid transmission mode of the cellular mobile network and LoRa point-to-point transmission. When ω = 0.5, the system considers both delay and energy consumption constraints. In order to achieve the highest system revenue, each terminal node sends data to the sink node with the cellular mobile transmission function by the LoRa multi hop transmission mode. Therefore, the network mode of the system in early warning mode is a hybrid transmission mode of mobile cellular network and LoRa multi hop transmission.
In wireless communication, packet loss rate represents the ratio between the number of packets lost and the number of packets sent. Packet loss rate is related to packet length, data transmission frequency, and communication distance. It is an important indicator to detect the data transmission performance of wireless networks. When 1000 packets are sent at the same time, the test results are shown in Table 4.
The experimental results show that the packet loss rate of monitoring mode was the highest, reaching 6%, while that of the maintenance mode was the lowest, only 1%. The monitoring system proposed in this paper can change the working mode according to the monitoring status. Although the packet loss rate of the monitoring mode is high, the communication quality is low, and the data can be successfully transmitted within the specified delay; the communication quality of the maintenance mode is high, but the system achieves the lowest packet loss rate, which can meet the communication requirements of the system.
4.3. System Life Calculation
In order to verify that the proposed system has lower energy consumption, we used the LoRawan terminal life calculation tool to calculate the service life of the LoRa terminal in monitoring mode, early warning mode, and maintenance mode, respectively. The experimental results are shown in Table 5.
According to the above test results, the monitoring mode can effectively reduce the energy consumption of the system. The energy consumption of the early warning mode and the maintenance mode is relatively high, especially in maintenance mode, which consumes 9000 mA battery energy after 142 h of operation. The transmission line online monitoring system proposed in this paper has multiple working modes, and the actual working life of the system can be calculated according to the distribution of the fault rate. Taking the fault trip rate of the transmission line in the southwest mountainous area of the State Grid of China from 2011 to 2013 as an example, the fault rate and line length are shown in Table 6.
The online monitoring system of the transmission line proposed in this paper can greatly prolong the service life of the system under the monitoring mode. Taking the failure rate of transmission lines in mountainous areas provided in Table 6 as an example, it can be seen that the monitoring system works 82% of the time in a year of daily monitoring mode, which can reduce the energy consumption by 80% compared with the online monitoring system with a single working mode. The simulation results showed that the monitoring system proposed in this paper can have a working life of up to 15.13 years.
5. Conclusions
This paper proposed a monitoring system of a transmission line in a mountainous area based on LPWAN. Considering thee different failure rates, three monitoring states of transmission lines in mountainous areas were proposed. According to the requirements of energy and delay constraints, an online monitoring framework of transmission lines in mountainous areas was designed based on the LoRa and cellular mobile network, and a dynamic group network model of LoRa was established. The multi-objective particle swarm optimization algorithm was used to optimize the energy consumption and time delay of the system, and then the suitable working mode for the three monitoring periods can be obtained.
The simulation results showed that the minimum packet loss rate of the system could be less than 1%, the energy consumption of the system was 80% lower than the existing monitoring system, and the service life of the system could reach 15.13 years under the normal failure rate. Through the conversion of the working mode, the system could achieve the communication quality required of the online monitoring of transmission lines and greatly reduce the energy consumption of the system at the same time. Compared with the existing schemes, the proposed work shows the advantages of high reliability transmission, low cost, and long-term monitoring, which is particularly important for transmission line monitoring in mountainous areas.
Author Contributions
Conceptualization, H.Z. and F.D.; Methodology, P.Z. (Pengqi Zuo) and P.Z. (Pei Zhang); Validation, P.Z. (Pengqi Zuo). All authors have read and agreed to the published version of the manuscript.
Funding
This research was funded by the Natural Science Foundation of China, grant number 51767006”, Key Research and Development Plan of Jiangxi Province grant number 20181BBE50019”, 20181BBE50009”, 20202BBGL73098”, Key projects of Natural Science Foundation of Jiangxi Province, grant number 20202ACBL214021”, and Science and Technology Project of Education Department of Jiangxi Province, grant number GJJ170378”.
Conflicts of Interest
The authors declare no conflict of interest.
Data Availability Statement
The data used to support the results of this study have not been provided because the author’s college does not allow the data to be published.
References
- Li, Y.; Teng, Y.; Leng, O.; Yuan, S.; Cai, Z. Reliability evaluation of on-line monitoring device over transmission line based on data driven concept. Proc. CSEE 2018, 31, 4410–4419. [Google Scholar]
- Jiang, S.; Jiang, W.; Huang, W.; Yang, L. UAV-based oblique photogrammetry for outdoor data acquisition and offsite visual inspection of transmission line. Remote Sens. 2017, 9, 278. [Google Scholar] [CrossRef] [Green Version]
- Zhao, X.; Tan, M.; Hui, X.; Bian, J. Deep-learning-based autonomous navigation approach for UAV transmission line inspection. In Proceedings of the 2018 IEEE International Conference on Advanced Computational Intelligence, Xiamen, China, 29–31 March 2018; pp. 455–460. [Google Scholar]
- Cao, W.; Zhu, L.; Han, J.; Wang, T.; Du, Y. High voltage transmission line detection for UAV based routing inspection. In Proceedings of the 2013 IEEE International Conference on Advanced Intelligent Mechatronics, Wollongong, Australia, 9–12 July 2013; pp. 554–558. [Google Scholar]
- Bian, J.; Hui, X.; Zhao, X.; Tan, M. A novel monocular-based navigation approach for UAV autonomous transmission-line inspection. In Proceedings of the 2018 IEEE Intelligent Robots and Systems, Madrid, Spain, 1–5 October 2018; pp. 1–7. [Google Scholar]
- Boucouvalas, A.C.; Papageorgiou, C.; Georgantzos, E. Elliptical fibre dielectric waveguides: A transverse transmission line analysis. IET Optoelectron. 2020, 14, 1–9. [Google Scholar] [CrossRef]
- Tavakoli, F.; Ebrahimi, S. Planar optical waveguide for refractive index determining with high sensitivity and dual-band characteristic for Nano-sensor application. Opt. Quantum Electron. 2019, 51, 185. [Google Scholar] [CrossRef]
- Lazaropoulos, A.G. Wireless sensor network design for transmission line monitoring, metering, and controlling: Introducing broadband over power lines-enhanced network model (BPLeNM). Int. Sch. Res. Not. 2014, 1–22. [Google Scholar] [CrossRef] [Green Version]
- Ding, T.; Ding, M.; Mao, G.; Lin, Z.; López-Pérez, D.; Zomaya, A.Y. Uplink performance analysis of dense cellular networks with LoS and NLoS transmissions. IEEE Trans. Wirel. Commun. 2017, 16, 2601–2613. [Google Scholar] [CrossRef] [Green Version]
- Cui, Y.; Song, X.; Zhao, L.; Yuan, H.; Wu, G.; Wang, H. WSN-based measurement of ion-current density under high-voltage direct current transmission lines. IEEE Access 2019, 10947–10955. [Google Scholar] [CrossRef]
- Zhou, X.; Mu, H.; Wei, J.; He, J.; Zhang, G. Verification system of monitoring equipment to overhead galloping transmission lines based on draw-wire sensors. In Proceedings of the 2016 IEEE International Conference on Condition Monitoring and Diagnosis, Xi’an, China, 25–28 September 2016; pp. 606–609. [Google Scholar]
- Huang, X.; Zhao, L.; Chen, G. Design of a wireless sensor module for monitoring conductor galloping of transmission lines. Sensors 2016, 16, 1657. [Google Scholar] [CrossRef] [Green Version]
- Yan, Z.; Li, Z.; Savory, E.; Lin, W.E. Galloping of a single iced conductor based on curved-beam theory. J. Wind Eng. Ind. Aerodyn. 2013, 123, 77–87. [Google Scholar] [CrossRef]
- Zhengming, L.; Yu, Z.; Zheng, W. An icing on-line monitoring system of transmission lines based on WSN. In Proceedings of the 2013 IEEE International Conference on Measuring Technology and Mechatronics Automation, Vicenza, Italy, 27 February–1 March 2013; pp. 194–197. [Google Scholar]
- Yafeng, C.; Ming, L.; Yishi, Y.; Shihua, Z.; Feng, W.; Cheng, W. Analysis and countermeasures of prevent ice-melting flashover for hunan power grid transmission lines. Hunan Electr. Power 2017, 3, 30–33. [Google Scholar]
- Peng, L.; Min, C.; Qimao, L.; Xinling, S.; Shangfei, G. Overview on icing prediction models and decision-making methods of de-icing for power transmission line. In Proceedings of the 2012 Chinese Control Conference, Hefei, China, 25–27 July 2012; pp. 7125–7130. [Google Scholar]
- Shudan, G.U.; Lailiang, C.; Shanshan, W.; Deyun, S. Simulation experiment of line tower tilt monitoring. Bull. Surv. Mapp. 2018, 1, 202–207. [Google Scholar]
- Deng, F.; Zuo, P.; Wen, K.; Wu, X.; He, Y. Low delay technology research of transmission line tower monitoring network integrating WSN and RFID. IEEE Access 2019, 111065–111073. [Google Scholar] [CrossRef]
- Zhang, Q.C.; Zhang, Z.H. Research on wireless sensor network node for tower crane safety monitoring system. Appl. Mech. Mater. 2014, 494–495, 781–784. [Google Scholar] [CrossRef]
- Xiuchao, H.; Jianwei, Z.; Jianye, Z.; Moufu, H.; Jiajun, T.; Jianfeng, Z. Design of transmission tower tilt on-line monitoring system based on ZigBee technology. Mod. Electron. Tech. 2019, 42, 95–99. [Google Scholar]
- Raza, U.; Kulkarni, P.; Sooriyabandara, M. Low power wide area networks: An overview. IEEE Commun. Surv. Tutor. 2017, 19, 855–873. [Google Scholar] [CrossRef] [Green Version]
- Mikhaylov, K.; Petaejaejaervi, J.; Haenninen, T. Analysis of capacity and scalability of the lora low power wide area network technology. In Proceedings of the 2016 European Wireless Conference, Oulu, Finland, 18–20 May 2016; pp. 1–6. [Google Scholar]
- Mekki, K.; Bajic, E.; Chaxel, F.; Meyer, F. A comparative study of LPWAN technologies for large-scale IoT deployment. ICT Express 2018, 5, 1–7. [Google Scholar] [CrossRef]
- Petajajarvi, J.; Mikhaylov, K.; Hamalainen, M.; Linatti, J. Evaluation of LoRa LPWAN technology for remote health and wellbeing monitoring. In Proceedings of the 2016 International Symposium on Medical Information and Communication Technology, Worcester, MA, USA, 21 May 2016; pp. 153–165. [Google Scholar]
- Oh, S.; Shin, J. An efficient small data transmission scheme in the 3GPP NB-IoT system. IEEE Commun. Lett. 2017, 21, 660–663. [Google Scholar] [CrossRef]
- Beyene, Y.; Jantti, R.; Ruttik, K.; Lraji, S. On the performance of narrow-band internet of things (NB-IoT). In Proceedings of the 2017 IEEE Wireless Communications and Networking Conference, San Francisco, CA, USA, 19–22 March 2017; pp. 1–6. [Google Scholar]
- Mahmoud, M.S.; Mohamad, A.A.H. A study of efficient power consumption wireless communication techniques/ modules for internet of things (IoT) applications. Adv. Internet Things 2016, 6, 19–29. [Google Scholar] [CrossRef] [Green Version]
- Petajajarvi, J.; Mikhaylov, K.; Roivainen, A.; Hnninen, T. On the coverage of LPWANs: Range evaluation and channel attenuation model for LoRa technology. In Proceedings of the 2015 IEEE International Conference on Its Telecommunications, Copenhagen, Denmark, 2–4 December 2015; pp. 55–59. [Google Scholar]
- Augustin, A.; Yi, J.; Clausen, T.; William, T. A study of LoRa: Long range & low power networks for the internet of things. Sensors 2016, 16, 1466. [Google Scholar]
- Parri, L.; Parrino, S.; Peruzzi, G.; Pozzebon, A. Low Power Wide Area Networks (LPWAN) at sea: Performance analysis of offshore data transmission by means of LoRaWAN connectivity for marine monitoring applications. Sensors 2019, 19, 3239. [Google Scholar] [CrossRef] [Green Version]
- Zhang, X.; Zhang, M.; Meng, F.; Qiao, Y.; Xu, S.; Hour, S. A low-power wide-area network information monitoring system by combining NB-IoT and LoRa. IEEE Internet Things J. 2019, 6, 590–598. [Google Scholar] [CrossRef]
- Kong, P.; Liu, C.; Jiang, J. Cost-efficient placement of communication connections for transmission line monitoring. IEEE Trans. Ind. Electron. 2017, 64, 4058–4067. [Google Scholar] [CrossRef]
- Fateh, B.; Govindarasu, M.; Ajjarapu, V. Wireless network design for transmission line monitoring in smart grid. IEEE Trans. Smart Grid 2013, 4, 1076–1086. [Google Scholar] [CrossRef]
- Zhang, W.; Yu, H.; Yan, Z.; Xu, J. Study on disaster monitoring technology of mountain fire based on UAV transmission line inspection. In Proceedings of the 2017 IEEE International Conference on Unmanned Systems (ICUS), Beijing, China, 27–29 October 2017. [Google Scholar]
- Shanqiang, G.; Biwu, Y.; Chun, Z.; Tao, W.; Qing, L. Application of lightning optical path monitoring system on 500kV transmission lines in mountain area. In Proceedings of the 2016 International Conference on Lightning Protection, Estoril, Lisboa, Portugal, 25–30 September 2016; pp. 1–5. [Google Scholar]
- Rao, T.R.; Rao, S.V.B.; Prasad, M.V.S.N.; Sain, M.; Lqbal, A.; Lakshmi, D.R. Mobile radio propagation path loss studies at VHF/UHF bands in Southern India. IEEE Trans. Broadcasting 2000, 46, 158–164. [Google Scholar] [CrossRef]
- Taheri, P.; Kordi, B.; Gole, A.M. Parametric study of transient electromagnetic fields due to overhead transmission lines and buried cables in the vicinity of lossy ground. IEEE Trans. Power Deliv. 2011, 26, 2287–2298. [Google Scholar] [CrossRef]
- Hainan, W. The Comparative Analysis and Application of the Common Wireless Radio Transmittal Model. Master’s Thesis, Jilin University, Changchun, China, 2011. [Google Scholar]
- Adelantado, F.; Vilajosana, X.; Tuset-Peiro, P.; Martinez, B.; Melia-Segui, J.; Watteyne, T. Understanding the limits of LoRaWAN. IEEE Commun. Mag. 2017, 55, 34–40. [Google Scholar] [CrossRef] [Green Version]
- Xiong, Y.; Chen, G.; Lu, M.; Wan, X.; Wu, M.; She, J. A Two-phase lifetime-enhancing method for hybrid energy-harvesting wireless sensor network. IEEE Sens. J. 2020, 20, 1934–1946. [Google Scholar] [CrossRef]
- Centenaro, M.; Vangelista, L.; Zanella, A.; Zoezi, M. Long-range communications in unlicensed bands: The rising stars in the IoT and smart city scenarios. IEEE Wirel. Commun. 2016, 23, 60–67. [Google Scholar] [CrossRef] [Green Version]
- Gungor, V.C.; Sahin, D.; Kocak, T.; Ergut, S.; Buccella, C.; Cecati, C.; Hancke, G. Smart grid technologies: Communication technologies and standards. IEEE Trans. Ind. Inform. 2011, 7, 529–539. [Google Scholar] [CrossRef] [Green Version]
Figure 1.
Design of the system monitoring scheme in a mountainous area.

Figure 2.
Monitoring network structure of the transmission line in a mountainous area.

Figure 3.
Principle of wireless signal diffraction.

Figure 4.
Network data transmission digraph.

Figure 5.
Long range radio (LoRa) communication energy consumption.

Figure 6.
Comparison of the theoretical field strength and actual field strength of the Egli model.

Figure 7.
Relationship between the maximum delay and bottleneck energy consumption.

Figure 8.
Solution set of multi-objective particle swarm optimization.

Figure 9.
System networking mode under different working modes.


Table 1.
Monitoring node sensor data.
| Detection Target | Detection Mode | Data Generated by Single Acquisition (bit) |
|---|---|---|
| Ambient temperature | Temperature sensor | 170 |
| Ambient humidity | Humidity sensor | 170 |
| Inclination angle of transmission tower | Angle sensor | 830 |
| Climatic wind speed | Wind speed sensor | 170 |
| Vibration acceleration of transmission line | Acceleration sensor | 570 |
| Vibration amplitude of transmission line | Amplitude sensor | 400 |
| Conductor temperature | Temperature sensor | 170 |
| Insulator leakage current | Electromagnetic sensor | 100 |
| String tension | Friction sensor | 150 |
Table 2.
Experimental parameter settings.
| Algorithm | Population Size | Maximum Number of Iterations | ||
|---|---|---|---|---|
| ZDT | DTLZ | ZDT | DTLZ | |
| Multi objective particle swarm optimization algorithm | 100 | 100 | 100 | 100 |
Table 3.
Sensor parameters of the network parameter monitoring node under different weights ω.
| Weight ω | SF | BW (kHz) | Transmission Distance (km) | D(xk)(s) | E(xk)(mJ) | Q(xk) |
|---|---|---|---|---|---|---|
| 0.1 | 12 | 125 | 1 | 9.21 | 11 | 10.83 |
| 0.2 | 11 | 125 | 1.5 | 5.11 | 15 | 13.61 |
| 0.3 | 10 | 125 | 2 | 2.84 | 26 | 24.81 |
| 0.4 | 8 | 125 | 2.6 | 0.92 | 33 | 25.57 |
| 0.5 | 7 | 125 | 3 | 0.55 | 47 | 33.24 |
| 0.6 | 8 | 250 | 3.5 | 0.46 | 51 | 32.26 |
| 0.7 | 6 | 125 | 4 | 0.34 | 60 | 32.86 |
| 0.8 | 7 | 250 | 4.6 | 0.27 | 70 | 31.31 |
| 0.9 | 6 | 250 | 5 | 0.17 | 76 | 24.03 |
Table 4.
Communication test results of three working modes of the system.
| Working Mode | Transmission Distance/km | Received Packet | Loss Rate | Communication Quality Requirements |
|---|---|---|---|---|
| Monitoring mode | 1.5 | 940 | <6% | Low |
| 1.5 | 957 | <5% | ||
| 1.5 | 959 | <5% | ||
| Early warning mode | 3 | 982 | <3% | Normal |
| 3 | 985 | <3% | ||
| 3 | 980 | <3% | ||
| Maintenance mode | 5 | 998 | <1% | High |
| 5 | 997 | <1% | ||
| 5 | 995 | <1% |
Table 5.
Service life of three working modes.
| Reporting Interval/s | Packet Size/bit | Battery Life/year | |
|---|---|---|---|
| Monitoring mode | 300 | 8 | 18.611 |
| Early warning mode | 5 | 24 | 0.090 |
| Maintenance mode | 1.2 | 36 | 0.016 |
Table 6.
2011–2013 transmission line in the southwest mountainous trip rate of the State Grid Corporation of China.
Table 6.
2011–2013 transmission line in the southwest mountainous trip rate of the State Grid Corporation of China.
| Line Length/100 km | Trip Rate/Time * 100 km * year | |
|---|---|---|
| 2013 | 74.83 | 0.175 |
| 2012 | 71.72 | 0.177 |
| 2011 | 67.29 | 0.213 |
© 2020 by the authors. Licensee MDPI, Basel, Switzerland. This article is an open access article distributed under the terms and conditions of the Creative Commons Attribution (CC BY) license (http://creativecommons.org/licenses/by/4.0/).
Share and Cite
MDPI and ACS Style
Zeng, H.; Zuo, P.; Deng, F.; Zhang, P. Monitoring System of Transmission Line in Mountainous Area Based on LPWAN. Energies 2020, 13, 4898. https://doi.org/10.3390/en13184898
AMA Style
Zeng H, Zuo P, Deng F, Zhang P. Monitoring System of Transmission Line in Mountainous Area Based on LPWAN. Energies. 2020; 13(18):4898. https://doi.org/10.3390/en13184898
Chicago/Turabian StyleZeng, Han, Pengqi Zuo, Fangming Deng, and Pei Zhang. 2020. "Monitoring System of Transmission Line in Mountainous Area Based on LPWAN" Energies 13, no. 18: 4898. https://doi.org/10.3390/en13184898
Note that from the first issue of 2016, this journal uses article numbers instead of page numbers. See further details here.