Hybrid Fuel Cell—Supercritical CO2 Brayton Cycle for CO2 Sequestration-Ready Combined Heat and Power


1
School for Engineering of Matter, Transport and Energy, Arizona State University, Tempe, AZ 85287-6106, USA
2
ASU LightWorks® and School of Molecular Sciences, Arizona State University, Tempe, AZ 85287-5402, USA
3
ASU LightWorks® and School of Sustainability, Arizona State University, Tempe, AZ 85287-5402, USA
*
Author to whom correspondence should be addressed.
Energies 2020, 13(19), 5043; https://doi.org/10.3390/en13195043
Submission received: 23 July 2020
/
Revised: 21 September 2020
/
Accepted: 22 September 2020
/
Published: 24 September 2020
(This article belongs to the Special Issue Small-Scale Energy Systems with Gas Turbines and Heat Pumps)
Abstract
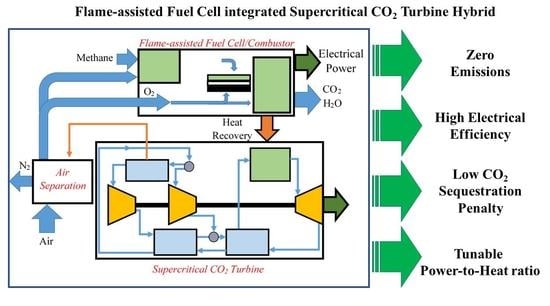
:The low prices and its relatively low carbon intensity of natural gas have encouraged the coal replacement with natural gas power generation. Such a replacement reduces greenhouse gases and other emissions. To address the significant energy penalty of carbon dioxide (CO2) sequestration in gas turbine systems, a novel high efficiency concept is proposed and analyzed, which integrates a flame-assisted fuel cell (FFC) with a supercritical CO2 (sCO2) Brayton cycle air separation. The air separation enables the exhaust from the system to be CO2 sequestration-ready. The FFC provides the heat required for the sCO2 cycle. Heat rejected from the sCO2 cycle provides the heat required for adsorption-desorption pumping to isolate oxygen via air separation. The maximum electrical efficiency of the FFC sCO2 turbine hybrid (FFCTH) without being CO2 sequestration-ready is 60%, with the maximum penalty being 0.68% at a fuel-rich equivalence ratio (Φ) of 2.8, where Φ is proportional to fuel-air ratio. This electrical efficiency is higher than the standard sCO2 cycle by 6.85%. The maximum power-to-heat ratio of the sequestration-ready FFCTH is 233 at a Φ = 2.8. Even after including the air separation penalty, the electrical efficiency is higher than in previous studies.
1. Introduction
Over the past few decades, natural gas (NG) production in the USA has increased by 40% [1]. NG has been termed a “bridge fuel” between the fossil carbon-intensive electric grid of today and the low fossil carbon grid of the future [2,3,4]. Along with less carbon dioxide (CO2) emissions per kWh [5,6], switching from coal to NG also provides several health benefits. Natural gas power plants emit less sulfur dioxide (SO2) [7], nitrogen oxides (NOx) [2], and primary particulate matter [2] when compared to coal-fired power plants. Emissions of primary particulate matter (PM2.5 and PM10) have been linked to human mortality and morbidity [8,9,10,11,12]. Recent regulations have focused attention on reducing emissions and are drivers for a switch from coal to NG power plants [1,13].
Though NG plants have much lower emissions than coal, they still produce substantial amounts of CO2—one of the most prominent greenhouse gas other than water vapor in the atmosphere [14]. Therefore, to minimize CO2 emissions, while still maintaining dispatchability, it is important to address two aspects of power generation: (1) increasing power plant efficiency, and (2) sequestering CO2.
An electrical efficiency frontrunner power cycle is the supercritical CO2 (sCO2) Brayton cycle. Further improving the efficiency will require hybrid approaches, including topping and/or bottoming cycles; one example is the use of solid oxide fuel cells (SOFCs) as a topping cycle.
Dual chambered solid oxide fuel cells (DC-SOFC) are highly efficient, but suffer from limited fuel flexibility due to carbon coking with hydrocarbon fuels [15]. Fuel reformers or catalysts address coking but increase complexity and cost. DC-SOFC also have low thermal endurance leading to sealant failure and performance reduction under cycling load [16,17], so they are not a good candidate for long-term practical applications.
Flame-assisted fuel cells (FFC), and the related direct flame fuel cells (DFFCs) [18,19,20,21,22], were developed to overcome the limitations of DC-SOFC [23,24,25,26,27,28,29]. In the FFC setup, fuel-rich combustion (i.e., partial oxidation) generates syngas (i.e., H2 and CO), which generates power in the SOFC [28]. Lean combustion of the remaining fuel maximizes heat recovery [28,30]. Integration of FFC with NG fueled combustion subsystems can lead to improvements in thermal cycling and an increase in the overall system efficiency while reducing the complexity and cost compared to a DC-SOFC system [25,29,31]. Recently, a paper investigating the integration of FFC with an air Brayton cycle has shown a significant increase in net electrical efficiency due to the integration [32]. Along the same lines, the FFC with a sCO2 turbine, proposed in this paper, aims to achieve electrical efficiency gains at a lower cost compared to integration with a traditional SOFC system.
Further decrease in CO2 emissions can be achieved by CO2 sequestration, which has been investigated recently [33,34,35]. Integrating CO2 sequestration with common power cycles leads to efficiency and cost penalties [36,37], which must be minimized. The approach we examine here relies on low temperature (323–473 K depending on the material) thermally-driven adsorption/desorption cycle for air separation [38,39] to provide pure oxygen to the power cycle. Using pure oxygen produces an exhaust stream containing only CO2 and water vapor, which after condensing the water vapor, is sequestration-ready. In the activation step of the sorption cycle, a high surface area solid sorbent with adsorbed oxygen is heated, leading to O2 desorption. In the pumping step, oxygen from air exothermically chemisorbs on the surface (either molecular or dissociative) [38]. Due to the low temperature requirement, the heat required for the activation step can make use of the heat rejected by the sCO2 cycle. With CO2 removal from the exhaust, the FFC-sCO2 turbine hybrid (FFCTH) can be a zero carbon emissions power and heat generation system.
Here, we analyze the combined approach to emissions-free, CO2 sequestration-ready, NG power generation, via the integration of a FFC and sorption air separation, with a sCO2 Brayton cycle. The FCC and sCO2 turbine generates power; heat recovery makes this FFCTH a combined heat and power (CHP) system. This analysis investigates the benefits of the FFCTH integration showing a plausible path to zero emissions, high efficiency, combined heat, and power.
2. Theory
This section establishes the theory of the overall concept and the individual components in the FFCTH. We first show a detailed analysis of the contribution from each component in the overall system. Following this component analysis, we provide a description of the experimental setup for testing the FFC along with the materials and methods used to conduct the experiment. Lastly, we use the results from the experiments in the theoretical analysis to evaluate the concept further.
2.1. Theoretical Basis: sCO2 Cycle, FFCs, Air Separation, and System Level
2.1.1. Standard sCO2 Brayton Cycle
This section reviews the theory of a standard sCO2 Brayton cycle with recuperation and recompression, to provide a baseline for performance of a standalone sCO2 cycle. Figure 1 shows a schematic of a standard sCO2 cycle with recuperation and recompression [40]. At state 1, 53% of CO2 at a pressure of 7.5 MPa and a temperature of 300 K enters the system where it is compressed to a higher pressure and reaches state 2. Meanwhile, the secondary compressor compresses the rest of the CO2, which starts at the same pressure, but higher temperature and reaches state 2a.
The initial CO2 from state 2 is preheated in the low temperature recuperator and reaches state 2a where the two CO2 streams combine. The complete stream is then further preheated in the high temperature recuperator and reaches state 3. Further heat addition from external sources like combustion of a fuel or a concentrating solar thermal heat transfer fluid via a heat exchanger brings the CO2 to state 4. For the purposes of the analysis here, we use combustion of methane to generate the heat in order to provide the most direct comparison with the FFCTH system. A turbine extracts mechanical energy from the sCO2 stream between state 4 to state 5. The turbine exit stream preheats the incoming CO2 streams in the high temperature recuperator, reaching state 5a, and in the low temperature recuperator, reaching state 6. Heat rejection to the environment or for external processing heating occurs in the pre-cooler, to return to state 1. Cooling the exhaust from the combustor and supplying thermal energy to the sCO2 turbine cycle facilitates maximizing the electrical efficiency.
The electrical efficiency of the standard sCO2 cycle (ηSSGT) given in Figure 1 is represented in Equation (1), where is the total CO2 mass flow rate in the cycle. The specific enthalpies of states 1, 2, 2a, 4, 5, and 6, are h1, h2, h2a, h4, h5, and h6, respectively. The coefficients 0.53 and 0.47 are the mass fraction of CO2 entering the main compressor and secondary compressor, respectively. The mass flow rate of methane required to provide the necessary thermal energy is , and HHVf is the higher heating value of methane. PCC is the total electrical power required for CO2 compression during sequestration. Previous literature has shown that the specific power required for compression and refrigeration of CO2 for sequestration at 15 Bar is 107 kW/kg CO2 [41], which is used in this work. This power is kept zero when sequestration is not assessed.
2.1.2. Flame-Assisted Fuel Cells
This section provides a theoretical model of the FFC, in which performance depends on the fuel-rich equivalence ratio (Φ), defined in Equation (2), as the independent variable. A more detailed FFC model is given in [42]. Here, and are molar flow rates of methane and oxygen, respectively. The superscript ‘S’ denotes rates required for stoichiometric reaction. Thus, combustion is fuel-rich for Φ > 1, fuel-lean for Φ < 1, and stoichiometric for Φ = 1.
Figure 2 shows a schematic of a FFC with various reaction zones. The SOFC in the FFC configuration consists of a porous anode and cathode separated by a dense electrolyte layer. Partial oxidation of the fuel (i.e., methane in this study) and oxygen mixture sent to the fuel-rich pre-burner results in the generation of syngas (H2 + CO). The syngas then diffuses into the anode where it reacts with the oxygen ions diffusing from the cathode side through the electrolyte to form CO2 and water. After the fuel cell, remaining syngas combusts with oxygen, in the fuel-lean (excess oxygen reactant) after-burner and generates heat. The after-burner exhaust exits the fuel cell subsystem. The overall FFC subsystem generates heat during fuel-rich combustion, fuel cell electrochemical oxidation, and fuel-lean combustion.
The first reaction is the fuel-rich combustion of methane in oxygen. Equation (3) shows this reaction. Chemical equilibrium from a Gibbs minimization constrained by conservation of the elements determines the stoichiometry of the products for fuel-rich combustion, i.e., a, b, c, and d, for CO, H2, CO2, and H2O, respectively.
The enthalpy released by the fuel-rich combustion reaction (ΔHRC) can be calculated as shown in Equation (4), where is the mass flow rate for species i and hi is the species specific enthalpy (i.e., per unit mass).
Various losses give rise to three key efficiency definitions in the FFC subsystem. Those include the fuel utilization efficiency (ηfu), the fuel cell conversion efficiency (ηfc), and the overall efficiency (ηov). Equations (5)–(7) define each efficiency, respectively.
FFC electrochemically oxidized both H2 and CO to generate electric power. Equation (8) shows the effective fuel cell reaction), in which the coefficients a1, b1, and γ1 depend upon the a and b stoichiometric coefficients from Equation (3) and the fuel utilization efficiency of the FFC (Equation (5)).
Writing the reaction Equation (8) per mole of syngas leads to Equation (9).
The mole specific standard Gibbs’ free energy released by reaction Equation (8) (Δg°FC) and the temperature is used to calculate the reversible cell potential (Vrev) of the fuel cell as shown in Equation (10). In Equation (10), R is the universal gas constant, T is absolute temperature (in Kelvin), and K is the equilibrium constant of reaction in Equation (8). The mole specific enthalpy of reaction (8) (ΔhFC) is used to calculate the thermo-neutral potential (Vth) as shown in Equation (11) where n is the number of electrons released per mole of fuel in the fuel cell reaction (two electrons per mole of syngas) and F is Faraday’s constant.
The equilibrium constant is calculated as shown in Equation (12) where Pi/P is the ratio of partial pressure of species i and yi/ysyn is the ratio of coefficients of species i in reaction Equation (8). The ratio of partial pressures in the subsystem is equal to the mole fraction of the components, assuming ideal gas behavior.
For the fuel cell reaction, Equation (13) shows how to determine the equilibrium constant, where Xi is the mole fraction of species ‘i’.
Equation (14) shows the power generated by the fuel cell (Pfc), where ηfu is the fuel utilization efficiency, ηfc is the fuel cell efficiency, is the molar flow rate of species ‘k’ (CO or H2) in the fuel-rich exhaust, and are the mole specific Gibbs’ free energies released from the oxidation of CO and H2, respectively.
Equation (15) shows the total heat released by the combined fuel cell reactions; and are the mole specific enthalpy changes from the oxidation of CO and H2, respectively.
After the fuel cell, the remaining fuel passes into the fuel-lean combustion chamber to generate more thermal energy for transfer to the sCO2 stream via an indirect heat exchanger. Equation (16) shows the fuel-lean combustion reaction. In Equation (16), the stoichiometric coefficients a2, b2, and γ2 depend on stoichiometry a and b from Equation (3) and on the ηfu. Thus, if the fuel-rich combustion produces b moles of H2 and a moles of CO and b1 and a1 moles of H2 and CO, respectively, react in the fuel cell reaction, then a2 equals the difference between a and a1 and b2 equals the difference between b and b1. Fixing the Φ of the fuel-lean combustion determines the value of γ2. The assumption and expectation is that CO2 and H2O generated in the fuel-rich combustion, FFC, and the fuel-lean combustion reactions remain unreacted downstream of when they are produced.
2.1.3. FFC sCO2 Turbine Hybrid with and without Carbon Sequestration
Figure 3 shows a schematic of the proposed FFCTH system, where the sCO2 turbine receives heat input from the FFC via an indirect heat exchanger. The optional air separation unit provides oxygen to the FFC and after-burner, with the resulting exhaust requiring only water removal to be sequestration-ready.
Use of FFC, instead of a conventional DC-SOFC, significantly reduces system complexity and size. The FFCTH has several tunable parameters, such as Φ, the FFC operating voltage/current, the air separation unit, and sCO2 cycle variables. Examples of the latter are the pressure ratio and the turbine inlet temperature. All these tunable variables enable optimizing for a high power-to-heat ratio (P/H), high electrical efficiencies, and/or high thermal efficiencies. One key advantage of the system proposed here is that the heat rejected from the pre-cooler can drive the sorption/desorption based air separation unit, thus making this system self-sustained and powered by one fuel source and one injection point. The efficiency of the sorption/desorption based air separation unit is assumed to be in the acceptable range. This assumption applies due to the various tunable state points in the cycle and parameters in the system depending upon the materials used for air separation. The state points of the sCO2 cycle remain the same as shown in Figure 1 with two additional components: (1) heat recovery from the FFC subsystem and (2) air separation from a sorption unit.
To identify the advantages and drawbacks of redesigning so that the system can be CO2 sequestration-ready, we theoretically analyzed this system with and without air separation. Without separation, the FFC subsystem uses air, whereas with separation it produces and utilizes pure oxygen. We compare the system efficiencies, the fuel requirement, and the P/H for cases with and without the FFC integrated and with and without sorption-based air separation. Equation (17) shows the electrical efficiency of the FFC integrated sCO2 turbine FFCTH (ηFFCGT), where and is the power generated by FFC and by the sCO2 turbine cycle, respectively. The heat required for the air separation unit is taken from the heat rejected in the sCO2 cycle pre-cooler (states 6 to 1). The electrical efficiency of the FFCTH is given by Equation (17).
3. Experimental
An experimental assessment and analysis of the FFC performance operating in methane and oxygen fuel-rich combustion exhaust provided data to calibrate and enable simulation of the FFCTH system. Figure 4 shows the schematic of the experimental setup. Use of mass flow controllers regulated the flow of the gases. Connecting the fuel lines for CO and H2 to flame arrestors mitigates and avoids flashback risk.
The flow rates of the gases used in the experiment (CO, H2, CO2) were calculated using chemical equilibrium, from NASA Chemical Equilibrium and Applications (CEA) [43], for the combustion exhaust composition at a constant inlet fuel flow rate of 0.066 mg·s−1. Methane was used as an approximation for natural gas since natural gas is up to 90% methane by molar content [44] and thus, using methane instead of natural gas would not lead to significant departure from the natural gas case. Sulfur impurities will need to be removed from the natural gas before its use in the fuel cell due to poisoning effect on the anode. Other hydrocarbon impurities are not expected to damage the fuel cell since they are reformed in the fuel-rich pre-burner. Table 1 and Table 2 show the NASA CEA exhaust composition for combustion of methane in air and methane in oxygen, respectively. The term used for this exhaust composition, when obtained from chemical equilibrium, is ‘model fuel-rich exhaust’. The case of methane in air serves as a base case for comparison; however, the experiment used only the model fuel-rich exhaust for methane in oxygen as Table 2 shows. Since it is difficult to work with steam, and since steam should be non-reactive electrochemically, increasing the CO2 molar flow serves to eliminate while compensating steam from the experiment. Thus, CO2 molar flow rate in the experiment was the same total (steam plus CO2) as in the proposed concept.
Equation (18) shows the formula to calculate the volumetric flow rate of species ‘i’ as a function of Φ. In Equation (18), Xi and XCH4 are the mole fractions of species ‘i’ and methane, respectively, obtained from Table 2 at the respective Φ. Vmol is the molar volume of an ideal gas at 298 K, 1 bar pressure. Table 3 shows the flow rates subsequently obtained. The gases were all mixed and sent to the FFC subsystem inside a furnace at 1073 K. Previous experiments have shown that the ionic and electronic conductivity of the electrodes and the ionic conductivity of the electrolyte are high at a temperature of 1073 K and above [16]. Furthermore, carbon deposition due to the carbon monoxide disproportionation reaction ( is less favorable at operating temperatures of 1073 K and higher [16]. Thus, a temperature of 1073 K was chosen for the experiments. Air in the furnace was supplied to the fuel cell cathode.
Fuel Cell Fabrication
Fabrication methods for the FFC anode (NiO + YSZ, (Y2O3)0.08(ZrO2)0.92) and the electrolyte (YSZ, ~22 µm thick) used in this study were reported previously in the literature [24]. Pre-firing of the anode occurred at 1373 K. The electrolyte was dip coated on the anode and sintered at 1673 K for four hours. A buffer layer of Sm0.20Ce0.80O2−x (SDC) was deposited onto the electrolyte using spray deposition [45]. An SDC+LSCF (La0.6Sr0.4)0.95Co0.20Fe0.8O3−x) cathode was deposited onto the buffer layer using dip coating, later dried and sintered at 1373 K for two hours. The final internal diameter of the tubular FFC is 2.2 mm and the outer diameter is 3.3 mm. The current collectors on the cathode and anode use silver wire and gold paste. The total active area of the cell is 4.32 cm2. A source meter (Keithley 2460) is connected to the anode and cathode current collector. We used the current-voltage method with a four-probe technique to obtain the polarization curve and the power density.
4. Results and Discussion
4.1. Fuel Cell Performance
Figure 5 shows the performance of the FFC operating at 1073 K with a simulated methane/oxygen fuel-rich combustion exhaust composition between the Φ of 1.2 to 2.8 and flow rates shown in Table 3. A maximum Φ of 2.8 was chosen as carbon formation becomes thermodynamically favorable at higher Φ and peak hydrogen concentration occurs near this Φ. Figure 5 shows that significant power densities were achieved at all Φ.
The significant change in FFC power density shown in Figure 5 is due to a change in polarization at different Φ. At lower current densities (<100 mA/cm2), the slope of the polarization curves remains similar at all Φ indicating dominant ohmic losses. At higher current densities, the polarization losses increase as Φ decreases. This happens because as the Φ decreases, the concentration of syngas in the combustion exhaust decreases, as Table 2 shows, leading to higher concentration losses. There are no significant activation losses at any Φ. As a result of changes in polarization, the power density at each current density increases as the Φ increases. As the Φ increases, more syngas is available in the combustion exhaust leading to larger Gibbs’ free energy released, which in turn leads to less concentration losses and more total power being generated in the FFC. At an operating voltage of 0.6 V, the maximum power density of 183 mW/cm2 occurs at a Φ of 2.8. This power density result (<200 mW/cm2) may not seem impressive on its own; however, consideration of the fuel-utilization efficiencies achieved during the experiment does give it more significance.
The fuel utilization efficiencies reached during the experiment are significantly higher than those found in literature for FFCs [16,24,42,46]. For example, a fuel utilization of 75% at Φ of 1.2 and 63% at Φ of 2.8 is obtained at an operating voltage of 0.6 V. Low flow rates and the controlled experiment in the furnace are the primary reasons for the high fuel utilization observed. Experiments were also conducted for a FFC operating in methane/air fuel-rich combustion exhaust and similar operating characteristics, fuel utilization, and fuel cell efficiency were obtained. The model, presented below, uses experimental parameters of fuel utilization and fuel cell efficiency for the FFC operation in methane/oxygen and methane/air fuel-rich combustion exhaust.
It is important to consider the validity of the FFC model described earlier for prediction of experimental results. From the results in Figure 5, the FFC open circuit voltage shows a clear increasing trend with Φ due to decreased Nernstian loss, as predicted by Equation (10). Figure 6 shows that the analytically calculated reversible cell potential and the open circuit voltage increase with increase in Φ due to increase in the syngas concentration in the fuel-rich combustion exhaust. This comparison indicates that the FFC model is in approximate agreement (<5% variation at all Φ) with the experimental results validating the theoretical model described in the paper.
4.2. sCO2 Turbine Performance with and without an Integrated FFC Subsystem
The computations for the FFCTH assumed that the FFC would achieve similar performance when scaled to design power as it did during the experiment. All thermochemical properties of gases were taken from NIST (Gaithersburg, MD, USA) software MINI-REFPROP [47].
To isolate the effects of integrating the FFC system with the standard sCO2 cycle, the total power generated by the turbine system alone was held constant at 6 MW. To generate this power, Table 4 lists the temperature and pressure of various state points as defined in Figure 1.
The state points in Table 4 were taken from a previous sCO2 power cycle [40]. The mass flow rate of CO2 required to generate 6 MW of power is 48.35 kg/s. The total amount of heat rejected from the sCO2 turbine system is 4.81 MW. The compression ratio in the system is 2.66. With these parameters, we evaluated the performance of an integrated FFC system, which is able to provide the heat required by sCO2 cycle. Air or oxygen is the oxidant for the FFC system. The oxygen case enables sequestration-ready exhaust from the FFC system. The heat rejected from the pre-cooler (states 6 to 1 in Figure 3) provides heat to separate oxygen from air using a thermally driven adsorption/desorption cycle [38]. If the heat rejected from the sCO2 cycle is not enough to separate enough oxygen for the FFC system, we adjusted the FFC operating voltage to enable more heat rejection. Also note that the efficiency of the air-separation is assumed to be acceptable in the design. The flexibility of the cycle state points to give us this unique opportunity of analyzing this cycle and the assumption is thus justified. The state points will need to be modified depending upon the specific material used for adsorption–desorption pumping of oxygen for air separation [38,39]. The fixed parameters used in the analysis is shown in Table 5.
The fuel flowrate requirement of the FFCTH and its variation with Φ was assessed. The initial conditions for air (or oxygen) entering the fuel-rich combustion chamber of the FFC is 1 bar and 298 K. The Φ of the fuel-rich preburner varies, while Φ of the fuel-lean after-burner remains constant at 0.8. The assumed efficiency for the heat exchangers in the system is 90%. ηfu and ηfc (fixed at 0.7 and 0.5, respectively) are the average experimentally measured results over all Φ. Figure 7 shows the flow rate of methane required to generate the heat (10.8 MW) from the FFC with and without being CO2 sequestration-ready. Figure 7 shows the base-case fuel-flow required to meet the heat requirements with a standard sCO2 turbine cycle (Figure 1).
As shown in Figure 7, at all Φ the fuel flow required for the standard sCO2 cycle is lower than the fuel flow for the FFCTH with and without being CO2 sequestration-ready. In the standard sCO2 cycle case, the fuels chemical energy is converted to heat and then to the sCO2 cycle via the heat exchanger. Thus, the standard cycle requires less fuel, but also produces less power than in the case of the integrated FFC. The standard sCO2 cycle operates at a fixed Φ of 0.8 as all of the heat released in the combustor transfers to the working fluid. This fuel flow result shows that more methane is required for the sequestration-ready FFCTH power generation compared to the sCO2 cycle because the electrical power generated by the sCO2 is fixed at 6 MW. However, the electrical efficiency of the FFCTH is higher overall, which will be shown below.
When integrating the FFC with the sCO2 cycle, the amount of methane required to provide the necessary heat increases with Φ. This increase happens because as Φ increases a larger portion of the incoming fuel energy converts to electric power in the FFC due to the constant fuel utilization efficiency. To make up for the larger power generation, more fuel is necessary to meet the heat requirement. Thus, even though the FFCTH requires more methane flow to operate, it is important to consider the electrical efficiency (described in later sections) of the setup in order to establish the significance of these results. It also shows why the comparison of methane flow rate of FFCTH with standard sCO2 turbine cycle alone can be misleading.
Figure 7 also shows that the fuel needed to meet the heat requirement is slightly higher with oxygen (CO2 sequestration-ready case) than with air at lower Φ (7% higher at Φ = 1.2). At higher Φ (>2), the fuel flow rates converge to the same value. To understand the reason for this trend, it is important to consider the syngas concentration of the fuel-rich combustion exhaust with air compared to with oxygen. For the fuel-rich combustion exhaust concentrations for methane with air and oxygen, we refer back to Table 1 and Table 2. To maintain consistency for the purpose of the comparison, the nitrogen is removed, and the rest of the concentrations are rescaled, so they sum to 1. Table 6 shows these scaled concentrations.
Figure 8 shows the trend in the variation of scaled syngas concentrations in the fuel-rich exhaust for methane combustion in air and oxygen. It is evident that the trend in Figure 7 matches the trend in the syngas composition of the fuel-rich combustion exhaust. The syngas oxidizes electrochemically and produces power in the FFC at an assumed constant fuel utilization. Hence, when the flow rates are equal, the higher syngas concentration for the methane/oxygen case will result in more electricity generation due to the constant fuel utilization in the FFC. Higher electricity generation for the methane/oxygen case will require a high flow rate (shown in Figure 7) in order to meet the thermal energy requirement of the sCO2 bottoming cycle.
Figure 9 shows the power generated by the sCO2 cycle with oxygen and with air for the FFCTH. As a base case, Figure 9 shows the power generated by the standard sCO2 turbine cycle. We note that the power generated in the oxygen case includes the electrical power penalty required for sequestration (i.e., compression) of the exhaust CO2, as well as the air separation.
As shown in Figure 9, the power generated by the FFCTH increases with increasing Φ. This increase occurs because increasing the Φ increases the concentration of syngas in the fuel-rich combustion exhaust as shown in Table 1. Electrochemical oxidation of the syngas generates power; hence, more syngas leads to more electrical power generated as long as the fuel utilization remains high. Figure 5 shows the same trend for the experimental results, which confirms the trend and explains the model results.
The total power generated by the FFCTH system with and without being CO2 sequestration-ready follows a slightly different trend than the one in Figure 7. This difference is primarily due to the compression penalty for making the exhaust CO2 sequestration-ready. The power required for sequestration is small (0.1 MW) in comparison to the total power generated (~9.6 MW) at Φ = 2.8. The total power generated by the FFCTH with being CO2 sequestration-ready is 7% higher at Φ = 1.2 and 1.2% lower at Φ = 2.8 compared with no sequestration intent. It can also be seen that the total power generated by the FFCTH is significantly higher (~60% higher at Φ = 2.8) compared to the standard sCO2 turbine due to a large portion of the total power being generated by the FFC and the higher methane flow rate. Thus, analytical results show that the power generated by various cycles considered follows a slightly different trend than the trend for methane flow rate described earlier.
Figure 10 shows the variation of the electrical efficiency of the FFCTH system with and without CO2 sequestration compared to the electrical efficiency of the standard sCO2 turbine system with and without CO2 sequestration. The standard sCO2 turbine system was assessed with and without carbon-sequestration to assess the penalty for the baseline case. As expected, the electrical efficiency of the FFCTH system and the standard sCO2 cycle is higher without sequestration than with sequestration.
The electrical efficiency of the FFCTH with and without sequestration changes at different Φ. At lower Φ, the electrical efficiency with and without CO2 sequestration approach a similar value. This is primarily due to the higher fuel requirement at low Φ (Figure 7) and the power required for CO2 sequestration in the CO2 sequestration case compared to no CO2 sequestration case, as Figure 9 shows. Due to this, the rate of increase of electrical efficiency is much faster for no sequestration case compared to the sequestration case. This shows that the amount of CO2 generated affects the electrical efficiency reduction in the CO2 sequestration case, which is in line with logic.
The maximum absolute efficiency penalty is 0.68% at Φ = 2.8. This is a very small efficiency penalty compared to previous literature [36,37,48]. The electrical efficiency of the FFCTH without sequestration is 6.85% higher than the standard sCO2 turbine setup without sequestration. The standard sCO2 turbine setup pays a penalty of 1.44% for incorporating CO2 sequestration.
Table 7 provides a comparison of previous attempts at integrating carbon sequestration with gas turbines. As shown from previous studies, conventional gas turbines typically have a 4–10% decrease in electrical efficiency when integrating post exhaust carbon capture and sequestration. Note that different systems use a variety of CO2 sequestration methods, which leads to inconsistent efficiency penalties. The standard sCO2 turbine suffers a smaller penalty in electrical efficiency based on the assumptions in this study, which include the exhaust heated air separation. As the waste heat rejection from the sCO2 cycle is able to meet the air separation requirements in most cases, the efficiency penalty is small compared to previous work. Along with the fact that FFCTH system pays a much smaller penalty in efficiency; this system also provides an advantage over previous systems due to the high overall efficiency while being sequestration-ready.
We assumed earlier that the heat rejected by the system from the pre-cooler can provide heat for air separation. It is thus important to consider the P/H of the system to evaluate its ability to efficiently convert the incoming fuel energy to electricity compared to heat and make the system sequestration-ready. Since the parameters of the sCO2 cycle are constant, the heat rejected from the pre-cooler is also constant at 4.81 MW.
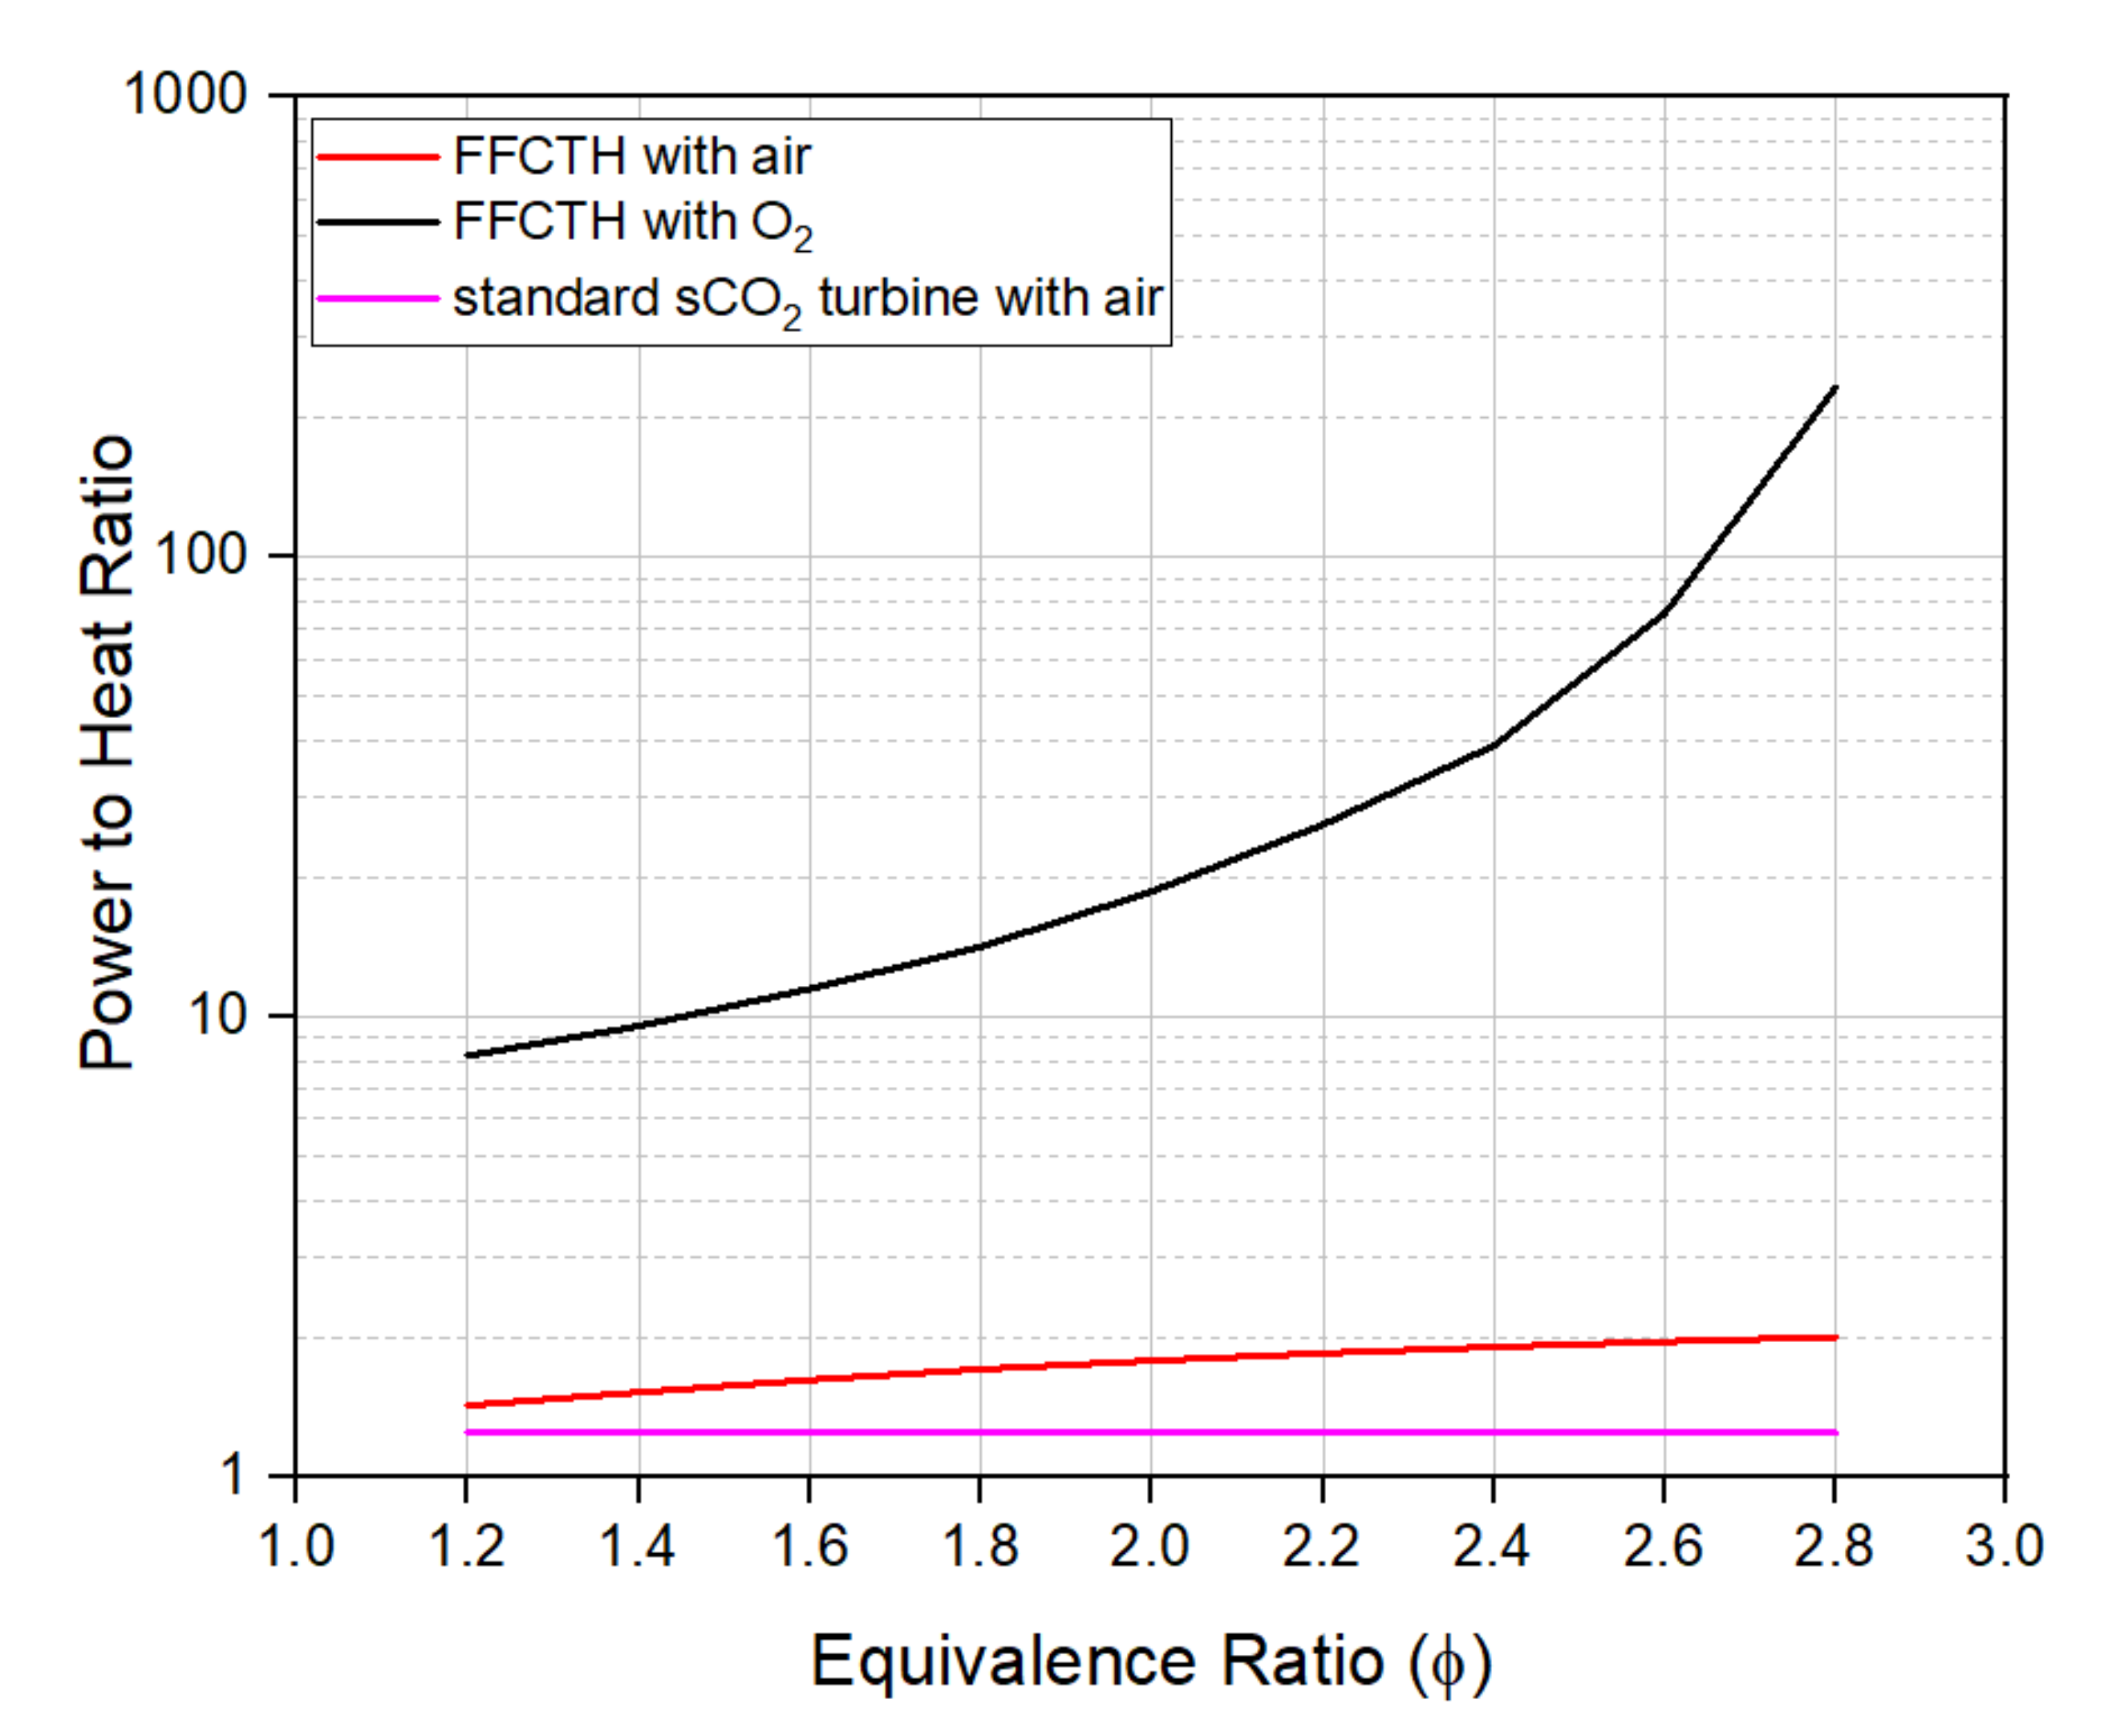
Figure 11 shows the P/H of the proposed system with oxygen and with air and a comparison to a standard sCO2 turbine system. The P/H of the FFCTH is greater than the standard sCO2 turbine system at all Φ due to larger power generation. The P/H of the FFCTH with oxygen (sequestration-ready) is much higher than with air (not sequestration-ready) at all Φ. The highest P/H for sequestration-ready is 116 times that without at Φ = 2.8. This is primarily because the oxygen separation uses most of the rejected heat from the sCO2 cycle. Thus, minimum heat remains.
5. Conclusions and Future Work
In this paper, we provided a comprehensive analysis of a novel FFCTH. The system is novel in terms of its attractive efficiency without but also with sequestration-ready CO2 emissions. The FFC provides heat for the sCO2 cycle as opposed to a combustor in the standard sCO2 cycle. Experimental characterization of the FFC assessed power density and efficiency. It also provided FFC parameters, such as fuel utilization efficiency and fuel cell conversion efficiency, for a scaled up model and theoretical analysis.
The electrical efficiency of the FFCTH increases with increasing Φ with and without being CO2 sequestration-ready. The electrical efficiency comparison of the FFCTH between sequestration-ready and not is only 0.68% lower at the Φ of 2.8. Surprisingly, this electrical efficiency is almost similar with and without CO2 sequestration readiness at the Φ of 1.2 (0.03% lower with CO2 sequestration ready case). The close match between the two cases occurs because waste heat can be utilized from the sCO2 cycle. The electrical efficiency of the FFCTH reaches a maximum electrical efficiency of 60% at a Φ of 2.8. Although a penalty of lower electrical efficiency occurs with CO2 sequestration, the proposed concept shows a lower reduction in electrical efficiency for carbon sequestration-ready power generation compared to previous literature due to the exhaust heat driven air separation. The proposed system suffers only a 0.68% penalty due to CO2 sequestration. The results show that the syngas present in the fuel-rich combustion exhaust and the amount of CO2 present in the exhaust are important factors in describing the results obtained.
The P/H ratio increases with increasing Φ. Furthermore, both with and without being sequestration-ready have greater P/Hs than the standard sCO2 cycle. The P/H ratio of the FFCTH is 5.7 times higher at the Φ of 1.2 and 116 times higher at the Φ of 2.8 with CO2 sequestration than without sequestration. The FFCTH minimizes unutilized heat from the system by using the rejected heat from sCO2 turbine cycle. This shows a wide range of P/H ratios can be achieved by tuning system variables.
Several future studies can build upon this work. As examples, pressure loss, oxygen adsorption/desorption system size and issues with scaling up the experimental results can be addressed. Although the effect of pressure drop is not expected to significantly affect the conclusions of this study, it should be included in future analysis as it will reduce the performance slightly. The experimental results demonstrate the performance of a single fuel cell, but interconnect and other system losses can be considered with a scaled up experiment. In this study the use of waste heat was not considered except for the thermally-driven adsorption/desorption cycle. Other applications include integration with a steam/organic Rankine cycle, or for process heat, both of which can be investigated further.
Author Contributions
Conceptualization, E.B.S., I.E. and R.J.M.; Data curation, R.G.; Formal analysis, R.J.M.; Funding acquisition, E.B.S. and I.E.; Methodology, R.G., E.B.S. and R.J.M.; Project administration, R.J.M.; Supervision, R.J.M.; Writing—original draft, R.G.; Writing—review and editing, R.G., E.B.S., I.E. and R.J.M. All authors have read and agreed to the published version of the manuscript.
Funding
This research was funded by the USA Department of Energy’s Office of Energy Efficiency and Renewable Energy (EERE) under the Solar Energy Technologies Office grant number DE-EE0008991.
Acknowledgments
This material is based upon work supported by the USA Department of Energy’s Office of Energy Efficiency and Renewable Energy (EERE) under the Solar Energy Technologies Office Award Number DE-EE0008991. The views expressed herein do not necessarily represent the views of the USA Department of Energy or the USA Government.
Conflicts of Interest
The authors declare the following financial interests/personal relationships which may be considered as potential competing interests: A related invention disclosure was submitted.
References
- U.S. Energy Information Administration. Monthly Energy Review—January 2020; 2020; Volume 35. Available online: https://www.eia.gov/totalenergy/data/monthly/pdf/mer.pdf (accessed on 23 September 2020).
- Lueken, R.; Klima, K.; Griffin, W.M.; Apt, J. The climate and health effects of a USA switch from coal to gas electricity generation. Energy 2016, 109, 1160–1166. [Google Scholar] [CrossRef]
- Bao, C.; Wang, Y.; Feng, D.; Jiang, Z.; Zhang, X. Macroscopic modeling of solid oxide fuel cell (SOFC) and model-based control of SOFC and gas turbine hybrid system. Prog. Energy Combust. Sci. 2018, 66, 83–140. [Google Scholar] [CrossRef]
- Levi, M. Climate consequences of natural gas as a bridge fuel. Clim. Chang. 2013, 118, 609–623. [Google Scholar] [CrossRef]
- De Gouw, J.A.; Parrish, D.D.; Frost, G.J.; Trainer, M. Reduced emissions of CO2, NOx, and SO2 from U.S. power plants owing to switch from coal to natural gas with combined cycle technology. Earth’s Future 2014, 2, 75–82. [Google Scholar] [CrossRef]
- Hayhoe, K.; Kheshgi, H.S.; Jain, A.K.; Wuebbles, D.J. Substitution of natural gas for coal: Climatic effects of utility sector emissions. Clim. Chang. 2002, 54, 107–139. [Google Scholar] [CrossRef]
- Venkatesh, A.; Jaramillo, P.; Griffin, W.M.; Matthews, H.S. Implications of changing natural gas prices in the United States electricity sector for SO2, NOX and life cycle GHG emissions. Environ. Res. Lett. 2012, 7, 034018. [Google Scholar] [CrossRef] [Green Version]
- Bell, M.L.; Dominici, F. Effect modification by community characteristics on the short-term effects of ozone exposure and mortality in 98 US communities. Am. J. Epidemiol. 2008, 167, 986–997. [Google Scholar] [CrossRef] [Green Version]
- Bell, M.L.; Ebisu, K.; Peng, R.D.; Walker, J.; Samet, J.M.; Zeger, S.L.; Dominici, F. Seasonal and Regional Short-term Effects of Fine Particles on Hospital Admissions in 202 US Counties, 1999–2005. Am. J. Epidemiol. 2008, 168, 1301–1310. [Google Scholar] [CrossRef] [Green Version]
- Laden, F.; Schwartz, J.; Speizer, F.E.; Dockery, D.W. Reduction in fine particulate air pollution and mortality: Extended follow-up of the Harvard Six Cities Study. Am. J. Respir. Crit. Care Med. 2006, 173, 667–672. [Google Scholar] [CrossRef]
- Pope, C.A.; Ezzati, M.; Dockery, D.W. Fine-particulate air pollution and life expectancy in the United States. N. Engl. J. Med. 2009, 360, 376–386. [Google Scholar] [CrossRef] [Green Version]
- U.S. Environmental Protection Agency Office of Air and Radiation. Regulatory Impact Analysis for the Final Clean Air Interstate Rule; 2005. Available online: https://www.epa.gov/sites/production/files/2020-07/documents/transport_ria_final-clean-air-interstate-rule_2005-03.pdf (accessed on 23 September 2020).
- Interconnection P. Coal Capacity at Risk for Retirement in PJM: Potential Impacts of the Finalized EPA Cross State Air Pollution Rule and Proposed National Emissions Standards for Hazardous Air Pollutants. 2011. Available online: http://www.psc.ky.gov/PSCSCF/2011%20cases/2011-00401/Kentucky%20Power%20Responses%20to%20042312%20Order/AG/012712/AG%201-14%20Attachments/AG%201-14%20Attachment%207.pdf (accessed on 23 September 2020).
- Gaudernack, B.; Lynum, S. Natural gas utilisation without CO2 emissions. Energy Convers. Manag. 1997, 38, S165–S172. [Google Scholar] [CrossRef]
- O’Hayre, R.; Cha, S.-W.; Colella, W.; Prinz, F.B. Fuel Cell Fundamentals; Intergovernmental Panel on Climate Change, Ed.; John Wiley & Sons, Inc.: Hoboken, NJ, USA, 2016; ISBN 9781119191766. [Google Scholar]
- Milcarek, R.J.; Garrett, M.J.; Welles, T.S.; Ahn, J. Performance investigation of a micro-tubular flame-assisted fuel cell stack with 3,000 rapid thermal cycles. J. Power Sources 2018, 394, 86–93. [Google Scholar] [CrossRef]
- Du, Y.; Finnerty, C.; Jiang, J. Thermal Stability of Portable Microtubular SOFCs and Stacks. J. Electrochem. Soc. 2008, 155, B972. [Google Scholar] [CrossRef]
- Wang, Y.; Zeng, H.; Cao, T.; Shi, Y.; Cai, N.; Ye, X.; Wang, S. Start-up and operation characteristics of a flame fuel cell unit. Appl. Energy 2016, 178, 415–421. [Google Scholar] [CrossRef]
- Wang, Y.; Shi, Y.; Ni, M.; Cai, N. A micro tri-generation system based on direct flame fuel cells for residential applications. Int. J. Hydrogen Energy 2014, 39, 5996–6005. [Google Scholar] [CrossRef]
- Kronemayer, H.; Barzan, D.; Horiuchi, M.; Suganuma, S.; Tokutake, Y.; Schulz, C.; Bessler, W.G. A direct-flame solid oxide fuel cell (DFFC) operated on methane, propane, and butane. J. Power Sources 2007, 166, 120–126. [Google Scholar] [CrossRef]
- Vogler, M.; Horiuchi, M.; Bessler, W.G. Modeling, simulation and optimization of a no-chamber solid oxide fuel cell operated with a flat-flame burner. J. Power Sources 2010, 195, 7067–7077. [Google Scholar] [CrossRef]
- Horiuchi, M.; Suganuma, S.; Watanabe, M. Electrochemical Power Generation Directly from Combustion Flame of Gases, Liquids, and Solids. J. Electrochem. Soc. 2004, 151, A1402. [Google Scholar] [CrossRef]
- Wang, K.; Milcarek, R.J.; Zeng, P.; Ahn, J. Flame-assisted fuel cells running methane. Int. J. Hydrogen Energy 2015, 40, 4659–4665. [Google Scholar] [CrossRef] [Green Version]
- Milcarek, R.J.; Garrett, M.J.; Wang, K.; Ahn, J. Micro-tubular flame-assisted fuel cells running methane. Int. J. Hydrogen Energy 2016, 41, 20670–20679. [Google Scholar] [CrossRef] [Green Version]
- Milcarek, R.J.; Wang, K.; Falkenstein-Smith, R.L.; Ahn, J. Micro-tubular flame-assisted fuel cells for micro-combined heat and power systems. J. Power Sources 2016, 306, 148–151. [Google Scholar] [CrossRef] [Green Version]
- Milcarek, R.J.; Ahn, J. Rich-burn, flame-assisted fuel cell, quick-mix, lean-burn (RFQL) combustor and power generation. J. Power Sources 2018, 381, 18–25. [Google Scholar] [CrossRef]
- Milcarek, R.J.; Garrett, M.J.; Baskaran, A.; Ahn, J. Combustion Characterization and Model Fuel Development for Micro-tubular Flame-assisted Fuel Cells. J. Vis. Exp. 2016, 116, e54638. [Google Scholar] [CrossRef] [PubMed]
- Milcarek, R.J.; Nakamura, H.; Tezuka, T.; Maruta, K.; Ahn, J. Microcombustion for micro-tubular flame-assisted fuel cell power and heat cogeneration. J. Power Sources 2019, 413, 191–197. [Google Scholar] [CrossRef]
- Ghotkar, R.; Milcarek, R.J. POWER2019-1852 Integration of Flame-assisted Fuel Cells with a Gas Turbine running Jet-A as fuel. In Proceedings of the ASME 2019 Power Conference collocated the ASME 2019 Nuclear Forum (POWER2019), Salt Lake City, UT, USA, 15–18 July 2019; pp. 1–9. [Google Scholar]
- Milcarek, R.J.; Ahn, J. Micro-tubular flame-assisted fuel cells running methane, propane and butane: On soot, efficiency and power density. Energy 2019, 169, 776–782. [Google Scholar] [CrossRef]
- Milcarek, R.J.; DeBiase, V.P.; Ahn, J. Investigation of startup, performance and cycling of a residential furnace integrated with micro-tubular flame-assisted fuel cells for micro-combined heat and power. Energy 2020, 196, 117148. [Google Scholar] [CrossRef]
- Ghotkar, R.; Milcarek, R.J. Investigation of flame-assisted fuel cells integrated with an auxiliary power unit gas turbine. Energy 2020, 204, 117979. [Google Scholar] [CrossRef]
- Olajire, A.A. A review of mineral carbonation technology in sequestration of CO2. J. Pet. Sci. Eng. 2013, 109, 364–392. [Google Scholar] [CrossRef]
- Gunning, P.J.; Hills, C.D.; Carey, P.J. Accelerated carbonation treatment of industrial wastes. Waste Manag. 2010, 30, 1081–1090. [Google Scholar] [CrossRef]
- Eloneva, S.; Teir, S.; Salminen, J.; Fogelholm, C.J.; Zevenhoven, R. Fixation of CO2 by carbonating calcium derived from blast furnace slag. Energy 2008, 33, 1461–1467. [Google Scholar] [CrossRef]
- Cormos, C.C. Integrated assessment of IGCC power generation technology with carbon capture and storage (CCS). Energy 2012, 42, 434–445. [Google Scholar] [CrossRef]
- Tola, V.; Pettinau, A. Power generation plants with carbon capture and storage: A techno-economic comparison between coal combustion and gasification technologies. Appl. Energy 2014, 113, 1461–1474. [Google Scholar] [CrossRef]
- Ermanoski, I.; Stechel, E.B. Thermally-driven adsorption/desorption cycle for oxygen pumping in thermochemical fuel production. Sol. Energy 2020, 198, 578–585. [Google Scholar] [CrossRef]
- Bray, J.M.; Schneider, W.F. Potential energy surfaces for oxygen adsorption, dissociation, and diffusion at the Pt(321) surface. Langmuir 2011, 27, 8177–8186. [Google Scholar] [CrossRef]
- Rochau, G.E.; Pasch, J.J.; Cannon, G.; Carlson, M.; Fleming, D.; Kruizenga, A.; Sharpe, R.; Wilson, M. Supercritical CO2 Brayton Cycles. 2014. Available online: https://www.osti.gov/servlets/purl/1221819 (accessed on 23 September 2020).
- Seo, Y.; Huh, C.; Lee, S.; Chang, D. Comparison of CO2 liquefaction pressures for ship-based carbon capture and storage (CCS) chain. Int. J. Greenh. Gas Control 2016, 52, 1–12. [Google Scholar] [CrossRef]
- Milcarek, R.J.; Garrett, M.J.; Ahn, J. Micro-tubular flame-assisted fuel cells. J. Fluid Sci. Technol. 2017, 12, JFST0021. [Google Scholar] [CrossRef] [Green Version]
- McBride, B.J.; Gordon, S.; McBride, B.J. Computer Program for Calculation of Complex Chemical Equilibrium Compositions and Applications. NASA Ref. Publ. 1311 1994, 184. Available online: https://web.stanford.edu/~cantwell/AA284A_Course_Material/AA284A_Resources/NASA_Glenn_Reports/McBride%20and%20Gordon,%20Computer%20Program%20for%20Calculation%20of%20Complex%20Chemical%20Equilibrium%20NASA%20RP%201311%201996%20Part%20II.pdf (accessed on 23 September 2020).
- Speight, J.G. Natural Gas; Elsevier: Amsterdam, The Netherlands, 2007; ISBN 9781933762142. [Google Scholar]
- Milcarek, R.J.; Wang, K.; Garrett, M.J.; Ahn, J. Performance Investigation of Dual Layer Yttria-Stabilized Zirconia–Samaria-Doped Ceria Electrolyte for Intermediate Temperature Solid Oxide Fuel Cells. J. Electrochem. Energy Convers. Storage 2016, 13, 011002. [Google Scholar] [CrossRef]
- Zeng, H.; Gong, S.; Shi, Y.; Wang, Y.; Cai, N. Micro-tubular solid oxide fuel cell stack operated with catalytically enhanced porous media fuel-rich combustor. Energy 2019, 179, 154–162. [Google Scholar] [CrossRef]
- Lemmon, E.W.; Bell, I.H.; Huber, M.L.; McLinden, M.O. NIST Standard Reference Database 23: Reference Fluid Thermodynamic and Transport Properties-REFPROP; Version 9.1; National Institute of Standards and Technology: Gaithersburg, MD, USA, 2013; Volume 135. [Google Scholar]
- Park, S.K.; Kim, T.S.; Sohn, J.L.; Lee, Y.D. An integrated power generation system combining solid oxide fuel cell and oxy-fuel combustion for high performance and CO2 capture. Appl. Energy 2011, 88, 1187–1196. [Google Scholar] [CrossRef]
Figure 1.
Schematic of a standard sCO2 Brayton cycle with recuperation and recompression showing the various state points in the system.
Figure 1.
Schematic of a standard sCO2 Brayton cycle with recuperation and recompression showing the various state points in the system.
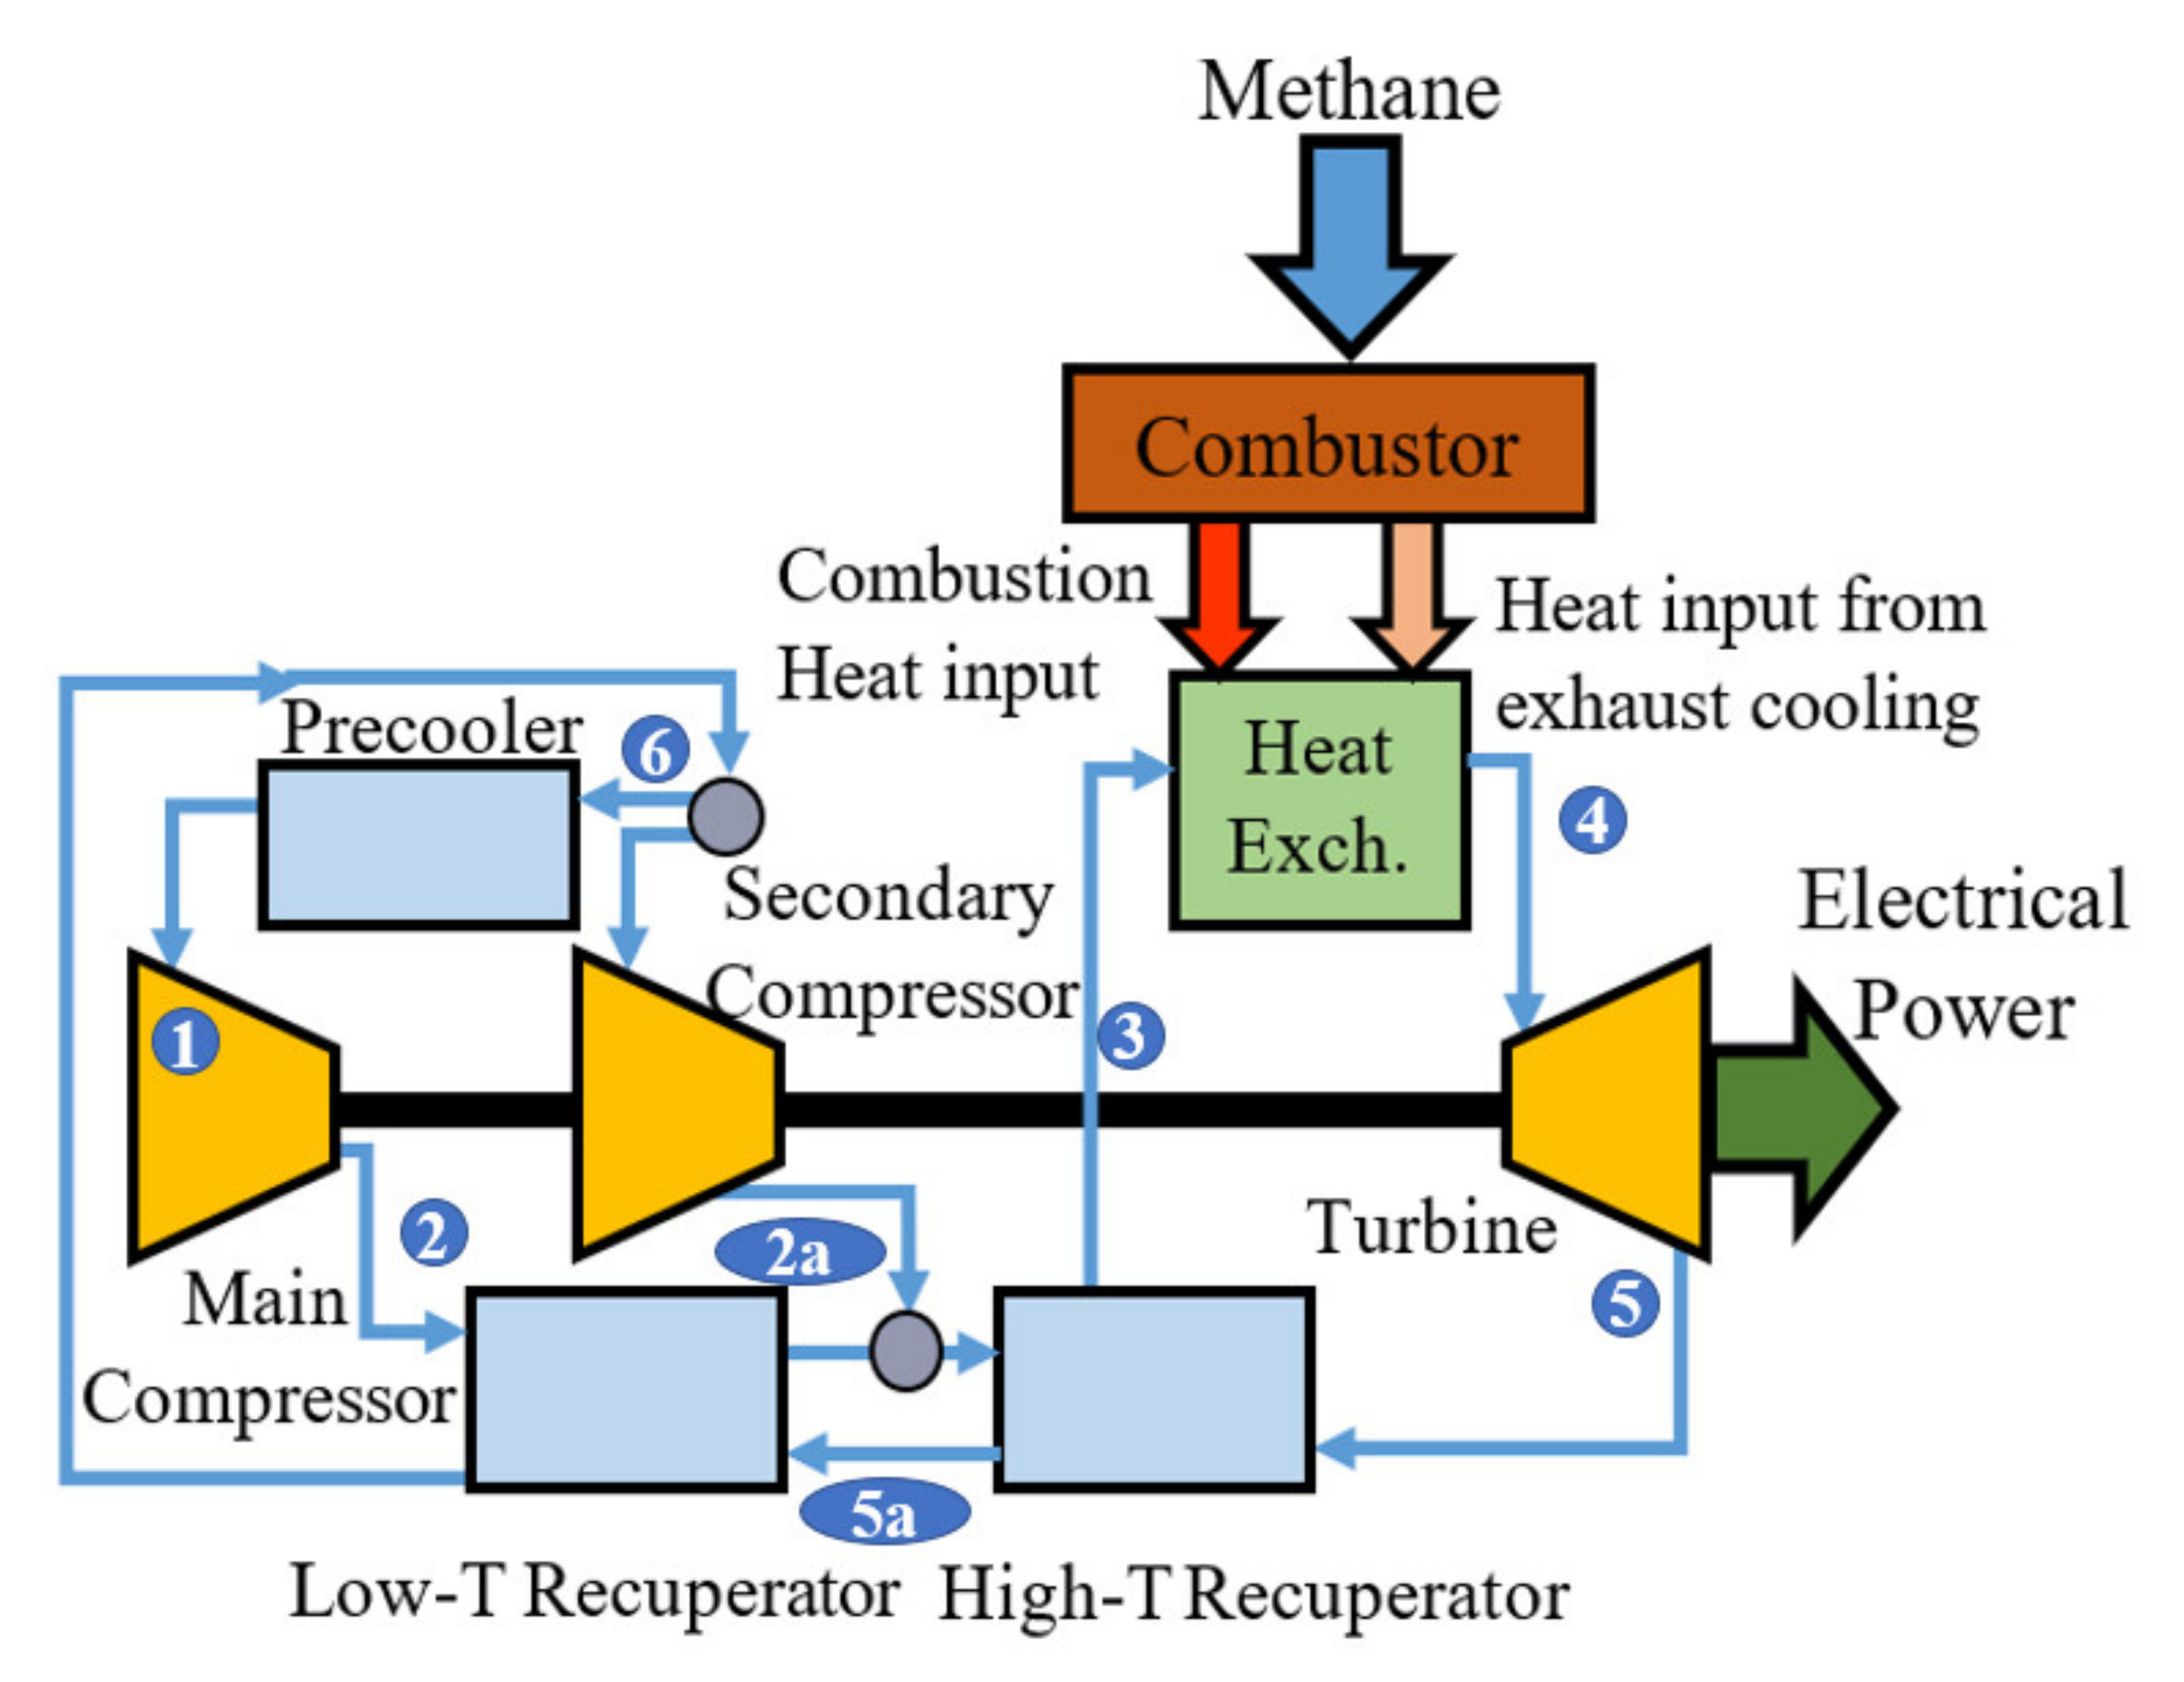
Figure 2.
Schematic of a flame-assisted fuel cell (FFC).

Figure 3.
Schematic of the proposed FFC integrated sCO2 turbine hybrid.

Figure 4.
Schematic of the experimental setup with gases mixture used for model exhaust.
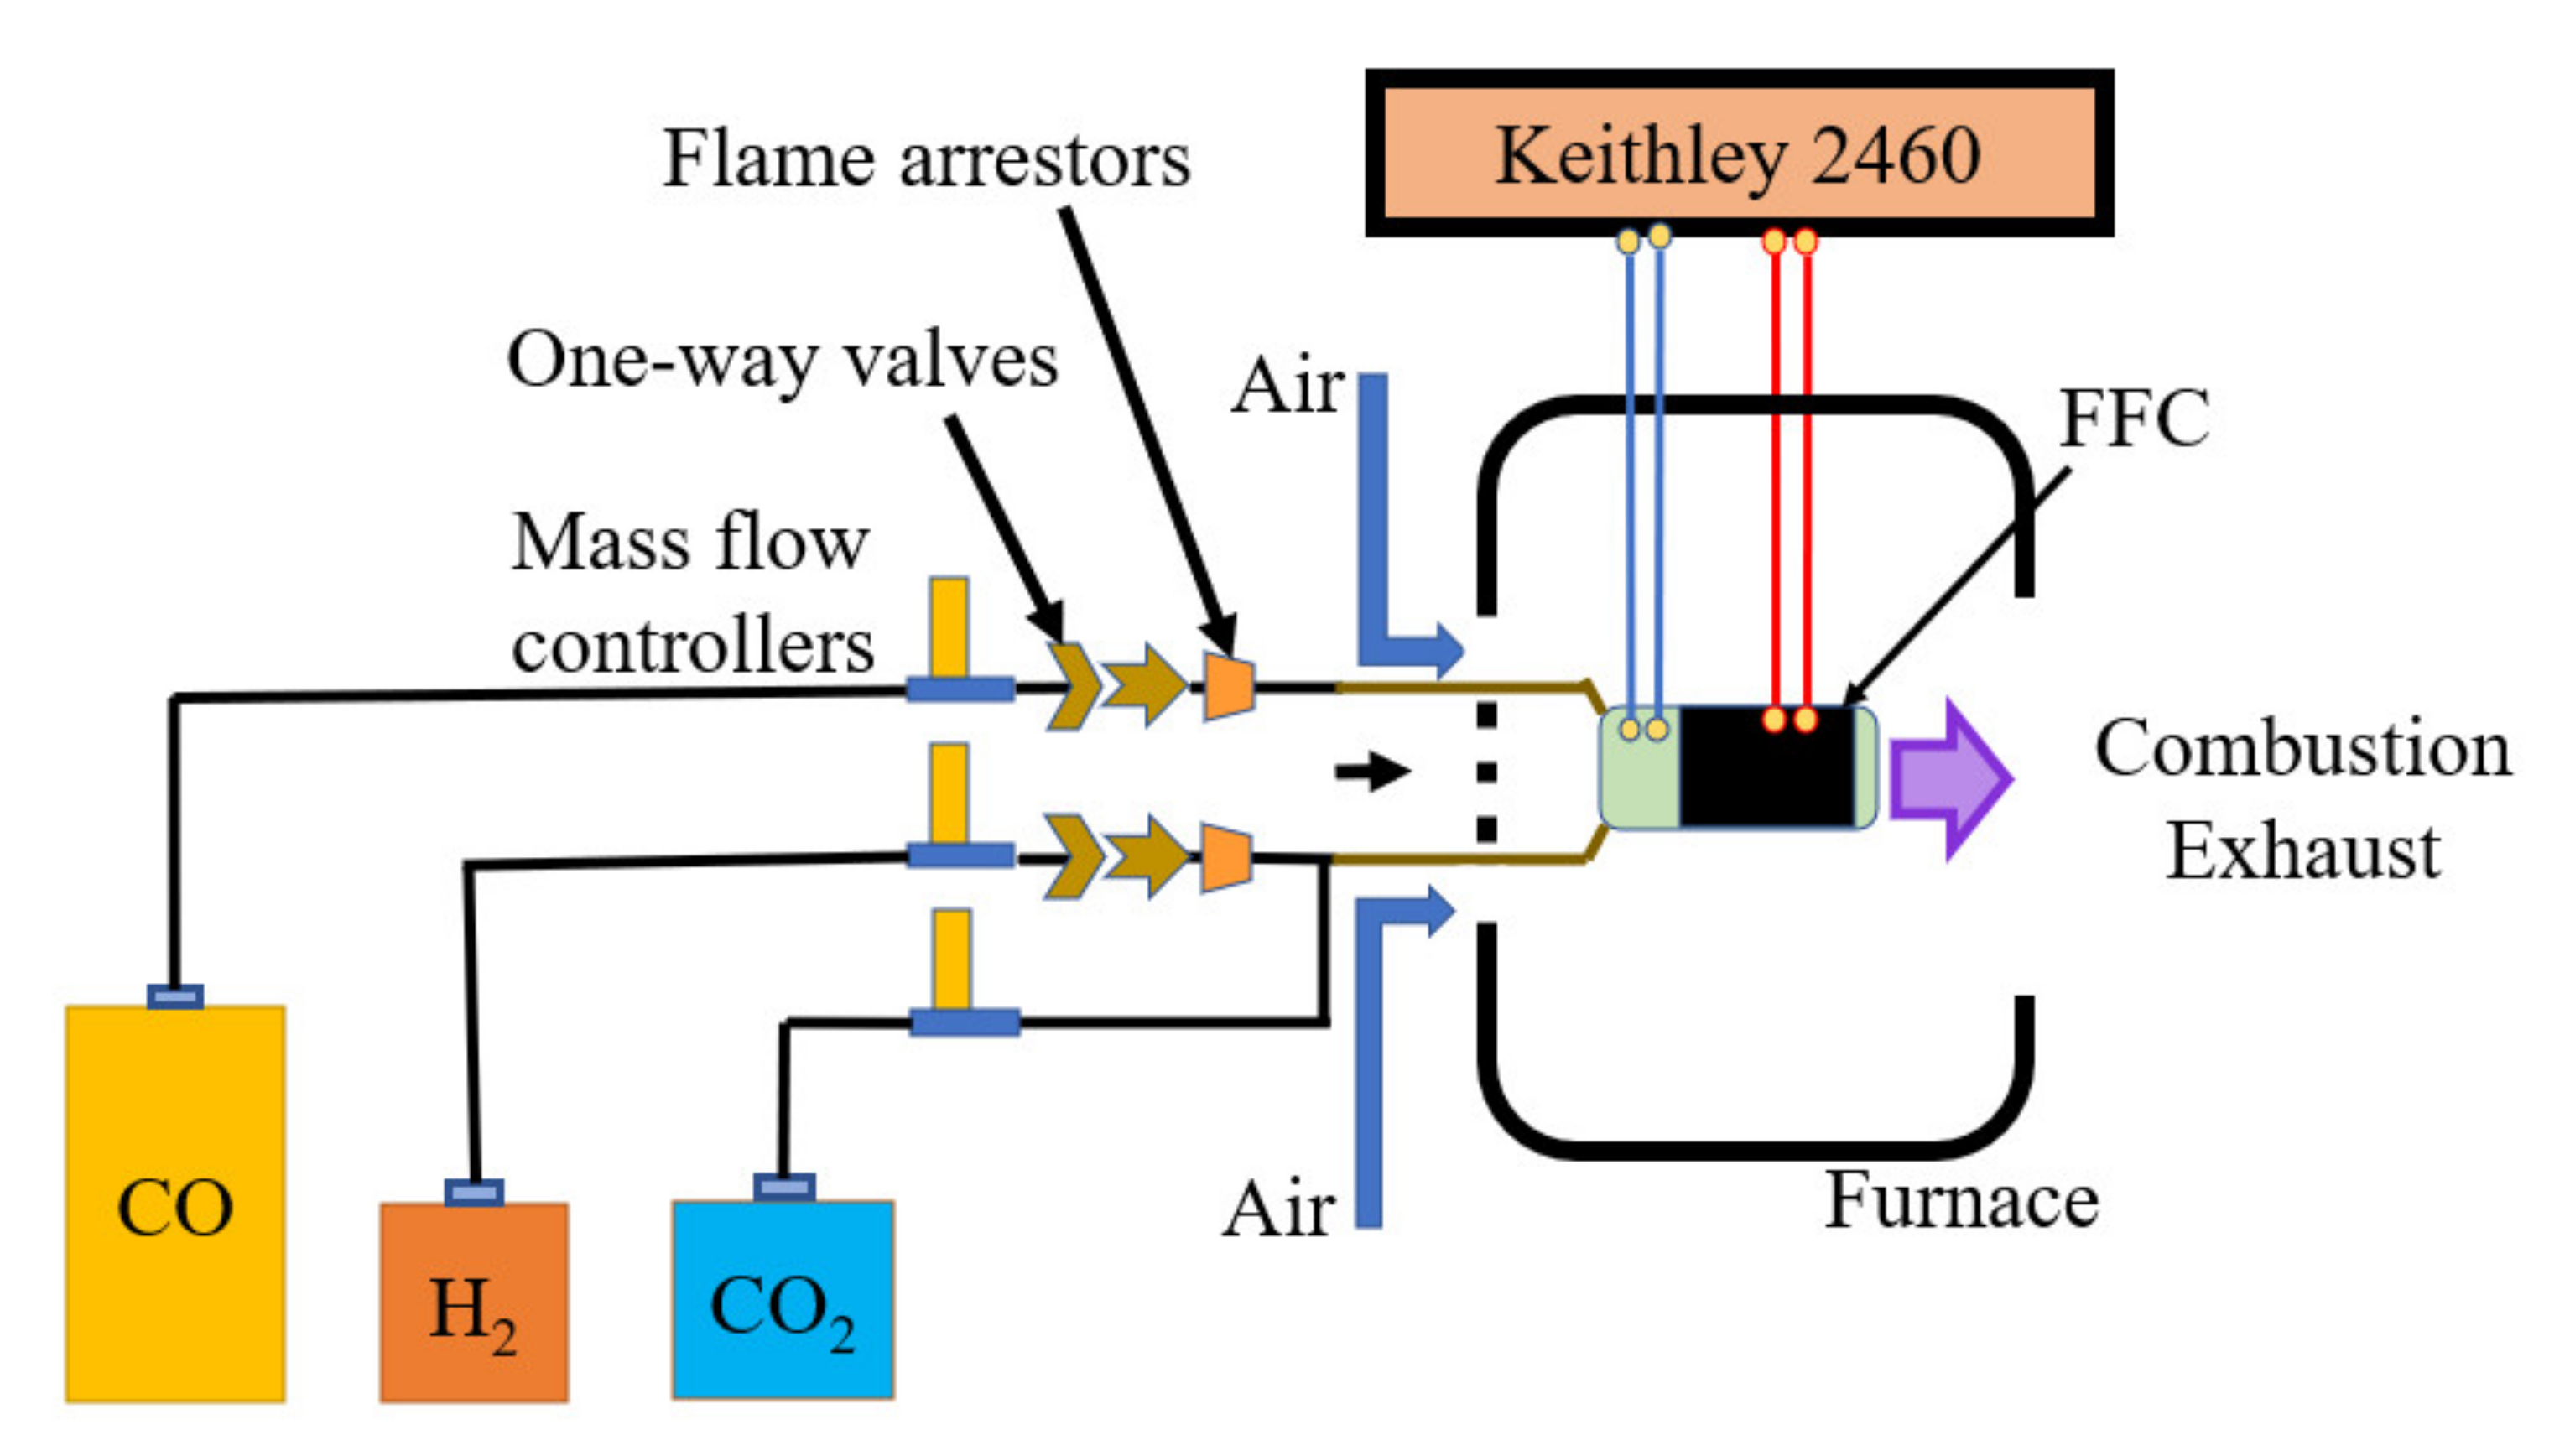
Figure 5.
Modeling results for the FFC operating voltages and power density at 1073 K using a model fuel-rich exhaust composition between 1.2 and 2.8.
Figure 5.
Modeling results for the FFC operating voltages and power density at 1073 K using a model fuel-rich exhaust composition between 1.2 and 2.8.

Figure 6.
Comparison of analytically calculated reversible voltage and experimentally obtained open circuit voltage.
Figure 6.
Comparison of analytically calculated reversible voltage and experimentally obtained open circuit voltage.

Figure 7.
Flow rates of methane required to produce the required amount of heat for sCO2 cycle with air and oxygen oxidizers for different Φ.
Figure 7.
Flow rates of methane required to produce the required amount of heat for sCO2 cycle with air and oxygen oxidizers for different Φ.
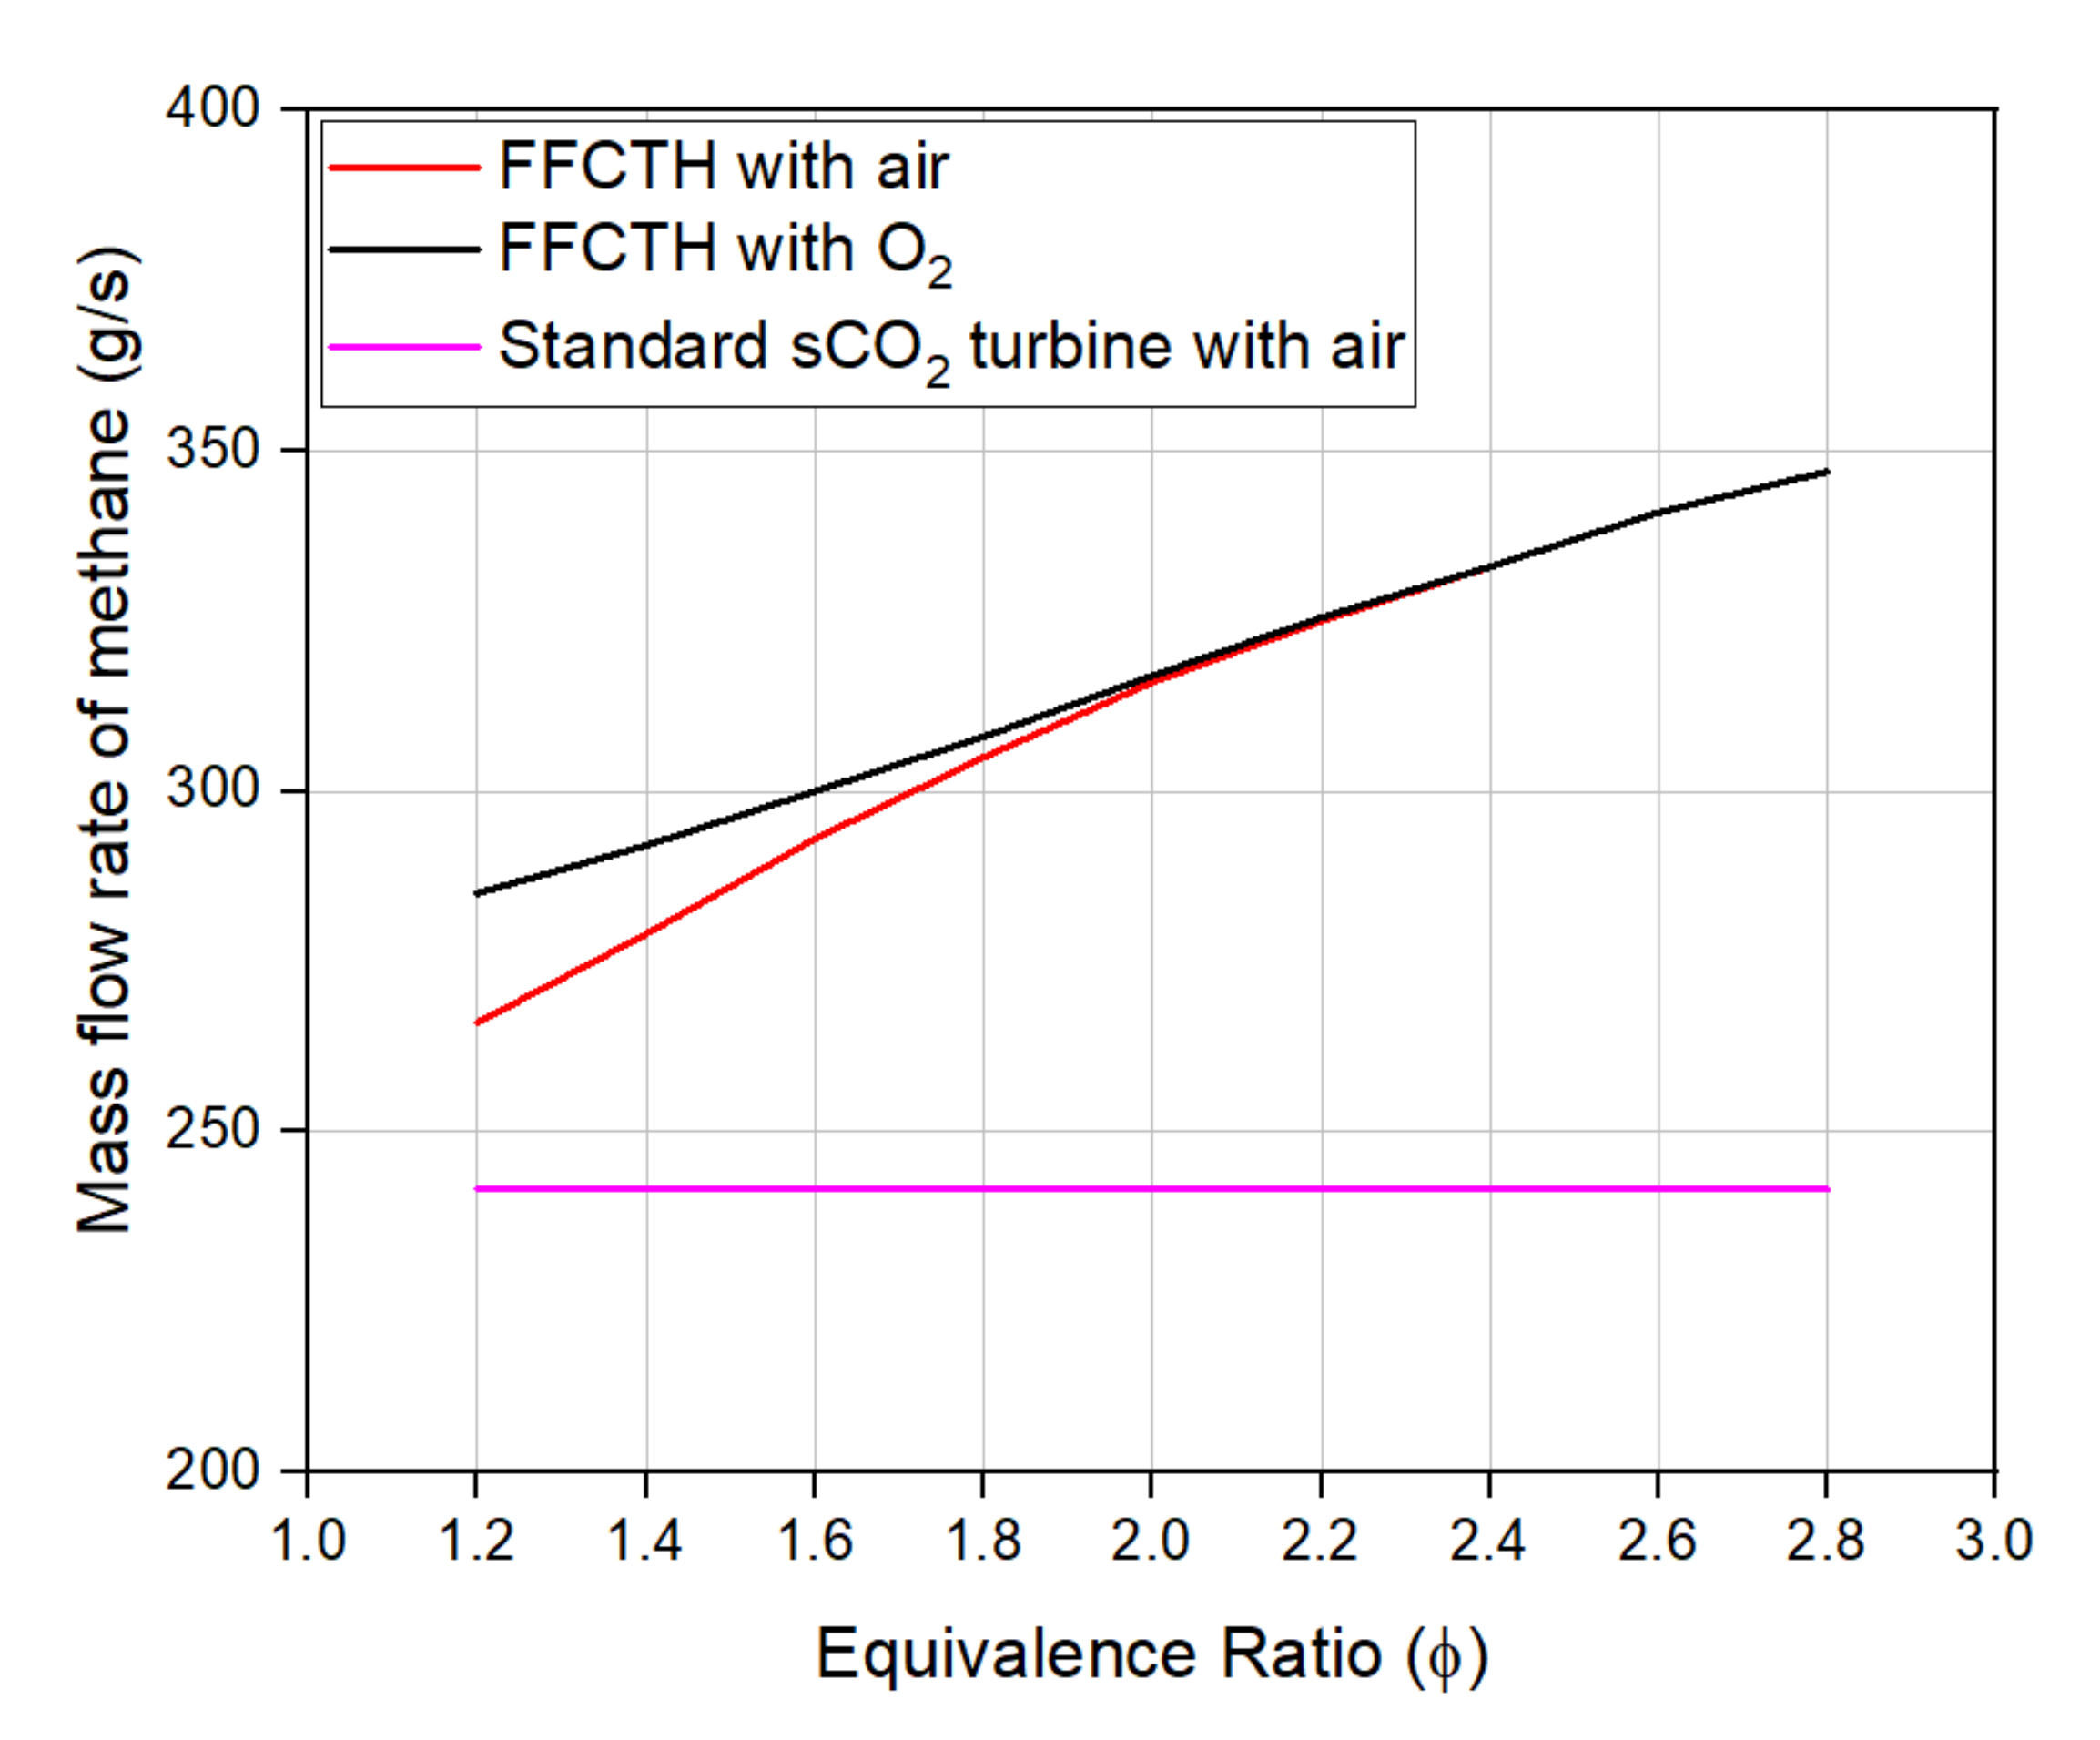
Figure 8.
Syngas concentration in the fuel-rich combustion exhaust for methane combustion in air (without nitrogen and scaled to 1) compared to methane combustion in oxygen against increasing Φ.
Figure 8.
Syngas concentration in the fuel-rich combustion exhaust for methane combustion in air (without nitrogen and scaled to 1) compared to methane combustion in oxygen against increasing Φ.

Figure 9.
Comparison of the power generated by the sCO2 turbine with and without FFC integrated and with and without being CO2 sequestration-ready.
Figure 9.
Comparison of the power generated by the sCO2 turbine with and without FFC integrated and with and without being CO2 sequestration-ready.

Figure 10.
Comparison of the electrical efficiencies of the sCO2 system with and without the FFC integrated and with and without CO2 sequestration with varying Φ with experimental FFC parameters (ηfu = 0.7 and ηfc = 0.5).
Figure 10.
Comparison of the electrical efficiencies of the sCO2 system with and without the FFC integrated and with and without CO2 sequestration with varying Φ with experimental FFC parameters (ηfu = 0.7 and ηfc = 0.5).

Figure 11.
P/H ratios of the system with and without the FFC integrated with and without being CO2 sequestration-ready at various Φ.
Figure 11.
P/H ratios of the system with and without the FFC integrated with and without being CO2 sequestration-ready at various Φ.

Table 1.
NASA CEA exhaust composition of methane and air for different Φ.
| Φ | CO (mL·min−1) | H2 (mL·min−1) | CO2 (mL·min−1) | H2O (mL·min−1) | N2 (mL·min−1) |
|---|---|---|---|---|---|
| 1.20 | 0.05 | 0.03 | 0.05 | 0.18 | 0.66 |
| 1.40 | 0.08 | 0.06 | 0.04 | 0.17 | 0.63 |
| 1.60 | 0.10 | 0.09 | 0.03 | 0.16 | 0.60 |
| 1.80 | 0.12 | 0.13 | 0.02 | 0.15 | 0.57 |
| 2.00 | 0.13 | 0.17 | 0.02 | 0.13 | 0.55 |
| 2.20 | 0.14 | 0.20 | 0.02 | 0.11 | 0.53 |
| 2.40 | 0.15 | 0.23 | 0.01 | 0.09 | 0.51 |
| 2.60 | 0.16 | 0.26 | 0.01 | 0.08 | 0.49 |
| 2.80 | 0.17 | 0.29 | 0.01 | 0.06 | 0.47 |
Table 2.
NASA CEA exhaust composition of methane and oxygen for different Φ.
| Φ | CO (mL·min−1) | H2 (mL·min−1) | CO2 (mL·min−1) | Total (mL·min−1) |
|---|---|---|---|---|
| 1.20 | 0.2672 | 0.1560 | 0.0848 | 0.4715 |
| 1.40 | 0.2855 | 0.2000 | 0.0695 | 0.4333 |
| 1.60 | 0.2981 | 0.2503 | 0.0555 | 0.3899 |
| 1.80 | 0.3061 | 0.3053 | 0.0435 | 0.3418 |
| 2.00 | 0.3110 | 0.3614 | 0.0341 | 0.2921 |
| 2.20 | 0.3141 | 0.4142 | 0.0272 | 0.2444 |
| 2.40 | 0.3163 | 0.4612 | 0.0222 | 0.2010 |
| 2.60 | 0.3182 | 0.5020 | 0.0185 | 0.1625 |
| 2.80 | 0.3201 | 0.5369 | 0.0158 | 0.1289 |
Table 3.
Flow rates of gases used in the experiment at different Φ.
| Φ | CO (mL·min−1) | H2 (mL·min−1) | CO2 (mL·min−1) | Total (mL·min−1) |
|---|---|---|---|---|
| 1.20 | 3.33 | 1.94 | 7.18 | 12.45 |
| 1.40 | 3.81 | 2.68 | 6.87 | 13.36 |
| 1.60 | 4.22 | 3.55 | 6.40 | 14.17 |
| 1.80 | 4.55 | 4.55 | 5.78 | 14.88 |
| 2.00 | 4.82 | 5.59 | 5.06 | 15.47 |
| 2.20 | 5.00 | 6.61 | 4.33 | 15.94 |
| 2.40 | 5.15 | 7.51 | 3.63 | 16.29 |
| 2.60 | 5.25 | 8.28 | 2.96 | 16.49 |
| 2.80 | 5.32 | 8.93 | 2.38 | 16.63 |
Table 4.
Temperatures and pressures of the state points in the sCO2 cycle.
| State Point | Temperature (K) | Pressure (MPa) |
|---|---|---|
| 1 | 300 | 7.5 |
| 2 | 318 | 20 |
| 2a | 414 | 20 |
| 3 | 733 | 20 |
| 4 | 913 | 20 |
| 5 | 780 | 7.5 |
| 5a | 452 | 7.5 |
| 6 | 331 | 7.5 |
Table 5.
Summary of the fixed parameters used in the analysis.
| Property | Value |
|---|---|
| Power generated by standard supercritical CO2 turbine cycle | 6 MW |
| Efficiency of the standard supercritical CO2 turbine cycle (based on states 1–6) | 53.14% |
| Compression ratio | 2.66 |
Table 6.
NASA CEA fuel-rich exhaust compositions for methane in air scaled to 1 without nitrogen.
| Φ | CO | H2 | CO2 | H2O |
|---|---|---|---|---|
| 1.20 | 0.17 | 0.09 | 0.17 | 0.57 |
| 1.40 | 0.23 | 0.16 | 0.11 | 0.50 |
| 1.60 | 0.26 | 0.24 | 0.08 | 0.42 |
| 1.80 | 0.28 | 0.31 | 0.06 | 0.35 |
| 2.00 | 0.29 | 0.38 | 0.04 | 0.29 |
| 2.20 | 0.30 | 0.43 | 0.03 | 0.24 |
| 2.40 | 0.31 | 0.47 | 0.03 | 0.19 |
| 2.60 | 0.31 | 0.51 | 0.02 | 0.16 |
| 2.80 | 0.31 | 0.54 | 0.02 | 0.12 |
Table 7.
Comparison of electrical efficiency changes due to addition of carbon sequestration into the system in previous cases and current case.
Table 7.
Comparison of electrical efficiency changes due to addition of carbon sequestration into the system in previous cases and current case.
| Type of Power Generation Technique | Base Case Electrical Efficiency | Electrical Efficiency with CO2 Sequestration | Reference |
|---|---|---|---|
| Gas turbine | 53.67 | 46.75 | [36] |
| Gas turbine | 43.88 | 35.26 | [37] |
| Gas turbine +SOFC | Maximum of 69.5 | Maximum of 65.7 | [48] |
| sCO2 turbine | 53.14 | 51.7 | This work |
| sCO2 turbine + FFC | Maximum of 60 | Maximum of 59.3 | This work |
© 2020 by the authors. Licensee MDPI, Basel, Switzerland. This article is an open access article distributed under the terms and conditions of the Creative Commons Attribution (CC BY) license (http://creativecommons.org/licenses/by/4.0/).
Share and Cite
MDPI and ACS Style
Ghotkar, R.; Stechel, E.B.; Ermanoski, I.; Milcarek, R.J. Hybrid Fuel Cell—Supercritical CO2 Brayton Cycle for CO2 Sequestration-Ready Combined Heat and Power. Energies 2020, 13, 5043. https://doi.org/10.3390/en13195043
AMA Style
Ghotkar R, Stechel EB, Ermanoski I, Milcarek RJ. Hybrid Fuel Cell—Supercritical CO2 Brayton Cycle for CO2 Sequestration-Ready Combined Heat and Power. Energies. 2020; 13(19):5043. https://doi.org/10.3390/en13195043
Chicago/Turabian StyleGhotkar, Rhushikesh, Ellen B. Stechel, Ivan Ermanoski, and Ryan J. Milcarek. 2020. "Hybrid Fuel Cell—Supercritical CO2 Brayton Cycle for CO2 Sequestration-Ready Combined Heat and Power" Energies 13, no. 19: 5043. https://doi.org/10.3390/en13195043
Note that from the first issue of 2016, this journal uses article numbers instead of page numbers. See further details here.