Article

A Novel State of Charge Estimating Scheme Based on an Air-Gap Fiber Interferometer Sensor for the Vanadium Redox Flow Battery

Department of Electrical Engineering, CEECS, National United University, Miaoli 36063, Taiwan
Energies 2020, 13(2), 291; https://doi.org/10.3390/en13020291
Submission received: 11 November 2019 / Revised: 28 November 2019 / Accepted: 3 January 2020 / Published: 7 January 2020
(This article belongs to the Special Issue Electrochemical Energy Conversion and Storage Technologies 2019)

Abstract

:
Real-time and remote monitoring of the state of charge (SOC) of a vanadium redox flow battery (VRFB) is technically desirable for achieving advanced compensation functions of VRFB systems. This paper, for the first time, proposes a novel SOC monitoring scheme based on an air-gap fiber Fabry–Perot interferometer (AGFFPI) sensor for the VRFB. The proposed sensing concept is based on real-time sensing of the refractive index (RI) of the positive electrolyte, which is found closely correlated to the VRFB’s SOC. The proposed SOC estimating scheme using fiber sensor has a number of merits, e.g., being precise, having lightweight, having strong acid resistance, and being easy to incorporate the state-of-the-art fiber communication technology for remote monitoring. It is found that the RI of the positive electrolyte solution exhibits distinct and linear variations in accordance with changes of the VRFB’s SOC value. Using the linear relationship between the electrolyte’s RI and SOC, a real-time SOC monitoring mechanism can be readily realized by the proposed AGFFPI. In this paper, existing SOC detecting methods for VRFB are firstly reviewed. The details concerning the proposed detecting method are then addressed. Typical experimental results are presented to verify the feasibility and effectiveness of the proposed SOC estimating scheme.

1. Introduction

In recent years, energy storage systems (ESSs) have been widely used in renewable energy-based generations (REG), distributed hybrid power supply systems, potable power systems for military applications, electric vehicles (EV), and uninterrupted power supply systems (UPS) [1]. Currently used large-capacity ESSs for REG applications include flywheels, compressed air, lithium-ion batteries, lead-acid batteries, sodium-sulfur batteries, and vanadium redox flow batteries (VRFBs) [2,3]. Among the abovementioned batteries, VRFB is an extremely attractive candidate for constructing medium- to large-capacity ESSs. It has some unique advantages, e.g., high power, large capacity, high efficiency, low maintenance cost, fast response, long life, high safety, and environmental friendliness [4,5,6]. These advantages make it a much-desired device for a variety of applications. In practical applications, it is necessary to obtain real-time state-of-charge (SOC) information to make the VRFB properly perform designed energy control functions. However, the real-time estimation of the VRFB’s SOC is not easy because of its intrinsic nonlinearities. In open literature, a huge number of papers regarding VRFB’s SOC estimation methods can be found. Based on the estimation mechanism used, the proposed methods can be categorized into six types, i.e., electrolyte property-related methods, electric potential-related methods, spectroscopy-related methods, mathematical modeling methods, coulomb counting methods, and potentiometric titration methods.
Theoretically, the VRFB’s SOC can be estimated according to electrolyte properties during charging and discharging. A four-pole cell device was used to estimate the number of free ions in VRFB electrolyte in [7]. Half-cell conductivities of the electrolytes were measured in [8,9]. Note that VRFB electrolyte conductivity is highly dependent on temperature, and errors can happen because of side reactions. It was also observed that ultrasonic waves propagate through the electrolytes with distinctly different velocities according to different vanadium ion compositions [10,11]. Open-circuit voltage (OCV) measurement was used to estimate VRFB’s SOC in [12]. Half-cell voltages was separately monitored in [8] for achieving the capacity imbalance detection. A VRFB unit cell was tested in [13] using a divided OC potentiometric cell with Hg/Hg2SO4 reference electrodes and graphite working electrodes. Spectroscopic methods were used to estimate VRFB’s SOC through examining the absorption or transmission spectra of the electrolytes, for the colors change according to the oxidation states of the vanadium species [9,12,14,15,16]. However, it was pointed out that this type of methods is only convenient for the negative half-cell but not the positive half-cell because of the high absorbance over most of the UV–vis range. Moreover, this type of method requires additional equipment, making it more complex and costly. A new spectroscopic online detection method was developed in [17] based on intensity-corrected correlation coefficient (ICCC) algorithm, yielding better performance than conventional Beer–Lambert spectrophotometry method. The SOCs of both half-cells could be monitored online and simultaneously. Furthermore, the level of electrolyte imbalance could also be monitored. Mathematical modeling is also very commonly used for SOC estimation through carefully deriving models describing battery characteristics [13,18,19,20,21,22,23]. Other conventional methods include coulomb counting [24] and potentiometric titration [25]. Coulomb counting is a simple method that can be used during VRFB normal operations, but it only yields a rough estimation and can easily generate error because it does not consider possible losses and side reactions. On the other hand, potentiometric titration is precise but requires the electrolytes to be extracted and diluted before performing estimating tasks, which is time-consuming and makes it difficult to use in many practical application cases. To have an overall picture about the existing SOC detecting methods for VRFB, the above-reviewed methods are categorized in Figure 1. In this paper, a novel SOC detecting method based on the measurement of the RI of the positive electrolyte of VRFB via fiber sensors is proposed for the first time and can be categorized into the first category as shown in Figure 1.
Based on the discussions presented in the open literature, real-time and remote monitoring of the state of charge (SOC) of a vanadium redox flow battery (VRFB) is technically desirable not only for achieving advanced compensation functions, but also for maximizing the flexibility in optimal energy management of VRFB systems. To achieve the above objectives, an innovative SOC sensing scheme for the VRFB based on AGFFPI is proposed in this paper. The theoretical analysis and system design for sensing the RI of various liquids using fiber interferometer (FI) can be found in [26,27]. The proposed AGFFPI based SOC sensing device is able to estimate the SOC through precisely sensing the RI values of the VRFB’s positive electrolyte. This is found and demonstrated for the first time in this paper. It is also important to note that the proposed estimating scheme using fiber-based sensing device has a number of merits in practical applications, e.g., being precise, having lightweight, having strong acid resistance, and being easy to incorporate the state-of-the-art internet of things (IoT) and fiber communication technologies for achieving remote monitoring. To build some technical background, following this introduction section, the working principle of VRFB and concepts of the proposed SOC detecting method are addressed in Section 2. Section 3 explains the fabrication and characteristics of the sensing device as well as the arrangement of experimental setup and testing procedures. Experimental scenarios and typical test results are described in the Section 4. Finally, a conclusion is drawn in the Section 5.

2. Working Principle of VRFB and the Proposed SOC Detecting Method

2.1. Working Principle of VRFB

A VRFB system consists of three main components, including a cell stack, two electrolyte storage tanks, and two pump systems. The positive electrolyte (V4+ /V5+) and negative electrolyte (V2+ /V3+) are stored in separate tanks. In the reactor unit (the cell stack), the two flowing electrolytes are separated by membranes, allowing only the selected ions to traverse and form a current path. A conceptual VRFB’s system configuration is shown in Figure 2a. The operation of VRFB utilizes a reversible electrochemical reaction to store the electric energy in vanadium ions of different valences. The principle of charging operation is to convert electrical energy into chemical energy via electrochemical reaction and the chemical energy can be converted back into electrical energy when needed.

2.2. Proposed SOC Detecting Method

In normal operation of a VRFB, when charging, the positive electrode undergoes an oxidation reaction, and the negative electrode undergoes a reduction reaction. In other words, V+4 converts into V+5 in the positive electrolyte, and V+3 converts into V+2 in the negative electrolyte. The reverse reaction occurs during discharge; that is, the negative electrode is oxidized, and the positive electrode is reduced, as shown in Equations (1)–(3). During the reactions, H+ ions form the electric current for charging and discharging. To have a clear picture of the above description, Figure 2b shows the details regarding charging and discharging operations of a single-cell VRFB.
VO 2 + + 2 H + + e VO 2 + + H 2 O ,
V 2 + V 3 + + e ,
V 2 + + V O 2 + + 2 H + V O 2 + + V 3 + + H 2 O .
As can be seen in Figure 2b, in a conventional VRFB, the positive electrolyte is composed of the V4+/V5+ couple, and the negative electrolyte is composed of the V3+/V2+ couple; both positive and negative electrolytes are typically dissolved in sulfuric acid. In theory, the SOC of a VRFB can be mathematically expressed by the molar ratio of the determining electro-active ion remaining in the positive or negative electrolyte solution. Thus, for a VRFB with identical quantities of electrochemically available vanadium ions, the SOC can be expressed as follows.
SOC % = V 5 + V 4 + + V 5 + 100 % = V 2 + V 2 + + V 3 + 100 % .
Based on the chemical reaction expressed in Equations (1)–(3), during charging, V3+ is reduced to V2+ in the negative half-cell. The electrons needed for the reduction come from the oxidation of V4+ to V5+ in the positive half-cell via the DC power and the electrical wire, forming a current loop or, equivalently an electronic loop. During discharging of the VRFB, the revers reactions occur. V2+ is oxidized to V3+ in the negative half-cell, providing the electrons for the need in reduction of V5+ to V4+ in the positive half-cell. Based on the above observation and Equation (4), it can be firmly realized that in the charging process, the percentage of V5+ of the positive electrolyte is increasing, resulting in an increase in VRFB’s SOC. Since the RI in the wavelength region (1500–1600 nm) used in this study is mostly dependent on density of the solution and on the near infrared absorption, both absorption and densities will govern the RI in this wavelength region; however, the absorption part is mostly dependent of the absorption of water and hydronium ions of the acid. The absorption of the vanadium species has relatively minor contribution to the absorption in the measured wavelength region and will therefore not contribute to the changes in the refractive index. In an ideal VRFB’s charging operation, the water concentration and hydronium ion concentration of the positive electrolyte decrease linearly with respect to the increase in VRFB’s SOC and this also leads to the RI value of the positive electrolyte being linearly decreased as well. With the above theoretical deduction, it is clear that the variations of VRFB’s SOC can be estimated by monitoring the corresponding variations in RI value of the positive or negative electrolyte. To achieve a precise measurement of variations in electrolyte’s RI, an air-gap fiber Fabry–Perot interferometer (AGFFPI) sensor is proposed in this paper. To have a reliable test condition, the positive electrolyte, that has relatively stable characteristics when exposed to the air, is chosen for the experiments carried out in this paper.

3. Fabrication of the Sensing Device and Experimental Setup

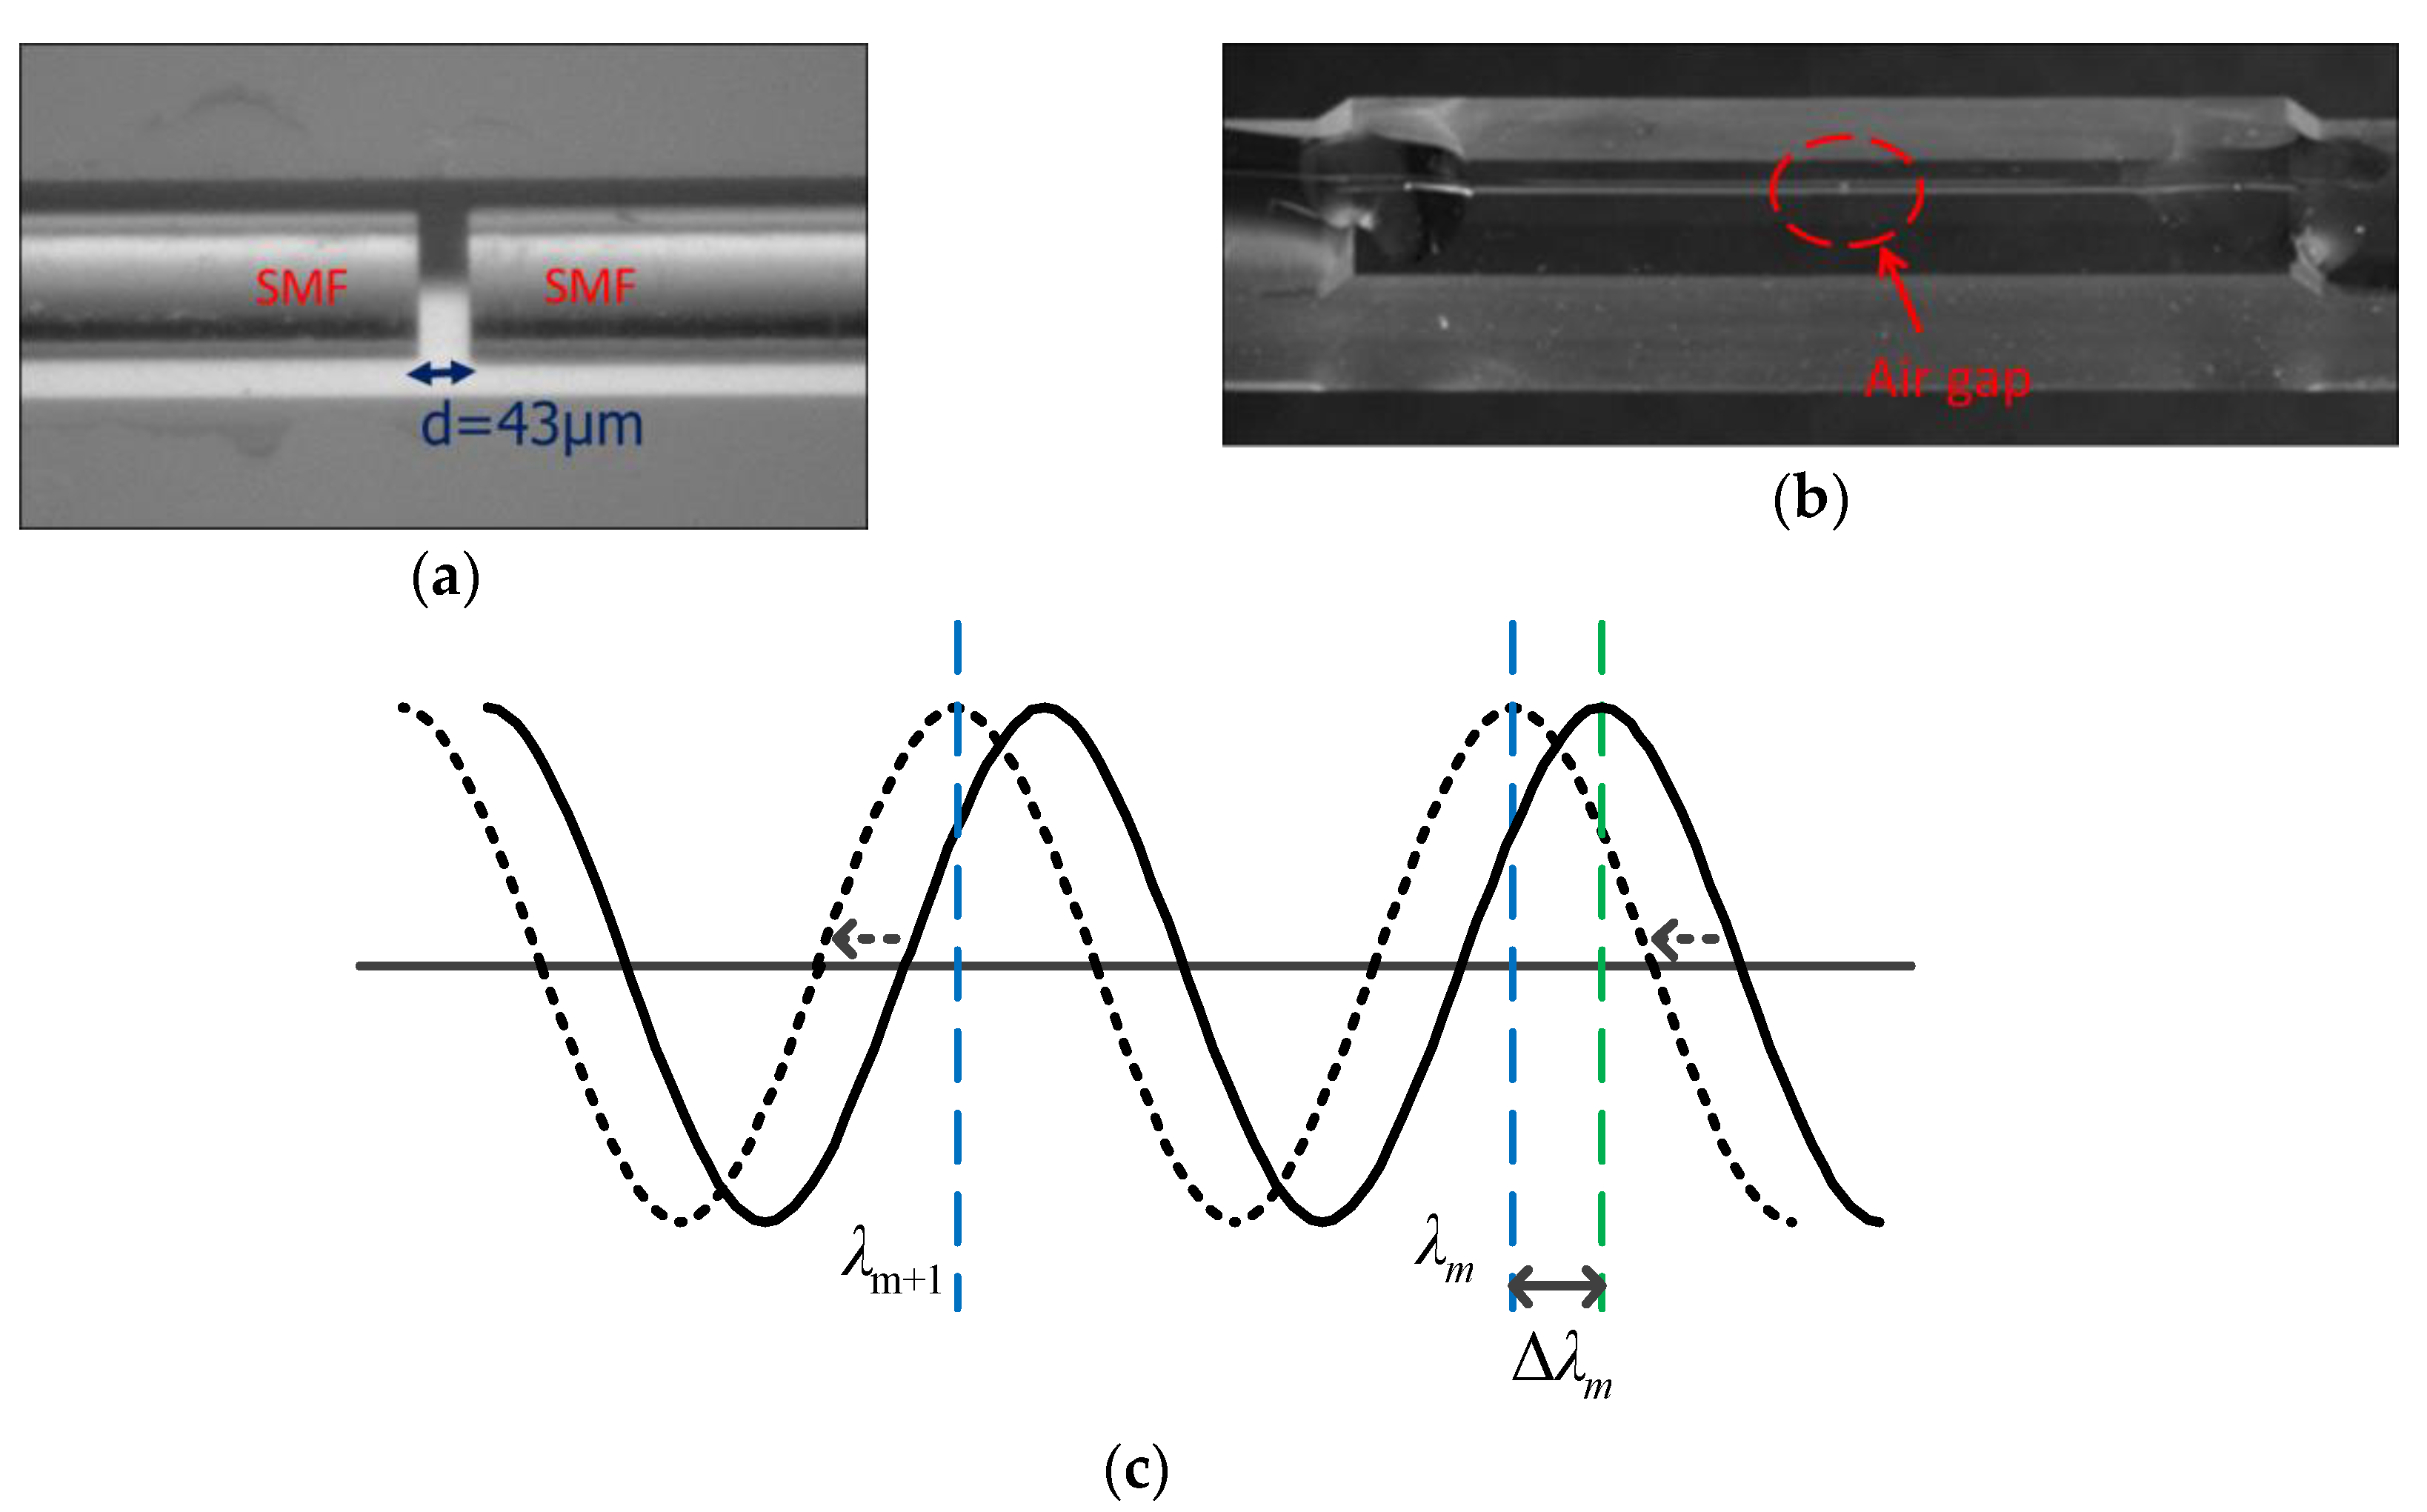
3.1. Fabrication and Characteristics of the Sensing Device

The proposed fiber sensor for sensing electrolyte’s RI consists of two single-mode fibers (SMFs, Corning SMF-28) with well-cleaved end faces and a designed air gap with a length of d = 43 μm, as shown in Figure 3a, aligned precisely on a V-groove holder (Figure 3b). An AGFFPI is formed using this configuration, where reflections can only occur at the two low-reflectivity fiber/air interfaces [28].
To derive the interference characteristics of the designed AGFFPI, the two-beam optical interference theorem is adopted in this study [24]. When the Fresnel reflectivity of the interfaces is low, the behavior of the cavity (the gap in AGFFIP) can be approximated using a two-beam interferometric model. Since an intensity-based interferometer is used in this measuring application, the intensities of the two reflected beams, defined as the Fresnel reflections I1 and I2 at the two fiber/air interfaces, respectively, determine the visibilities of the interference fringes, and the equivalent intensities of the two beams determine the best interference performance and maximum fringe visibility. The optical phase difference between the two beams is defined as Φ = (2π/λm)⋅(OPD), where OPD represents the optical path difference and is defined as 2nd, where n represents the reflective index (RI) of the electrolyte that fills the gap when measuring. Based on Figure 3c, if Φ = 2mπ, where m is an integer, multiple local maximum fringes can be obtained, so the resulted reflection intensity can be expressed as follows:
I ( λ ) = I 1 + I 2 + 2 I 1 I 2 cos Φ .
As shown in Figure 3c, it is estimated that the m-th interference fringe spacing, defined as free spectral range (FSR), can be expressed as FSR≅ λm+1λm, where λm and λm+1 represent the central wavelengths of the two adjacent peaks. As can be seen in Figure 3c, the maximum Φmax = 2mπ, thus,
4 π n d λ m = 2 m π .
Since the gap-length, d, is fixed at 43 μm in this study, Equation (6) describing the optical phase difference (Φ), can be rewritten as:
2 n d λ m = m .
In this specific measuring case, when the measured n varies to n’, Equation (7) can be expressed as Equation (8).
2 n d λ m = m .
Using Equations (7) and (8), one can obtain the following relations:
n λ m = n λ m .
Since n = n + Δ n , and λ m = λ m + Δ λ m , the following result can be derived from Equation (9).
Δ n n = Δ λ m λ m .
Based on Equation (10), one can conclude that the variation in RI (Δn) is in proportion to the variation in interference spectrum wavelength (Δλm). This also constitutes the theoretical basis of applying the proposed AGFFPI sensing device in measuring the electrolyte’s RI (n in the above Equations (6)–(10)).

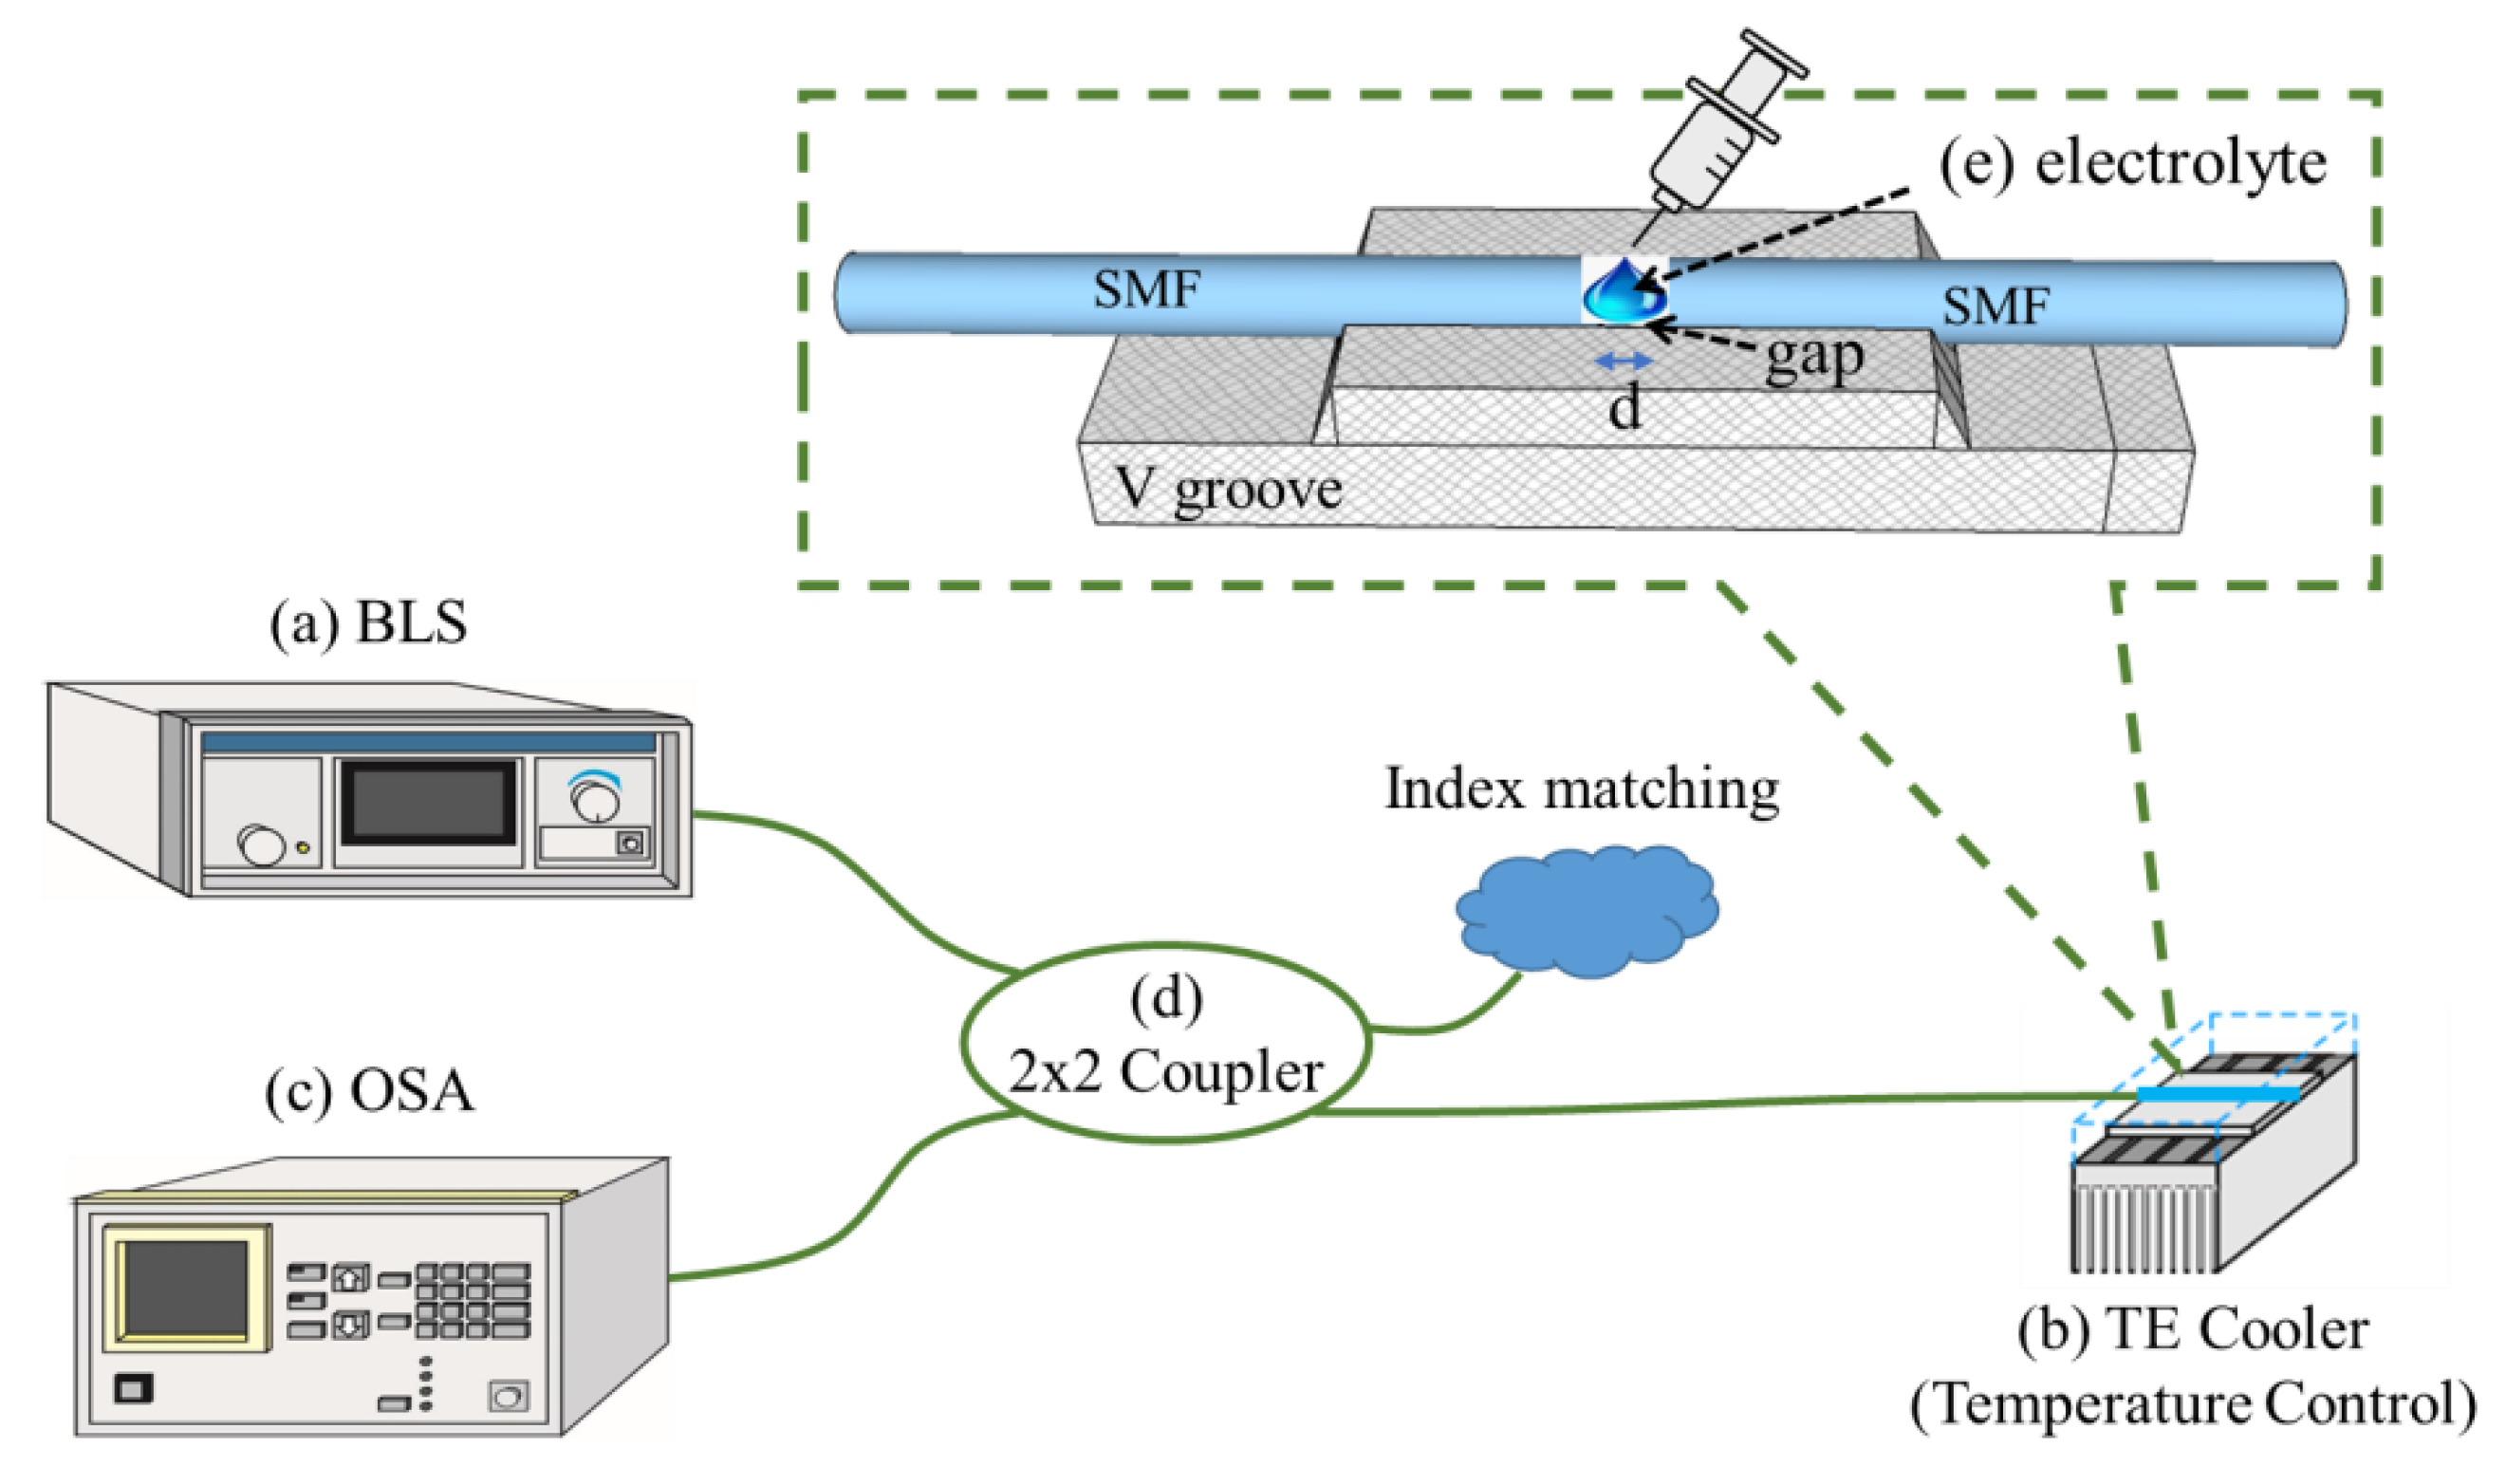
3.2. Experimental Setup

The experimental setup arranged for performing the tests is shown in Figure 4, including a broadband light source (BLS), an optical spectrum analyzer (OSA), a 2 × 2 optical coupler, and the fabricated fiber sensing device (AGFFPI) fixed on a V-groove holder in a thermoelectric (TE) module for controlling the electrolyte temperature. The experiment is performed as follows: The BLS sends a light signal (1250–1650 nm) that propagates through the optical coupler to excite the designed AGFFPI sensing device and two reflective signals are produced at the two fiber end faces in AGFFPI. Then, the reflected signals constitute an interference pattern propagating back through the optical coupler and into the OSA for spectrum recording and further analysis. Figure 5 shows the related electrolyte samples used in the experiments.

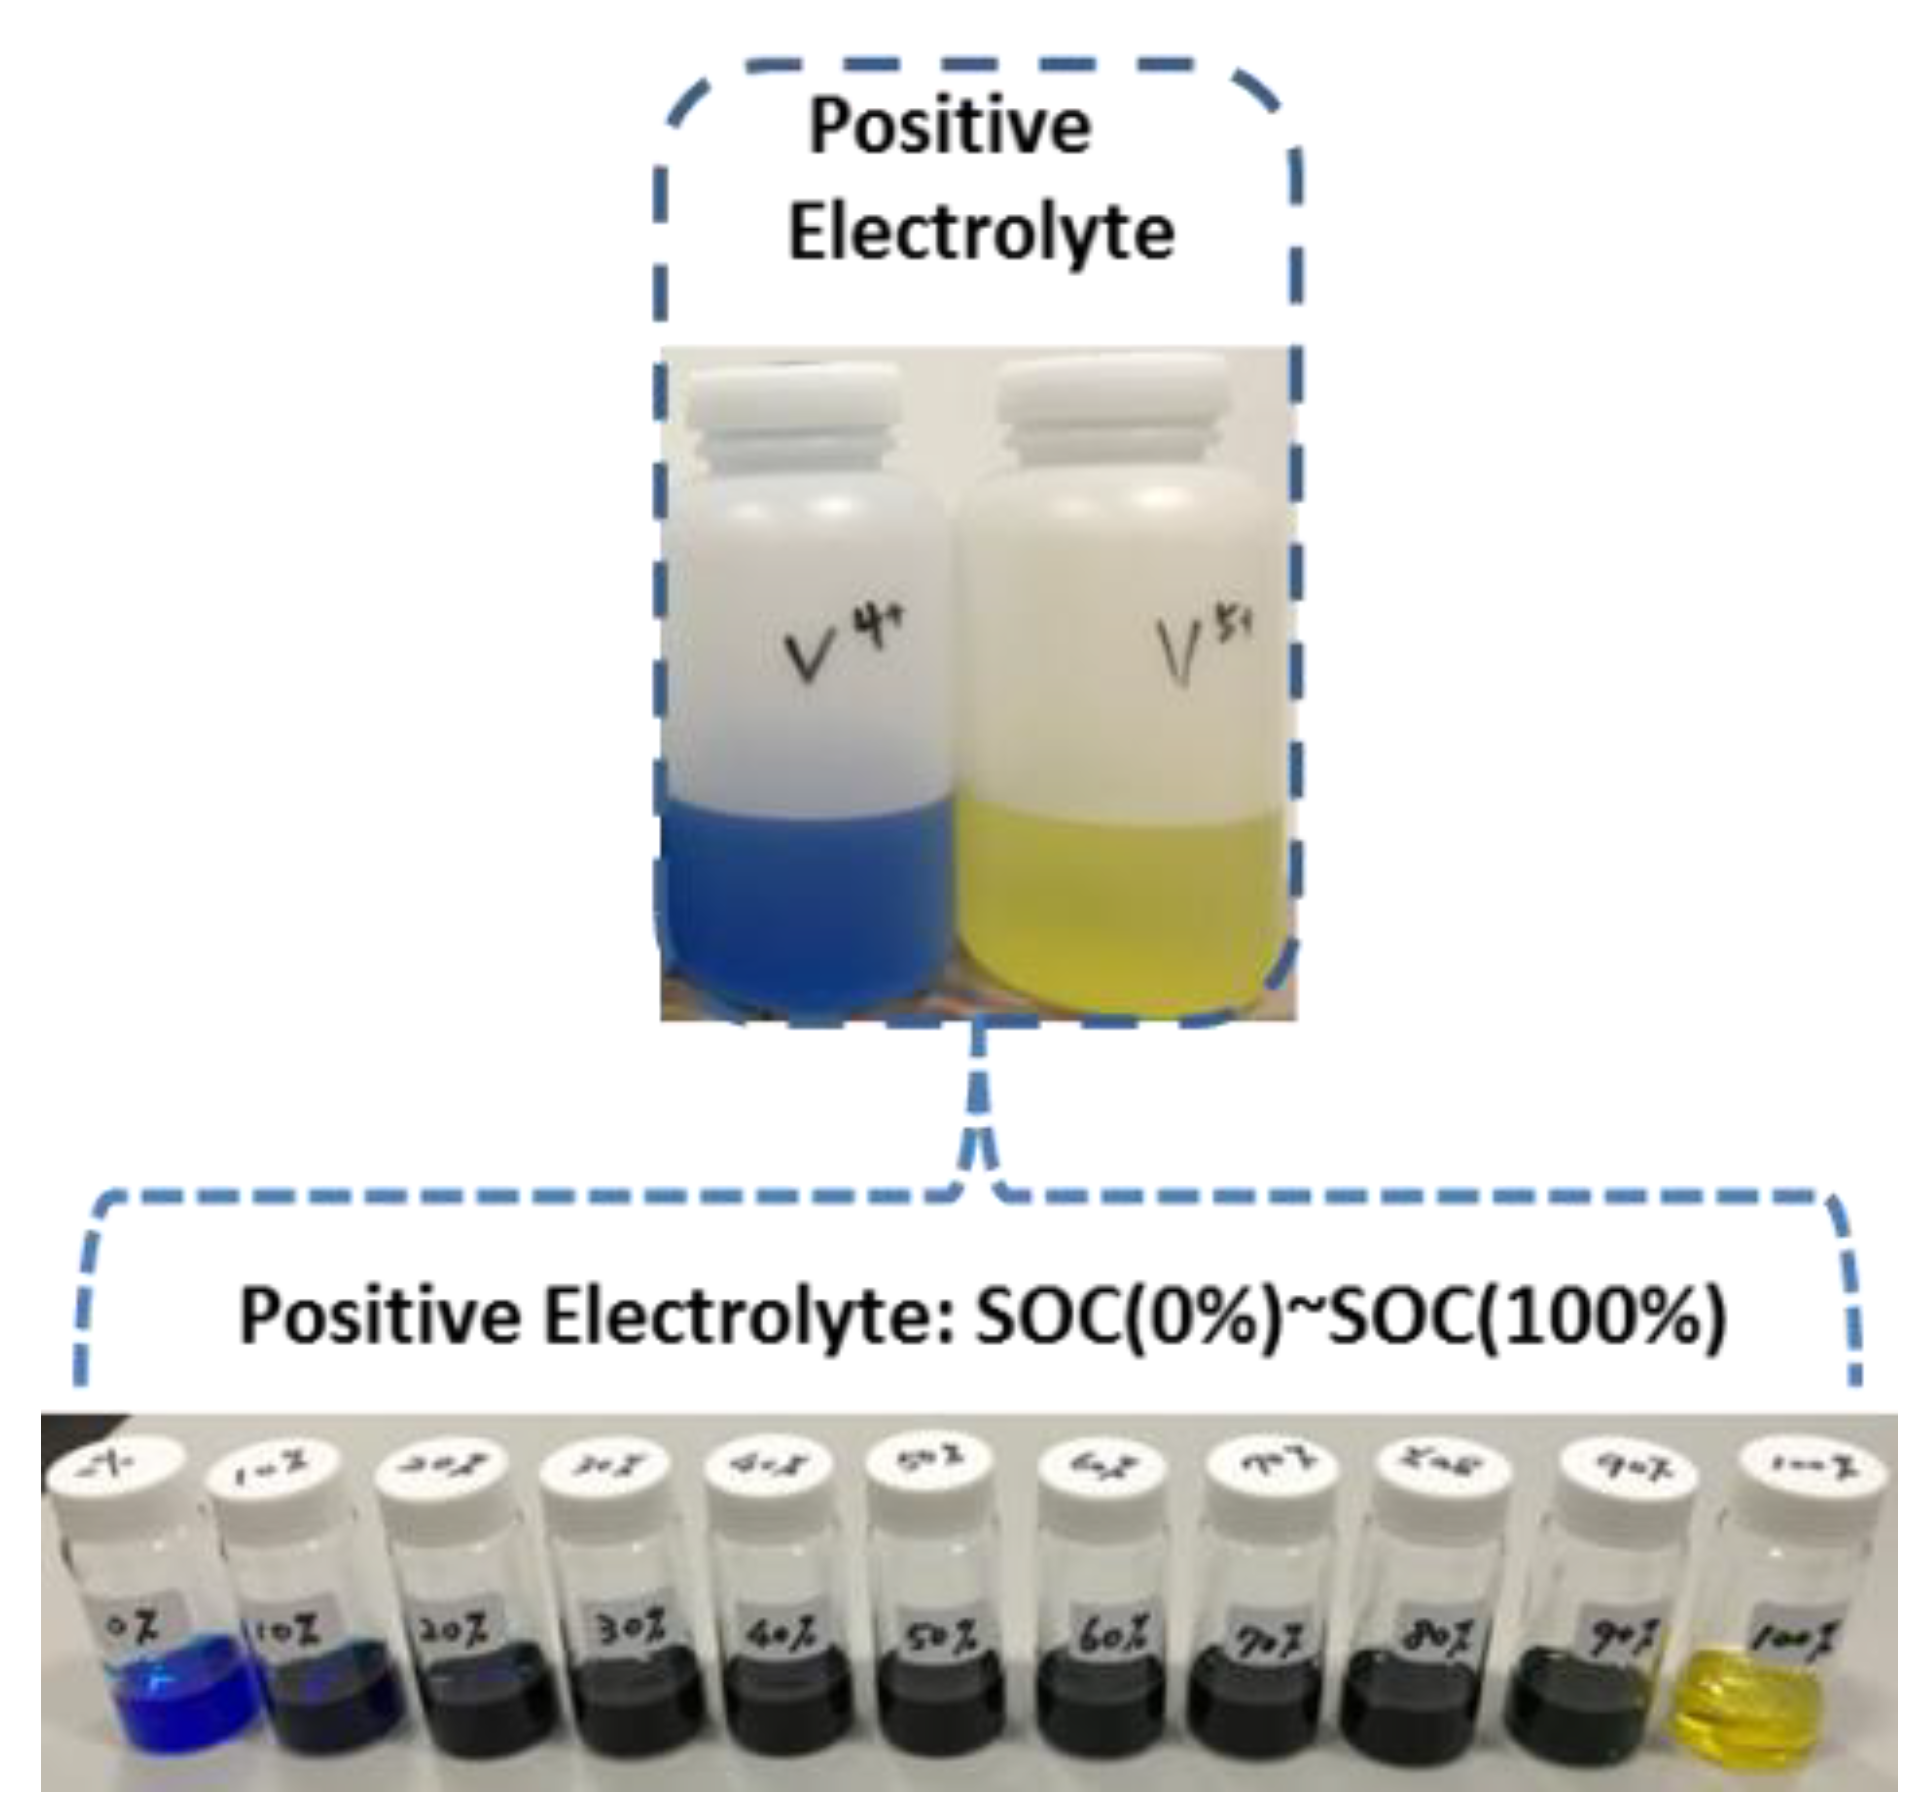
3.3. Preparation of Positive Electrolytes

To ensure the correctness of experimental results obtained in this study, 200 mL of electrolyte with 2.0 M V4+/4.0 M H2SO4 and 200 mL of electrolyte with 2.0 M V5+/4.0 M H2SO4, prepared for the positive electrolyte couple as shown in Figure 5, were directly purchased from a professional VRFB’s electrolyte supplier in Taiwan. The vanadium electrolytes undergo distinctive color changes during the VRFB’s charging and discharging operations. As can be seen in Figure 5, the colors corresponding to each oxidation state in the positive electrolyte are as expected, i.e., V4+ is blue and V5+ is yellow.
As a demonstrating example for the proposed VRFB’s SOC sensing approach based on AGFFPI, the positive electrode is designated as the storage capacity-limiting side, and the molar fraction of the V5+ ion in the positive electrolyte solution determines the SOC of the VRFB. It follows that a set of 20 mL positive electrolytes with 11 distinct SOC values (0%, 10%, 20%, 30%, 40%, 50%, 60%, 70%, 80%, 90%, and 100%) are precisely prepared according to Equation (4), as shown in Figure 5.

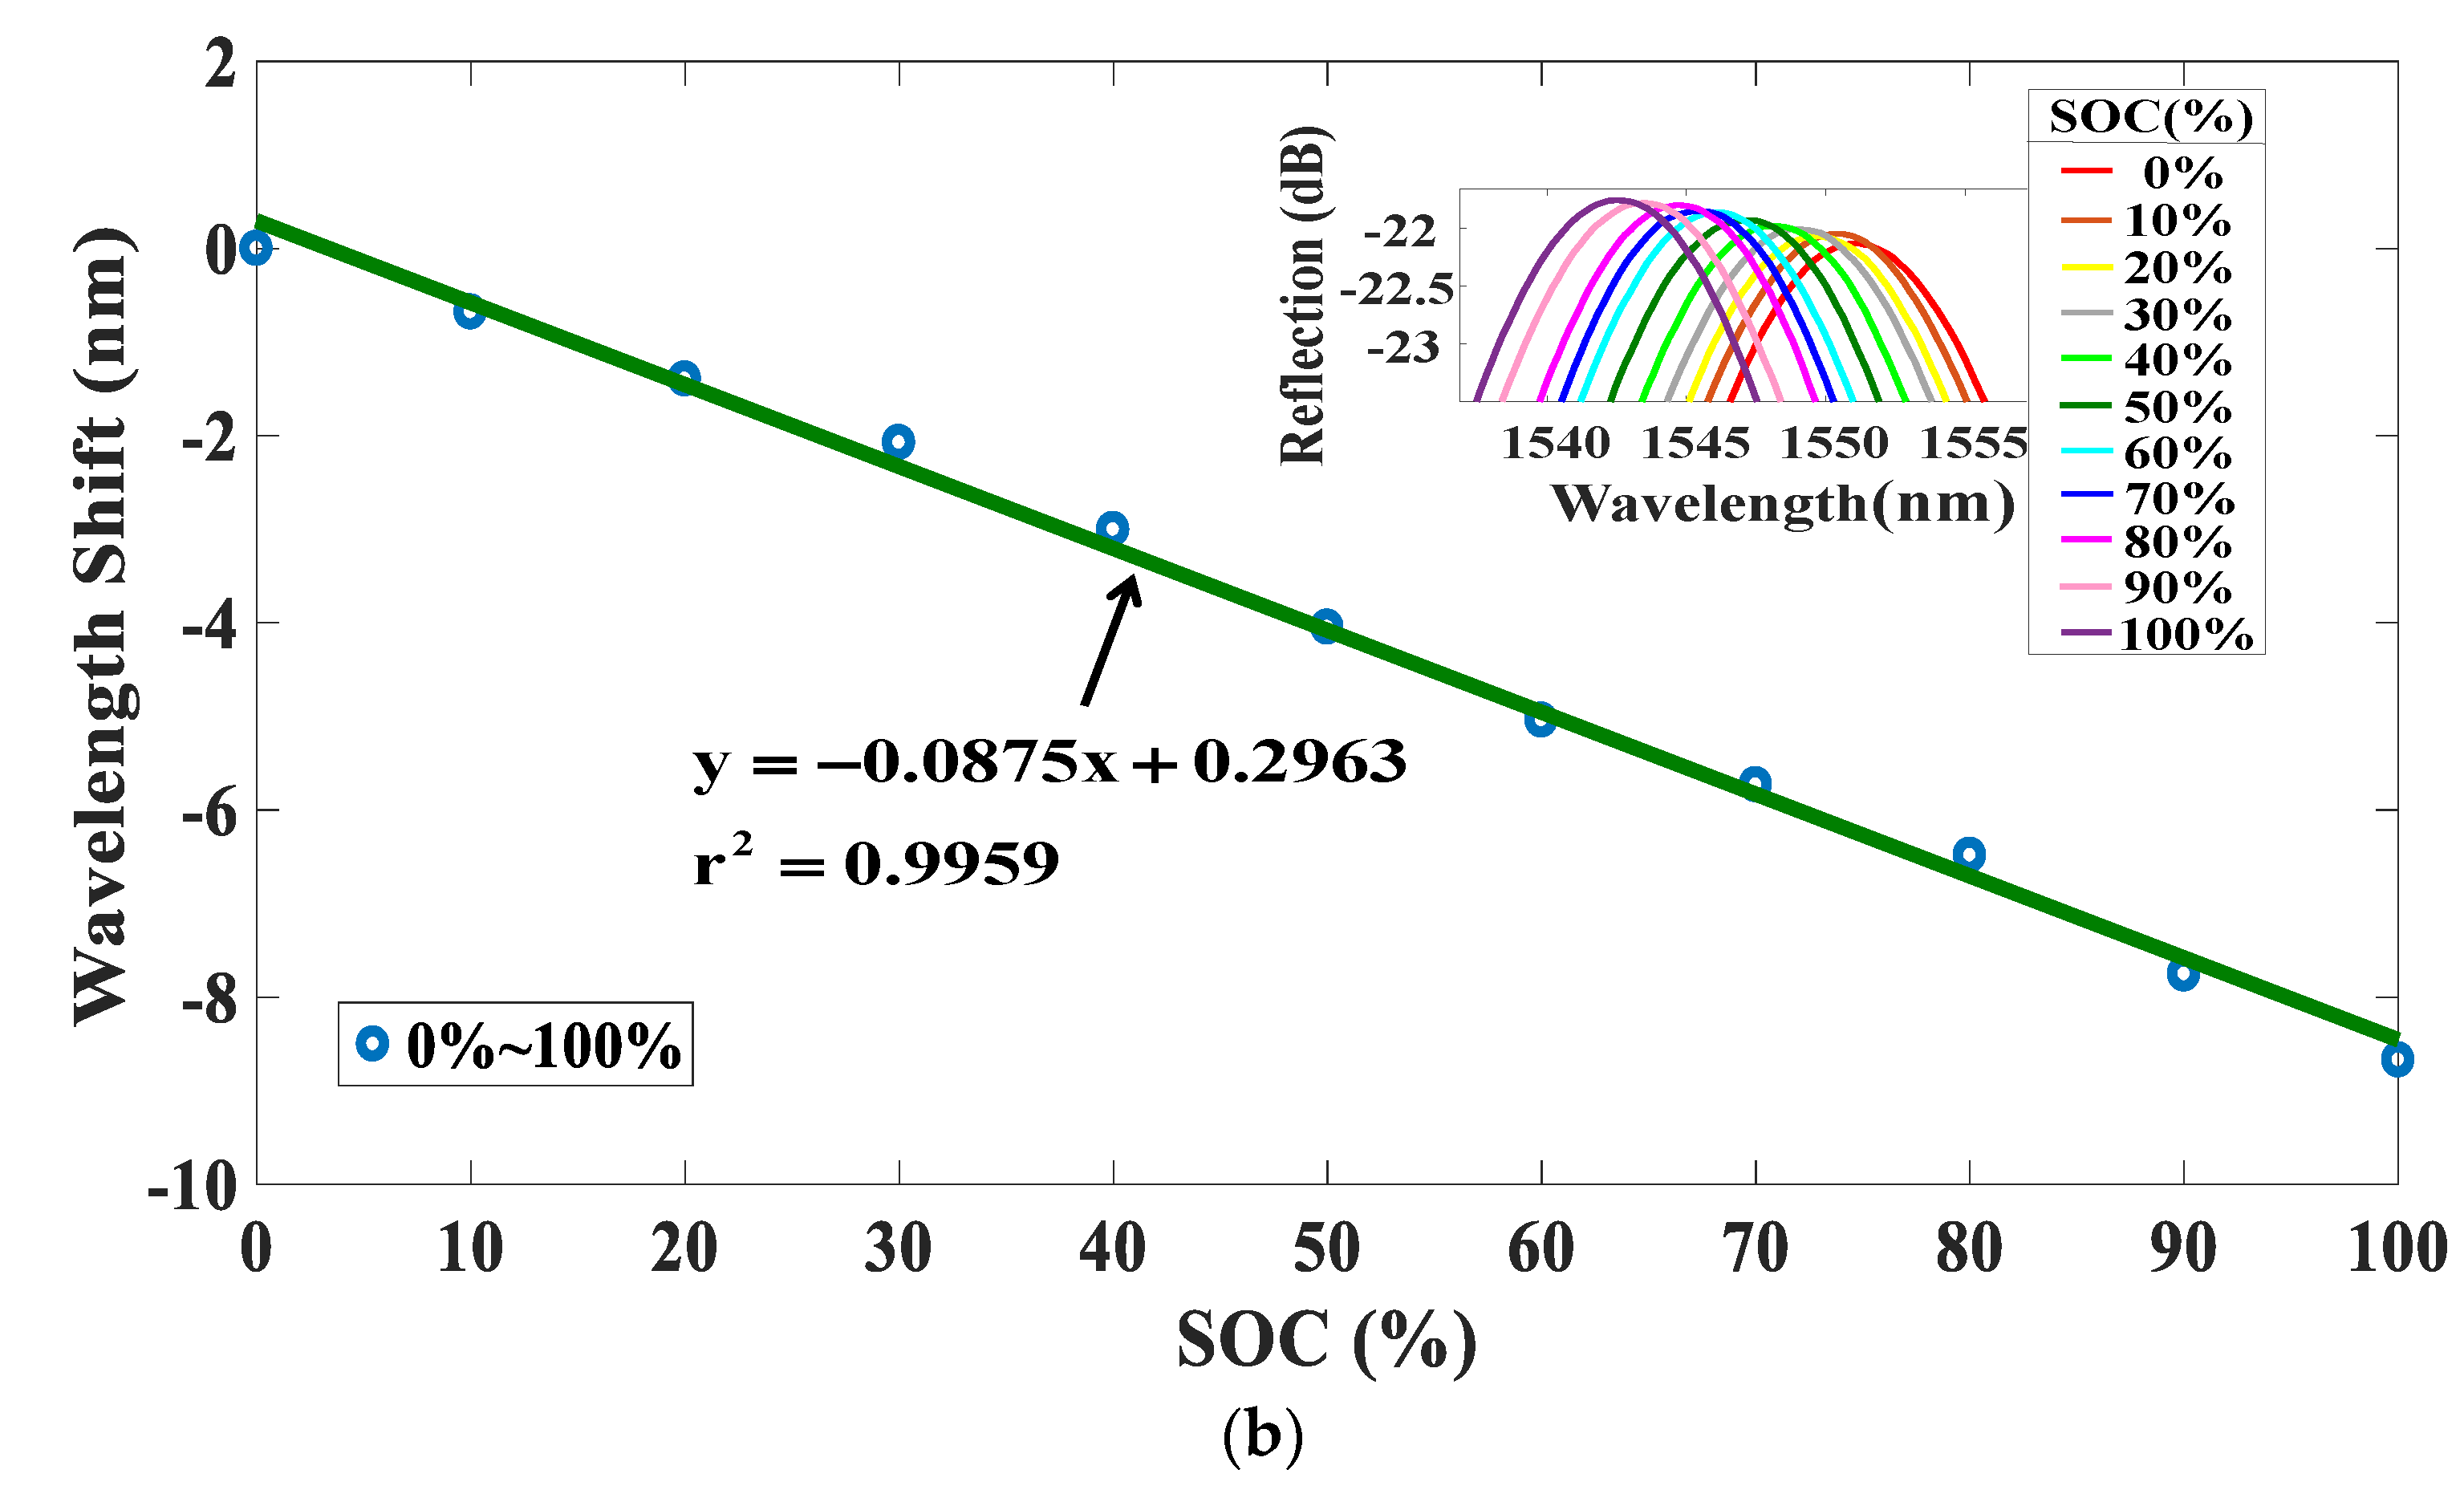
4. Experiments and Results

Before applying the fabricated sensing device to electrolyte RI measurement, the device is first tested with only air in the gap under 25 °C ambient temperature; the obtained interference spectrum as shown in Figure 6 is kept as a benchmark for checking the original interference spectrum status of the AGFFPI sensing device. Before testing a new electrolyte sample with distinct SOC, the air gap must be cleaned, and the interference spectrum is monitored and checked until the recorded identical interference spectrum (Figure 6) appears. This is to ensure the correctness of test results.
In this paper, the proposed SOC detecting method is verified with two sets of experiments. In the first set of experiment, how VRFB’s SOC affects the interference spectrum under constant electrolyte temperature of 25 °C is observed. Eleven testing points with distinct SOC statuses ranging 0–100% with an increment of 10% are chosen for measurement. Figure 7a shows a set of measured interference spectrum results, where it can be clearly seen that the interference spectrum shifts towards shorter wavelength as the SOC of the electrolyte increases. To obtain the relationship between the variation in SOC and the quantity of the corresponding spectrum shift, curve fitting is utilized as shown in Figure 7b. It can be seen that a linear relationship exists between the two parameters, SOC and spectrum shift. As a result, a simple first-order linear equation can be derived using curve fitting and used for SOC estimation in practice.
In the second set of experiment, the focus is on observing how the electrolyte temperature affects the interference spectrum shifts.
Based on the results obtained from the experiment, certain adjusting mechanism must be derived to ensure an accurate SOC detection under a given range of arbitrary electrolyte temperature. Three sets of interference spectrum data are measured in this set of tests: 0%, 50%, and 100% SOC, all under a temperature range of 25–45 °C, as shown in Figure 8a–c. It can be clearly seen from the co-plotting curves shown in Figure 8d that the electrolyte temperature also has a linear effect on the interference spectrum shifts under the three tested SOC conditions. It is also important to note that, from the obtained results, a similar sensitivity of the interference spectrum shifts on temperature is obtained in the temperature range of 25–45 °C. In this case, the changes of the interference spectrum shift or equivalently the RI with respect to the changes in the temperature of electrolyte is actually the property of an optical constant (OC) defined as thermo-optic coefficient (TOC). For most solutions, the RI decreases when the temperature of the solution increases. This is in conformity with the measured results presented in Figure 8d. An in-depth investigation on the TOC of different solutions can found in [29]. As a result, it is easy to model the possible effect of the electrolyte temperature on the measured spectrum shifts corresponding to different SOCs in practical applications.

5. Discussions

Based the experimental results obtained in this study, both the changes in the VRFB’s SOC and the temperature, T, of the electrolyte cause a phase shift, Δ λ , in the measured interference spectrum. Therefore, the Δ λ can be expressed as follows:
Δ λ = m T , a v e ( T 25 ) + m SOC SOC ( % ) ;
thus, the SOC (%) can be calculated using the following equation.
SOC ( % ) = Δ λ m T , a v e . ( T - 25 ) m SOC
In the above equations, Δ λ is the phase shift, T is the electrolyte temperature, m T , a v e is the average value of the sensitivities of Δ λ with respect to T under different SOC conditions (in this study, 0%, 50%, and 100% are tested with results shown in Figure 8c). The m SOC is the sensitivity of Δ λ with respect to SOC (%) at 25 °C. It is clear that with the above empirical formula, the corresponding SOC (%) can be readily calculated by a set of simultaneously measured Δ λ and T.
As to the estimation accuracy of the proposed method, it depends on the resolution of the optical spectrum analyzer (OSA) used. In this study, the scanning resolution of OSA is set to 0.05 nm. This means that the estimation error of SOC is about 0.57%. This is calculated as follows:
With the measured sensitivity, m SOC = −0.0875 (nm/%) presented in Figure 7b, defined as Δ λ ( n m ) / SOC ( % ) , the measuring error can be calculated by | 0.05 nm / 0.0875 ( nm / % ) | = 0.57 % .
It should be noted that setting a higher resolution in OSA can further reduce the measuring error; however, this will result in an increase in the measuring time. This is due to the number of calculating points within a given range of wavelength (1500–1600 nm in this study) is increased in the scanning process of OSA.

6. Conclusions

In recent years, the growing interest in applying VRFBs for grid-scale energy storage applications has been accompanied by many research efforts in designing accurate and applicable SOC measuring schemes for the VRFB systems. Developing a feasible technique for obtaining the real-time SOC of a working VRFB is a challenging task, also a must-have to ensure not only the desired VRFB’s functions for power systems being achieved but also better system management strategies being performed for the VRFB. In this paper, a novel AGFFPI-based SOC sensing device, with high-resolution RI sensing capability, has been proposed for the VRFB. Two sets of preliminary experimental tests have been carried out. Based on the test results, it is observed that the variations of wavelength shift and the variations of VRFB’s SOC have a linear relationship. The effect of electrolyte temperature on the interference spectra with three fixed SOC values has been examined. Linear relationships between electrolyte temperature and the measured wavelength shift have also been observed in all of the three test cases. As a result, it can be concluded that the calibration task for the measured SOC under various electrolyte temperatures can be readily done with a simple empirical equation. In addition, the proposed fiber-based sensing device is robust and especially good for VRFB’s applications because fiber-based sensors, made of silica glass, are considered robust and have a number of attractive advantages in this specific application, e.g., strong acid and alkali resistance, corrosion resistance, and immune to external perturbations (electromagnetic interference (EMI), lighting, etc.). It is also worth noting that, in practice, the proposed AGFFPI-based SOC sensing device can be simply dipped into the positive electrolyte reservoir of a VRFB, and a remote monitoring mechanism can be readily realized using the internet of things (IOT) technology and optical fiber communication systems. With the proposed sensing mechanism, the time for achieving a stable result of SOC depends on the resolution of OSA and the scanning range of wavelength. In this study, the resolution of the OSA is set to 0.05 nm and the scanning range of wavelength is 1500 nm to 1600 nm for obtaining five sets of shifts in interference spectrum (Figure 7a). With the above arrangement, it takes about 3 s to obtain a result. It is important to note that in practical application, the scanning range of wavelength can be much smaller. In this case, using 1550 nm to 1580 nm is enough for the required measuring process. This means that a determination of SOC can be made with <1 s. I believe that this is fast enough for most real-time applications of VRFB. In this paper, theoretical analysis and results obtained from two set of experimental tests have demonstrated the feasibility and effectiveness of the proposed SOC estimating scheme. It should be noted that the catholyte is the complex composition of the species during VRFB’s operation. The variations in composition will have a major influence on the density of electrolyte solution. Due to the fact that the membrane of a real-life VRFB is not perfect, it can be expected that to achieve a better performance in the accuracy of SOC measuring on the proposed method some engineering techniques and the concept of a hybrid sensing mechanism will be needed in practical applications. Since this is a preliminary study demonstrating an innovative SOC detecting concept based on off-line prepared positive electrolytes. Further research tasks related to the proposed method is the design of an integrated SOC detecting system including the proposed sensors, signal transmission, and display systems to be tested and verified with a real-life VRFB.

Funding

This research was funded by MOST, Taiwan, with grant numbers, MOST 107-2221-E-239-036 and MOST 108-2221-E-239-007 and the APC was funded by MOST 108-2221-E-239-007.

Acknowledgments

The author would like to thank the Ministry of Science and Technology (MOST) of Taiwan for financially support the energy-related researches regarding key technologies and the design of advanced power and energy systems.

Conflicts of Interest

The author declares no conflict of interest.

References

  1. Mbungu, N.T.; Bansal, R.C.; Naidoo, R. Smart energy coordination of a hybrid wind/ PV with battery storage connected to grid. J. Eng. 2019, 2019, 5109–5113. [Google Scholar] [CrossRef]
  2. Yan, X.; Lin, X.; Qin, L.; Han, S.; Gao, L.; Yang, Y.; Zeng, B. Control strategy for wind power integration base on energy demand respond and distributed energy storage. J. Eng. 2017, 2017, 2374–2377. [Google Scholar] [CrossRef]
  3. Higashikawa, K.; Kiss, T. Novel Power System with Superconducting Cable with Energy Storage Function for Large-Scale Introduction of Renewable Energies. IEEE Trans. Appl. Supercond. 2019, 29, 5402204. [Google Scholar] [CrossRef]
  4. Alotto, P.; Guarnieri, M.; Moro, F. Redox flow batteries for the storage of renewable energy: A review. Renew. Sustain. Energy Rev. 2014, 29, 325–335. [Google Scholar] [CrossRef]
  5. Shirasakia, K.; Yamamura, T. Direct observation of vanadium ion permeation behavior through Nafion 117 using 48V radiotracer for all-vanadium redox flow battery. J. Membr. Sci. 2019, 592, 117367. [Google Scholar] [CrossRef]
  6. Jiang, B.; Fei, Y. Smart Home in Smart Microgrid: A Cost-Effective Energy Ecosystem with Intelligent Hierarchical Agents. IEEE Trans. Smart Grid 2015, 6, 3–13. [Google Scholar] [CrossRef]
  7. Ngamsai, K.; Arpornwichanop, A. Measuring the state of charge of the electrolyte solution in a vanadium redox flow battery using a four-pole cell device. J. Power Sources 2015, 298, 150–157. [Google Scholar] [CrossRef]
  8. Corcuera, S.; Skyllas-Kazacos, M. State-of-charge Monitoring and Electrolyte Rebalancing Methods for the Vanadium Redox Flow Battery. Eur. Chem. Bull. 2012, 1, 511–519. [Google Scholar]
  9. Skyllas-Kazacos, M.; Kazacos, M. State of charge monitoring methods for vanadium redox flow battery control. J. Power Sources 2011, 196, 8822–8827. [Google Scholar] [CrossRef]
  10. Chou, Y.S.; Hsu, N.Y.; Jeng, K.T.; Chen, K.H.; Yen, S.C. A novel ultrasonic velocity sensing approach to monitoring state of charge of vanadium redox flow battery. Appl. Energy 2016, 182, 253–259. [Google Scholar] [CrossRef]
  11. Davies, G.; Knehr, K.W.; Tassell, B.V.; Hodson, T.; Biswas, S.; Hsieh, A.G.; Steingarta, D.A. State of Charge and State of Health Estimation Using Electrochemical Acoustic Time of Flight Analysis. J. Electrochem. Soc. 2017, 164, A2746–A2755. [Google Scholar] [CrossRef]
  12. Tang, Z.; Aaron, D.S.; Papandrew, A.B.; Zawodzinski, T.A. Monitoring the State of Charge of Operating Vanadium Redox Flow Batteries. ECS Trans. 2012, 41, 1–9. [Google Scholar]
  13. Mohamed, M.R.; Ahmad, H.; Seman, M.N.A. Estimating the State-of-Charge of all-Vanadium Redox Flow Battery using a Divided, Open-circuit Potentiometric Cell. Elektron. Elektrotech. 2012, 19, 37–42. [Google Scholar] [CrossRef]
  14. Roznyatovskaya, N.; Herr, T.; Küttinger, M.; Fühl, M.; Noack, J.; Pinkwart, K.; Tübke, J. Detection of capacity imbalance in vanadium electrolyte and its electrochemical regeneration for all-vanadium redox-flow batteries. J. Power Sources 2016, 302, 79–83. [Google Scholar] [CrossRef]
  15. Petchsingh, C.; Quill, N.; Joyce, J.T.; Eidhin, D.N.; Oboroceanu, D.; Lenihan, C.; Gao, X.; Lynch, R.P.; Buckley, D.N. Spectroscopic Measurement of State of Charge in Vanadium Flow Batteries with an Analytical Model of VIV-VV Absorbance. J. Electrochem. Soc. 2016, 163, A5068–A5083. [Google Scholar] [CrossRef] [Green Version]
  16. Rudolph, S.; Schröder, U.; Bayanov, I.M.; Blenke, K.; Hage, D. High resolution state of charge monitoring of vanadium electrolytes with IR optical sensor. J. Electroanal. Chem. 2013, 694, 17–22. [Google Scholar] [CrossRef]
  17. Liu, L.; Xi, J.; Wu, Z.; Zhang, W.; Zhou, H.; Li, W.; He, Y. Online Spectroscopic Study on the Positive and the Negative Electrolytes in Vanadium Redox Flow Batteries. J. Spectrosc. 2013, 2013, 1–8. [Google Scholar] [CrossRef]
  18. Sun, G.; Lu, J.D.; Ye, Q.; Ren, L.; Shi, J.; Tang, Y.J. State of Charge Estimation Using EKF Method for VRB. Adv. Mater. Res. 2012, 512, 986–994. [Google Scholar] [CrossRef]
  19. Xiong, B.; Zhao, J.; Wei, Z.; Skyllas-Kazacos, M. Extended Kalman filter method for state of charge estimation of vanadium redox flow battery using thermal-dependent electrical model. J. Power Sources 2014, 262, 50–61. [Google Scholar] [CrossRef]
  20. Wei, Z.; Lim, T.M.; Skyllas-Kazacos, M.; Wai, N.; Tseng, K.J. Online state of charge and model parameter co-estimation based on a novel multi-timescale estimator for vanadium redox flow battery. Appl. Energy 2016, 172, 169–179. [Google Scholar] [CrossRef]
  21. Wei, Z.; Tseng, K.J.; Wai, N.; Skyllas-Kazacos, M. Adaptive estimation of state of charge and capacity with online identified battery model for vanadium redox flow battery. J. Power Sources 2016, 332, 389–398. [Google Scholar] [CrossRef]
  22. Xiong, B.; Zhao, J.; Su, Y.; Wei, Z.; Skyllas-Kazacos, M. State of Charge Estimation of Vanadium Redox Flow Battery Based on Sliding Mode Observer and Dynamic Model Including Capacity Fading Factor. IEEE Trans. Sustain. Energy 2017, 8, 1658–1667. [Google Scholar] [CrossRef]
  23. Wei, Z.; Bhattarai, A.; Zou, C.; Meng, S.; Lim, T.M.; Skyllas-Kazacos, M. Real-time monitoring of capacity loss for vanadium redox flow battery. J. Power Sources 2018, 390, 261–269. [Google Scholar] [CrossRef]
  24. Aaron, D.S.; Liu, Q.; Tang, Z.; Grim, G.M.; Papandrew, A.B.; Turhan, A.; Zawodzinski, T.A.; Mench, M.M. Dramatic performance gains in vanadium redox flow batteries through modified cell architecture. J. Power Sources 2012, 206, 450–453. [Google Scholar] [CrossRef]
  25. Becker, M.; Bredemeyer, N.; Tenhumberg, N.; Turek, T. Polarization curve measurements combined with potential probe sensing for determining current density distribution in vanadium redox-flow batteries. J. Power Sources 2016, 307, 826–833. [Google Scholar] [CrossRef]
  26. Li, X.; Warren-Smith, S.C.; Ebendorff-Heidepriem, H.; Zhang, Y.; Nguyen, L.V. Optical Fiber Refractive Index Sensor with Low Detection Limit and Large Dynamic Range Using a Hybrid Fiber Interferometer. J. Lightwave Technol. 2019, 37, 2954–2962. [Google Scholar] [CrossRef] [Green Version]
  27. Sun, L.P.; Huang, T.; Yuan, Z.; Yang, M.; Huang, Y.; Xiao, P.; Guan, B.O. Ultrasensitive Optofluidic Interferometer for Online Monitoring of Photocatalytic Reactions. J. Lightwave Technol. 2019, 37, 5435–5441. [Google Scholar] [CrossRef]
  28. Ma, C.T.; Chang, Y.W.; Yang, Y.J.; Lee, C.L. A Dual-Polymer Fiber Fizeau Interferometer for Simultaneous Measurement of Relative Humidity and Temperature. Sensors (Basel) 2017, 17, 2659. [Google Scholar] [CrossRef] [Green Version]
  29. Lee, C.L.; Hsuan, Y.H.; Gu, J.H.; Yeh, T.Y.; Tseng, C.H. Dual hollow core fiber-based Fabry–Perot interferometer for measuring the thermo-optic coefficients of liquids. Opt. Lett. 2015, 40, 459–462. [Google Scholar] [CrossRef]
Figure 1. Categories of reported vanadium redox flow battery’s (VRFB’s) state-of-charge (SOC) estimating methods.
Energies 13 00291 g001
Figure 2. Schematic diagrams of a VRFB system: (a) VRFB hardware system; (b) charging and discharging operations of a single-cell VRFB.
Energies 13 00291 g002aEnergies 13 00291 g002b
Figure 3. Fabricated sensing device (air-gap fiber Fabry–Perot interferometer (AGFFPI)) and its interference spectrum shift: (a) Electron microscopic image near the air gap; (b) photo including the V-groove holder; (c) theoretical interference spectrum shift of the AGFFPI.
Energies 13 00291 g003
Figure 4. Schematic of the experimental setup: (a) broadband light source (BLS); (b) proposed AGFFPI sensing device and the thermoelectric (TE) cooler (TEC); (c) optical spectrum analyzer (OSA); (d) 2 × 2 optical coupler; (e) positive electrolyte under test.
Energies 13 00291 g004
Figure 5. The positive electrolyte couple and electrolyte samples with distinct SOC values.
Energies 13 00291 g005
Figure 6. Interference spectrum of the AGFFPI with air in the gap and the ambient temperature of 25 °C.
Energies 13 00291 g006
Figure 7. (a) Interference spectra of positive electrolytes with 0–100% SOC under 25 °C; (b) curve fitting of wavelength shift-SOC results in Figure 7a. The inset shows a set of the measured peaks around λ = 1550 nm.
Energies 13 00291 g007aEnergies 13 00291 g007b
Figure 8. Experiment results: (a) the interference spectra measurement of positive electrolyte with 0% SOC under 25–45 °C; (b) the interference spectra measurement of positive electrolyte with 50% SOC under 25–45 °C; (c) the interferences spectra measurement of positive electrolyte with 100% SOC under 25–45 °C; (d) the co-plotting of wavelength shift-temperature results presented in (a), (b), and (c).
Energies 13 00291 g008aEnergies 13 00291 g008b

