Article

Effect of Insulation on the Energy Demand of a Standardized Container Facility at Airports in Spain under Different Weather Conditions

by
Miguel Ángel Álvarez-Feijoo
1,
Pedro Orgeira-Crespo
2,*,
Elena Arce
1,
Andrés Suárez-García
1 and
José Roberto Ribas
3
1
Defense University Center at Spanish Naval Academy, 36920 Marín, Spain
2
Aerospace Area, Department of Mechanical Engineering, Heat Engines and Machines and Fluids, Aerospace Engineering School, University of Vigo, 32004 Ourense, Spain
3
University of Rio de Janeiro Centro Federal de Educacao TecnolóGica Celso Suckow da Fonsea, Avenida Marcaná 229, Rio de Janeiro 20271-110, Brazil
*
Author to whom correspondence should be addressed.
Energies 2020, 13(20), 5263; https://doi.org/10.3390/en13205263
Submission received: 24 September 2020 / Revised: 5 October 2020 / Accepted: 9 October 2020 / Published: 10 October 2020

Abstract

:
Airports, broadly spread world-wide, present continuously increasing energy demands for heating and cooling purposes. Relocatable facilities within them could be built on recycling shipping containers provided with the right insulation layer, to reduce the outstanding consumption of the heating, ventilation and air conditioning systems (HVAC). This research focuses on studying the effect of added insulation on the thermal performance of a construction in the scope of an airport facility, based on a recycled shipping container. Passive heating and cooling insulation strategies have shown good results in terms of energy savings. A series of simulations were performed along six different Spanish airports locations, selected to represent several climate conditions. Temperature evolution inside the container, and energy demands of the HVAC system were obtained to show that the insulation provided by phase change materials (PCM) is performing better than traditional insulation, or a raw container. Although there are slight behavior differences according to the climate, PCM can increase inside temperature even with no HVAC under certain circumstances.

1. Introduction

The airside is an airport’s secured area, accessible only to the staff with the required access credentials or to passengers after security clearance. In this area, a large infrastructure is needed to make the airport functional. Among the facilities that usually exist in this area are the operations control center, the hangars, cargo, flight catering, aircraft rescue and firefighting, ground support equipment maintenance, storage, airport vehicle maintenance, constant current regulators (CCR) halls (small substations at the end of the runways to control the ground lighting), etc. Many of these services require solid and robust buildings with high-end construction requirements. However, there are other facilities that, due to their own nature, can be adapted to other types of enclosures, with a lowered set of requirements. These small airport facilities have other functionalities, their requirements are not as extensive as in larger buildings and, additionally, they present different conditioning factors. In certain small buildings, requirements are oriented to low installation and maintenance costs, high mobility, capacity, resistance, etc., albeit under compliance with the applicable regulation [1].
Those use cases requiring small facilities could have their buildings replaced by recycled shipping containers. A shipping container is a rectangular-shaped cargo container, and its main function is to transport goods inside it. Its dimensions are standardized to facilitate handling in cargo terminals and the transport of goods over long distances, especially by sea. The materials used to manufacture the containers are diverse depending on their suitability; however, the majority of the containers carried by sea are made from two layers of steel or aluminum and polyurethane, many of them reinforced with plywood to avoid humidity during transportation.
It is estimated that more than 300 million containers have fallen in disuse worldwide. Therefore, new applications for these elements are being developed to allow their recycling. These recycled and refurbished containers can be used as storage sheds, offices, houses, buildings, hotels, schools, restaurants, churches or even shopping centers [2]. Even some companies have used the design of sea containers as a base for building modules as field hospitals, ammunition warehouses, toilets and even as water-treatment plants for the army [3]. The large number of empty containers in disuse around the world has drawn the attention of many designers focused on minimizing resources extraction. Moreover, many designers find in containers a suitable method for construction: they are modular in shape, structurally strong and widely available [4].
The reuse of shipping containers as modules for construction is an alternative from the economic and design points of view. The field of modular construction with this type of containers opened some years ago, a new market that has not stopped growing until recently [3].
This trend began in the 1950s, when the first building made of sea containers was created by Canadian company Steadman Industries, to solve the need to handle material loads in the Arctic. Among their main advantages, we may highlight:
  • Portability: They are designed to facilitate their mobility and transportation.
  • Adaptability: Their weight and load capacity characteristics make them adaptable, with a small base, to any terrain; they also show high structural performance as they allow vertical stacking of other modules.
  • Robustness and greater durability: These containers were built to withstand the marine environment and the shocks and movements that occur during maritime transport.
  • Effective use of space: The 20 TEU (twenty-foot equivalent unit) container can accommodate approximately 33 m3 in only 15 m2; the 40 FEU (forty-foot equivalent unit) accommodates up to 67 m3 in less than 30 m2.
  • Modularity: Due to their design, they are easily stackable. Therefore, with small modifications or adaptations it is an excellent solution for modular architecture, being able to form in-line constructions or increase height by stacking modules. Each container can be, for instance, a room in a house.
  • Configurable: They can be configured according to customer needs.
  • Cost-effectiveness: The estimated 300 million disused containers in the world could be reused. This means a reduction in overall installation and configuration time, as well as lower costs than a traditional concrete structure. In addition, they could be factory-rebuilt and conditioned and then taken to their destination, further reducing overall cost.
  • Recyclability: The reuse of containers is beneficial to the environment as it drastically reduces manufacturing materials, with significant savings in energy and CO2 emissions into the atmosphere. Virtually maintenance free, shipping containers are initially designed to last for many years. They are manufactured with a layer of insulation which, if properly treated, can be totally suitable for use in a home, saving energy in heating and/or cooling [5].
On the other hand, the continuous growth in passengers at an airport implies that airport terminals are continually making not only internal but also external changes to tackle this demand growth. This increase is such that energy demands at an airport has reached the values of the highest energy consumption centers per square kilometer in the world [6].
Over the last several decades, the consumption of energy has been dramatically increasing at both national and global scales [7]. Energy consumption in an airport is distributed in lighting, air conditioning, ventilation and conveyance systems. There are huge areas with non-uniform air conditioning and large glass surfaces to achieve good natural lighting, as well as for aesthetic design criteria [8]. The energy consumption by the HVAC systems can exceed 40% of the total power consumption [9]; excluding smaller systems they consume nearly all the natural gas used at an airport [10].
Although large spaces are responsible for most of the energy consumption, there are also small spaces in airports that all together can have a relevant consumption of energy. Some of these small spaces could be based on standard shipping containers. These types of containers are manufactured from sandwich type panels, whose outer layers are usually made of stainless steel, and between them there is a polyurethane layer (PUR). Polyurethane is a rigid and lightweight foam made from sugar and petroleum. It has an efficient thermal performance. Thanks to this foam, it absorbs vibrations, avoids environmental humidity and adheres easily to any surface. Nevertheless, due to its high degree of combustion, the use of this material is decreasing, despite having been one of the most used insulating materials in the recent years [11].
PUR has reasonable insulating capabilities but, for applications where it is necessary to maintain a certain degree of thermal comfort in the interior, it may be advisable to improve its insulating capacity to reduce energy consumption due to air conditioning or heating. It is usual to place a layer of insulating material in the inside and then another layer of plasterboard. This type of materials helps reducing energy consumption, improve thermal comfort by reducing temperature variations or fluctuations and condensation, prevent corrosion and protect against fire [12].
The most common insulating materials in containers refurbishing include [13,14]:
  • Expanded polystyrene (EPS): This material derives from polystyrene; it is very versatile and easy to shape. It is widely used in the building sector as it offers great thermal resistance without the need for high thickness.
  • Extruded polystyrene (XPS): It is a material with high mechanical performance and very similar properties to those of EPS. The main difference between these two is the ability to be wetted, as it does not rot. Waterproofing is the most characteristic feature of this material, since it facilitates access to the reparation of the constructions. Due to its high density, it is manufactured in very thin plates that allow optimizing the occupied volume.
  • Mineral wools, both rock (SW) and glass (GW), are composed of inorganic stone materials that intertwine their filaments to create a very lightweight compound that, in turn, offers great protection and insulation. Due to this stony composition, these materials have a low degree of combustion, which is why they are becoming the great substitute for PUR. In addition to their thermal protection capacity, they also provide acoustic protection, a combination that has made them the most widely used materials nowadays.
At present day, in the European inorganic fibrous materials market, glass wool and stone wool account for 60% of the insulation materials [15]; organic foamy materials, expanded and extruded polystyrene and, to a lesser extent, polyurethane, account for 27% [16].
The three more common building insulation materials used in Spain are polyurethane, mineral wool and polystyrene. A large number of researchers have studied numerically thermal performance of fibrous insulations that are widely used in construction all over the world, and also the heat transfer mechanisms [17].
Other specific research is focused on obtaining approximate expressions for thermal conductivity. If this layer of insulation material is supplemented by another one with a phase change material (PCM), the temperature inside the enclosure can be regulated more effectively. For a few years now, research has been carried out on this type of material that uses energy to change phases. PCMs have been used in various fields for thermal energy storage (TES), especially in the building envelope [18]. PCM is defined as a substance that requires high thermal energy to change phase (in particular, from solid to liquid or vice versa). Water has been used as PCM in large installations for a long time, although it has fallen into abeyance due to the high costs that installations have when they need secondary fluids that require low evaporation temperatures. This required energy is much higher than that needed to cause small temperature increases in the same substance. Therefore, this phenomenon can be used to store thermal energy [19]. When the substance changes phase, it retains the absorbed energy in the form of latent heat. Phase changes can be from solid to liquid, liquid to vapor and solid to solid. The least used is the liquid–vapor phase change, since vapor generates high pressures and an expensive system is needed to withstand this pressure. The solid-solid change generally consists of changing from a crystalline structure to amorphous, but it is not very widespread either. The one that takes more energy is the liquid-solid change [20]. Finally, another advantage of these materials is that the release or storage of energy occurs at almost constant temperature [21].
PCM has been studied deeply in different research, mostly focused on its application for using solar energy to storage that energy [22], and utilize it for heating purposes, whether using hot water or floor heating [23] or, in general, to obtain comfort inside a facility optimizing energy consumption [24]. Most of the studies focus in the residential applications for apartments [25], attics [26] or isolated houses [27], but, to the best of our investigations, none on reused containers.
There are cases of research studying the effect of PCM in specific cities [28], specific countries [29], or a concrete season like dry climate [30], or winter [31]. Again, to the best of our knowledge, the literature has not focused so far in addressing the airport case in several cities, through different climate conditions.
In [32], the thermal behavior has been studied using EnergyPlus (9.4.0, funded by the U.S. Department of Energy’s Building Technologies Office, USA), to predict the expected temperatures achieved using this insulation; in [33], the characteristic temperature values have been found using a novel approach, based on numerical analysis, with similar results. Other areas of the literature focus on maximizing latent heat, experimenting with different thickness, as in [34], or combining it with different construction materials to obtain optimal insulation values [35]. A key aspect, not covered thoroughly though, is how heat is transferred through the insulating walls [36], according to the location in the wall; authors claim to have found an optimal model combining different layers of PCM, air and other construction materials. To use all the potential of PCM in a latent heat thermal energy storage system, and succeed recharging it completely, there are interesting proposals based on using controlled natural ventilation during the night phase [37].
Of special interest are the studies that develop new PCM materials, since they provide an overview of the factors that affect their design, and their performance (temperature limits, phase change melting and solidification temperatures, and the degree of thermal loading) [38].
This paper addresses the use of shipping containers for applications, such as residences, offices, small warehouses or equipment enclosures. These containers, with small modifications or adaptations, would be recycled and transformed into mobile, transportable, economic and practical elements to be placed in any space of an airport where it is needed. Due to their manufacturing materials, they are very resistant to impacts and environmental conditions. Consequently, in order to improve their insulating, thermal and also acoustic properties, as well as the thermal comfort inside, they will be supplemented with layers of insulating material and PCM. For the study, the simulation of the thermal behavior of a 1 TEU marine container that has been covered on the inside with a layer of a glass wool and also a phase change material, are proposed. The main novel aspect of the present study is the analysis of the real contribution of the PCM wall insulation to energy savings and thermal comfort (inside temperature analysis), considering different locations under several climate conditions, in the specific use case of refurbished containers used for facilities within airports.

2. Methodology

The research started by defining the 3D design on SketchUp (2020, Trimble, Sunnyvale, CA, USA), using the OpenStudio plugin. OpenStudio (3.0.0, Alliance for Sustainable Energy, Lakewood, CO, USA), is used to provide the design with materials and special construction properties. Once designed under SketchUp, the model is exported to EnergyPlus, where the energetic simulation is performed, and the results can be analyzed; under the EnergyPlus software, the locations for the simulations are defined, the requirements are imposed, and the insulating alternatives are designated. The locations (airports) were selected based on the Köppen-Geiger climate classification. Thus, the impact of the insulation on different climates was analyzed, using the EPW weather files were used provided by the software.

2.1. Locations and Climatic Zones
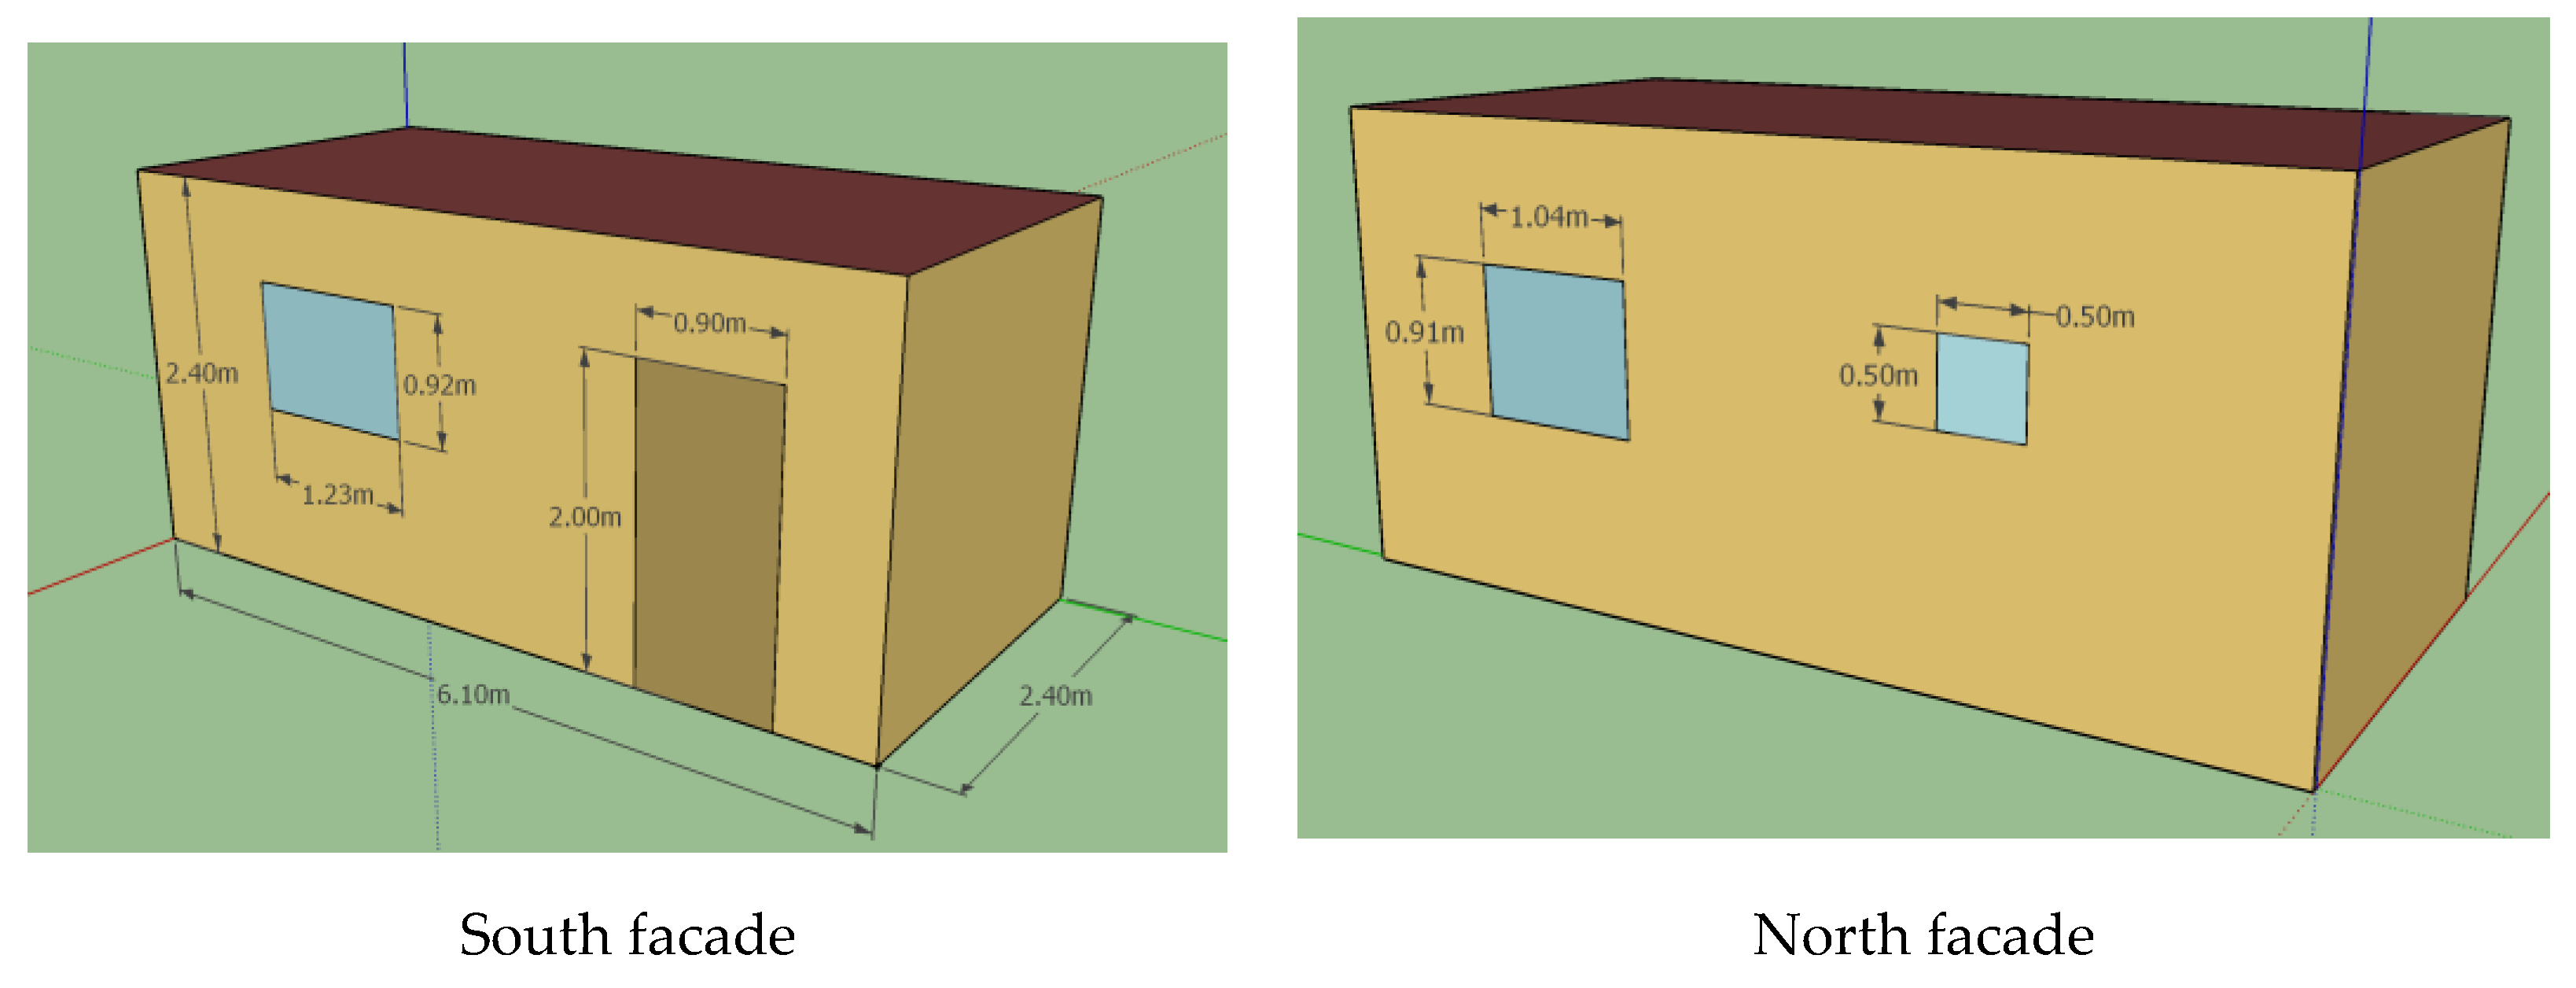
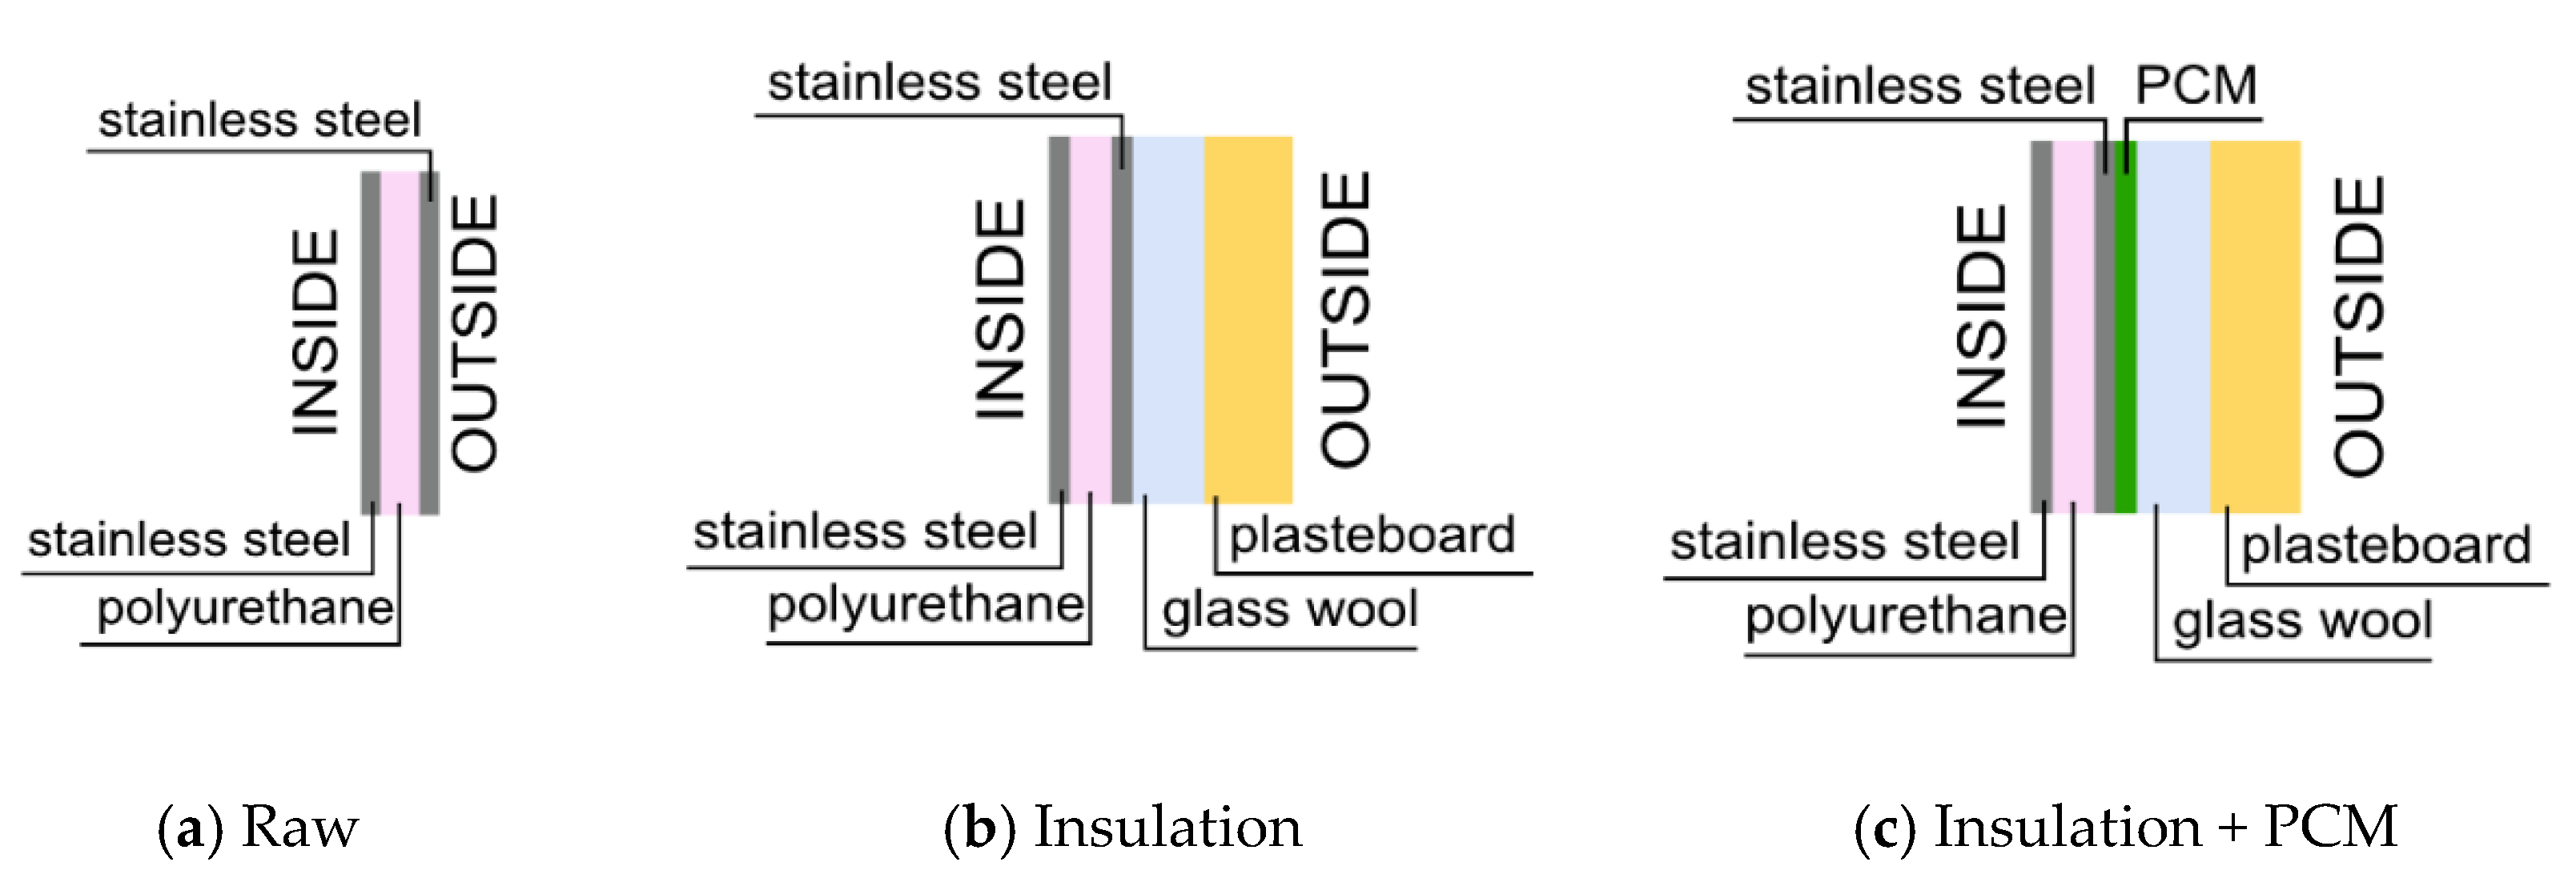
This research was developed in Spain and locations within this territory where selected using the climatic classification by Koppën and Geiger, as seen in the Figure 1. According to this classification, climates are catalogued as: A (tropical), B (arid), C (temperate), D (continental) and E (polar). Moreover, precipitation level is also described, classified as: W (desert), S (steppe), f (no dry season), s (dry summer), w (dry winter) and m (monsoon). Finally, Koppën–Geiger provides a classification according to temperature: h (hot arid), k (cold arid), a (hot summer), b (warm summer), c (cold summer), d (very cold winter) and F (eternal frost) [21].
Out of the 48 airport locations in Spain, six were selected to perform the simulations. The criterion was based on climate according to the Koppën–Geiger classification. Table 1 summarizes location and climate for the selected places. Being all locations within Europe, 18 °C was chosen to calculate heating degree days (HDD) and cooling degree days (CDD) [39]. HDD and CCD provide insight on heat and cooling needs for the different sites. Meteorological data for the simulation was obtained from the EnergyPlus database, that offers information from different sources in EPW (EnergyPlus weather file) format.

2.2. Building Model

The construction model designed to perform simulations was a 1 TEU standardizer container, with a volume of 38.51 m3 (1360 ft3) without any internal partitions; it has a 2.3 m2 glass surface in three window panes, as shown in Figure 2 and a 1.80 m2 door in the north wall. According to previous research [40], walls and ceiling (exposed to the outdoors) were painted in grey to improve solar absorption, and the base of the container was separated from the ground, both measures for simulation purposes.
The container was conceived as an office workplace. With the goal of determining the effect of the inclusion of PCM in the enclosure on thermal comfort and energy demand, three different models were considered and compared: first, a baseline reference model with no insulation; second, a model with traditional insulation; third, a model including traditional insulation plus a PCM layer (Figure 3).
Energain® PCM panels by DuPont™ were used, after previous research that proved their feasibility [41]. In our simulation, Energain® chosen panels where 5.26 mm thick, and provided up to 515 kJ/m2 thermal capacity storage in the 18–24 °C range [42]. The kernel of the panel is a mixture of copolymer and paraffin. Paraffin represents 60% of the kernel and is the phase changing material, giving the panel its thermal characteristic. Table 2 displays the properties of the panels used in the simulation. Enthalpy data versus temperature for the PCM were obtained using differential scanning calorimetry (DSC), under a heat ratio of 0.05 °C/min [42]. The construction details of the container are shown in Table 3.

2.3. EnergyPlus Building Simulation
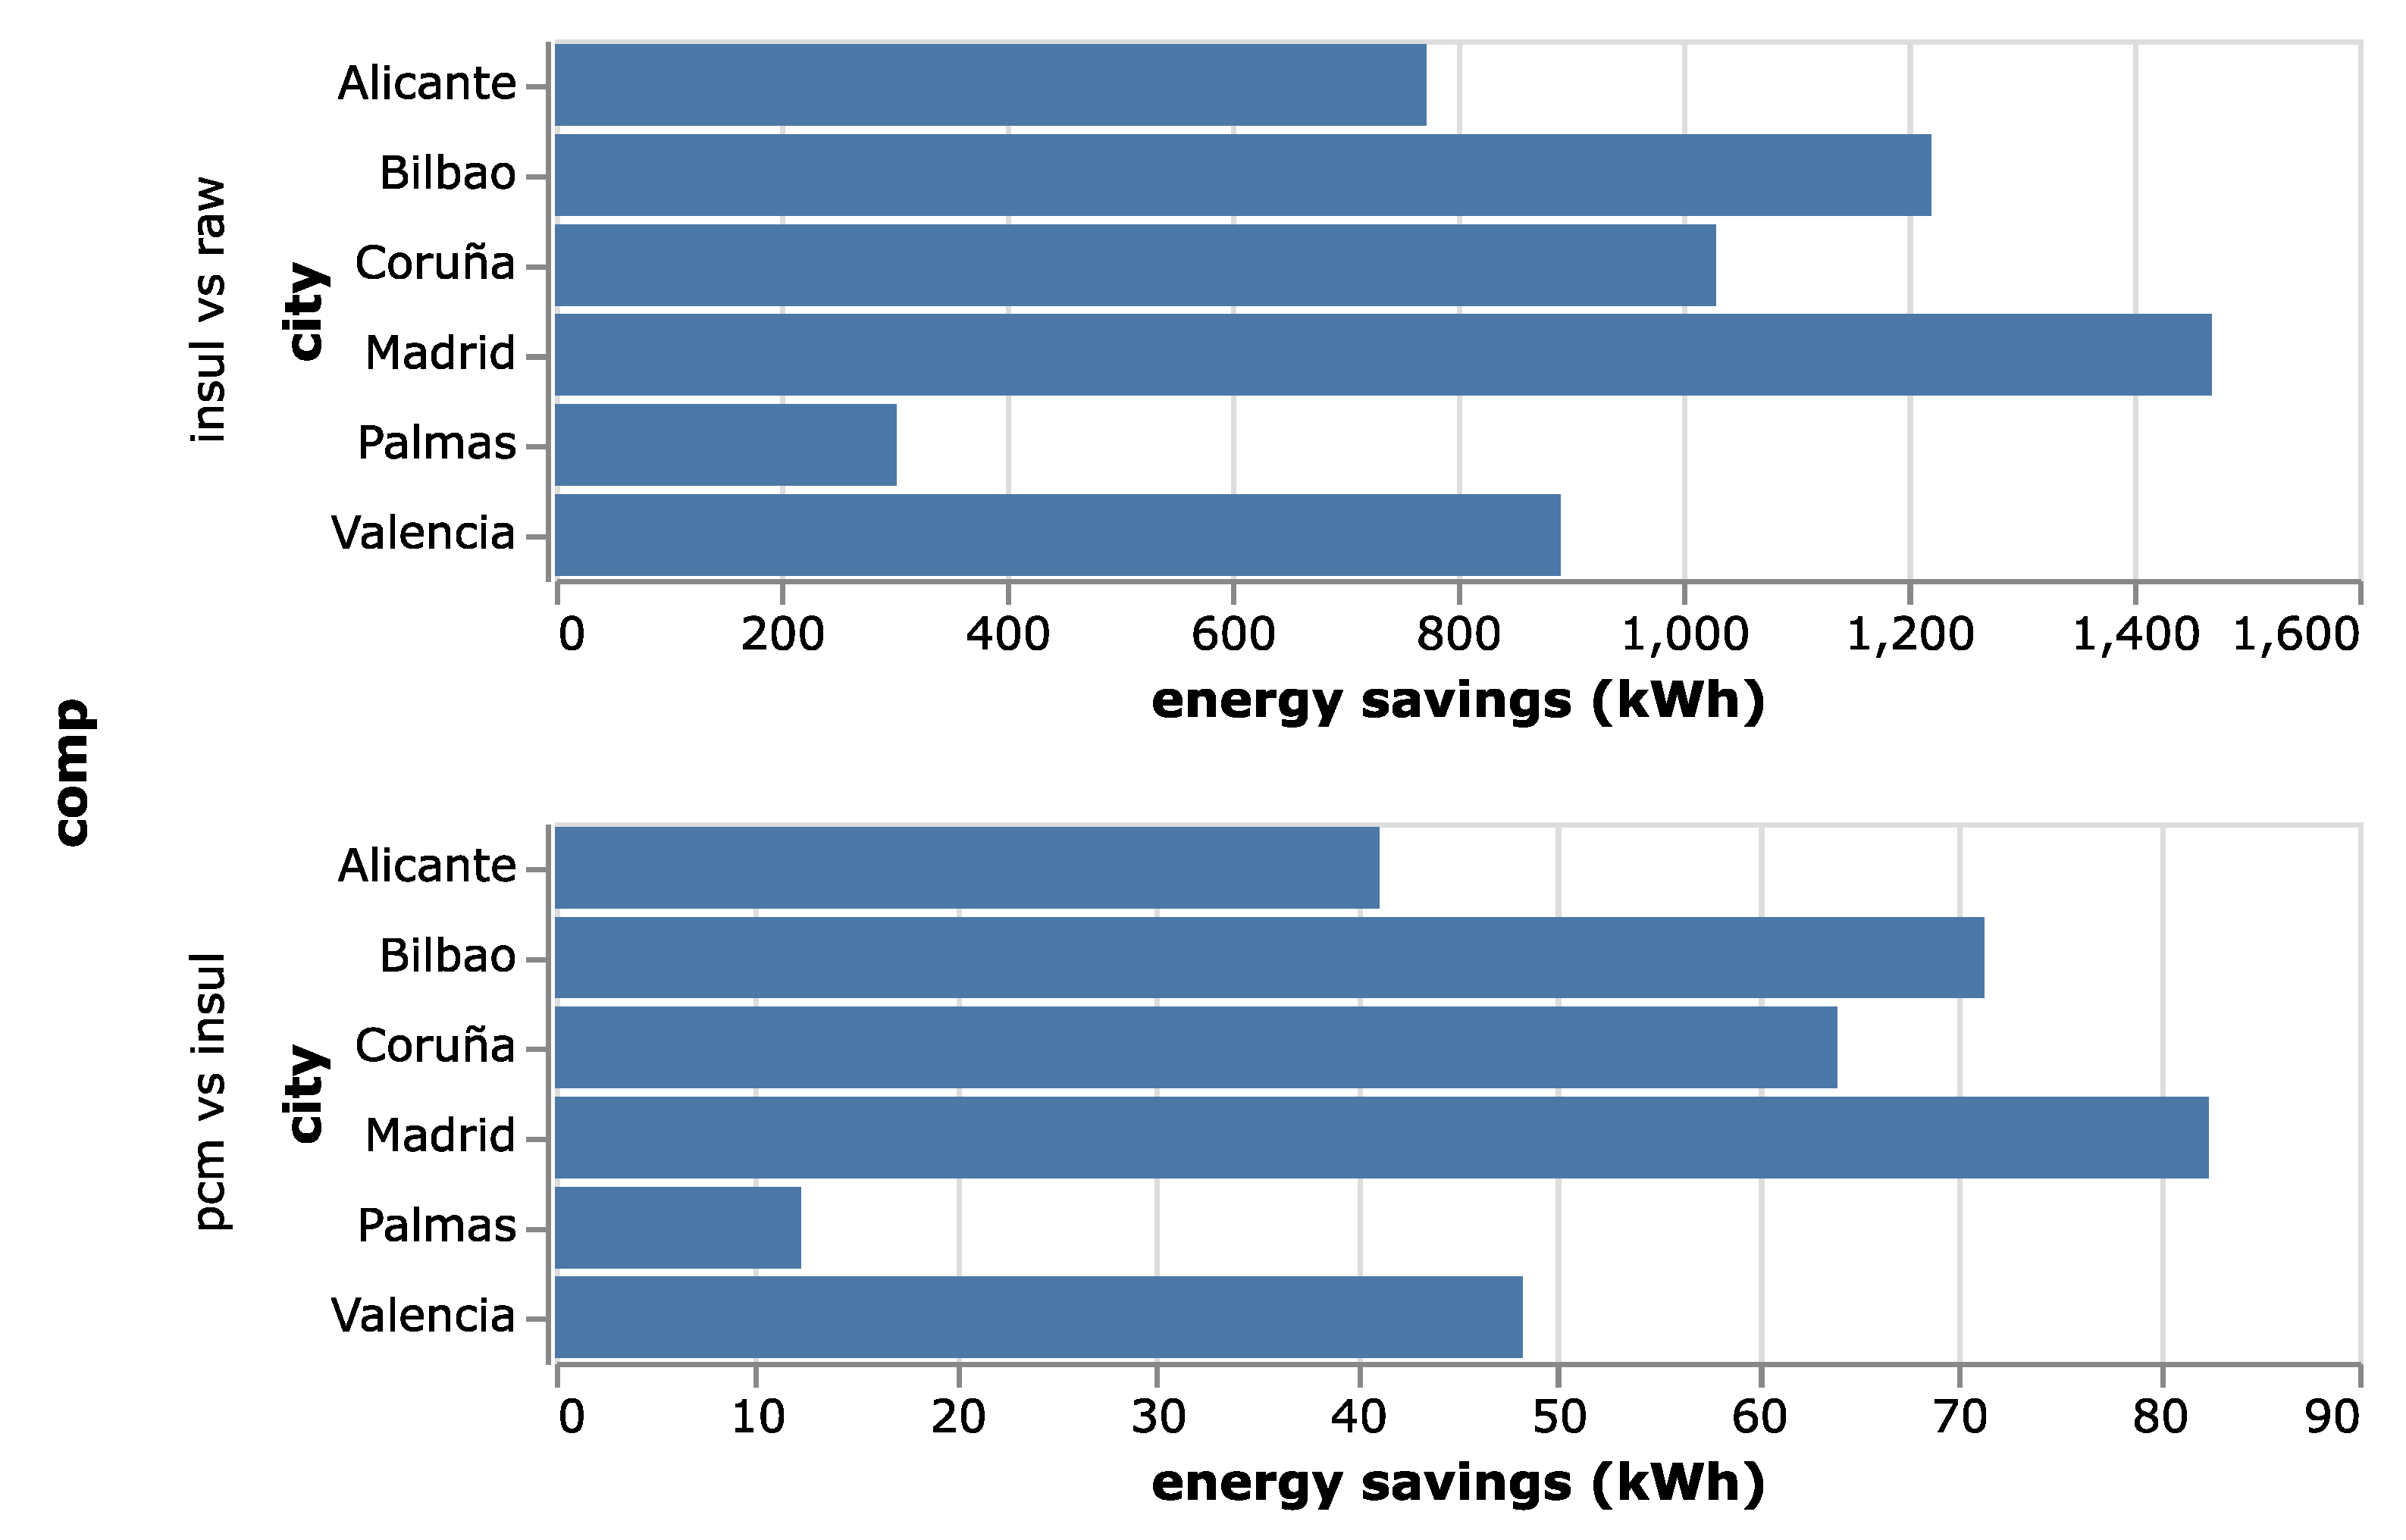
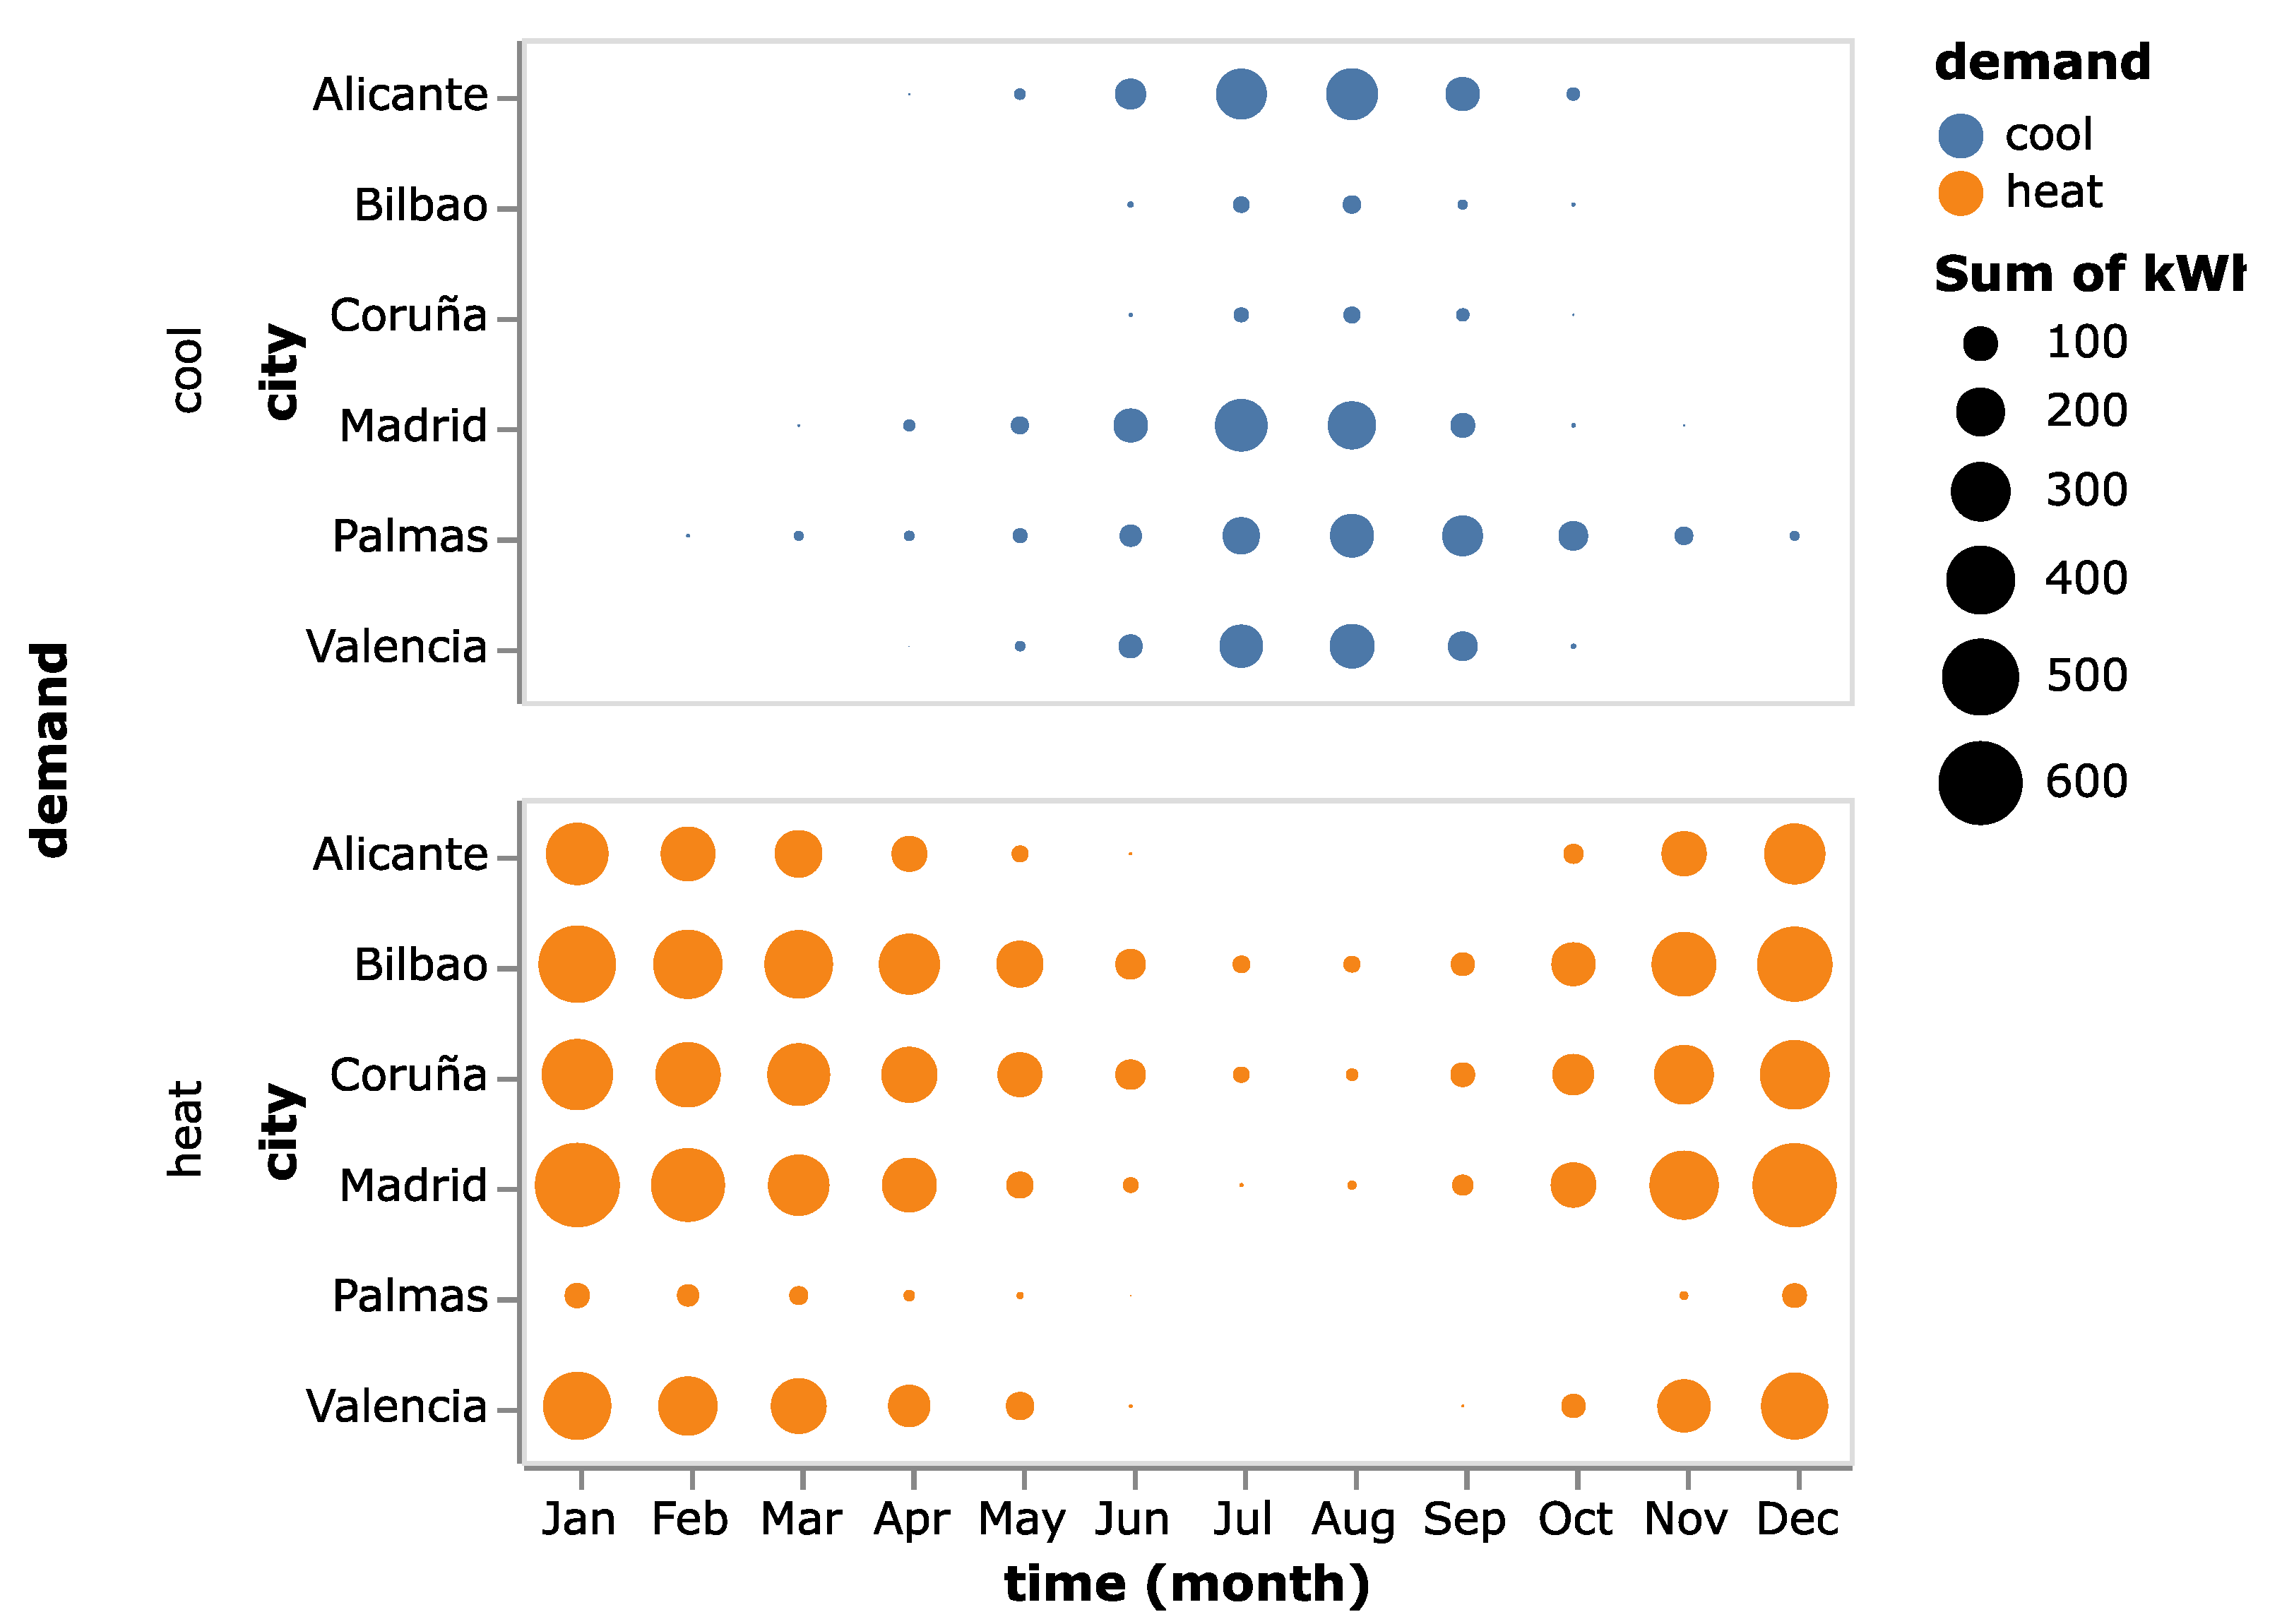
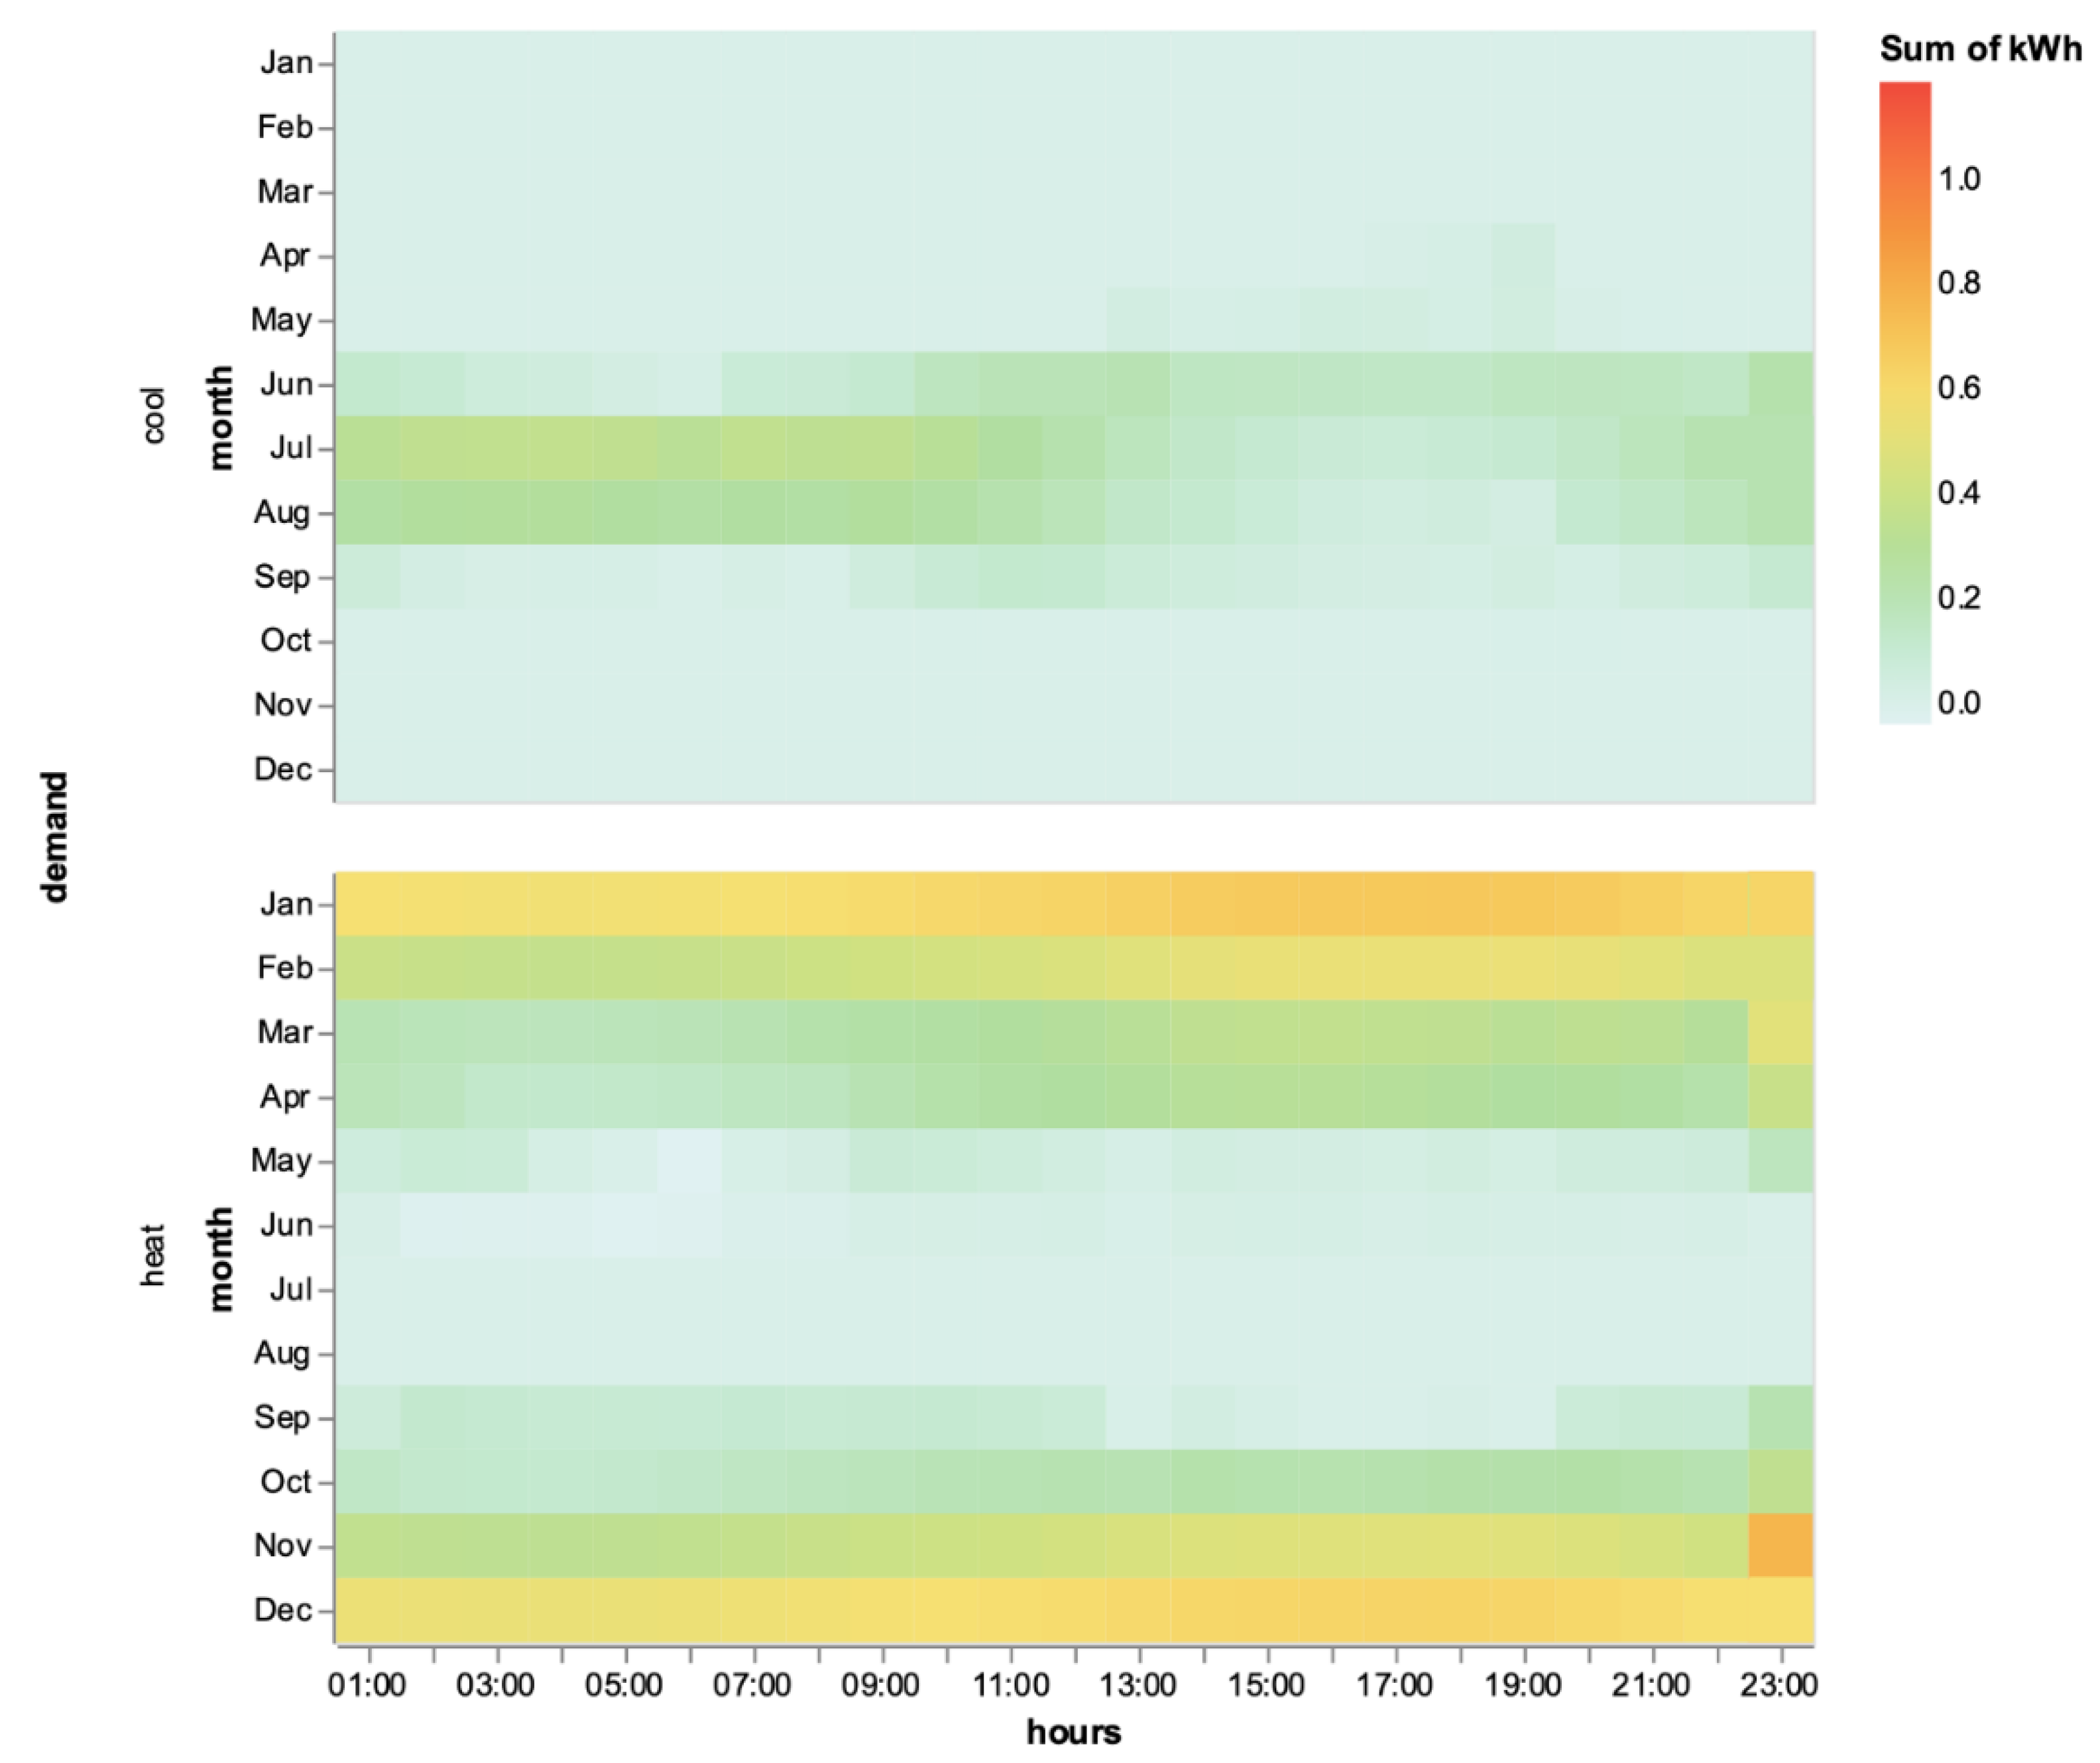
The thermal simulation of the PCM can only be performed using the CondFD algorithm under EnergyPlus. This algorithm discretizes walls, floor and ceiling in nodes using a finite differential scheme to solve heat transfer equations numerically [43] (EnergyPlus 2010). In this research, the CondFD algorithm characteristics applied on EnergyPlus were a difference scheme fully implicit first order with space discretization constant of three, and one-minute time step. Considering that the goal of this project is to predict the benefits of the use of PCM in the enclosure, internal gains and infiltration loads were inserted. Thus, a continuous usage of the facility during HVAC working hours was considered. Having no internal partitions, the container was considered as a single thermal zone, selecting dual set point thermostat. According to ASHRAE standards for living spaces, temperature set point was 21 °C for heating and 25 °C for cooling. A 54 W power was assumed for lighting and 0.63 air changes per hour were supposed as infiltration rate. The occupancy schedule was constant, and the internal gains set to the equivalent of one occupant throughout a day. The activity level was set to 186 W, assuming a machine work activity [43].

3. Results

Table 4 displays the total amount of energy consumed for heating and cooling purposes during a year, for the three proposed envelopes along the six airports under study. Results show that the inclusion of PCM leads to energy savings for heating and cooling along all locations. Average energy savings with respect traditional insulation are 2.62% for heating, and 1.33% for cooling; energy savings compared to the original uninsulated container reach 40% for heating and 30% for cooling. Yearly energy savings expressed in percentage terms are quite similar for every climate under analysis. While the Madrid (Csa) site achieves the best energy savings among every other location (as shown in Figure 4), it is key to emphasize that heating demands are far higher that cooling ones (as seen on Table 4), with a remarkable exception at Las Palmas airport (BWh).
Table 5 displays a key parameter involved in the design of an HVAC for a building: heating and cooling peak. The mere existence of insulation in the enclosure (whether PCM is used or not) implies an average 50% fall in energy demand peak; as shown, the addition of PCM is beneficial in every case, albeit its impact is moderated. As for cooling, maximum energy saving is achieved for the Bilbao location, with a 3.8% reduction. With respect to heating, Las Palmas is the airport where the peak reaches its best value (2.5%), attaining values rounding 2% for the rest of the locations. For the Madrid (Csa), La Coruña (Csb) and Valencia (BSk) sites, heating peak demand happens in January, whilst in Bilbao (Cfb) and Las Palmas (BWh) it occurs in February, and in December for Madrid (Csa). With regards cooling peak, it spreads between July (Bilbao and Las Palmas) and August (Alicante, La Coruña, Madrid and Valencia). Figure 5 shows that peak demand results do not necessarily correspond to the month where the total HVAC are greater.
Another key aspect when analyzing the performance of the different enclosures is the seasonal behavior, as shown in Figure 6. It allows the distinction of two different periods: cooling season and heating season. The greatest energetic demands happen in the coldest months (heating season), and consequently, the melting temperature of the PCM must adapt to those periods. Melting temperature of the Energain® panel used (21.7 °C) suits heating and cooling demands reduction. Nevertheless, in certain locations it could be preferable to select a PCM with a lower melting temperature to reduce heating and cooling demands. Previous research shows that melting peak temperature and PCM activations along a day are key to reduce thermal demand for a specific technology [44]. Obtained results for cooling and heating demands are consistent with those displayed in Table 1 for HDD and CDD. Accordingly, locations with higher heating demands (Madrid, La Coruña and Bilbao) show the greatest energy savings (Table 4) with respect to the non-insulated option.
Madrid was the location where the addition of PCM led to the greatest energy savings (Table 4); consequently, the effect of PCM was further analyzed. Figure 6 shows the sum of the energy savings per hour for a year when using PCM, compared to those where the insulation has no PCM. As expected, a seasonal behavior is found with changes within a day. Throughout the cooling season (July and August), PCM absorbs cooling loads and internal gains during the beginning and the end of the day, leading to energy savings; on the other hand, high temperatures during the central hours of the day prevent PCM from performing melting-solidification cycles: phase change temperature is not exceeded (21.7 °C) and consequently it stays in liquid phase. The consequence is that the inclusion of PCM in the enclosure does not reduce the energy needs of the container during the central hours of the day in the warmer months. Accordingly, results show that for the Madrid location, the selected PCM has a low melting point for the central hours of the day during summer months; nevertheless, in the same cooling season, melting temperature of PCM DuPont™ Energain® achieves full melting-solidification cycles in a day, recharging itself completely. On the other hand, the insulation effect is greater during the heating season in the central hours of the day; throughout these hours, the phase change temperature of the PCM is reached, since the presence of the PCM helps reducing heat losses and increments the thermal mass (indeed, that thermal mass increment is also beneficial for any other time of the day during the heating season). As other research shows, the addition of PCM improves the energetic performance, since it reduces peak loads (as seen in the central hours of the day during May), and it shifts peak demand temporally [45].
Comparing the behavior between an enclosure with PCM insulation and another raw (no insulation), it can be observed that in the cooling season the addition of PCM is detrimental for the thermal demand (Figure 7). Two are the reasons for this effect: first, the melting temperature of the PCM (21.7 °C) is exceeded during the central hours of the day in the summer months (that keeps PCM in liquid state, preventing it from performing melting-solidification cycles that would reduce consumption); second, the addition of the insulation helps reducing heat losses and increments the thermal mass that, although advantageous during night, is again detrimental at the central hours of the day (temperature inside is higher when insulated, and thus cooling loads are incremented as well). On the other hand, through winter months, the addition of the insulation or PCM has no effect on consumption reduction during nighttime. It is important to mention that during those periods the temperatures are lower, so PCM is not performing melting-solidification cycles, and consequently it only increments insulating thermal mass: in order to obtain the best efficiency of the PCM, it needs to change phase every 24 h [46]. From 16:00/17:00 on during February and March in Madrid, the temperature outside increases, something beneficial for a non-insulated construction (it reduces heating load more quickly), as seen in Figure 7. PCM shows beneficial for the months where heating is needed, not only in the first hours of the day, but also in central ones. As stated before, this is because these temperatures help PCM perform melting-solidification cycles, and the greater thermal mass damps thermal conduction through the enclosure.

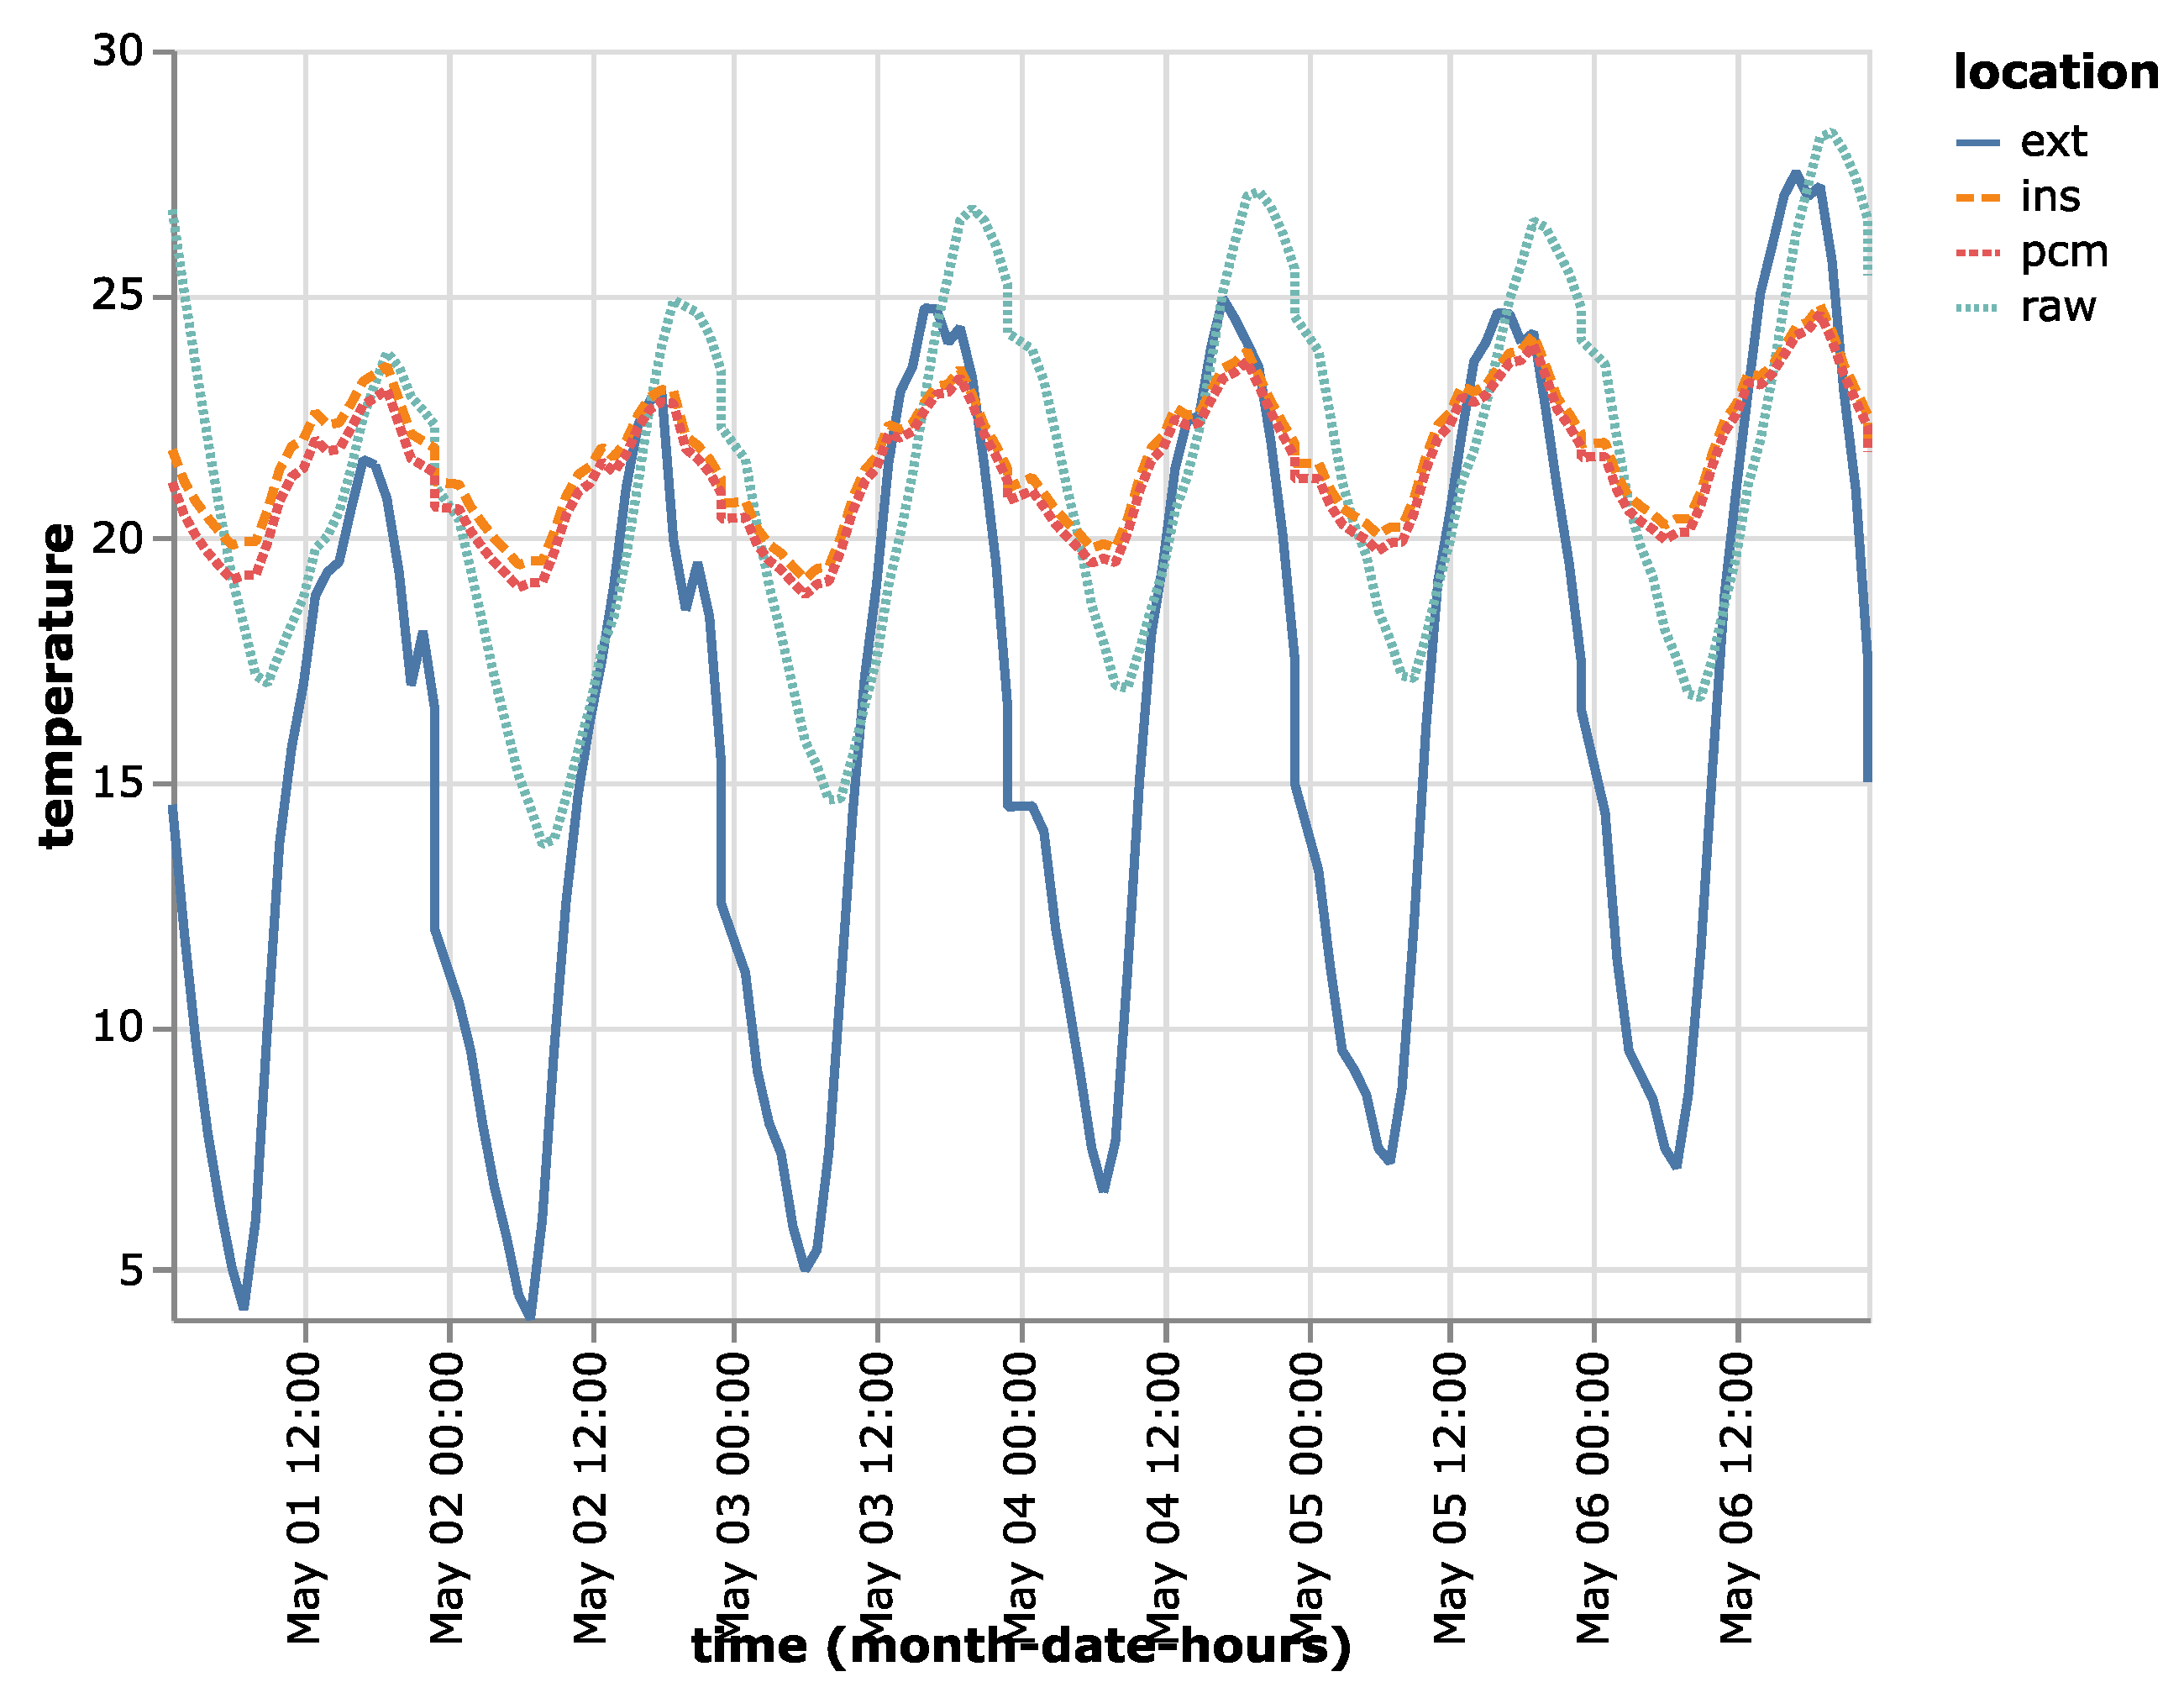
Analysis on Temperature inside the Container

In order to deepen the analysis of the effect of the presence of PCM on thermal comfort and energy demand, the container was simulated under EnergyPlus deactivating the HVAC system. Figure 8 shows the results for Madrid during a week in May, with a one-minute resolution. As shown, the addition of the insulation allows damping internal thermal variations inside the container; it also modifies temperature profile inside the container and in its walls (whether we are using PCM or not). PCM presence increases temperature inside the container by an average of 1 °C because of the thermal mass increment. As for the PCM insulated option, temperature results do not show the moment where the phase change takes places; previous research show that the hysteresis of the PCM melting and solidification process cannot be captured by the EnergyPlus environment [47]. Obtained results indicate a discomfort state: defining discomfort as the difference between comfort temperature (20 °C) and the actual temperature, the addition of the insulation is beneficial.
Table 6 displays average, maximum, minimum temperatures and their variability (SD, or standard variation) for the six locations under analysis. The results confirm what has been previously stated: first, temperatures inside the container are higher and variabilities are lower when the enclosure is insulated; second, peak temperature can be reduced by up to 11.49% (as shown comparing raw results versus PCM-insulated for the Bilbao location), and minimum temperature can grow up to a 50% (Bilbao and Madrid cases). Both results show the positive effect of a passive air-conditioning system (as PCM insulation) on comfort and on the design of a HVAC; peak temperatures (maximum and minimum) have a key impact on HVAC selection.

4. Conclusions

In this research a 1 TEU container refurbished for workshop activities within airports has been thermally analyzed using three different enclosure alternatives: raw (non-insulated), insulated and PCM-insulated. As a general conclusion, the addition of an insulation (with or without PCM) improves the thermal performance of the construction. PCM insulation provides global energy savings in the HVAC system and reduces load during peak hours, compared to traditional insulation. This positive effect is produced not only because PCM presence increases the thermal mass of the enclosure (and, consequently, it modifies the thermal conduction), but also because of the melting-solidification cycles performed by PCM. In the absence of a HVAC system, temperature curves inside the container is clearly damped when the enclosure is insulated. This fact is helpful during the HVAC selection, since it allows the use of a lower-powered system.
Although the presence of PCM generates a positive effect throughout the six selected airports, it was observed that it performs better in certain climates. PCM cannot be considered as solution for all cases and its use or not will depend on climate and the height of the location selected to install the facility. It is important to note that the container was analyzed as a single-standing object; that is, it was assumed that it had no construction of any kind around it. This fact implies that shadow effects, among others, were not considered. In larger facilities, the analysis of constructions resulting from the combination of several containers could be considered, in which case the results could differ.
The results show that the use of PCM in the enclosure increases temperature inside the container in the heating season even with no HVAC. Considering that a 1 °C change in the set-point temperature increases energy consumption by approximately a 7% [48], this solution clearly shows its benefits.

Author Contributions

Conceptualization, E.A. and J.R.R.; Data curation, A.S.-G.; Investigation, M.Á.Á.-F.; Methodology, E.A.; Software, E.A. and A.S.-G.; Validation, P.O.-C.; Writing—original draft, M.Á.Á.-F. and E.A.; Writing—review and editing, P.O.-C. and J.R.R. All authors have read and agreed to the published version of the manuscript.

Funding

This research received no external funding.

Conflicts of Interest

The authors declare no conflict of interest.

References

  1. Edwards, B. The Modern Airport Terminal-New Approaches to Airport Architecture, 2nd ed.; Taylor & Francis: New York, NY, USA, 2005; ISBN 10: 0415248124. [Google Scholar]
  2. Various Applications of Shipping Container Architecture from Around the Globe. Available online: https://www.arch2o.com/applications-shipping-container-architecture (accessed on 20 July 2020).
  3. Ulloa, C.; Arce, M.E.; Rey, G.; Míguez, J.L.; Hernández, J. Recycling COR-TEN® Sea Containers into Service Modules for Military Applications: Thermal Analysis. Energies 2017, 10, 820. [Google Scholar] [CrossRef] [Green Version]
  4. Bertolini, M.; Guardigli, L. Upcycling shipping containers as building components: An environmental impact assessment. Int. J. Life Cycle Assess. 2020, 25, 947–963. [Google Scholar] [CrossRef]
  5. Ventajas de Los Contenedores Marítimos Reciclados. Available online: https://www.concienciaeco.com/2015/01/09/10-ventajas-de-los-contenedores-maritimos-reciclados (accessed on 21 July 2020).
  6. Kotopouleas, A.; Nikolopoulou, M. Thermal comfort conditions in airport terminals: Indoor or transition spaces? Build. Environ. 2016, 99, 184–199. [Google Scholar] [CrossRef] [Green Version]
  7. Tokbolat, S.; Nazipov, F.; Kim, J.R.; Karaca, F. Evaluation of the environmental performance of residential building envelope components. Energies 2020, 13, 174. [Google Scholar] [CrossRef] [Green Version]
  8. 5TRB’s Airport Cooperative Research Program (ACRP) Synthesis 21. In Airport Energy Efficiency and Cost Reduction: A Synthesis of Airport Practice; Transportation Research Board: Washington, DC, USA, 2010. [CrossRef]
  9. Piselli, C.; Romanelli, J.; Di Grazia, M.; Gavagni, A.; Moretti, E.; Nicolini, A.; Cotana, F.; Strangis, F.; Witte, H.J.L.; Pisello, A.L. An Integrated HBIM Simulation Approach for Energy Retrofit of Historical Buildings Implemented in a Case Study of a Medieval Fortress in Italy. Energies 2020, 13, 2601. [Google Scholar] [CrossRef]
  10. Cardona, E.; Piacentino, A.N.; Cardona, F. Energy saving in airports by trigeneration. Part I: Assessing economic and technical potential. Appl. Therm. Eng. 2006, 26, 1427–1436. [Google Scholar] [CrossRef]
  11. Kosmela, P.; Hejna, A.; Suchorzewski, J.; Piszczyk, L.; Haponiuk, J.T. Study on the Structure-Property Dependences of Rigid PUR-PIR Foams Obtained from Marine Biomass-Based Biopolyol. Materials 2020, 13, 1257. [Google Scholar] [CrossRef] [Green Version]
  12. Cabeza, L.F.; Castell, A. Experimental study on the performance of insulation materials in Mediterranean construction. Energy Build. 2010, 42, 630–636. [Google Scholar] [CrossRef]
  13. Ricciu, R.; Besalduch, L.A.; Galatioto, A.; Ciulla, G. Thermal characterization of insulating materials. Renew. Sustain. Energy Rev. 2018, 82, 1765–1773. [Google Scholar] [CrossRef]
  14. Lakatos, A. Comparison of the Thermal Properties of Different Insulating Materials. Adv. Mater. Res. 2014, 899, 381–386. [Google Scholar] [CrossRef]
  15. Çengel, Y.A. Heat Transfer, a Practical Approach, 2nd ed.; McGraw-Hill: New York, NY, USA, 1998; ISBN 0-07-011505-2. [Google Scholar]
  16. European Insulation Manufacturers Association. Available online: https://www.eurima.org/ (accessed on 21 July 2020).
  17. Bhattacharyya, R.K. Heat transfer model for fibrous insulations. In Thermal Insulation Performance; McElroy, D.L., Tye, R., Eds.; ASTM STP 718; American Society for Testing and Materials: Tampa, FL, USA, 1980; pp. 272–286. [Google Scholar]
  18. Leang, E.; Tittelein, P.; Zalewski, L.; Lassue, S. Impact of a composite trombe wall incorporating phase change materials on the thermal behavior of an individual house with low energy consumption. Energies 2020, 13, 4872. [Google Scholar] [CrossRef]
  19. Veiseh, S.; Hakkaki-Fard, A.; Kowsary, F. Determination of the air/fiber conductivity of mineral wool insulations in building applications using nonlinear estimation methods. J. Build. Phys. 2009, 32, 243–260. [Google Scholar] [CrossRef]
  20. Pasupathy, A.; Velraj, R.; Seeniraj, R.V. Phase change material-based building architecture for thermal management in residential and commercial establishments. Renew. Sustain. Energy Rev. 2008, 12, 39–64. [Google Scholar] [CrossRef]
  21. Al-Saadi, S.N.; Zhai, Z. Modeling phase change materials embedded in building enclosure: A review. Renew. Sustain. Energy Rev. 2013, 21, 659–673. [Google Scholar] [CrossRef]
  22. Mofijur, M.; Mahlia, T.M.I.; Silitonga, A.S.; Ong, H.C.; Silakhori, M.; Hasan, M.H.; Putra, N.; Jafari, M. Phase change materials (PCM) for solar energy usages and storage: An overview. Energies 2019, 12, 3167. [Google Scholar] [CrossRef] [Green Version]
  23. Baek, S.; Kim, S. Analysis of thermal performance and energy saving potential by PCM radiant floor heating system based on wet construction method and hot water. Energies 2019, 12, 828. [Google Scholar] [CrossRef] [Green Version]
  24. Adeli, M.M.; Farahat, S.; Sarhaddi, F. Increasing thermal comfort of a net-zero energy building inhabitant by optimization of energy consumption. Int. J. Environ. Sci. Technol. 2019, 17, 2819–2834. [Google Scholar] [CrossRef]
  25. Yun, B.Y.; Park, J.H.; Yang, S.; Wi, S.; Kim, S. Integrated analysis of the energy and economic efficiency of PCM as an indoor decoration element: Application to an apartment building. Sol. Energy 2020, 196, 437–447. [Google Scholar] [CrossRef]
  26. Kośny, J.; Fallahi, A.; Shukla, N.; Kossecka, E.; Ahbari, R. Thermal load mitigation and passive cooling in residential attics containing PCM-enhanced insulations. Sol. Energy 2014, 108, 164–177. [Google Scholar] [CrossRef]
  27. Lee, K.O.; Medina, M.A.; Raith, E.; Sun, X. Assessing the integration of a thin phase change material (PCM) layer in a residential building wall for heat transfer reduction and management. Appl. Energy 2015, 137, 699–706. [Google Scholar] [CrossRef]
  28. Wang, H.; Lu, W.; Wu, Z.; Zhang, G. Parametric analysis of applying PCM wallboards for energy saving in high-rise lightweight buildings in Shanghai. Renew. Energy 2020, 145, 52–64. [Google Scholar] [CrossRef]
  29. Dobrzycki, A.; Kurz, D.; Mikulski, S.; Wodnicki, G. Analysis of the Impact of Building Integrated Photovoltaics (BIPV) on Reducing the Demand for Electricity and Heat in Buildings Located in Poland. Energies 2020, 13, 2549. [Google Scholar] [CrossRef]
  30. Wijesuriya, S.; Brandt, M.; Tabares-Velasco, C. Parametric analysis of a residential building with phase change material (PCM)-enhanced drywall, precooling, and variable electric rates in a hot and dry climate. Appl. Energy 2018, 222, 497–514. [Google Scholar] [CrossRef]
  31. Kong, X.; Wang, L.; Li, H.; Yuan, G.; Yao, C. Experimental study on a novel hybrid system of active composite PCM wall and solar thermal system for clean heating supply in winter. Sol. Energy 2020, 195, 259–270. [Google Scholar] [CrossRef]
  32. Sang, Y.; Zhao, J.R.; Sun, J.; Chen, B.; Liu, S. Experimental investigation and EnergyPlus-based model prediction of thermal behavior of building containing phase change material. J. Build. Eng. 2017, 12, 259–266. [Google Scholar] [CrossRef]
  33. Jin, X.; Medina, M.A.; Zhang, X. Numerical analysis for the optimal location of a thin PCM layer in frame walls. Appl. Therm. Eng. 2016, 103, 1057–1063. [Google Scholar] [CrossRef] [Green Version]
  34. Arıcı, M.; Bilgin, F.; Nižetić, S.; Karabay, H. PCM integrated to external building walls: An optimization study on maximum activation of latent heat. Appl. Therm. Eng. 2020, 165, 114560. [Google Scholar] [CrossRef]
  35. Liu, Y.; Wang, M.; Cui, H.; Yang, L.; Liu, J. Micro-/macro-level optimization of phase change material panel in building envelope. Energy 2020, 195, 116932. [Google Scholar] [CrossRef]
  36. Khan, R.J.; Bhuiyan, M.Z.H.; Ahmed, D.H. Investigation of heat transfer of a building wall in the presence of phase change material (PCM). Energy Built Environ. 2020, 1, 199–206. [Google Scholar] [CrossRef]
  37. Prabhakar, M.; Saffari, M.; De Gracia, A.; Cabeza, L.F. Improving the energy efficiency of passive PCM system using controlled natural ventilation. Energy Build. 2020, 110483. [Google Scholar] [CrossRef]
  38. Bendic, V.; Dobrotă, D. Theoretical and experimental contributions on the use of smart composite materials in the construction of civil buildings with low energy consumption. Energies 2018, 11, 2310. [Google Scholar] [CrossRef] [Green Version]
  39. Dombaycı, Ö.A. Degree-days maps of Turkey for various base temperatures. Energy 2009, 34, 1807–1812. [Google Scholar] [CrossRef]
  40. Marin, P.; Saffari, M.; de Gracia, A.; Zhu, X.; Farid, M.M.; Cabeza, L.F.; Ushak, S. Energy savings due to the use of PCM for relocatable lightweight buildings passive heating and cooling in different weather conditions. Energy Build. 2016, 129, 274–283. [Google Scholar] [CrossRef] [Green Version]
  41. Tabares-Velasco, P.C.; Christensen, C.; Bianchi, M.; Booten, C. Verification and Validation of EnergyPlus Conduction Finite Difference and Phase Change Material Models for Opaque Wall Assemblies. US Dep. Energy Off. Sci. 2012, 55. [Google Scholar] [CrossRef] [Green Version]
  42. New Thermal Mass Solution for Low Inertia Buildings. Available online: http://www.edsl.myzen.co.uk/downloads/misc/DuPont%20ENERGAIN(r)%20PCM%20Guidebook_December%202010.pdf (accessed on 29 August 2020).
  43. Energy Plus. U.S. Department of Energy. Available online: https://energyplus.net/documentation (accessed on 30 August 2020).
  44. De Gracia, A. Dynamic building envelope with PCM for cooling purposes–Proof of concept. Appl. Energy 2019, 235, 1245–1253. [Google Scholar] [CrossRef]
  45. Kośny, J.; Yarbrough, D.W. Use of PCM enhanced insulation in the building envelope. J. Build. Enclos. Design. 2008, 5, 55–59. [Google Scholar]
  46. Kośny, J. An Application of Phase Change by Finite Element and Materials in Building Envelopes and Internal Structures. In PCM-Enhanced Building Components; Springer International Publishing: Basel, Switzerland, 2015. [Google Scholar] [CrossRef]
  47. Shrestha, S.; Miller, W.; Stovall, T.; Desjarlais, A.; Childs, K. Modeling PCM-enhanced insulation system and benchmarking EnergyPlus against controlled field data. In Proceedings of the Building Simulation, Sydney, Australia, 14–16 November 2011; pp. 800–807. [Google Scholar]
  48. Ministry for Ecological Transition and Demographic Challenge; Institute for Energy Diversification and Saving (IDAE). Energy Guide: Efficient and Responsible Consumption. Available online: http://guiaenergia.idae.es/ (accessed on 5 September 2020).
Figure 1. Köppen–Geiger climate classification for Spain and selected airport locations.
Energies 13 05263 g001
Figure 2. Container model geometry.
Energies 13 05263 g002
Figure 3. Enclosed models used for simulation.
Energies 13 05263 g003
Figure 4. Energy savings comparison among the selected airport locations.
Energies 13 05263 g004
Figure 5. Monthly energy demand for heating and cooling for every location.
Energies 13 05263 g005
Figure 6. Thermal demand accumulated savings and losses within the container: a comparison between PCM and traditional insulation for an airport at Madrid.
Energies 13 05263 g006
Figure 7. Thermal demand accumulated savings and losses within the container: a comparison between PCM and raw for an airport at Madrid.
Energies 13 05263 g007
Figure 8. Temperature evolution inside the container during a week in May (Madrid) without HVAC.
Energies 13 05263 g008
Table 1. Airport locations description. Reproduced from [17], ASTM International, 1980.
LocationLatitudeLongitudeElevation (m)Köppen ClimateHDD18 (°C·Days/Year)CDD18 (°C·Days/Year)
Alicante38.28−0.5643BSh8411120
Bilbao43.30−2.9342Cfb1505467
La Coruña43.30−8.38100Csb1683240
Las Palmas27.94−15.3923BWh811258
Madrid40.49−3.59610Csa19321078
Valencia39.49−0.4873BSk10281142
Table 2. PCM DuPont™ Energain® characteristics. Reproduced from [20], Elsevier: 2008.
Thickness0.0053 (m)
Thermal conductivity:
Solid (T < 21.7 °C)0.018 (W/m·K)
Liquid (T > 21.7 °C)0.014 (W/m·K)
Density855 (kg/m3)
Specific heat2500 (J/kg·K)
Table 3. Construction materials details.
CategoryMaterials
ElementConductivity
(W/m·K)
Specific Heat
(J/kg·K)
Layer Thickness
(mm)
External wallStainless steel174600.5
Polyurethane (PUR)0.0221400250
Stainless steel174600.5
Glass wool0.04795563.5
Plasteboard0.251000100
PCM DuPont™ Energain®0.018250053
GroundExtruded polystyrene0.0341540300
RoofStainless steel174600.5
Glass wool0.04795563.5
Plaster (ceiling)0.251000150
PCM DuPont™ Energain®0.018250053
DoorStainless steel174600.5
Polystyrene0.181500250
Stainless steel174600.5
Table 4. Yearly power demands under different insulating conditions.
Energy RequiredHeating (kWh)Cooling (kWh)
CityRawInsulationInsulation + PCMRawInsulationInsulation + PCM
Alicante1417822788642465457
Bilbao297117771706613433
La Coruña256615501487554342
Las palmas1919183594392387
Madrid293317081640611366352
Valencia183410831039453312307
Table 5. Heating and cooling peak for a year time frame in every airport location.
Energy RequiredHeating (kWh)Cooling (kWh)
CityRawInsulationInsulation + PCMRawInsulationInsulation + PCM
Alicante0.930.490.471.010.590.58
Bilbao1.110.600.580.560.170.15
Coruña0.880.520.510.320.110.10
Las Palmas0.410.180.170.750.410.41
Madrid1.460.730.711.240.600.58
Valencia0.980.520.510.900.530.52
Table 6. Yearly temperature evolution summary inside the container for the three different enclosures and the selected locations.
EnclosureRaw (°C)Insulation (°C)Insulation + PCM (°C)
CityMSDMaxMinMSDMaxMinMSDMaxMin
Alicante20.935.9834.708.2120.975.6332.4810.3321.015.6332.5310.49
Bilbao15.645.0829.385.3115.964.6826.247.7716.014.6626.017.96
Coruña16.364.3827.377.3816.553.9725.758.9616.593.9625.699.04
Las Palmas23.833.1932.0515.8523.682.8129.7817.8523.732.7929.8517.93
Madrid17.428.8038.350.1617.838.1535.414.0417.878.0935.384.15
Valencia19.436.0833.717.0719.635.7131.619.7019.685.7031.639.83
Note: M: mean; SD: Standard deviation; Max: Maximum; Min: Minimum.

