1. Introduction
Nowadays, the energy sector scenario is dynamically characterized by increasing energy demands, measures to reduce the environmental impact of energy use, and the penetration of renewable energy sources. These are only some of the driving forces ruling the new concepts and paradigms of the energy sector, since, besides them, sustainable development is also present [
1], as well as new technological challenges [
2]. All of these factors are affecting significantly the energy sector, adapting it to the requirements concerning energy efficiency, renewable energy utilization, and emission reduction.
The indiscriminate use of conventional fossil fuels started to be reduced or even abandoned in different energy generation applications in favor of renewable energy sources, which are more and more frequently adopted, since they are reliable alternatives [
3]. However, this trend is producing new challenges in the proper design of energy systems due to the intrinsic properties of renewables, such as variability and intermittency [
4], which determine that they are more difficult to adopt from the technical point of view, with respect to more programmable and manageable conventional energy sources. Moreover, another aspect that must to be taken into account is a relatively low energy density [
5], characterizing especially solar and wind energy applications.
Hybrid systems can be adopted in order to reduce the problems related to each renewable energy source by means of the combination of two or more energy sources [
6]. Hybrid installations are more frequently used for medium- and large-scale energy applications compared to small- and micro-scale ones. However, small-scale hybrid renewable energy systems are interesting from the point of view of distributed generation applications [
7]. In the field of possible choices, energy systems based on biomass are very interesting, since their advantages are a high potential of heat generation, the possibility of electrical energy production, and a relatively high energy source availability [
8]. Technologies adopting biomass as fuel are implementable in cogeneration and trigeneration systems because, in most of cases, they are technologically similar from the basic operation point of view to conventional systems based on fossil fuels. Moreover, systems integrating biomass with other renewable energy sources in hybrid configuration allows one to attain advantages, in terms of operation, environmental impact, and energy and economic performance [
9].
The topic concerning hybrid biomass-based energy systems in small and micro scale applications is not exhaustively stressed out in scientific literature, especially considering the hybridization with wind energy. An organic Rankine cycle (ORC) fueled with biomass and coupled with a wind turbine in an integrated system is investigated in Reference [
10]. The plant is divided in sub-systems producing electrical and thermal energy for a low energy consuming residential building with 40 apartments. The study is performed to determine the size of the components and to assess the capability of matching the user demand as a function of different operation modes: full biomass, full wind, and two hybrids with different wind turbines and ORC units. The results show that the ORC unit can be deactivated or can operate at partial load when the wind turbines output is significant. Moreover, the adoption of the hybrid systems determine a biomass saving, up to 50%, and a significant reduction between 40% and 70% of the electric energy surplus compared to a fully biomass system.
The integration of hybrid biomass-wind systems is also investigated for microgrids under stand-alone operation mode. A 100 kW wind turbine and a 150 kW biomass gasifier coupled with an electrical energy storage are considered in Reference [
11] for a case study of a village in India. The system energy-economic analysis and optimization are performed with HOMER software from the point of view of system sizing and operation on the basis of real-time load demand data. The authors show that the wind-biomass gasifier system achieves a lower cost of energy (
$0.078) compared to the one obtainable with a more conventional wind-diesel engine system (
$0.165).
A hybrid system including wind turbine, a biogas electrical energy generator, and photovoltaic panels is investigated in Reference [
12] with the aim to determine its capability to supply thermal and electrical energy for a typical household in the United Kingdom. The study is based on energy consumption data, while HOMER tool is used to find the optimal configuration of the system on the basis of a thermoeconomic analysis. According to the study, the most feasible system allowing one to match the user demands is a configuration of a 1 kW wind turbine, one 1 kW biogas generator set and four 2.52 kWh battery units. With this configuration, the lowest value of levelized cost of energy is achieved (0.588
$/kWh).
Further hybridization of biomass-wind systems is investigated in Reference [
13], where the production of additional electrical energy is achieved by means of photovoltaic panels. In the study, a multi-objective optimization is carried out from the economic and environmental point of view using life cycle criteria and a genetic algorithm. The performed analysis points out that the environmental and economic optimization criteria are not convergent, because the lower is the environmental impact of systems running on renewables, the higher is the cost of the system. An interesting result is that wind power source has a higher impact on the system performance due to a lower cost and lower environmental impact compared to biomass and solar energy. Moreover, a 50% emission reduction may be achieved compared to the reference solution characterized by a higher environmental impact and minimum cost when an increase of 5% in investment cost is considered. A microgrid biomass combined heat and power (CHP) system is investigated in Reference [
14]. Here, the investigated system includes small-scale wind turbines, biomass gasifier, gas storage, photovoltaic modules, battery storage, thermal energy storage, and auxiliary boilers. In the study, the design and scheduling of the CHP system is performed by means of an economic linear programming model with a sliding time window for a case study consisting of a grid-connected microgrid user in Davis, California. The results show that for the assumptions used, a biomass CHP system coupled with photovoltaic panels with battery is the most cost-effective design solution. Furthermore, a grid connected hybrid microgrid system based on wind, photovoltaics and biomass under Pakistan conditions is assessed in terms of techno-economic feasibility and potential for electricity generation in Reference [
15]. HOMER Pro software is used to model and optimize the system from the point of view of system robustness and cost-effectiveness of the proposed hybrid microgrid system. The results are carried out taking into account the cost of energy based on peak load of residential and commercial demand profiles. In the paper, the cost of the 73.6 MW hybrid system is estimated in 180.2 M
$ and the levelized cost of energy in 0.05744
$/kWh.
As shown by the literature review, the research topic concerning small and micro-scale hybrid biomass-wind systems in scarcely explored, especially in the field of complex energy-economic assessment of such systems by means comprehensive dynamic simulations. Therefore, in the paper the analysis and sensitivity analysis of a novel micro-scale trigeneration system based on biomass combustion, water steam cycle, absorption chiller, and wind turbine are performed. The results presented in this paper are the continuation of the work carry out by the author in a previous work [
16]. This is the first time in literature when the proposed system is investigated, since there are no paper is literature concerning such topic.
The study is carried out using Transient System Simulation (TRNSYS) software allowing one to analyze the system performance and to perform optimizations on the basis of transient simulation. In the paper, the system layout and operation are presented along with the description of the main model. The considered case study consists of farm with household under Polish weather condition. Daily, weekly, and yearly results and a sensitivity analysis as a function of the steam and wind turbine power are presented and discussed. Finally, a summary of the results and the conclusion are provided.
2. System Layout and Operation Principle
In the proposed hybrid system (
Figure 1), the electrical energy is produced by a steam turbine running in a conventional Rankine cycle and a wind turbine. Concerning thermal energy, during the winter period, the thermal energy rejected by the condenser is supplied to the heating system of the user by means of a storage tank, whereas, during the cooling period, heat is supplied to a LiBr-H
2O single stage absorption chiller for space cooling
The proposed system consists of several loops and components as described in
Table 1.
Apart from the components listed in the table, the layout also includes components used to manage the flows in the system, as condensate (P2) and circulation pumps (P1, P3–P9), flow diverters (D), and mixers (M).
The operation strategy of the system is the following. The thermal oil (Boiler Fluid, BF) is heated up to 230 °C and produces steam through a steam generator heat exchanger (SGHX) at a pressure and a temperature of 8.0 bar and 200 °C, respectively. Steam is condensed by a condenser (COND), which rejects heat to the stratified thermal storage tank (TK). Once the returning temperature of Hot Water (HW) from TK rises above 85 °C, auxiliary counter flow heat exchanger (AHX) is activated in order to control the operation of COND. In this way, the heat produced in excess is dissipated through the dry cooler (DC) in case of a thermally loaded TK. The amount of steam produced, and thus the electrical and thermal energy output of the cycle, is managed by the variable speed pump P1 used to set the flow rate of the thermal oil. A proportional control strategy is implemented as a function of the tank top temperature: the thermal oil flowrate is set to 30% of the nominal one when the temperature increase to 90 °C, while the pump runs at nominal flow (100%) when the temperature drops to 85 °C. In such a way, a thermally load following strategy of the trigeneration system is implemented. Moreover, auxiliary (AUX) is activated in order to match the user thermal demand when the tank temperature drops to 80 °C, increasing it to 90 °C. The LiBr-H2O single stage absorption chiller producing chilled water (ACH) is supplied by TK in order to produce chilled water at 7 °C, while DC is connected to ACH in order to dissipate the rejected heat. Concerning the electrical power, both steam turbine (ST) and wind turbine (WT) output is supplied to the user or to the grid depending on the demand of the user. The electrical energy produced in excess is virtually stored in the grid and it can be used when power is required from the grid as a function of on the user demand.
4. Case Study
The case study consists of a farm with two halls and a household, which structure is shown in
Figure 2. Each hall has an area of 500 m
2 and height between 3.5 to 5.5 m, while the household ground floor area and height are 100 m
2 and 2.7 m, respectively. The SketchUP tool and TRNSYS3d plug-in [
17] are used to develop the model of the building. The components of the building, as walls, roofs and floors, are modelled using several series of layers (omitted for brevity), with thermal transmittances reported in
Table 3.
The periods from October 15 to March 31 and from May 1 to September 15 are assumed for the operation of the space heating and cooling, respectively, with a 24/24 h daily schedule. The air temperature is set to 20 °C during winter and to 26 °C during summer. In order to model the building thermal behavior, typical thermal loads regarding equipment, lights, fresh air infiltration, etc., are considered. In particular, the supply of fresh air in the buildings is set in 3 Vol/h for the hall while for the household is 0.3 Vol/h. The Meteonorm weather data [
32] for Gdansk, located in Northern Poland, are selected from the TRNSYS 17 software database in order to simulate the climatic conditions [
17]. Such data take into account for the mean weather conditions of the selected locality (temperature, humidity, wind speed, solar radiation, etc.) and are determined on the basis of at least 10 years of observations. The heating and cooling demand of the user are reported in
Figure 3.
For the electrical energy demand, standard profiles available for users similar to the one here investigated are adopted [
33]. The profiles are developed on the basis of standard daily electrical energy demands for two yearly periods, namely period 1 and 2, occurring from October to March and from April to September, respectively, and for workdays, Saturdays and Sundays/holidays. Such profiles are shown in
Figure 4. In particular, the profiles are implemented performing a normalization of the data; thus, the integral over the entire year of the dynamic profile is equal to 1.0 MWh. On the basis of the described profiles, the yearly consumption is set to 50 MWh [
34].
The main parameters adopted to simulate the system are reported in
Table 4. It is crucial to note that the adopted parameters are selected on the basis of simple design criteria taking into account the thermodynamic properties of the cycle, manufacturer data and the necessity of meeting the user energy demand by the proposed system. Along with this approach, the design of the system is performed relating some of the parameters to each other in order to achieve a proper sizing of the system and to ensure the desired cycle thermodynamic parameters. In particular, the boiler capacity and the thermal oil mass flow rate are selected taking into account the maximum cycle temperature and pressure and the steam turbine nominal power that must to be achieved.
5. Results and Discussion
The developed dynamic simulation model allows one to generate results in terms of variables trends (temperature, powers, etc.) and integrated variables. However, for reasons of brevity, in the context of this paper only some of the main results are presented, as daily results in terms of temperature and powers, weekly energy flows and yearly energy and economic results. Moreover, a sensitivity analysis is carried out as a function of different capacities of both steam turbine and wind turbine units. All the results presented in this paper are based on simulations performed with a 0.05 h time step for an entire year period (0–8760 h).
5.1. Daily Temperature and Power Trends for a Representative Summer Day
The trends of the outlet temperatures of the main system components for the selected representative day of 25th July, occurring from 4920 to 4944 h of the year, are shown in
Figure 5. Here, it is clearly shown that the steam system allows one to ensure a stable temperature of the water stream at the outlet of ST (96.7 °C), due to the constant temperature generated by the boiler (230 °C—not reported for sake of clarity of the figure). This is achieved because the control strategy of the boiler operates in order to fix the outlet temperature of the working fluid to the desired set point. After the passage through COND, the condensate temperature decreases to 95.0 °C during the night hours and to 91.7 °C in the central and second part of the day, due to the variability of the thermal demand of the user (TK temperature).
During the first day hours, the temperature in the top part of TK remains stable due to relatively low thermal demand of the user, as well as the outlet temperature of AHX operating in order to dissipate the heat in excess. During the day the tank temperature decreases from about 89.7 to 81.0 °C as a function of the user thermal demand for space cooling, and when the tank temperature approaches to 85.0 °C at about 12:00 am, AUX is activated in order to avoid an excessive temperature decrease for the operation of ACH. During the day, the chiller operates on order to maintain the set point temperature of the chilled water supplied to the user at 8 °C. This condition is achieved because an adequate thermal input to ACH is provided by TK and AUX and the temperature at the inlet of ACH generator is within the nominal range. On the other side, the returning temperature from the user cooling system varies up to 16.8 °C.
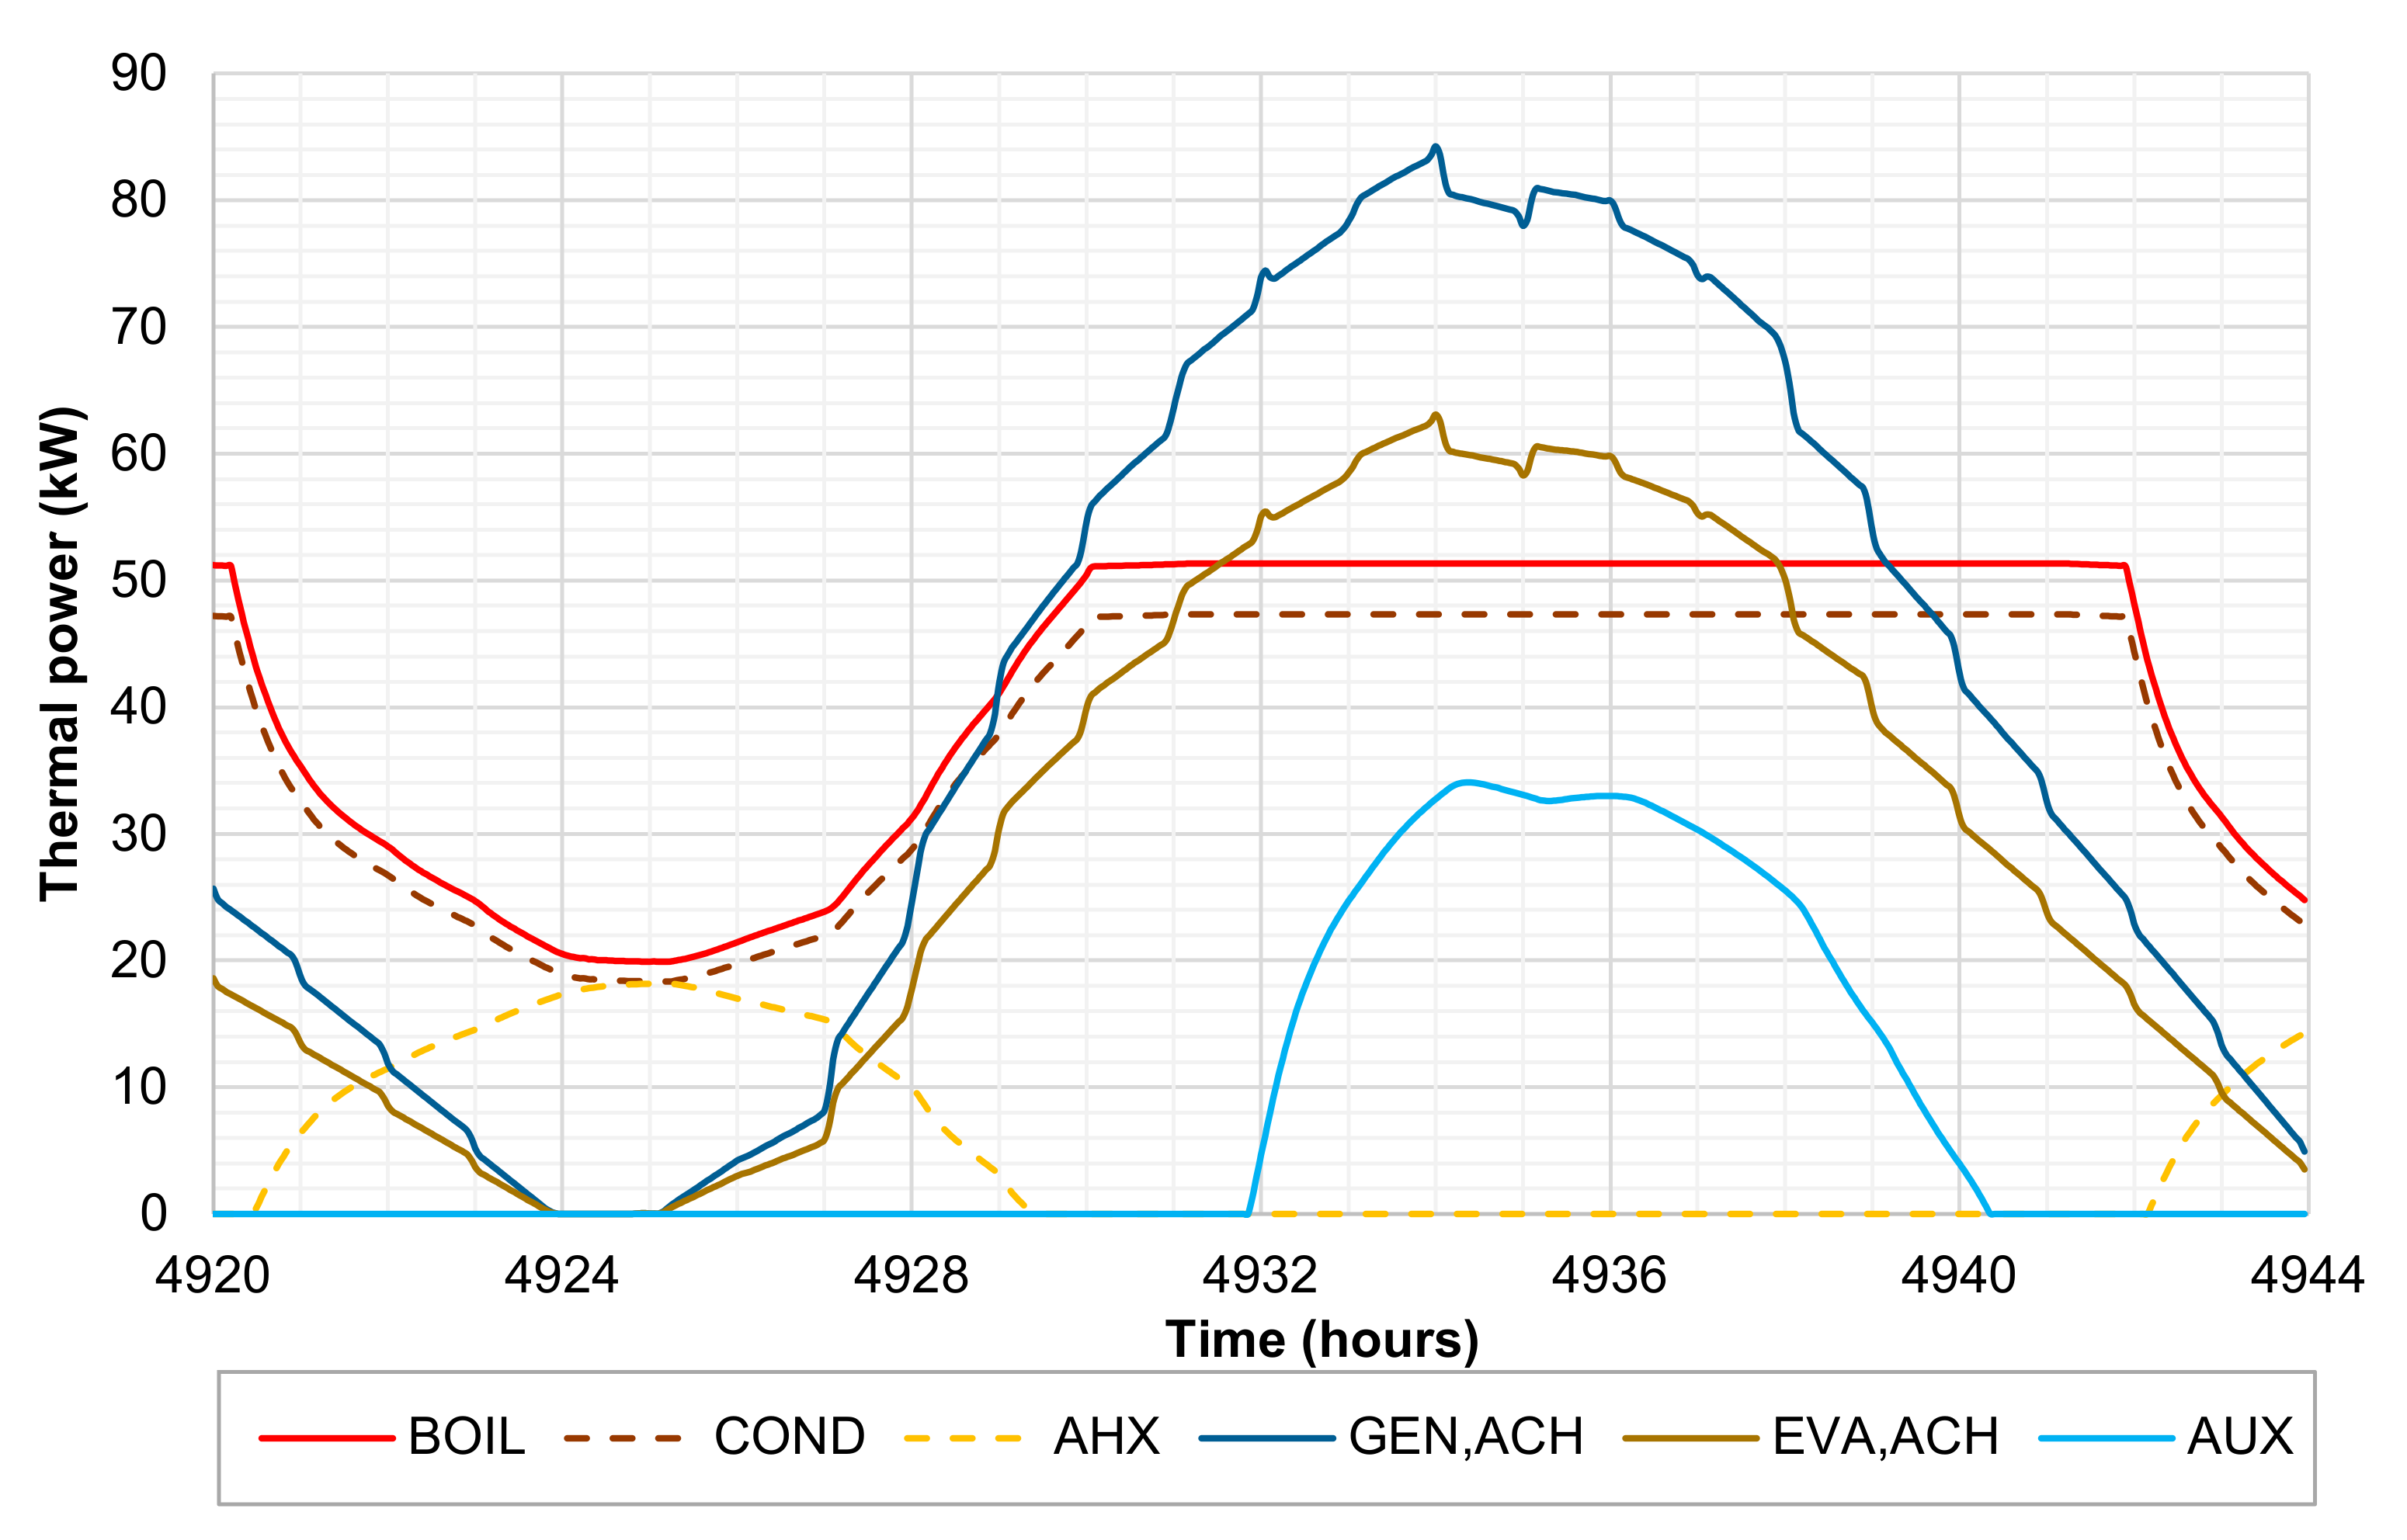
The thermal power trends reported in
Figure 6 clearly show the above-presented operation of the system. The operation of the boiler is characterized by a reduction of the heat supplied in the night hours, when the stem cycle system operates mainly for the production of electrical energy, since the main part of the thermal power rejected by COND is dissipated by the auxiliary heat exchanger AHX. As expected, when the user cooling demand decreases to zero, the thermal power dissipated by AHX (and DC) reaches the maximum value. This occurs also because in this period the storage tank TK is thermally loaded and no additional heat can be stored within it.
The variability of the thermal powers in the system depends on the thermal demand of the absorption chiller generator, indeed the thermal load following strategy of the system adjusts the load of steam cycle depending on heat required by the absorption chiller. In the second part of the day, the activation of the auxiliary heating of TK by AUX is performed providing up to 34 kW in order to increase temperature at the outlet of TK to 85.0 °C.
The dynamic operation of the system from the electrical point of view is reported in
Figure 7.
The steam turbine starts to operate at partial load during the night hours, with a reduction of the power output to 1.5 kW due to the reduced steam flow and biomass boiler operation at reduced capacity. However, in the morning the cooling demand starts to increase determining an increase of ST output up to the nominal value of 4.0 kW. It is worth noting that the full load operation of ST is achieved before the cooling demand reaches the maximum value in the first evening hours. This is due to the choice of undersize the ST system capacity with respect to the user thermal demand, which is performed in order to limit the thermal energy dissipated. For the selected day, the electrical power produced by the system matches the user electrical demand in the first part of the day, where also some electrical power is supplied to the grid. This is achieved despite the partial load operation of the steam cycle since the wind turbine power output is relatively high. In fact, the circumstance of favorable wind conditions determines an increase of the energy yield from the wind exactly when ST operates at reduced load. Furthermore, once the user electrical demand increases above the power produced by the system at 11:00 am, the electrical energy stored virtually in the grid during the night hours starts to be used to match the demand. Under this operation condition, the system works without using net grid energy for several hours (about 7.5 h in the selected day), until the consumption of the virtually stored energy stops just before 7:00 pm.
5.2. Weekly Energy Flows
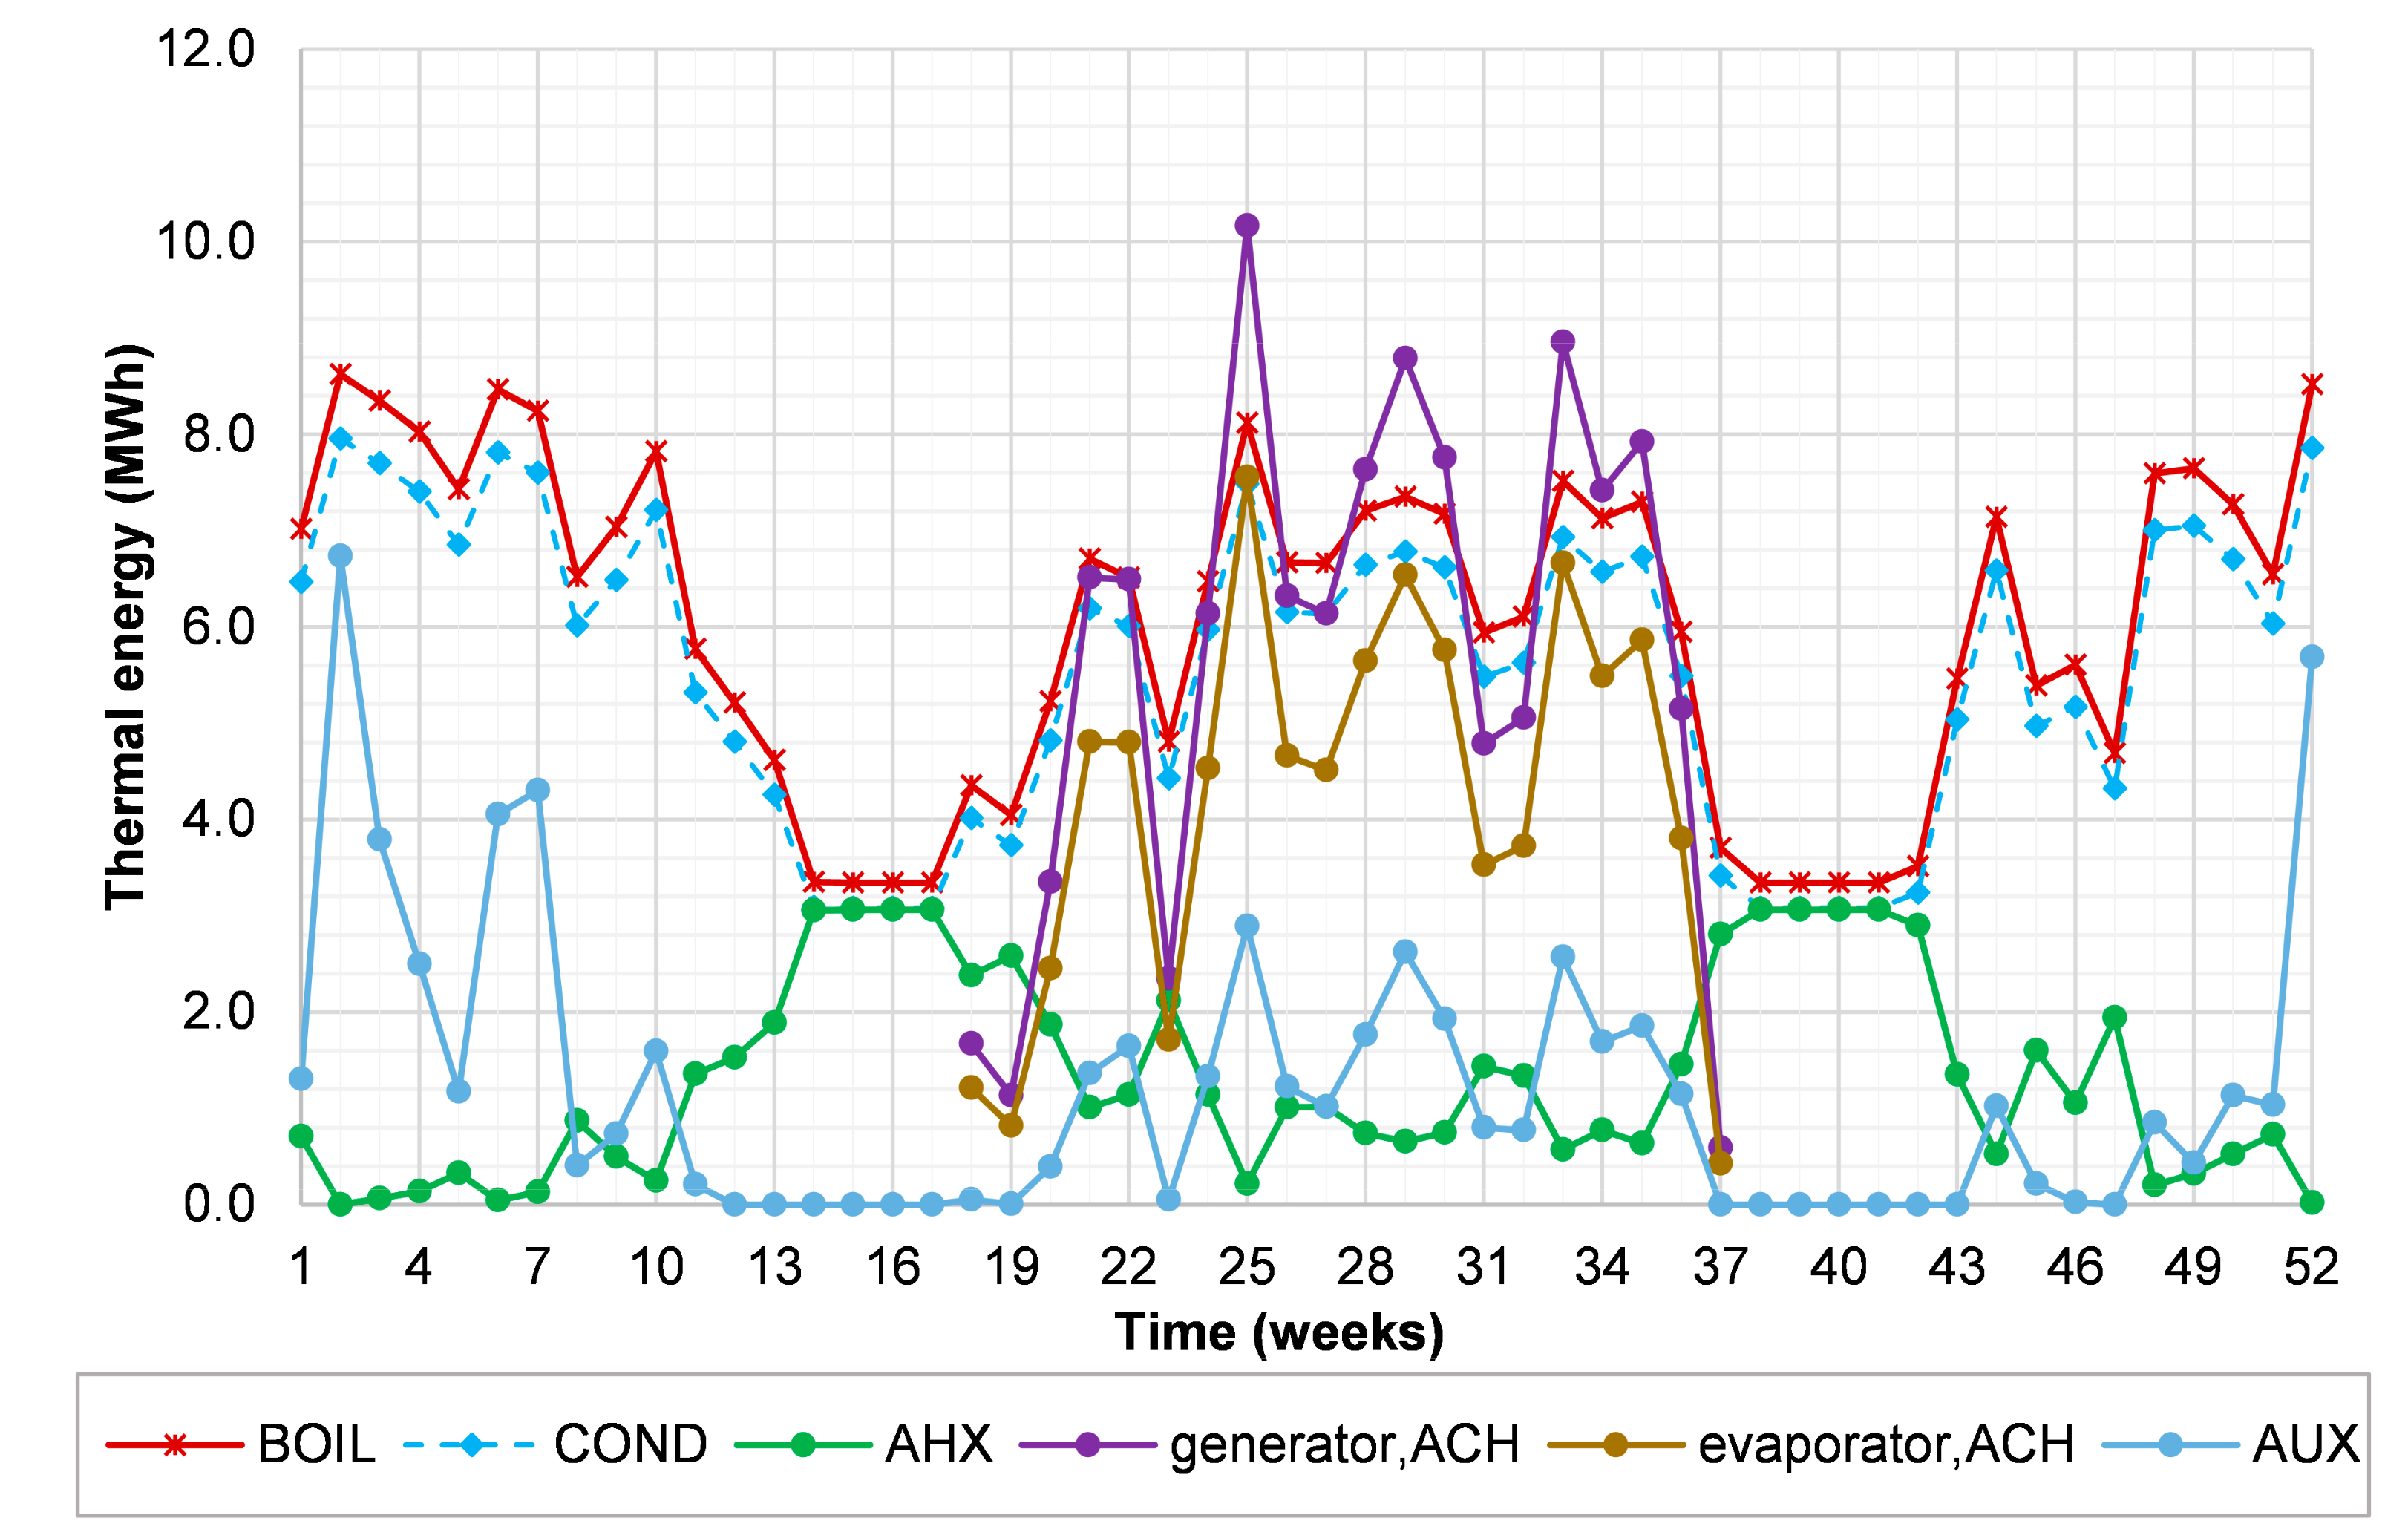
The weekly thermal energy flows of the system are presented in
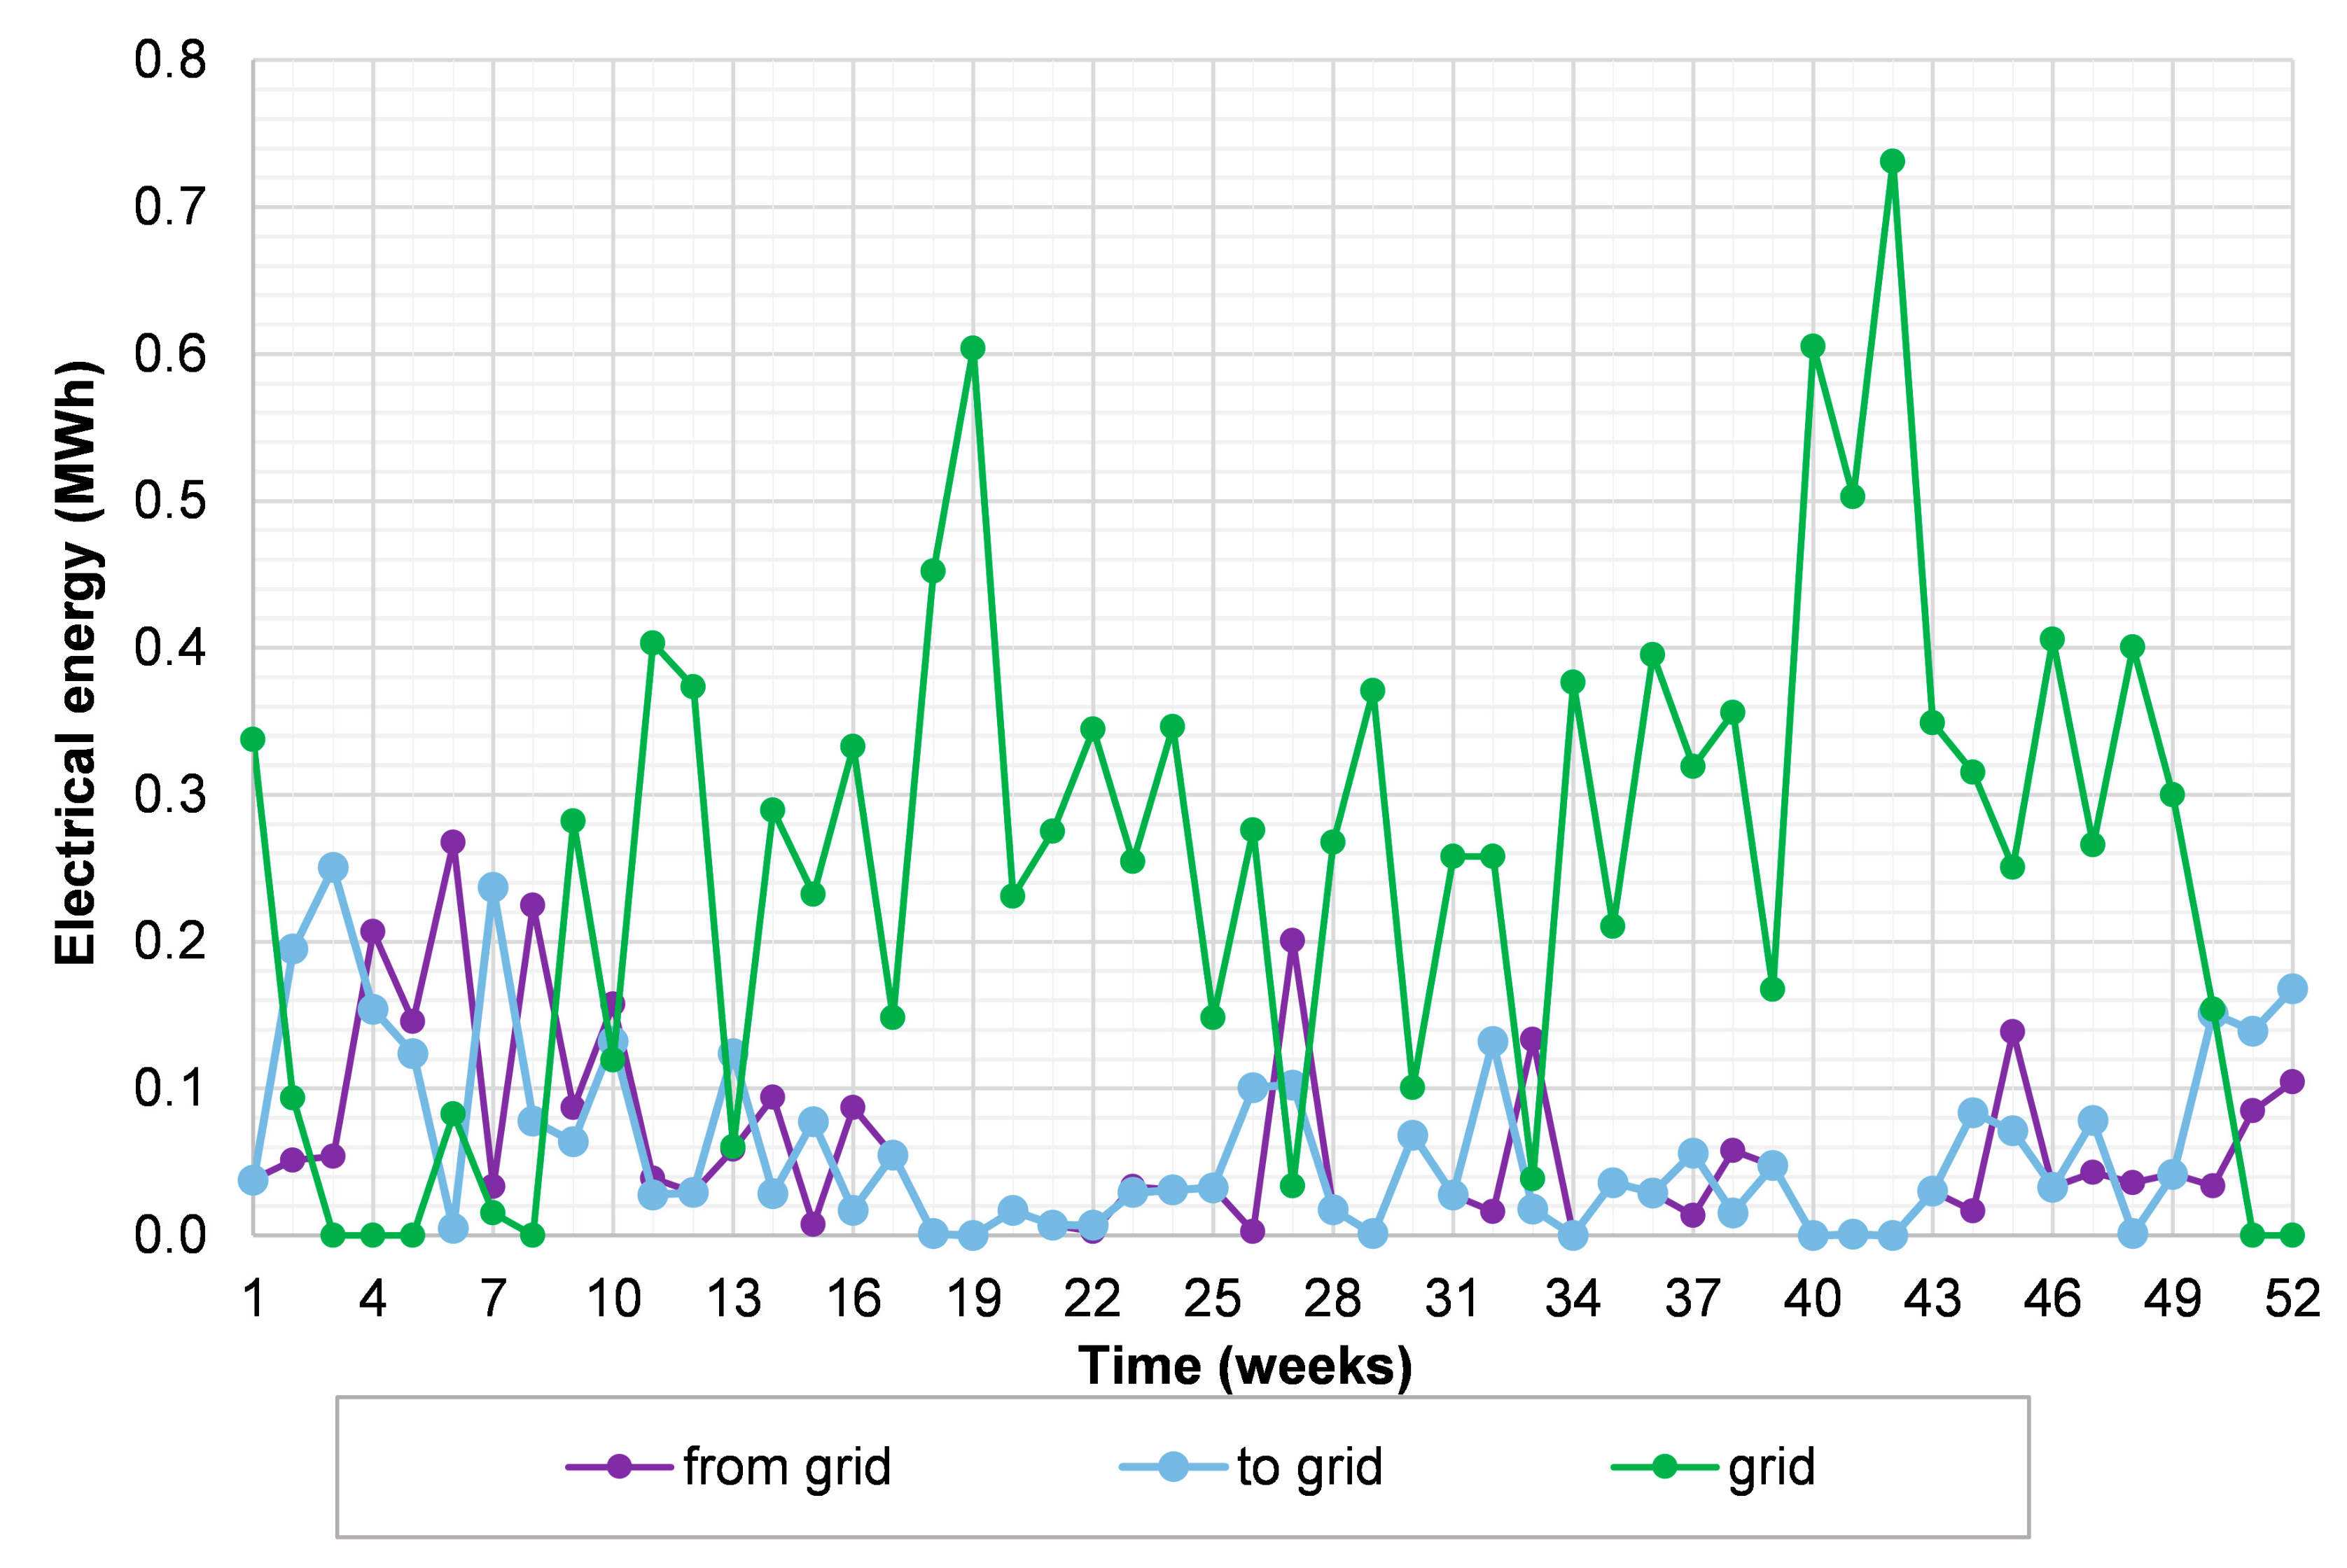
Figure 8, while the electrical ones in
Figure 9 and
Figure 10. During winter the thermal energy rejected by COND is higher compared to the one occurring in the cooling season since the heat demand of TK to match the user heating load is higher in winter. In particular, the thermal energy provided to the steam cycle decreases when approaching to the mid-seasons, during which the user thermal demand drops to zero (deactivated space conditioning). In the mid-season, the weekly thermal energy rejected by COND decreases of 61.2% with respect to the maximum value of 8.62 MWh achieved in the second week of the year.
During the year, the activation of AUX for the auxiliary heating of water exiting TK is mandatory during almost all the weeks of space conditioning operation, since the thermal power supplied by COND is not adequate to maintain TK within the fixed temperature range. In particular, AUX operation is required more frequently in the winter season comparted to the summer one, according to the different magnitude of the heating and cooling demand. Looking at the results it can be found that the auxiliary thermal energy dissipated in winter is 48.2% higher compared to the one during summer (25.1 MWh).
It is worth noting that the thermal energy dissipated by AHX during the winter is relatively lower compared to the one dissipated during summer. This occurs because the heating demand of the user is present during almost all the time in winter days, while in the cooling period the space cooling demand is present during sunlight hours. Therefore, the use of the rejected thermal energy by COND is more limited by the space cooling demand compared to the heating one.
The same trend of the thermal energy rejected by COND is achieved for the electrical energy produced by ST. Indeed, the higher is the required thermal output of the steam cycle, the higher is the mass flowrate of steam as well as the work produced. The electrical energy produced weekly by ST varies significantly over the year, from 2.62 MWh during the mid-seasons to 6.72 MWh during winter, outlining that it operated often at reduced load. The wind turbine energy output is higher during the winter due to the more abundant availably of wind energy in such period. In fact, its mean energy yield is 0.37 and 0.21 MWh/week in winter and summer, respectively. Moreover, it is interesting to note that during some summer weeks, WT energy yield decreases almost to zero, due to limited availability of wind energy.
The electrical energy supplied by the system to the grid as virtual storage is relatively higher in the winter weeks compared to the summer ones, and this trend is justified by the operation of ST at a higher load and by a higher wind availability. The amount of excess energy in winter is meanly 1.6 times higher than the summer one. Furthermore, analyzing the trend of the energy recovered in the frame of grid virtual storage operation it can be observed that the energy is almost entirely recovered just after each period of time in which is produced by the system. This is observable, for example, between the second and fifth week of the year. The electrical energy supplied by the grid, apart from the virtual storage operation, is significant for almost all the weeks of year, whereas it drops to zero in some winter weeks, where both ST and WT operate at high load. During the year, the grid, taking into account the possibility of energy recovery, matches between 17.1 and 71.8% of the total weekly electrical energy demand.
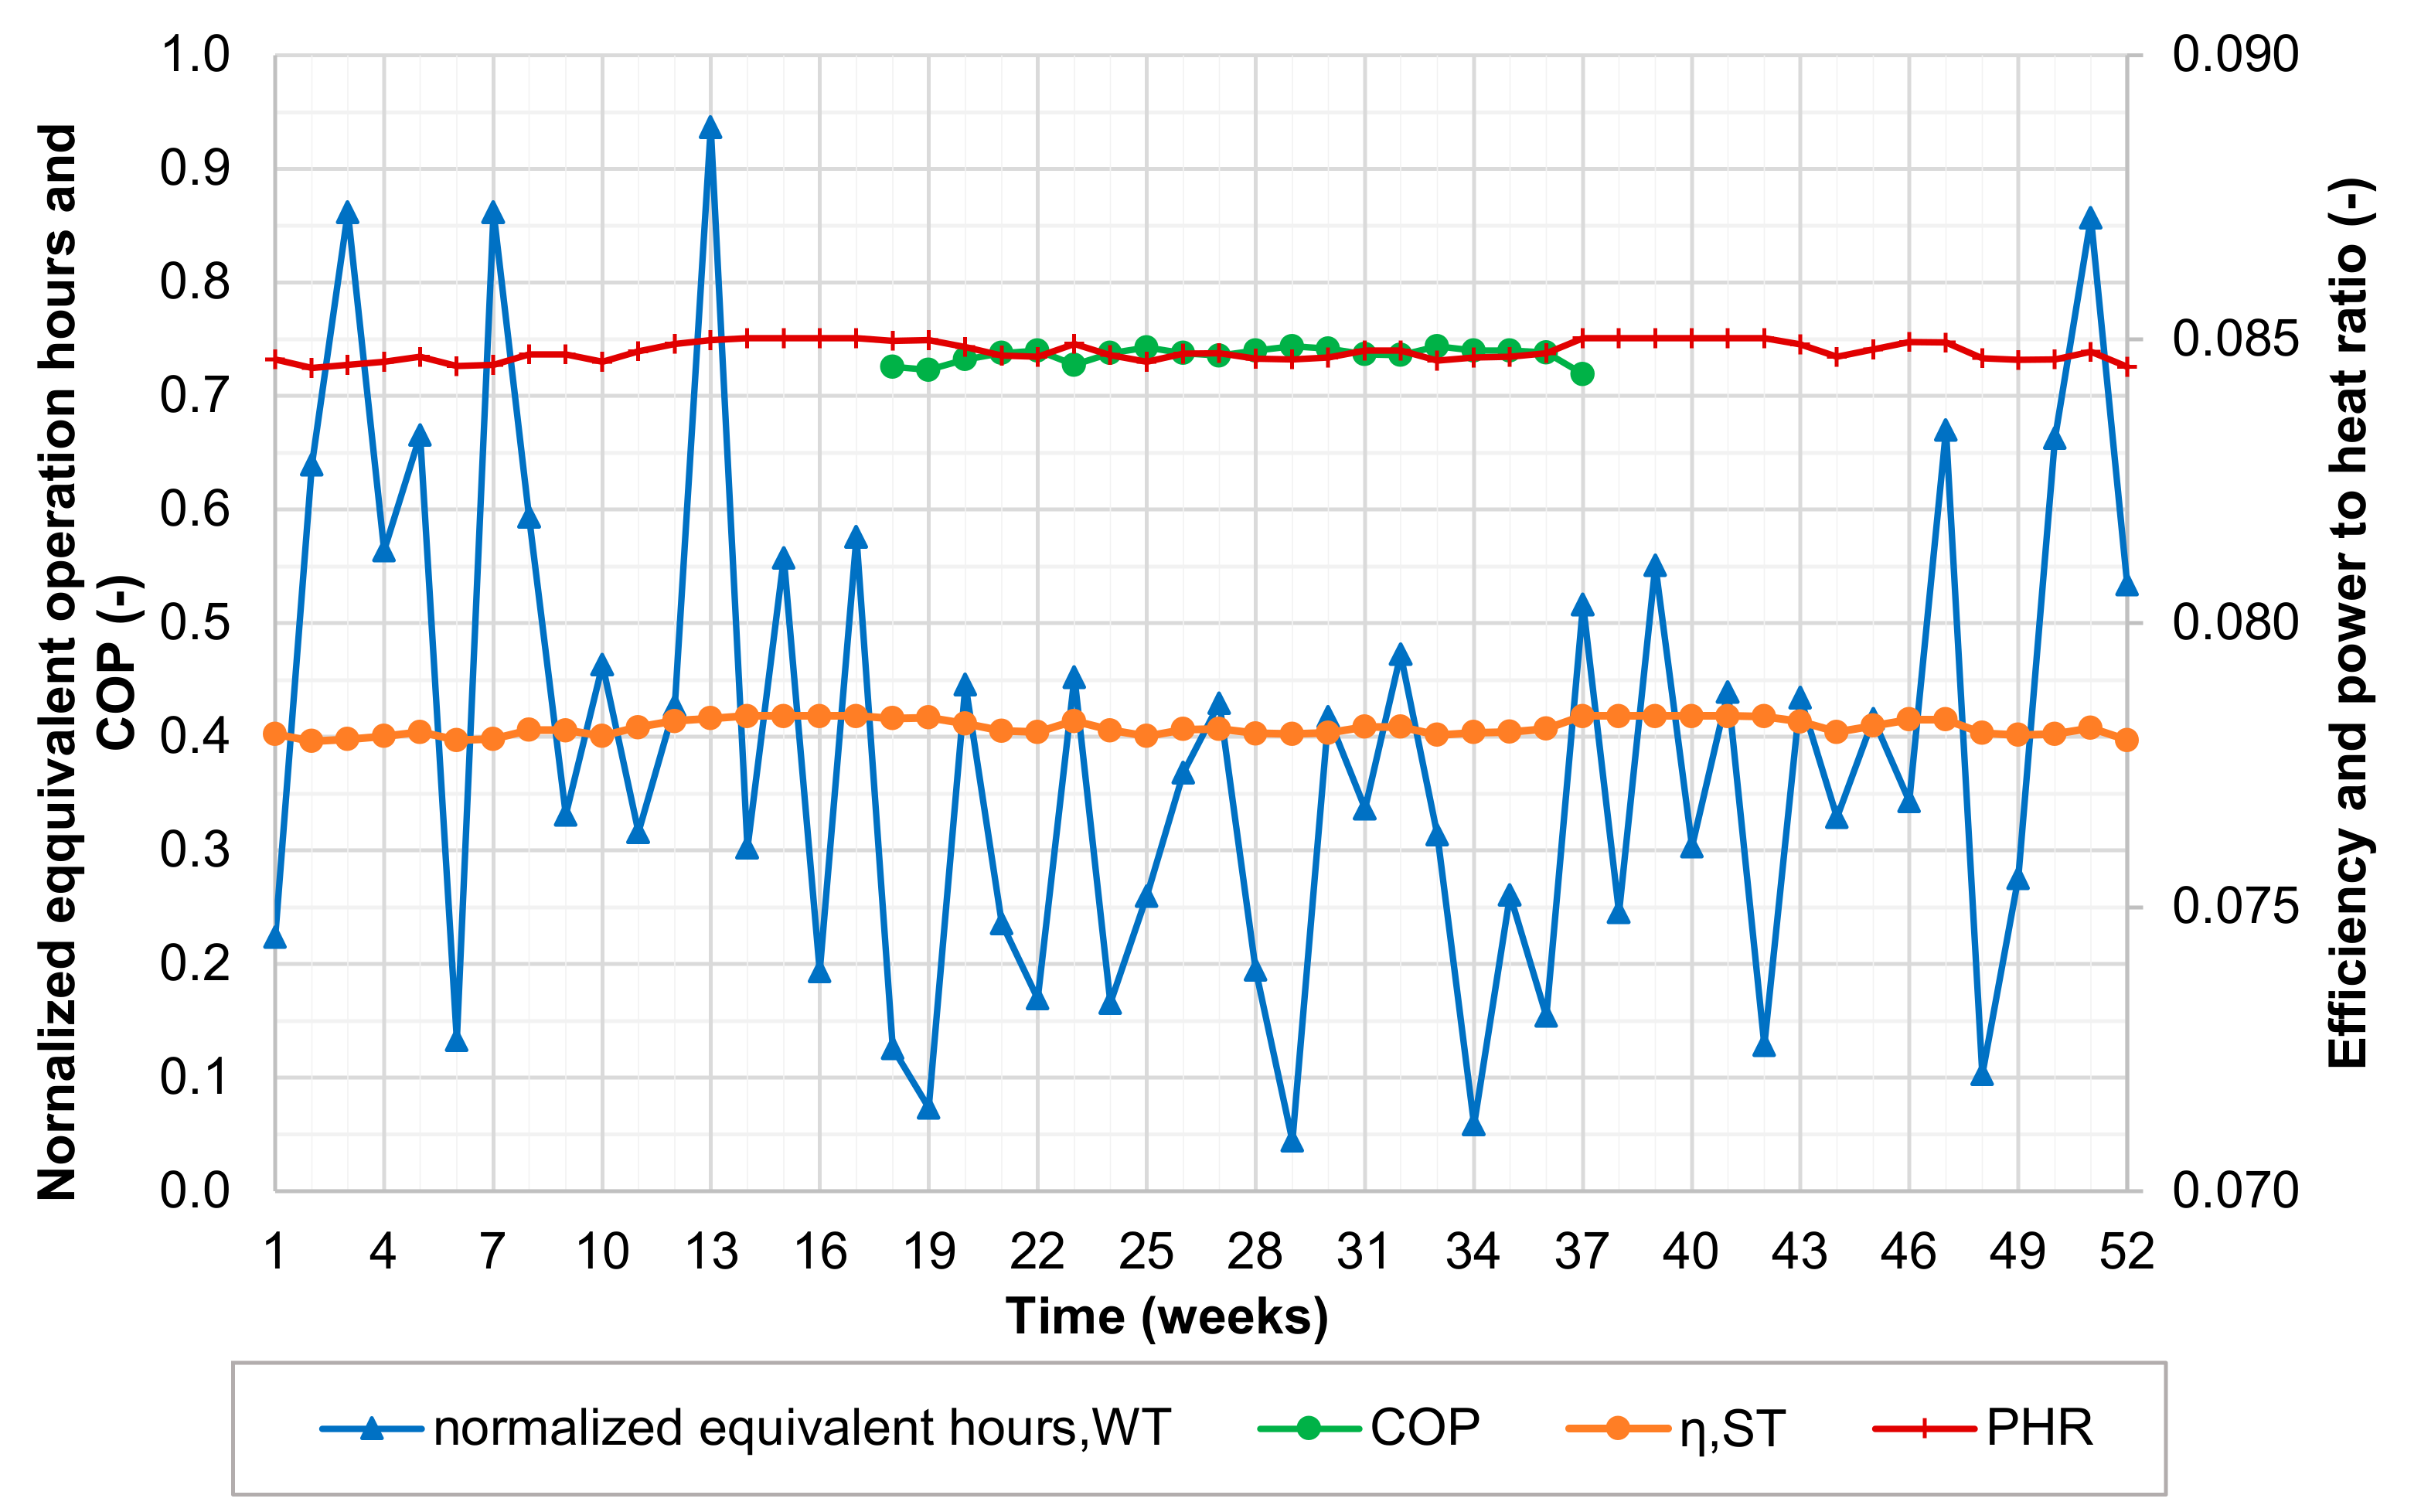
The weekly trends of the system energy performance parameters are shown in
Figure 11. Both steam turbine system efficiency and power to heat ratio (PHR) remain stable during the yearly operation, indeed the variations are less than 0.7% between the maximum and minimum values. The scarce variation of PHR parameter is achieved because the adopted steam cycle degree of freedom in the generation of thermal and electrical energy consists only in the variation of the load, while the possibility to spill steam from the turbine is not taken into account. Moreover, the fairly constant ST efficiency is due to the constant operation parameters of the cycle in terms of temperature and pressure. A limited oscillation is also found for the coefficient of performance (COP) of ACH, which varies from 0.719 to 0.744. This condition is achieved because the temperature level of the thermal input of the generator of AGH is maintained between a fixed range (85–90 °C), due to the operation of both TK and AUX.
Regarding the wind turbine, the normalized equivalent number of operation hours, defined as the ratio between the energy produced and the maximum one under nominal conditions, is extremely variable along the year, ranging from 0.046 up to 0.937. Thus, there are weeks characterized by a relatively high wind energy availability during winter alternated with weeks with low wind conditions.
5.3. Yearly Energy and Economic Results
The thermal and electrical energies of the main components of the hybrid biomass-wind system are reported in
Table 5. As expected, the thermal energy produced by BOIL and transferred to SGHX is higher than the one provided by AUX. This occurs because BOIL operates continuously during the year, while AUX is activated only when need in order to heat the flow exiting TK. As pointed out by the results analysis, BOIL provides 83.4% of the thermal input to the system. In the considered steam cycle design configuration, the amount of thermal energy transferred by COND to the cooling medium (HF) is 92.2% of the one supplied by SGHX. This is achieved since the steam cycle operates with relatively small pressure and maximum temperature, thus, the amount of produced electrical energy by ST is relatively low. It is also worth noting that the thermal energy dissipated by AHX is not negligible, because it is equal to 21.9% of the total heat supplied by COND. This occurred because the steam cycle is meant to operate continuously, and even at partial load, a small amount of thermal energy must to be dissipated due to periods when the thermal demand is relatively small and to a thermally loaded tank. Concerning the electrical energy production, the steam turbine produces 61.3% of the yearly yield, thus, WT has a minor contribution in the production of energy, as pointed out also by the monthly results. Moreover, the produced electrical energy allowed one to match 75.8% of the user demand, with limited electrical energy excess, being the last one equal to 8.1% of the production. This result is achieved because of the assumptions adopted to design the capacities of the system components, as ST and WT. Moreover, it is worth noting that 91.8% of the energy supplied to the grid is recovered with the virtual storage, which is above the limit of freely recovered energy of 80%, thus, in part the energy recovered must to be paid by the user (11.8%), while a small part (8.2%) is not recovered at all.
The efficiency and economic parameters are reported in
Table 6. Here, the efficiency of ST, the power to heat ratio of the steam cycle, the equivalent number of operation hours, the ratios between the main electrical energies, the COP of ACH, the Primary Energy Saving ratio, and the economic parameters are shown. A relatively low efficiency of ST is achieved due to the parameters adopted for the Rankine cycle. This determined a thermodynamic limit for the maximum efficiency achievable by the present steam system. As regards the wind turbine, the wind conditions of the selected locality determined that the equivalent number of operation hours was more than 3000 h, which is a satisfactory value, taking into account capacity of the unit. This value highlights that the availability of wind source is abundant for the selected locality, determining favorable conditions for the installation of such kind of system. Moreover, the thermally driven unit achieved a COP of 0.739, which is coherent with the technology of single-stage LiBr-water absorption units and the operation conditions occurring during the system operation.
PESr of the proposed system depends on the selected reference system. The hybrid system achieved a remarkable primary energy saving of slightly more than 90% in case of NG scenario reference scenario, while for BIO case the saving is slightly above 80%. As expected, PESr is higher in case of NG with respect to BIO due to the savings of natural gas generated by the adoption of biomass in the proposed system. The proposed system consumes only the primary energy related to the electrical energy provided by the grid, while in case of NG scenario the reference system consumes a high amount of primary energy due to the adoption of conventional technologies. On the other hand, the proposed system achieved a relatively lower PESr in case of BIO scenario, since the conventional system in this case is based on the utilization of biomass for space heating purposes.
The economic parameters show that significantly higher savings are achieved in case of NG1 scenario with respect to the other ones. This is due the cost of the natural gas which is higher than the biomass. Moreover, it is worth noting that the savings of the proposed system in case of BIO2 scenario is only due to the avoided consumption of electrical energy at the net of the increased cost of biomass supply due to operation of the steam cycle. In this economic context, SPB index varied from 5.92 years for NG1 scenario to 42.87 years for BIO2. Furthermore, the proposed economic analysis is performed assuming that the difference in maintenance cost between the proposed and reference system is negligible, though the authors also investigated the effect of a yearly maintenance cost of 2% of the total cost of the system on the economics. In this case, for NG1, NG2, BIO1, and BIO2 scenarios SPB is 6.72, 19.59, 17.44, and 300.7 years, respectively, highlighting that the maintenance costs affect significantly the system profitability, especially when the savings are limited by the cost of biomass.
5.4. Sensitivity Analysis
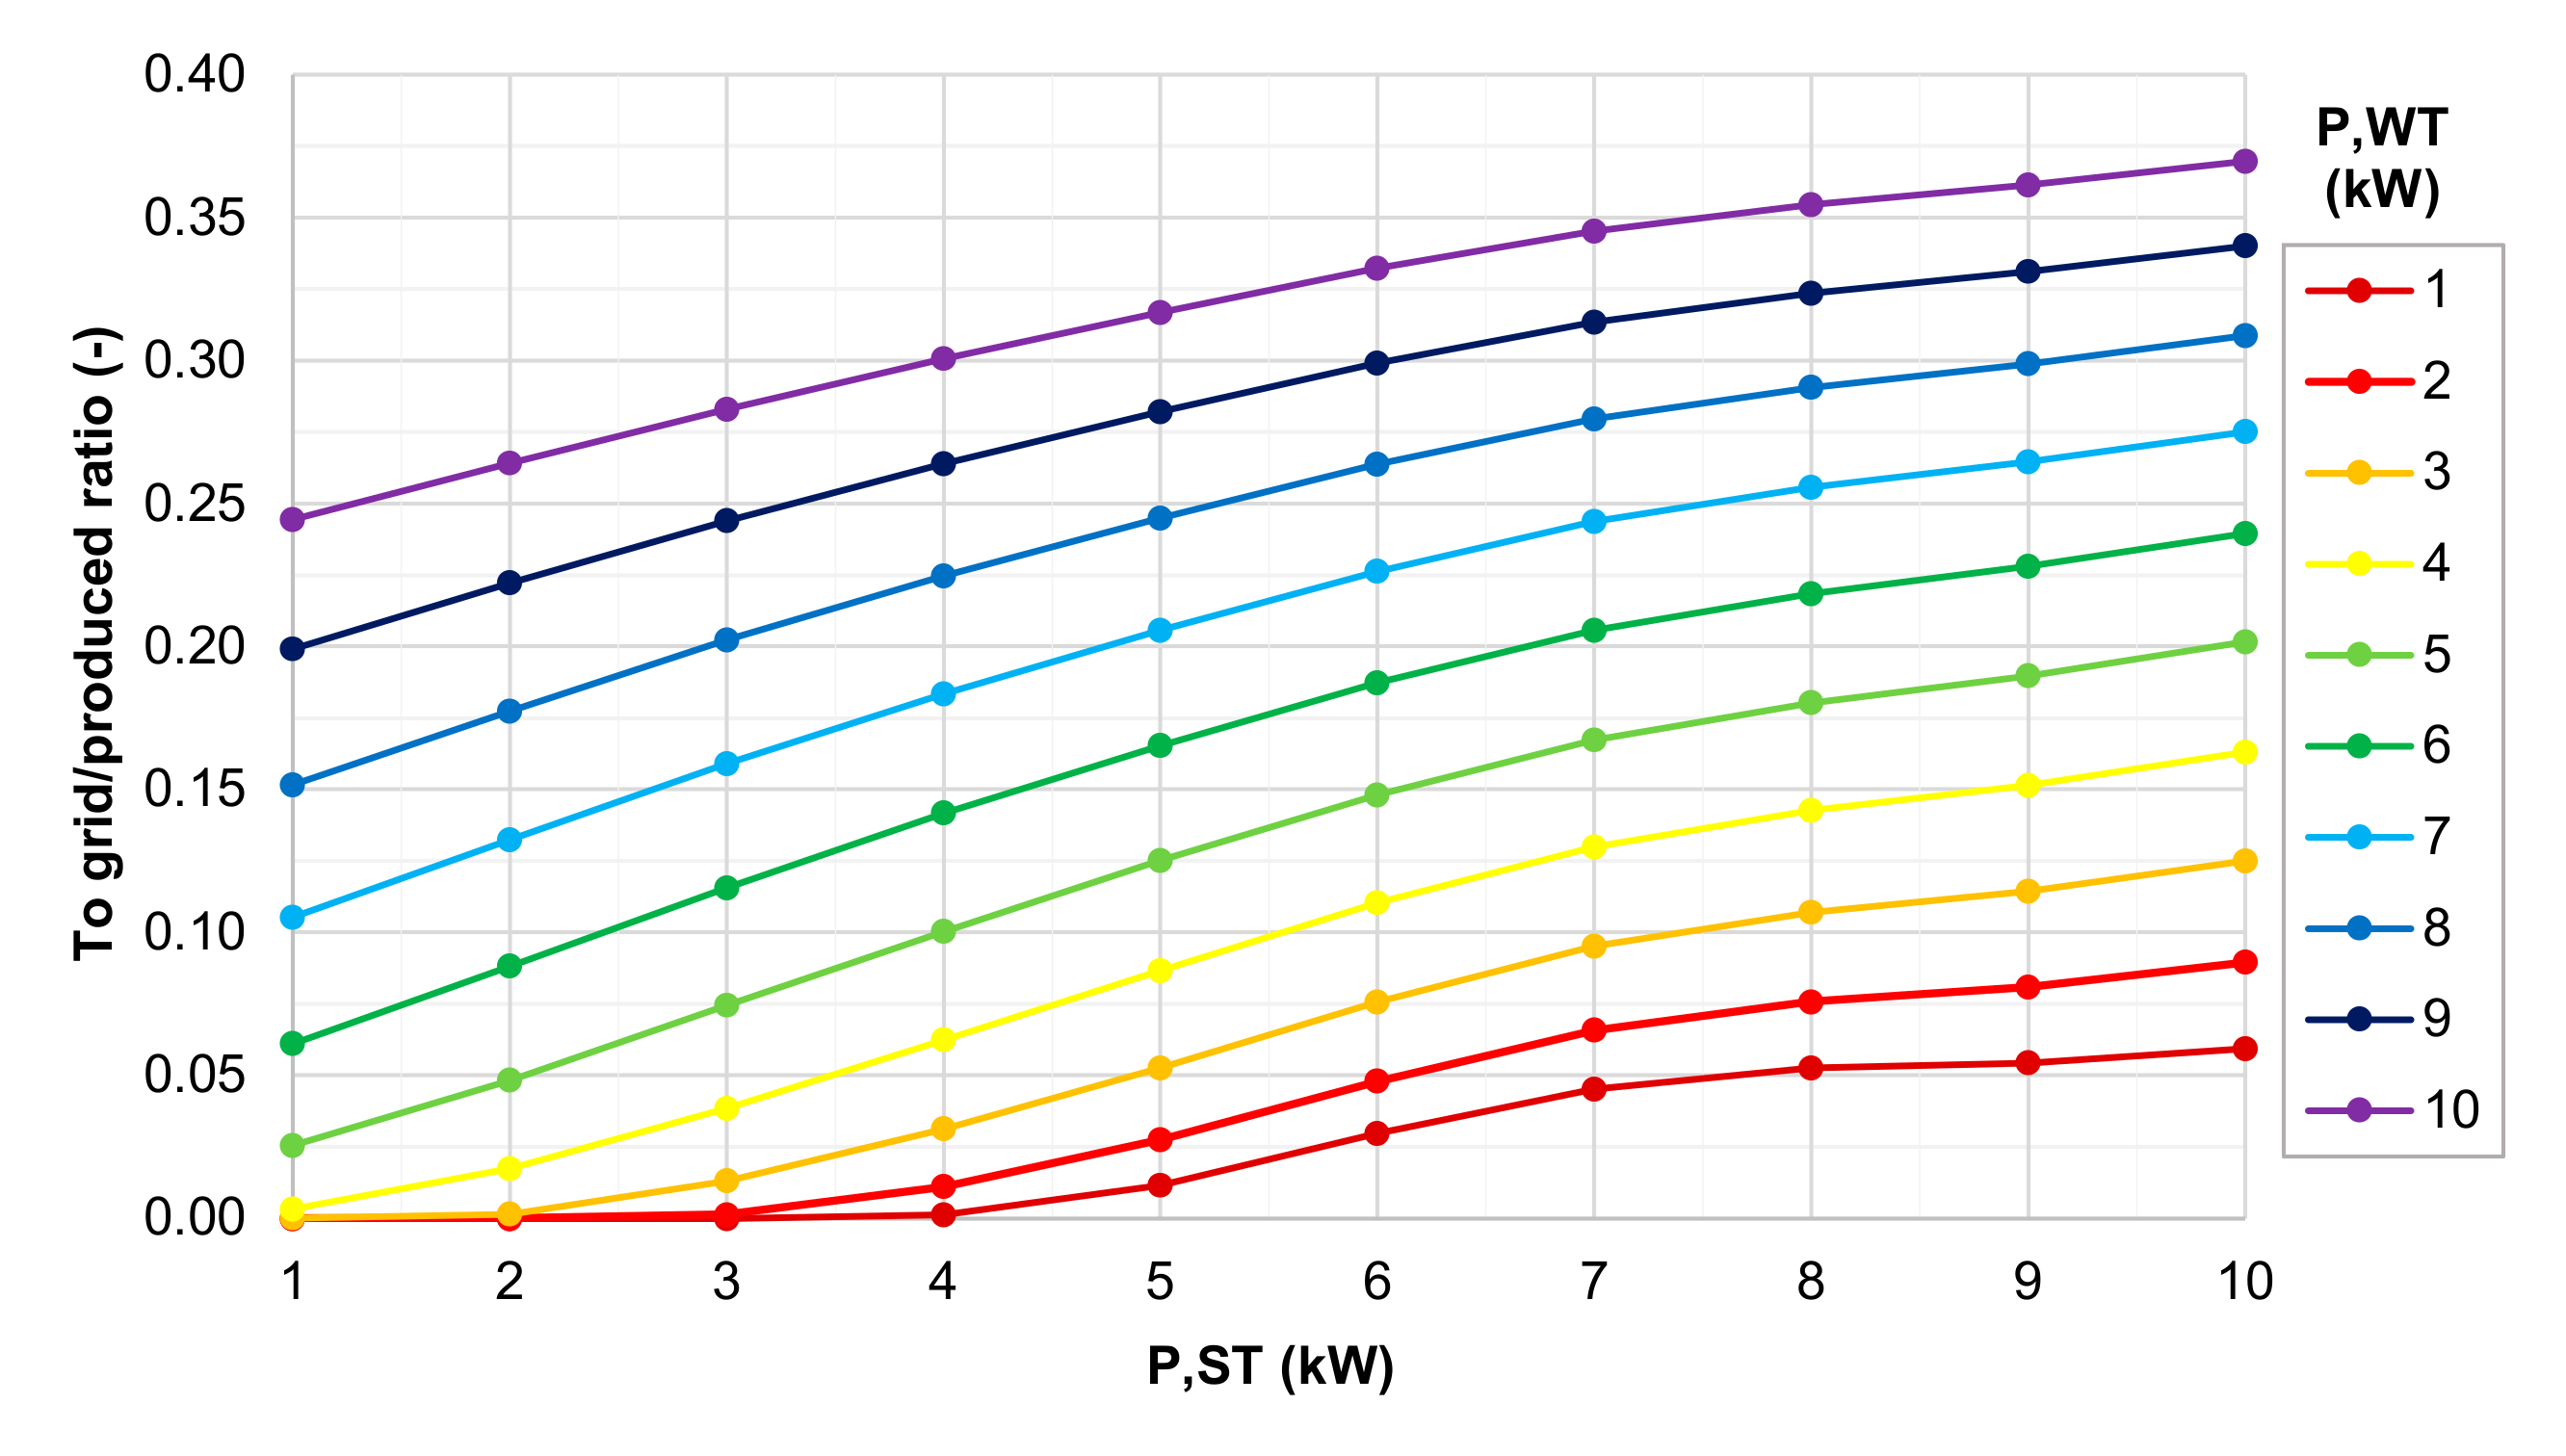
The sensitivity analysis is performed varying ST and WT capacities from 1 to 10 kW. In the analysis, the variation of WT nominal power is adopted assuming a normalized power curve developed on the basis of reference wind turbine characteristics [
20]. In the sensitivity analysis, the following results are shown and discussed:
ratio between electrical energy supplied to the grid and the produced one (
Figure 12);
ratio between the electrical energy recovered from the grid and the produced (
Figure 13);
ratio between the electrical energy recovered from the grid and the one supplied to the grid (
Figure 14);
The trend of the ratio among excess energy and the produced one allows one to observe that the higher are the capacities of both ST and WT, the higher is the energy supplied to the grid, nevertheless this increase is not linear. For lower values of components capacities, there is a threshold beyond which the system starts to supply energy to the grid, indeed for relatively low nominal powers of the components (1–3 kW), the excess energy is practically negligible compared to the produced one, since it less than 2% of the energy yield. The plots also show that, for a fixed wind turbine power, the effect of the increase of the steam turbine size on the excess to produced energy ratio is higher for lower power values compared to the increase achievable for values at the end of the considered range (1–10 kW). This is due to the fact that the operation of the system and the electrical energy production from the point of view of the steam turbine is limited by the thermal demand of the user, determining an operation of the unit at partial load.
The trends of the ratio between the energy recovered from grid and the produced one clearly point out that there is maximum of the energy recoverable for a fixed nominal power of ST or WT. For a constant wind turbine capacity, the energy recovered increases as a function of the steam turbine power in the first part of the range. This occurs until the energy supplied to the grid and recovered matches the electrical energy required to fulfill the gap between the energy directly consumed and the one needed from the grid. However, it must be also considered the fact that the higher is the ST power, the lower is the energy required from the grid and, thus, lower is the capability to recover energy. After a certain combination of ST and WT powers, the energy recovered keeps constant because the user demand is entirely matched by the energy directly produced or recovered, while the production increase implies a decrease of the recovered to produced energy ratio. It is worth noting that for lower values of WT power, the effect of ST power on the maximum recovered-produced energy ratio is lower. In particular, for an increase of WT power from 4 to 5 kW the increase of the maximum recovered-produced energy ratio is 0.021, while between 8 and 9 kW is 0.017.
Concerning the ratio between the energy recovered and supplied to the grid, it can be observed that for the majority of ST and WT combinations, the increase of both powers determines a decrease of such ratio. The increase of the system energy generation capacity leads obviously to an increase of the energy produced in excess, however with the increase of the system size decreases the part of the energy may be recovered from the one produced in surplus. Furthermore, it is worth noting that for some trends, the from/to grid ratio (WT power of 1 and 2 kW) passes from 0.0 to 1.0 with a unitary increase of ST power. Such a characteristic is present because, for relatively low capacities of ST and WT, the excess energy passes from zero to a relatively small value, which is recovered in 100%.
The effect of the increase of power on the primary energy saving in both NG and BIO scenarios is higher in case of ST compared to WT, since ST system produces more total energy compared to WT one, and this occurs independently of the considered reference scenario. The increase of PESr is higher within the lower values of capacities (1–5 kW) since the marginal energy supplied usefully to the user is higher compared to the one achievable in the range of higher capacities (5–10 kW). In fact, the energy demand of user is almost entirely matched by the system when its size increases. Therefore, from the point of view of PESr, the increase of WT and ST power above about 5 kW is not profitable since it leads to relatively low increase of PESr (at most 10%). In general, PESr parameter is slightly higher in case of NG scenario compared to the BIO one, though higher differences are noticeable for lower capacities of the components. For example, for both ST and WT powers of 2 kW, PESr, NG, and PESr, BIO are 0.768 and 0.584, respectively, while for a power of both devices of 5 kW, the ratios are 0.947 and 0.904, respectively.
The plots regarding SPB index show that higher capacities of both ST and WT imply a lower economic profitability of the system for NG scenario. SPB, NG1 for a WT power of 1 kW is below 6 years when the power of ST is under 6 kW, while for a WT power of 10 kW, ST power must to be lower than 3 kW in order to match this same economic criterion on SPB index. As expected, the best SPB is reached for the lowest capacities of the electrical energy generation systems. This is in part due to the cost of ST system and to a negligible effect of the economy of scale of the WT system, intrinsic of the developed cost function. However, it is worth noting that in the NG1 scenario, the SPB is lower than 10 years almost for all considered ST and WT powers.
Under BIO1 scenario, SPB trends reveal that there is a combination of ST and WT powers optimizing the economic profitability of the system. For all the wind turbine powers in the range from 1 to 10 kW, the optimum ST power is about 3 kW. Therefore, there is a trade-off between the cost of the proposed system and the possible economic savings due its operation. In particular, in the considered case, being the biomass freely available, the production of heat not produces any direct saving related the operation of the system, since the savings are assessed only taking into account the electrical energy for matching the user demand and space cooling operation. Thus, the economic profitability is affected by the electrical energy directly consumed or the one recovered from the grid virtual storage. In fact, beyond WT power of 5–6 kW and above a certain value of ST power (from 4 to 9 kW), SPB, BIO1 trend are increasing the linear, which means that the savings increase is marginal with the respect to the increase of system cost due to ST. These trends are also due to the decrease of from grid/produced energy ratio, as shown in
Figure 13.
5.5. Summary of the Results
The performed analyses are developed in order to investigate comprehensively the proposed system from the point of view of dynamic operation parameters during a one-day time period, weekly energy performance along one year, yearly energy-economic indexes and to study effect of the turbines capacity on the system performance. The main findings carried out within the performed analyses are presented in
Table 7.
6. Conclusions
A novel micro-scale hybrid biomass-wind trigeneration system is investigated by means of dynamic simulation in TRNSYS software from the technical, energy and economic point of view. The scope of the study is to determine the operation characteristic of the system integrating two renewable energy sources and the possible energy and economic advantages achievable by its installation in a realistic user. The system is based on a wood-chip boiler, low-pressure steam turbine, wind turbine, heat recovery system and an absorption chiller. In order to assess the system performance, a case study is adopted consisting of a household with zootechnical farm, under the conditions of northern Poland. The analysis is carried out assuming two reference systems, namely NG consisting of a natural gas boiler, electrical chiller and the electric grid providing heating, cooling and electrical energy, respectively, and BIO, integrating the same devices apart from a wood chip boiler adopted for space heating. Moreover, for NG and BIO scenarios, two conditions are assumed: “1” with freely available biomass and “2” with market price biomass.
The performed analysis shows that the proposed system is feasible from the technical and energy point of view. The designed configuration of the system is capable to match the major part of the user energy demand and it allows one to limit the input of auxiliary energy.
The proposed system presents a relatively high cost of investment, nonetheless its economic profitability is mainly affected by the type of fuel used in the reference system; natural gas or biomass. The proposed system in case of NG scenario is fairly feasible from the economic point of view, while it is less attractive for BIO1 scenario. In case of a reference system with a heating system supplied with a not cost-free biomass (BIO2), the proposed system is not feasible from the economic point of view due to incidence of the biomass consumption in the operation costs.
Future developments of this study will include: investigation of the system performance as a function of different users and locations, energy tariffs and incentive policies in order to find general conditions for the application of the system, a comprehensive sensitivity analysis, and rigorous optimization aiming at determine the effect of the design and economic parameters on the performance.


