A Study of Cloth Seal Leakage Performance Based on Geometry and Pressure Load


1
Faculty of Engineering and Natural Sciences, Sabanci University, Istanbul 34956, Turkey
2
SDM Research & Engineering, Istanbul 34906, Turkey
3
Department of Mechanical Engineering, Kirikkale University, Kirikkale 71450, Turkey
*
Author to whom correspondence should be addressed.
Energies 2020, 13(22), 5884; https://doi.org/10.3390/en13225884
Submission received: 29 September 2020
/
Revised: 25 October 2020
/
Accepted: 6 November 2020
/
Published: 11 November 2020
Abstract
:Metal cloth seals have been used increasingly in gas turbines due to their flexibility and superior leakage performance. Leakage performance of a metal cloth seal depends on operating conditions, slot and geometric dimensions. These parameters need to be investigated for the best leakage performance. In this study, pressure drop and critical geometric parameters of typical cloth seal form are investigated with an experimental setup. Slot depth, cloth width, sealing gap, shim thickness, surface roughness, pressure drop, offset and mismatch are selected parameters for the screening experiments. Sixteen experiments were conducted following a two-level Resolution IV fractional factorial experiment design for eight parameters. The results indicated that strong parameters for the leakage performance are pressure drop, cloth width, slot depth and offset. Leakage rate is increased with an increase in slot depth, gap, shim thickness, pressure drop and mismatch. During screening experiments, the experiment with minimum flow rate has 86% lower leakage rate than the experiment with maximum flow rate. For main experiments, a Box-Behnken experiment design is applied to analyze nonlinear effects of four strong parameters on the leakage rate. A closed-form equation is derived based on the data and presented in this study.
1. Introduction
Gas turbines operate with high pressure ratios and temperatures for increased efficiency. Secondary flows are crucial for overall turbine performance. Therefore, high-performance seals are required to meet efficiency demands. Inefficient sealing results in more power consumption by the compressor and reduces the temperature of the main hot gas flow due to cold parasitic leakage flow [1]. Advances in sealing technology have a considerable impact on decreasing operational costs and fuel consumption.
Seals are located between rotating-stationary or in-between stationary components. A typical stationary sealing slot is illustrated in Figure 1. Several types of stationary seals are developed such as rope seals, foil seals, cloth seals, leaf seals, spline seals, C-type seals, and O-type seals. Figure 2 shows various possible relative positions of adjacent turbine slots due to thermal growth, vibrations, assembly, and manufacturing tolerances. Due to relative motion between adjacent stationary components (transition ducts, nozzles, shrouds, etc.), novel seal designs are required to cope with wear, leakage, and excessive stresses. Metallic solid plate seals are insufficient to meet the demands in terms of wear, compliancy and leakage when adjacent components have relative motion in axial or radial directions [2]. Due to high stiffness, the bending of a thick solid plate is limited. Therefore, thick solid plate seals cannot flex and close the clearance between seal surface and slot surface under offset and mismatch conditions. Such seals contact locally with slot surfaces, leading to local wear and crucially worsening leakage performance. Thinner seals provide better compliance. However, sacrificial wear volume which is needed for long life, is diminished due to low thickness.
Moreover, maximum stress on thinner seals significantly increases under offset and mismatch conditions, and a solid seal piece may rupture and hit the turbine blades. Cloth seal provides an answer to improve the leakage performance; raise wear life and reliability as an alternative to solid seals [3]. Leakage performance of a cloth seal is related to leakage rate which is defined as mass flow rate that leaks through the cloth seal. In a gas turbine, cloth seals are usually applied to minimize mass flow rate. Therefore, leakage performance becomes better if mass flow rate is decreased.
Several cloth seal designs are suggested in the patents [4,5,6,7,8]. Cloth seals are composed of thin sheet metals (named as shims) and woven cloth metal layers (named as cloth weave). The seal design may include one or more cloth weaves and a thin shim plate. The shim plate blocks the direct flow from upstream to downstream. The shim plate also provides structural strength, while the cloth weave adds sacrificial wear volume without significant stiffness increase [9]. Figure 3 illustrates a representative cloth seal design that is used in the present study. To choke the flow between the cloth seal and turbine components, metal shims are bent at each edge to create tabs. A single cloth weave is located at the downstream side of the shim to provide sacrificial wear volume. Another cloth weave is placed upstream side of the shim to protect shim from damage under offset and mismatch conditions. Shim and cloth layers are assembled by spot welds.
Cloth seals can provide 70% leakage reduction in between nozzle segments and a 30% reduction in between combustors [9]. Overall turbine performance is raised 0.5–1% and heat rate is reduced by 0.25–0.5% with cloth seal use [9,10]. Service life is also extended with flexible cloth seals by at least 50% [11]. For E and F type industrial gas turbines, they provide 77% less leakage than comparable rigid strip seals under mismatch and offset positions, and 65% leakage reduction at baseline (without offset and mismatch) conditions [12].
Dogu et al. [1] analyzed flow and temperature distribution for cloth seals. They defined the woven cloth layer as a solid domain, however thermal properties of the cloth layer are divided to cover the effect of voids. Their study states that the main goal of the cloth seal is to minimize leakage rate, however, a certain rate of leakage flow through cloth provides cooling for a shim.
Mass flow rate and flow resistance of cloth weave are investigated in a few studies [13,14,15]. These studies developed equations to model flow resistance through the cloth weave in terms of weave thickness, diameters of fibers, weave type, and weave density. Kolodziej [14] derived a mathematical model of flow through wire gauzes based on Ergun’s approach which is stated as follows:
and are friction factors of laminar developing and turbulent flow, respectively. p is the density, wo refers to superficial velocity, dw is the wire diameter, ɛ is the porosity of the weave mesh, τ is bed tortuosity, and θ refers to the angle of flow direction slope to the bed axis. Yoshida [15] derived an equation for estimating the pressure drop across the Dutch weave mesh as:
k is the Kozeny constant, which correlates with the shape of the flow path. α is the surface area of the mesh per unit volume. They stated that ɛ and α can be calculated from the fiber diameter and mesh density using the geometrical models of a Dutch weave mesh suggested by Armour and Cannon (1968). However, all these studies only investigate the flow rate through cloth weave, and not through an entire cloth and shim composite seal structure.
An analytical model is developed to obtain the wear life of cloth seals [16]. In order to calculate wear life, the total volume loss is obtained with a proposed equation based on the Archard equation [17,18].
Fluid flow through a cloth seal is shown with red arrows in Figure 4. Flow approaches from upstream to the area between lateral slot surfaces and shim tabs. Then it is directed to the choking zone. Once passed the choking zone, flow is exposed to throttling between cloth weave and downstream slot surface, and subject to resistance through voids inside the cloth weave placed near downstream.
Several studies investigate the impact of geometric dimensions and boundary conditions on rim, brush and laby-brush seal leakage performance [19,20,21,22]. A comprehensive study is needed to understand how cloth seal leakage performance is affected by geometric dimensions under varying pressure load.
Cloth seals have complex structures with several seal design parameters that affect the leakage rate. Leakage performance a cloth seal is not only related to its geometry, but also pressure load, surface roughness, sealing gap, offset and mismatch conditions, weave type, shim and cloth weave materials, etc. Due to the complex nature of its structure, carefully designed experiments are required to determine cloth seal leakage performance, and to develop a closed-form equation.
Although several experimental and computational studies [1,3,9,11,12,16,23] have been published on cloth seals, a comprehensive investigation of design parameters affecting leakage performance is not available. Literature reviews indicate that available published data about cloth seal leakage performance are not adequately detailed to derive a closed-form equation defining the relationship between seal design parameters and cloth seal leakage performance. In an effort to fill this gap, the effect of geometric parameters under varying pressure load on the cloth seal leakage performance has been investigated in this study. Pressure load is dominant operating condition that drives leakage rate. Compliant structures like cloth seals may change shape under different pressure loads. Therefore, leakage performance has been studied at different pressure levels. In order to reduce the number of parameters to a manageable size, some of the parameters are fixed and excluded from the experimental design based on the studies in the literature [23,24]. The remaining eight parameters are included in the screening experiments. Their levels were determined to cover typical application ranges. Parameters, which have a major impact on leakage rate, are determined and analyzed in the main experiments. Details of the study and results are explained in the following sections.
2. Test Setup
To measure the leakage performance, leakage rate through the cloth seal needs to be measured for different experimental designs. It is difficult to establish a test rig that simulates exact harsh turbine conditions. An experimental setup is established to measure cloth seal leakage rates in both baseline and combined offset and mismatch conditions. A similar test rig was used in a previous study [12].
As illustrated in Figure 5, the test system is comprised of a test fixture, a compressor, an air dryer, a flowmeter, pressure sensor, pipes, globe and ball valves. Air is pressurized by the compressor, then passes through the air dryer to dehumidify and filter particles. High pressure flow reaches the test rig from the upstream side. Flow is forced through the sealing clearance and discharged to the atmosphere. The leakage tests are conducted by varying upstream pressure and keeping the downstream pressure constant.
Upstream pressure is measured from the pressure chamber as shown in Figure 5. The pressure sensor has an accuracy ± 0.25% of the full-scale range. It has a range from 0 to 3447 kPa. A mass flow meter is placed after the globe valve. It operates with an accuracy ± 1% of the full-scale range. The mass flow meter has a range from 0 to 330 kg/sec. Globe valve allows adjusting the inlet pressure. Once upstream pressure is stabilized at the required pressure drop value, pressure and leakage data are recorded. Data acquisition system is conducted to capture pressure and leakage data. Before starting each test, the test rig is pressurized to determine the undesired bias leakage between components. Bias leakage is the undesired flow that leaks between the rig components rather than through the cloth seal. It tends to consistently increase measured leakage rate, therefore, results in a systematic error for leakage rate. A separate set of tests is conducted to calculate bias leakage at each pressure drop. During these tests, actual sealing interfaces are glued, and bias leakage flow is measured under determined test pressure load levels. Actual leakage rates are obtained as the difference between measured flow rate and bias leakage rate.
The leakage test rig is configured to test cloth seal parameters in different operational ranges (Figure 6). The test rig consists of left and right slot components, control apparatus; side, top, bottom, front, and rear plates. Front and rear plates are hidden to show other components better. The bottom plate is fixed onto the pressure chamber. A slot in the bottom plate allows fluid flow from the pressure chamber to the upstream side of the cloth seal. The downstream side of the test system is opened to the atmosphere. Two spacers allow to adjust both position and angle relatively between right and left slots. Therefore, mismatch and offset levels can be changed. The cloth seal is placed into the region which is illustrated with the dashed black line rectangle. Some dimensions of the leakage test rig are illustrated in Figure 7.
Rig design allows all components to be disassembled between experiments when dimensions of some of the components need to be changed. The tests are conducted to measure leakage rate at different slot depth, surface roughness, gap, offset, and mismatch levels. Experiments are performed at pressure levels of 30 psid (206.8 kPad), 50 psid (344.7 kPad), and 70 psid (482.6 kPad). The tests are conducted at room temperature, and the test rig is pressurized with dry air. Tests are repeated three times for each data point to capture variations between test cycles. In each test cycle, pressure drop is increased up to the slightly higher than required pressure drop level as set by the experimental design and then decreased down to atmospheric level. Therefore, six leakage rate data are measured and averaged for an experiment. The leakage rate data and accuracy of the sensor are used for uncertainty analysis in the ‘Appendix A’.
3. Experimental Design
A design of experiments (DOE) study is performed to understand the influence of cloth seal parameters on leakage performance. The steps listed below are as follows:
- Identification of the parameters affecting the leakage performance
- Selection of the method for screening experiments
- Establishing an experimental design for screening experiments
- Pareto chart and identification of strong parameters
- Comparison test results with the data existing in the literature
- Establishing experimental design for main experiments
- Pareto chart and a closed-form equation for strong parameters
Parameters that affect the leakage performance are listed in Table 1. Geometric parameters of the cloth seal are illustrated in Figure 8. In order to perform a high-resolution DOE study, the number of parameters should be reduced. Therefore, the last ten parameters (parameters 9–18) are fixed at common values based on engineering judgment and literature data. Cloth material is selected as cobalt-based alloy Haynes 25/L605 which has superior high temperature wear resistance, and is used as common cloth material [3,24]. Haynes alloy 188 has good oxidation resistance for high temperature, and is commonly used as shim material in cloth seals [24]. The data provided in the literature indicates that Dutch Twill with 30 × 250 per inch density provides better leakage performance and is commonly used as the cloth of choice in cloth seals [23]. Therefore, Dutch Twill is selected as the cloth weave type with 30 × 250 density which also determines cloth weave thickness, warp and shute diameters. Spot weld diameter is selected by considering integrity to cloth wires and minimum additional stiffness. Slot height is selected much higher than cloth seal thickness as commonly practiced to allow easy blind engine assembly. Due to experimental limitations and limited effect on elastic modulus, the effect of temperature is omitted in this study. The remaining eight parameters are considered to have a significant effect on leakage performance, and are selected for a higher resolution DOE study. In order to measure leakage performance, the objective of the DOE study is selected as the leakage rate that the mass flow rate leaks through the cloth seal.
3.1. Screening Experiments
Even though the number of parameters is reduced to eight, the derivation of a nonlinear relation between eight parameters and leakage rate requires a high number of experiments for a high-resolution study. Therefore, screening experiments are performed to determine the strong parameters with a high effect on the leakage performance.
If a full factorial experiment design is used, all experiment design combinations should be tested. This requires 28 = 256 experiments for two-level experiment designs, while the number rises to 38 = 6561 for three-level experiment designs. As a result, full factorial experiment design demands very long test period and high cost. Therefore, the number of experiments should be further reduced using a fractional factorial experiment design for screening experiments.
In order to investigate the selected eight parameters, a two-level Resolution IV experiment design is applied. Therefore, the number of experiments is reduced to a significant amount while using a high number of parameters. Table 2 shows the selected levels for the eight parameters. Sixteen experiments are prepared to analyze the effect of eight parameters in two-levels. They are tested with the parameter levels as tabulated in Table 3.
The high and low levels of the parameters are selected to cover typical turbine applications and pressure drop levels for common cloth seal operation ranges. The significance of parameters is analyzed with a Pareto chart. Leakage rate trends with respect to levels of each parameter are examined in an effect chart.
3.2. Main Experiments
After strong parameters are determined through screening experiments, a detailed experimental design study is conducted. In screening experiments, a two-level factorial experiment design provides a linear change between parameters and leakage rate. To observe whether a nonlinear behavior occurs in the trend, a three-level experiment design with a midpoint is required. Therefore, a Box-Behnken experiment design is selected as the methodology for the main set of experiments. The Box-Behnken experiment design is rotatable, and quadratic effects are also considered for leakage rate of the parameters.
The parameters and their levels are tabulated in Table 4. Based on the screening experiment results, the parameters are grouped as weak and strong. Four main strong parameters which are slot depth, cloth width, pressure drop, and offset, are selected for the main experiments. The weak parameters which are gap, shim thickness, surface roughness, and mismatch are fixed to the values as shown in Table 4. Only strong parameters are varied in order to reduce the number of experiments to a manageable size. The minimum and maximum levels of strong parameters are the same with the levels used in the screening experiments. Twenty-seven experimental designs are tested as shown in Table 5.
4. Results and Discussion
The impact of the selected eight parameters on the leakage performance is investigated based on measured data from experiments. Leakage rate and pressure drop data are measured for each set of experiments. It is checked to ensure that no damage is occurred in the cloth seal samples due to wear, pressure drop, offset and mismatch conditions. It is confirmed that tested cloth seals perfectly handled loads resulting from offset and mismatch under applied pressure.
After the experiments are completed, cloth seal leakage performance is evaluated as a function of geometric dimensions under varying pressure conditions. ‘Pareto Chart’ and ‘Main Effect Plot’ are generated for leakage rates. Graphs are plotted to illustrate the effects of parameters on the leakage performance better.
A literature review and detailed information about the parameters are presented in the “Experimental Design” section. Cloth and shim materials are selected as Haynes 25/L605 and Haynes 188, respectively. The direction of cloth weave is oriented 45° to the dominant relative motion (diagonal direction), which increases wear resistance and helps mesh integrity [24]. Therefore, cloth weave is oriented in a diagonal direction and welded with shims. Warp and shute diameters are dictated by the Dutch Twill 30 × 250 mesh and selected as 0.28 mm and 0.21 mm, respectively, with an overall cloth weave layer thickness of 0.7 mm.
4.1. Screening Experiment Results
Screening experiments are performed with the fractional factorial experiment design. Similar to the previous studies [12,24] applied, leakage rates are nondimensionalized and normalized by dividing the leakage rates with that of the rigid seal under baseline (without offset and mismatch) position at the condition that pressure drop is equal to downstream pressure (Plow/Phigh = 0.5). The parameters for the baseline rigid seal test are slot distance = 32 mm, shim width = 26 mm, gap = 4 mm, shim thickness = 0.254 mm, surface roughness = 6.4 µm, pressure drop = 101.3 kPad, offset = 0 mm, and mismatch = 0°.
Figure 9 shows the relative effects of parameters in a Pareto Chart. Alpha is the statistical significance level which is the probability of the study rejecting the null hypothesis. Its value is selected as 0.05. Results show that four parameters among the others stand out. These strong parameters are pressure drop, cloth width, slot depth and offset.
The main objective of the screening results is to determine strong and weak parameters and reduce the number of experiments for the main experimental study. Therefore, these four parameters are selected for detailed study in the main experiments. Surface roughness, gap, mismatch, and shim thickness appear relatively weaker parameters to influence leakage performance. As expected, pressure drop has the highest impact on leakage. The standardized effect for pressure drop is 3.186. The leakage performance is negligibly affected by shim thickness. The standardized effect is calculated as 0.133 for shim thickness.
The effect plot for leakage rate is illustrated in Figure 10. Eight parameters are shown with their trends. Strong parameters have higher leakage differences between high and low levels. The dimensional changes in geometric parameters are shown as diagrams in Figure 11.
As expected, the leakage rate significantly increases with a higher pressure drop. Pressure drop of 70 psid (482.6 kPad) experiments have approximately double of mean leakage rate compared to pressure drop of 30 psid (206.8 kPad).
The reducing cloth width increases leakage rate by two-thirds since the area resisting the flow decreases with reducing cloth width. This situation also explains the leakage rise with a higher gap distance. Clearance area between the cloth seal and slot is reduced with increasing the gap value.
36 mm slot depth experiments have a 60% higher average leakage rate than those with 32 mm slot depth. The slot depth considerably affects the flow pattern in the zone between shim tabs and lateral slot walls. Flow is limited with narrower lateral areas; therefore, leakage is diminished by the shorter distance between slots.
Leakage rate is decreased a little with offset condition. It is thought that in offset condition, the cloth seal improves its contact at one side while another side still maintains its contact with the seating surface without losing choking points at the tabs due to its flexibility. This is in line with the reports in the literature, where a cloth seal design (sandwich seal design with welded edges) performed better under offset and mismatch conditions in comparison to baseline condition [12].
The leakage rate is increased with a shallow gradient by rising shim thickness. Leakage rate of 0.508 mm shim thickness is 2.8% higher than 0.254 mm shim thickness. This is somehow expected due to the fact that thicker shim is less flexible. Aksit et al. [12] also stated that lower shim thickness provides higher flexibility leading to slightly better performance.
Roughness has very little reduced effect in the working range. This reduction may be explained as a result of higher friction losses and higher surface turbulence. Rough surface leads to absorption of more energy from the fluid.
Figure 12 illustrates the normalized leakage rate of sixteen experiments which are tabulated in Table 3. The lowest leakage rate is obtained in Exp. No. 15 and the highest leakage rate is observed in Exp. No. 14. Figure 12 shows that Exp. No. 15 has 86% lower leakage rate than Exp. No. 14. This result emphasizes that the pressure and geometric dimensions may have a big impact on leakage rate of the cloth seal.
In order to compare the leakage performance of the different seal design combinations under different pressure conditions better, leakage rates are converted to equivalent sealing gap values and plotted in Figure 13 and Figure 14. Equivalent gap which is a representative sealing gap, remains constant if the geometry does not change with pressure drop level [12]. It is calculated by the following equation:
where is the leakage flow rate, L is cloth seal length, Thigh and Phigh represent upstream temperature and pressure, respectively. FF refers to the ‘Flow Function’ which is calculated with different equations for choked and unchoked flow:
For choked flow:
For unchoked flow:
where g is the acceleration due to gravity, γ refers to specific heat ratio, R is gas constant.
The rigid seals are widely used as conventional sealing technology. Therefore, its leakage rate under nominal conditions (no offset, no mismatch) has been selected as the baseline to normalize all other data. In Figure 13 and Figure 14, the equivalent gap rates are nondimensionalized and normalized by dividing the equivalent gap rates with that of the rigid seal under baseline (no offset, no mismatch) position and Plow/Phigh = 0.5 condition. To facilitate meaningful comparison, the test conditions of the rigid seal (pressure ratio, temperature, offset, and mismatch) are kept the same with the literature [12,24]. If a cloth seal design has a normalized equivalent gap less than 1, its leakage performance is better than the baseline rigid seal.
Leakage performance of selected experiments in terms of the normalized equivalent gap is illustrated and compared with previous studies [12,24] in Figure 13 for baseline conditions. Cloth seals in Exp. No. 1, 4, and 14 have leakage rates approximately 62%, 49%, 39% less than the baseline rigid seal (at PR = 0.5), respectively. Equivalent gap remains almost constant with respect to pressure ratio for Exp. No. 1, 4 and 14. The results of experiments follow similar trends with reported literature data for the cloth seal with double crimped shim cloth seal [12] and with the curved cloth seal when pressure load is applied from the inside of the corner [24]. Double crimped shim cloth seal [12] has overall an 0.254 mm thickness of shim which is bent from edges to create tabs. This design is similar to the design used in the present study. Radius corner seals [24] which comprise of cloth layer around the shim, are applied to a corner region. In Figure 13, the test conditions of the experiments (pressure ratio, temperature, offset, and mismatch) are kept the same with the literature [12,24]. In Figure 14, the present study is compared with the literature [24] in terms of leakage performance at offset and mismatch conditions. This plot presents the test results for 0.2 mm offset and 0.6° offset and mismatch conditions. The data indicate that cloth seals under offset and mismatch conditions provide better leakage performance than comparable rigid seals under nicely aligned baseline conditions at 0.5 pressure ratio. The data also indicate that the normalized equivalent gap slightly decreases with decreasing the pressure ratio (Plow/Phigh) which means higher pressure drop. It is concluded that higher pressure drop causes flexible cloth seal to conform to the slot surfaces better and reduces the equivalent sealing clearance. Offset and mismatch values are 0.762 mm and 0.9° for curved cloth seal [24], respectively. Figure 14 indicates that the studied seal designs show slightly better performance than 0.5 in radius corner seals reported by Aksit et al. [24] under offset and mismatch conditions.
4.2. Main and Confirmation Experiment Results
The main experiment combinations are selected based on the Box-Behnken experiment design. Twenty-seven experiments are conducted to generate the experimental data set to fit a closed form equation. In order to check the validity and accuracy of the derived equation under different conditions, eight different combinations have been used for confirmation experiments. Confirmation experiment combinations are selected so that none of them match the main experiments. Results of the main experiments are used for curve fit purposes. Once an equation has been fit, leakage (flow) rate estimates of this equation are compared with the actual test results obtained in the main experiments. The obtained equation is also applied for the confirmation experiments, and predictions of the fit equation are also compared with the confirmation test results. Table 6 compares the results for both main and confirmation experiments. It shows the error in terms of leakage rate between the closed form equation predictions and experimental results. To improve the accuracy of the fit, equation fit has been repeated by selectively excluding outlier experiments. The row labeled as ‘without outlier’ presents the case, where all of the twenty-seven experiments are included in the fit to obtain the closed form equation. Once the equation is derived, calculated leakage rates are compared with each of the twenty-seven main experiment results as well as the eight confirmation experiment results. The reported maximum error values are tabulated for the experiments with the maximum fit error among twenty-seven main experiments and eight confirmation experiments in separate columns. The initial fit including all data points resulted in a poor fit with 53% maximum error. In order to improve the accuracy of the fit, it has been decided to exclude outliers from the fit selectively. A systematic approach has been adapted by excluding each run combination one by one, and repeating the curve fit to identify the best fit providing the minimum error for all the experiments. After identifying the outlier experiments that provide the most fit improvement, the combinations of these experiments have been excluded to achieve a better fit. Four outlier experiments are identified as combinations numbered 3, 6, 17, and 20. These four outlier experiments are gradually excluded from the derivation of the closed form equation. For the cases labeled as “one outlier excluded”, each one of the identified outlier experiments is excluded from the equation fit process systematically one at a time. Four different equations have been derived for each case. Calculated leakage rates using these equations are compared with the experimental data from both all main experiments and confirmation experiments. The closed form equation, where outlier combination #17 is excluded from the fit, yielded the lowest “max error” when compared to the leakage data from the main experiments. However, this error was still too high with the rate of 45%. On the other hand, the closed form equation, where outlier combination #3 is excluded from the fit, yielded the lowest “max error” when compared to the leakage data from the confirmation experiments. Again, this error was also very high with the rate of 38%. Therefore, it has been decided to proceed with the selective outlier exclusion process by conducting exclusions two at a time, then three at a time, and all four at once.
The selective outlier exclusion forming the equation fit process indicates that maximum error decreases when higher number of outliers are excluded. The lowest error has been achieved where all four outlier combinations are excluded from the equation fit process. The resulting equation ends up with leakage estimates with maximum 20% error when compared to each of all main experiments and confirmation experiments. Therefore, the final closed form equation is selected by excluding the experiments 3, 6, 17, and 20 from the fit process. The final model fits the data with 95% R2 value and with 90% adjusted R2 value.
The final closed form equation defining the relationship between the strong parameters and normalized leakage rate is presented in Equation (6):
Normalized Leakage = −65.98 + 1.454 SD + 3.349 CW + 0.01393 PD + 9.9 OF + 0.0083 SD × SD − 0.0132 CW × CW + 0.000003 PD × PD + 4.92 OF × OF − 0.0797 SD × CW − 0.000114 SD × PD − 0.195 SD × OF − 0.000417 CW × PD − 0.205 CW × OF − 0.00785 PD × OF
Calculated leakage rates are compared with the test data from eight confirmation experiments, and tabulated in Table 7. There is no observed correlation between error rate and levels of the parameters. However, the error can be as high as 20% for the estimates of the derived equation. In order to understand whether fit accuracy deteriorates further for other design combinations, it has been decided to use more test data. Therefore, additional eight experiments other than the previously tested combinations (twenty-seven main experiments and eight first confirmation experiments performed earlier) have been conducted. The results of the second confirmation runs are presented in Table 8. As the results indicate that all of the error levels are also below 20% in the second run of confirmation experiments. More than half of the experiments have less than 10% error as presented in Table 8.
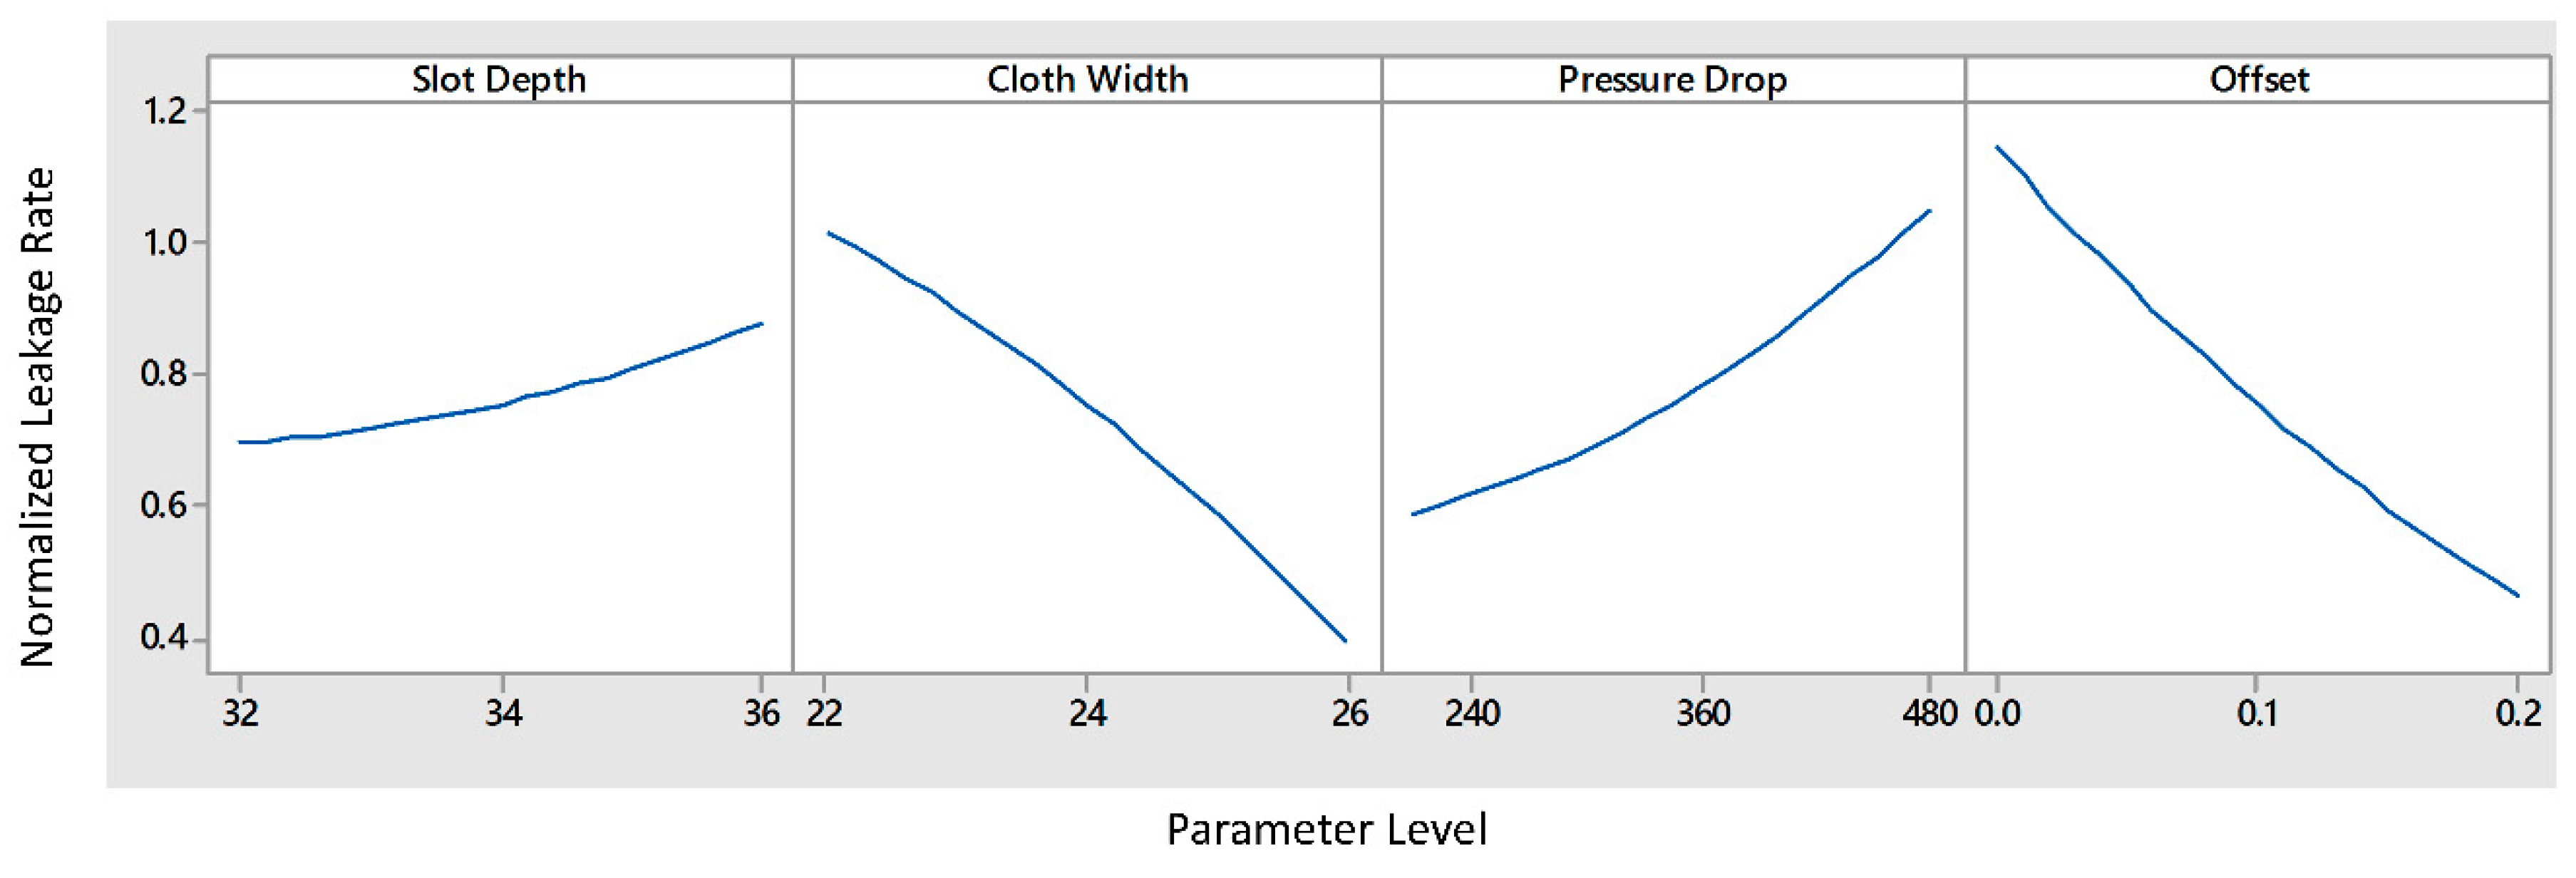
Figure 15 illustrates the variation trend of the normalized leakage rate with respect to four strong parameters. The parameters show nonlinear behaviors that cannot be detected in two-level screening experiments. It is also observed during screening experiments that leakage flow becomes higher with an increase in slot depth and leakage rate decreases with an increase in cloth width. As expected, leakage increases with a higher pressure drop. Leakage rate is decreasing with a higher offset level. The trend function of offset parameter is convex. Therefore, this trend may diminish or even reverse for extreme offset experiments. All trends obtained from main experiments are compatible with the ‘Effect Plot’ of screening experiments in Figure 10.
5. Conclusions
Gas turbines are required to operate at ever increasing efficiency levels. This trend results in a demand for more efficient sealing. The leakage performance of the cloth seal is dictated by pressure load and geometric parameters. In this study, the effect of geometric parameters under varying pressure load on the cloth seal leakage performance has been investigated. An experimental test setup has been established to measure leakage rate through cloth seals with various geometric dimensions under varying pressure load. Some outlines are presented below.
5.1. Screening Experiments
Eighteen parameters have been identified in terms of wear, compliancy, leakage, and structural performance. Based on general industrial practice and typical operational range, ten of these parameters have been set at the levels in order to reduce the problem size. The remaining eight parameters have been selected for further study through screening experiments. Sixteen combinations have been tested following two-level Resolution IV fractional factorial experiment design.
In the cloth seal design stages, it is important to determine the seal leakage performance depending on design parameters. The results show that pressure drop, cloth width, slot depth, and relative offset position of mating slot surfaces are determined as strong parameters with the highest influence on cloth seal leakage rate. These parameters need to be carefully determined in order to improve leakage performance. The results show that increasing cloth width and reducing slot depth are the most effective way to reduce leakage flow rate apart from reducing pressure drop. Shim thickness has the lowest impact. On average, experiments with ΔP = 482.6 kPa (70 psi) have two-fold leakage rates in comparison to experiments under ΔP = 206.8 kPa (30 psi) pressure load. Leakage increase is observed with a higher slot depth between lateral surfaces of the slot. When all other parameters are the same, higher slot depth experiments have a higher distance between lateral surface and shim tab as well. 36 mm slot depth experiments have higher leakage rates compared to 32 mm slot depth experiments. Small cloth width and large sealing gap between adjacent slots reduce seal seating surface area; therefore, flow is exposed to less resistance. It has been observed that leakage performance improves with a 0.2 mm offset in comparison to no offset condition.
Surface roughness, gap, mismatch position of mating surfaces, and shim thickness have been identified to have relatively less impact on leakage rate of cloth seals. Leakage rate increases with mismatch condition. Higher shim thickness causing higher stiffness raises leakage rate slightly. Rough surfaces are considered to promote better cloth interlocking at the mating surface resulting in slightly better sealing efficiency.
The observed equivalent gap performance rates provide a similar trend with experimental data published in the literature [12,24]. For baseline condition experiments, the normalized equivalent gap remains almost constant with respect to different pressure drop levels. For offset and mismatch condition experiments, a slight decrease in normalized equivalent gap occurs with increasing pressure drop. This may be an indication of slight shape change and slot conformance under more pressure due to the flexible nature of the cloth seals. For screening experiments, the experiment with minimum flow rate has 86% lower leakage rate than the experiment with maximum flow rate. This result explains that geometric dimensions and pressure can significantly affect leakage rate through the cloth seal.
5.2. Main and Confirmation Experiments
Four strong parameters are selected for the detailed investigation and used in the main experiments. Once the experiments have been conducted and a representative equation has been fit based on the main experiment results, four experiments have been identified as outliers. These four outlier combinations have been excluded during a final closed-form equation fit. The resulting equation predicts leakage rates with maximum 20% error when compared to main experiment tests and sixteen different confirmation experiments all of which have different parameter combinations than the main experiments. The observed effect trends of the parameters in the main experiments are compatible with the results of screening experiments. Through the use of multilevel main experiment design, nonlinear trends between parameters and leakage rates are also detected. As a result of this, although leakage performance becomes better with an increase in offset level, this benefit may diminish and even disappear with an extreme offset level.
Author Contributions
Conceptualization, E.G. and M.F.A.; methodology, E.G., M.F.A. and Y.D.; validation, E.G., M.F.A. and Y.D.; formal analysis, E.G.; investigation, E.G., M.F.A and Y.D.; data curation, E.G.; writing—original draft preparation, E.G.; writing—review and editing, M.F.A.; supervision, M.F.A. and Y.D.; project administration, M.F.A.; funding acquisition, E.G and M.F.A. All authors have read and agreed to the published version of the manuscript.
Funding
This work was funded by “SDM Research & Development Company” of Istanbul.
Conflicts of Interest
The authors declare no conflict of interest.
Appendix A
Uncertainty Analysis
Type A and Type B Uncertainty levels for leakage tests were studied. Type A obtained from repeated measurement results. Type A depends on the transient effects due to the compressor, test rig design, operating conditions, etc. Therefore, it is varying in each experiment. Lower Type A Uncertainty means less uncertainty between repeated measurements for an experiment:
Arithmetic mean of n results () is expressed in terms of measurements (xa) and the number of measurements (n). Standard deviation (s) is calculated with respect to variance and number of measurements. Type A Uncertainty (uA) is obtained from the equation expressed below:
Uncertainty calculations other than repeated measurements, are named Type B uncertainty. For a rectangular distribution, Type B Uncertainty (uB) is calculated from a semi-range between upper and lower limits (α) of the sensor.
Combined Uncertainty (uC) is calculated by squaring Type A and Type B Uncertainties, after that adding them each other, and then taking the square root of the overall.
Combined Uncertainty provides an uncertainty level equivalent to one standard deviation (68% level of confidence). To raise the level of confidence, Combined Uncertainty is multiplied by a coverage factor (k) and this gives Expanded Uncertainty. In this study, k = 3 is selected for a confidence level of 99.7%.
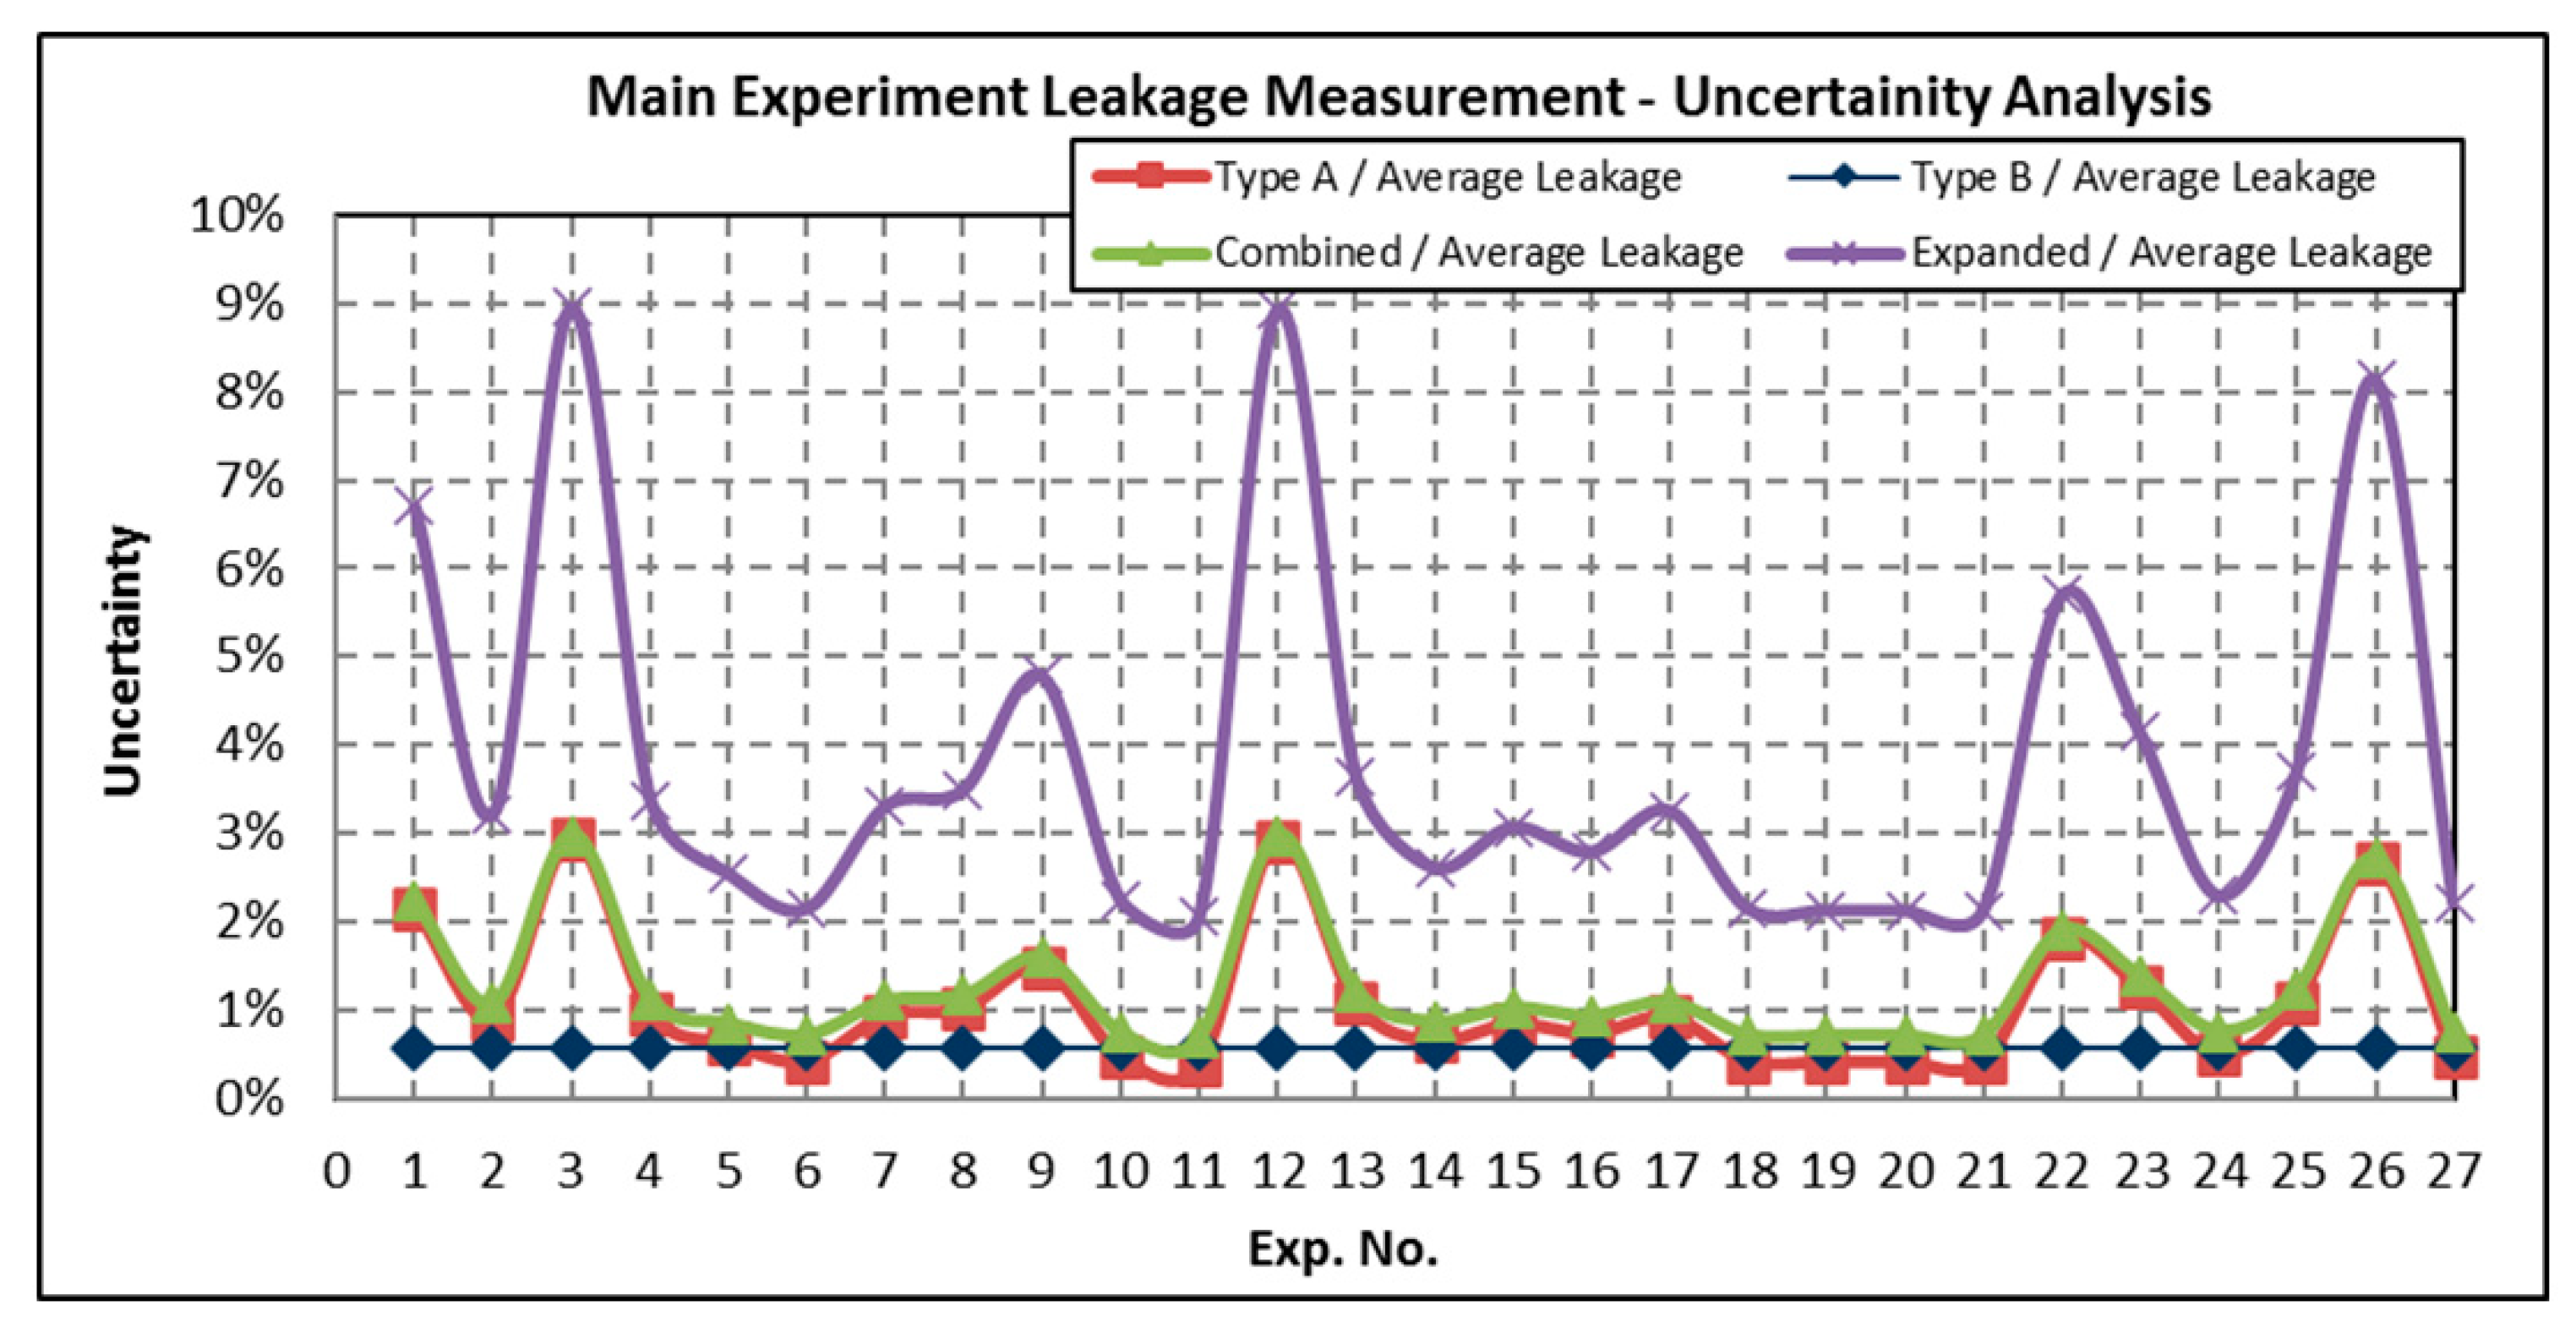
The uncertainty levels of screening and main experiment leakage tests are illustrated in Figure A1 and Figure A2, respectively. The calculated uncertainties are divided by the arithmetic mean of six corresponding pressure drop leakage results. Type B/Average Leakage is dependent on the accuracy of the flowmeter, therefore, it is constant for all experiments. Type A/Average Leakage is varying with respect to variance between measurements. Combined and Expanded Uncertainties follow a similar trend with Type A Uncertainty. Expanded Uncertainty/Average Leakage (k = 3, for a confidence level of 99.7%) is calculated less than 10% for all experiments.
Figure A1.
Uncertainty analyses for screening experiments.

Figure A2.
Uncertainty analyses for main experiments.
References
- Dogu, Y.; Aksit, M.F.; Bagepalli, B.; Burns, J.; Sexton, B.; Kellock, I. Thermal and flow analysis of cloth-seal in slot for gas turbine shroud applications. In Proceedings of the 34th AIAA/ASME/SAE/ASEE Joint Propulsion Conference and Exhibit, Cleveland, OH, USA, 13–15 July 1998. [Google Scholar] [CrossRef]
- Aksit, M.F. Seeking design solutions through decoupling problems—A global engineering example. ME Today ASME Int. Online J. Acad. Ind. Perspect. 2010, 11. Available online: https://citeseerx.ist.psu.edu/viewdoc/download?doi=10.1.1.611.9143&rep=rep1&type=pdf (accessed on 1 November 2020).
- Dinc, O.S.; Bagepalli, B.S.; Wolfe, C.; Aksit, M.F.; Calabrese, S. A new metal cloth stationary seal for gas turbine applications. In Proceedings of the 33rd AIAA/ASME/SAE/ ASEE Joint Propulsion Conference, AIAA Paper 97-2732, Seattle, WA, USA, 6–9 July 1997. [Google Scholar] [CrossRef]
- Paprotna, H.E.; Morrision, M.J. Biased Wear Resistant Turbine Seal Assembly. U.S. Patent US6733234B2, 11 May 2004. [Google Scholar]
- McMahan, K.W.; Demiroglu, M.; Repikov, T.R. Spring Loaded Seal Assembly for Turbines. U.S. Patent US8398090B2, 19 March 2013. [Google Scholar]
- Samudrala, O.; Sarawate, N.N. Cloth Seal for Turbo-Machinery. U.S. Patent US8613451B2, 24 December 2013. [Google Scholar]
- Riggi, V.T.; Monshower, B.; Hyslop, J.D. Brazed Turbine Seal. U.S. Patent US8696309B2, 15 April 2014. [Google Scholar]
- Sarawate, N.N.; Morgan, V.J.; Weber, D.W. Layered Seal for Turbomachinery. U.S. Patent US9188228B2, 17 November 2015. [Google Scholar]
- Chupp, R.E.; Hendricks, R.C.; Lattime, S.B.; Steinetz, B.M. Sealing in Turbomachinery; NASA/TM-2006-214341: Cleveland, OH, USA, 2006. [Google Scholar] [CrossRef]
- Johnston, J.R. Performance and Reliability Improvements for Heavy-Duty Gas Turbines; GE Power Systems: Schenectady, NY, USA, 2002. [Google Scholar]
- Aksit, M.F.; Bagepalli, B.S.; Aslam, S. High performance combustor cloth seals. In Proceedings of the 36th AIAA/ASME/SAE/ASEE Joint Cleveland, Ohio Propulsion Conference & Exhibit, Huntsville, AL, USA, 16–19 July 2000. [Google Scholar] [CrossRef]
- Aksit, M.F.; Bagepalli, B.S.; Demiroglu, M.; Dinc, O.S.; Kellock, I.; Farell, T. Advanced flexible seals for gas turbine shroud applications. In Proceedings of the 35th AIAA/ASME/SAE/ASEE Joint Propulsion Conference & Exhibit, Los Angeles, CA, USA, 20–24 June1999. [Google Scholar] [CrossRef]
- Amaki, K.; Hasegawa, T.; Narumi, T. Drag Reduction in the Flow of Aqueous Solutions of Detergent Through Mesh Screens. Nihon Reoroji Gakkaishi 2008, 36, 125–131. [Google Scholar] [CrossRef] [Green Version]
- Kolodziej, A.; Lojewska, J. Experimental and Modelling Study on Flow Resistance of Wire Gauzes. Chem. Eng. Process 2009, 48, 816–822. [Google Scholar] [CrossRef]
- Yoshida, Y.; Inoue, Y.; Shimosaka, A.; Shirakawa, Y.; Hidaka, J. Effect of Aperture Structure of Dutch Weave Mesh on Flow Resistivity. J. Chem. Eng. Jpn. 2015, 48, 730–741. [Google Scholar] [CrossRef] [Green Version]
- Ongun, R.; Aksit, M.F.; Goktug, G. A simple model for wear of metal cloth seals. In Proceedings of the 40th AIAA/SAE/ASME/ASEE Joint Propulsion Conference & Exhibit, AIAA-2004-3892, Fort Lauderdale, FL, USA, 11–14 July 2004. [Google Scholar] [CrossRef]
- Archard, J.F. Contact and rubbing of flat surfaces. J. Appl. Phys. 1953, 24, 981. [Google Scholar] [CrossRef]
- Archard, J.F.; Hirst, W. The wear of metals under unlubricated conditions. Proc. Roy. Soc. 1956, 236, 397–410. [Google Scholar]
- Dogu, Y.; Bahar, A.S.; Sertcakan, M.C.; Piskin, A.; Arican, E.; Kocagul, M. Computational fluid dynamics investigation of brush seal leakage performance depending on geometric dimensions and operating conditions. J. Eng. Gas. Turbines Power 2016, 138, 032506. [Google Scholar] [CrossRef]
- Li, J.; Qiu, B.; Feng, Z. Experimental and numerical investigations on the leakage flow characteristics of the labyrinth brush seal. J. Eng. Gas Turbines Power 2012, 134, 102509. [Google Scholar] [CrossRef]
- Li, J.; Obi, S.; Feng, Z. The effects of clearance sizes on labyrinth brush seal leakage performance using a Reynolds-averaged Navier-Stokes solver and non-Darcian porous medium model. Proc. Inst. Mech. Eng. Part A J. Power Energy 2009, 223, 953–964. [Google Scholar] [CrossRef]
- Choi, S.M.; Choi, S.; Cho, H.H. Effect of Various Coolant Mass Flow Rates on Sealing Effectiveness of Turbine Blade Rim Seal at First Stage Gas Turbine Experimental Facility. Energies 2020, 13, 4105. [Google Scholar] [CrossRef]
- Aksit, M.F.; Bagepalli, B.S.; Burns, J.; Stevens, P.; Vehr, J. Parasitic Corner Leakage Reduction in Gas Turbine Nozzle-Shroud Inter-Segment Locations. In Proceedings of the 37th AIAA/ASME/SAE/ASEE Joint Propulsion Conference & Exhibit, Salt Lake City, UT, USA, 8–11 July 2001. [Google Scholar] [CrossRef]
- Chupp, R.E.; Hendricks, R.C.; Lattime, S.B.; Steinetz, B.M.; Aksit, M.F. Turbomachinery Clearance Control. Turbine Aerodynamics, Heat Transfer, Materials, and Mechanics; AIAA: Reston, VA, USA, 2007; pp. 61–188. [Google Scholar] [CrossRef] [Green Version]
Figure 1.
Stationary sealing slot in a gas turbine stator.

Figure 2.
Relative positions of adjacent slots.

Figure 3.
Schematic of the cloth seal integration.
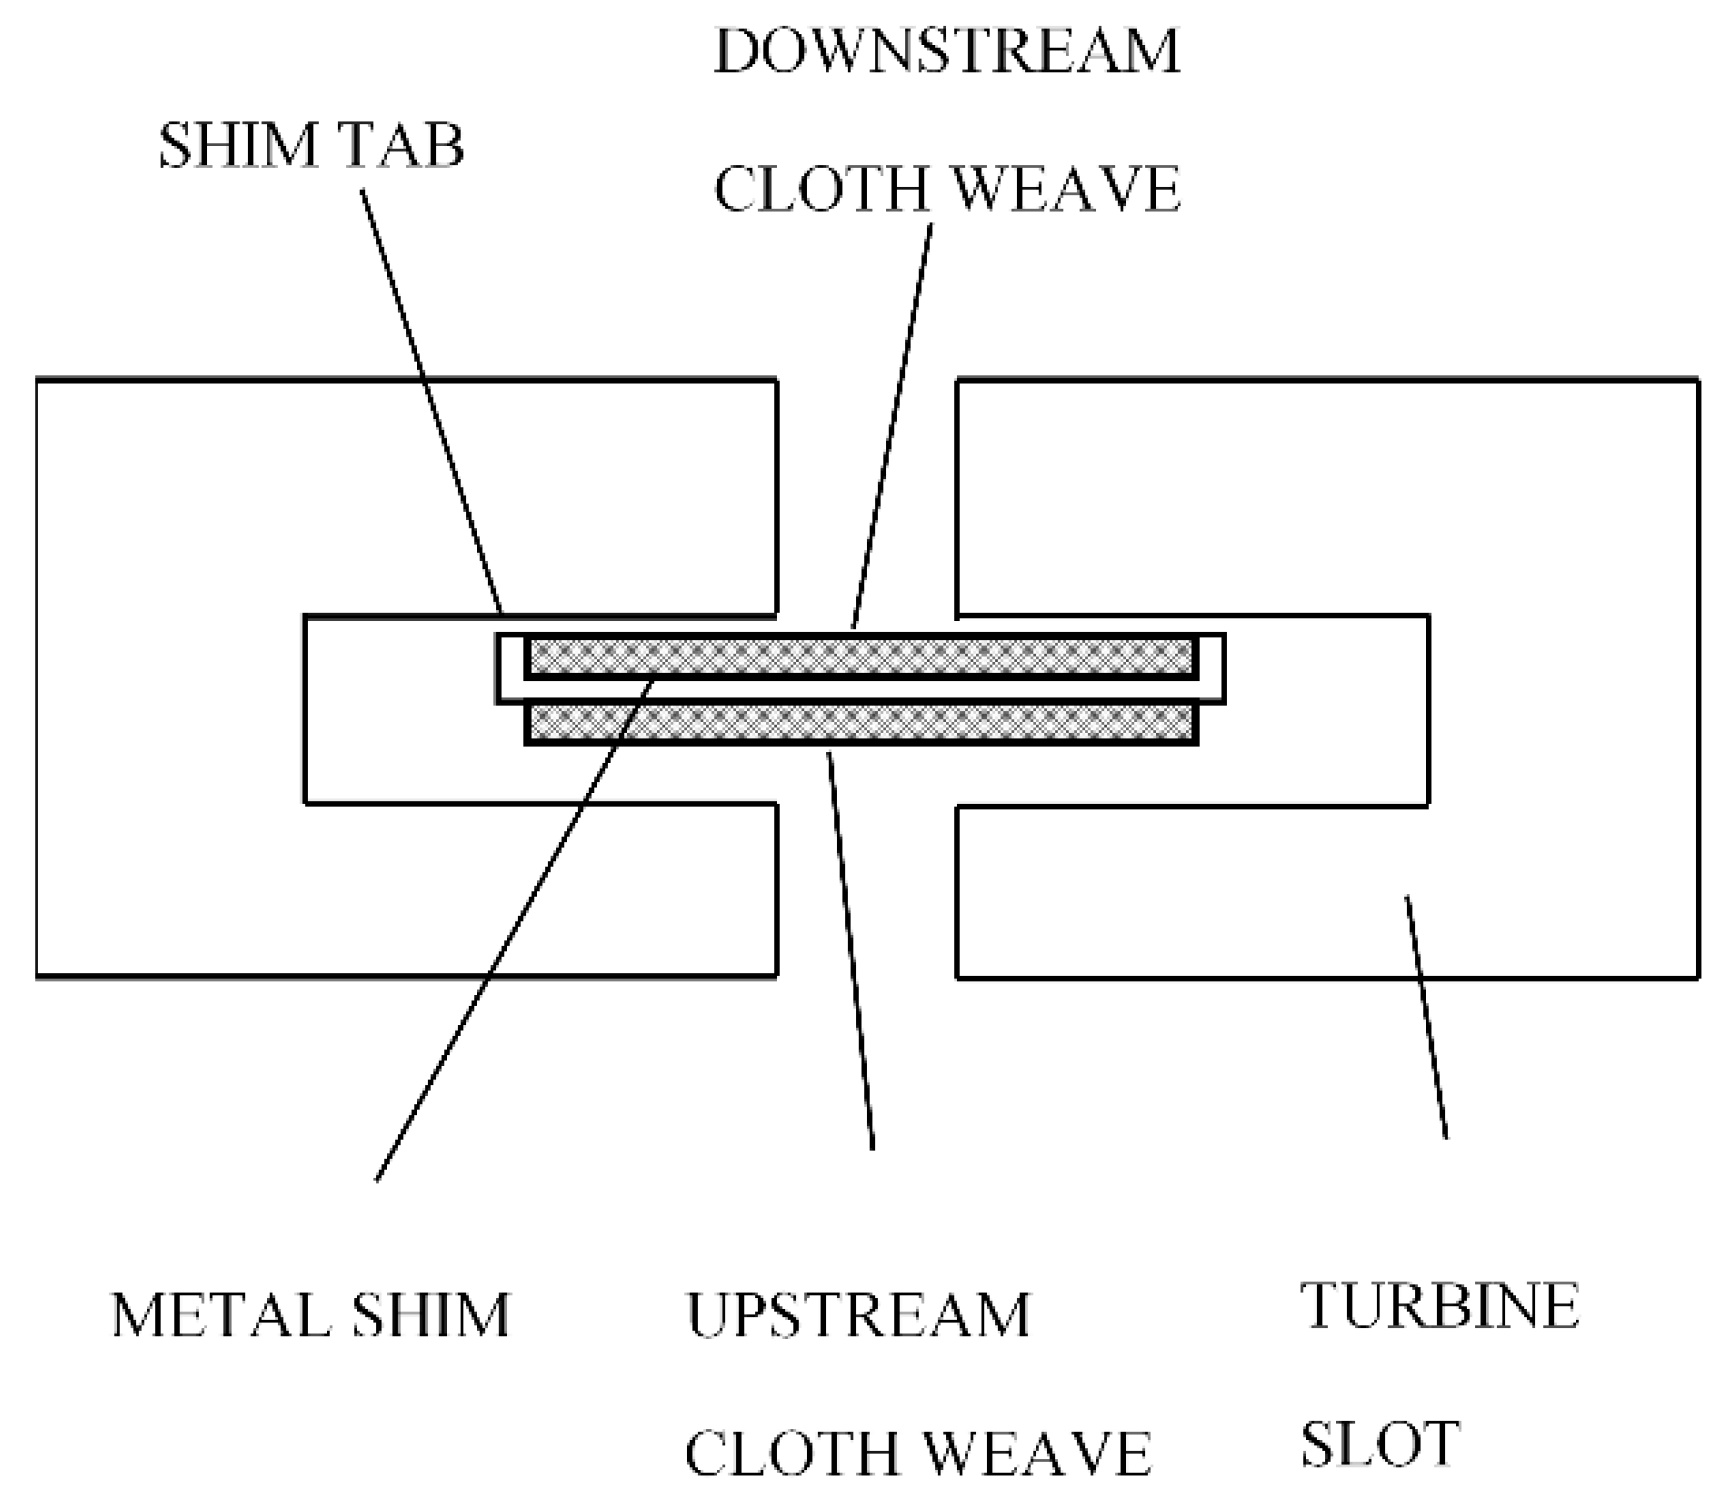
Figure 4.
Fluid flow through the cloth seal.
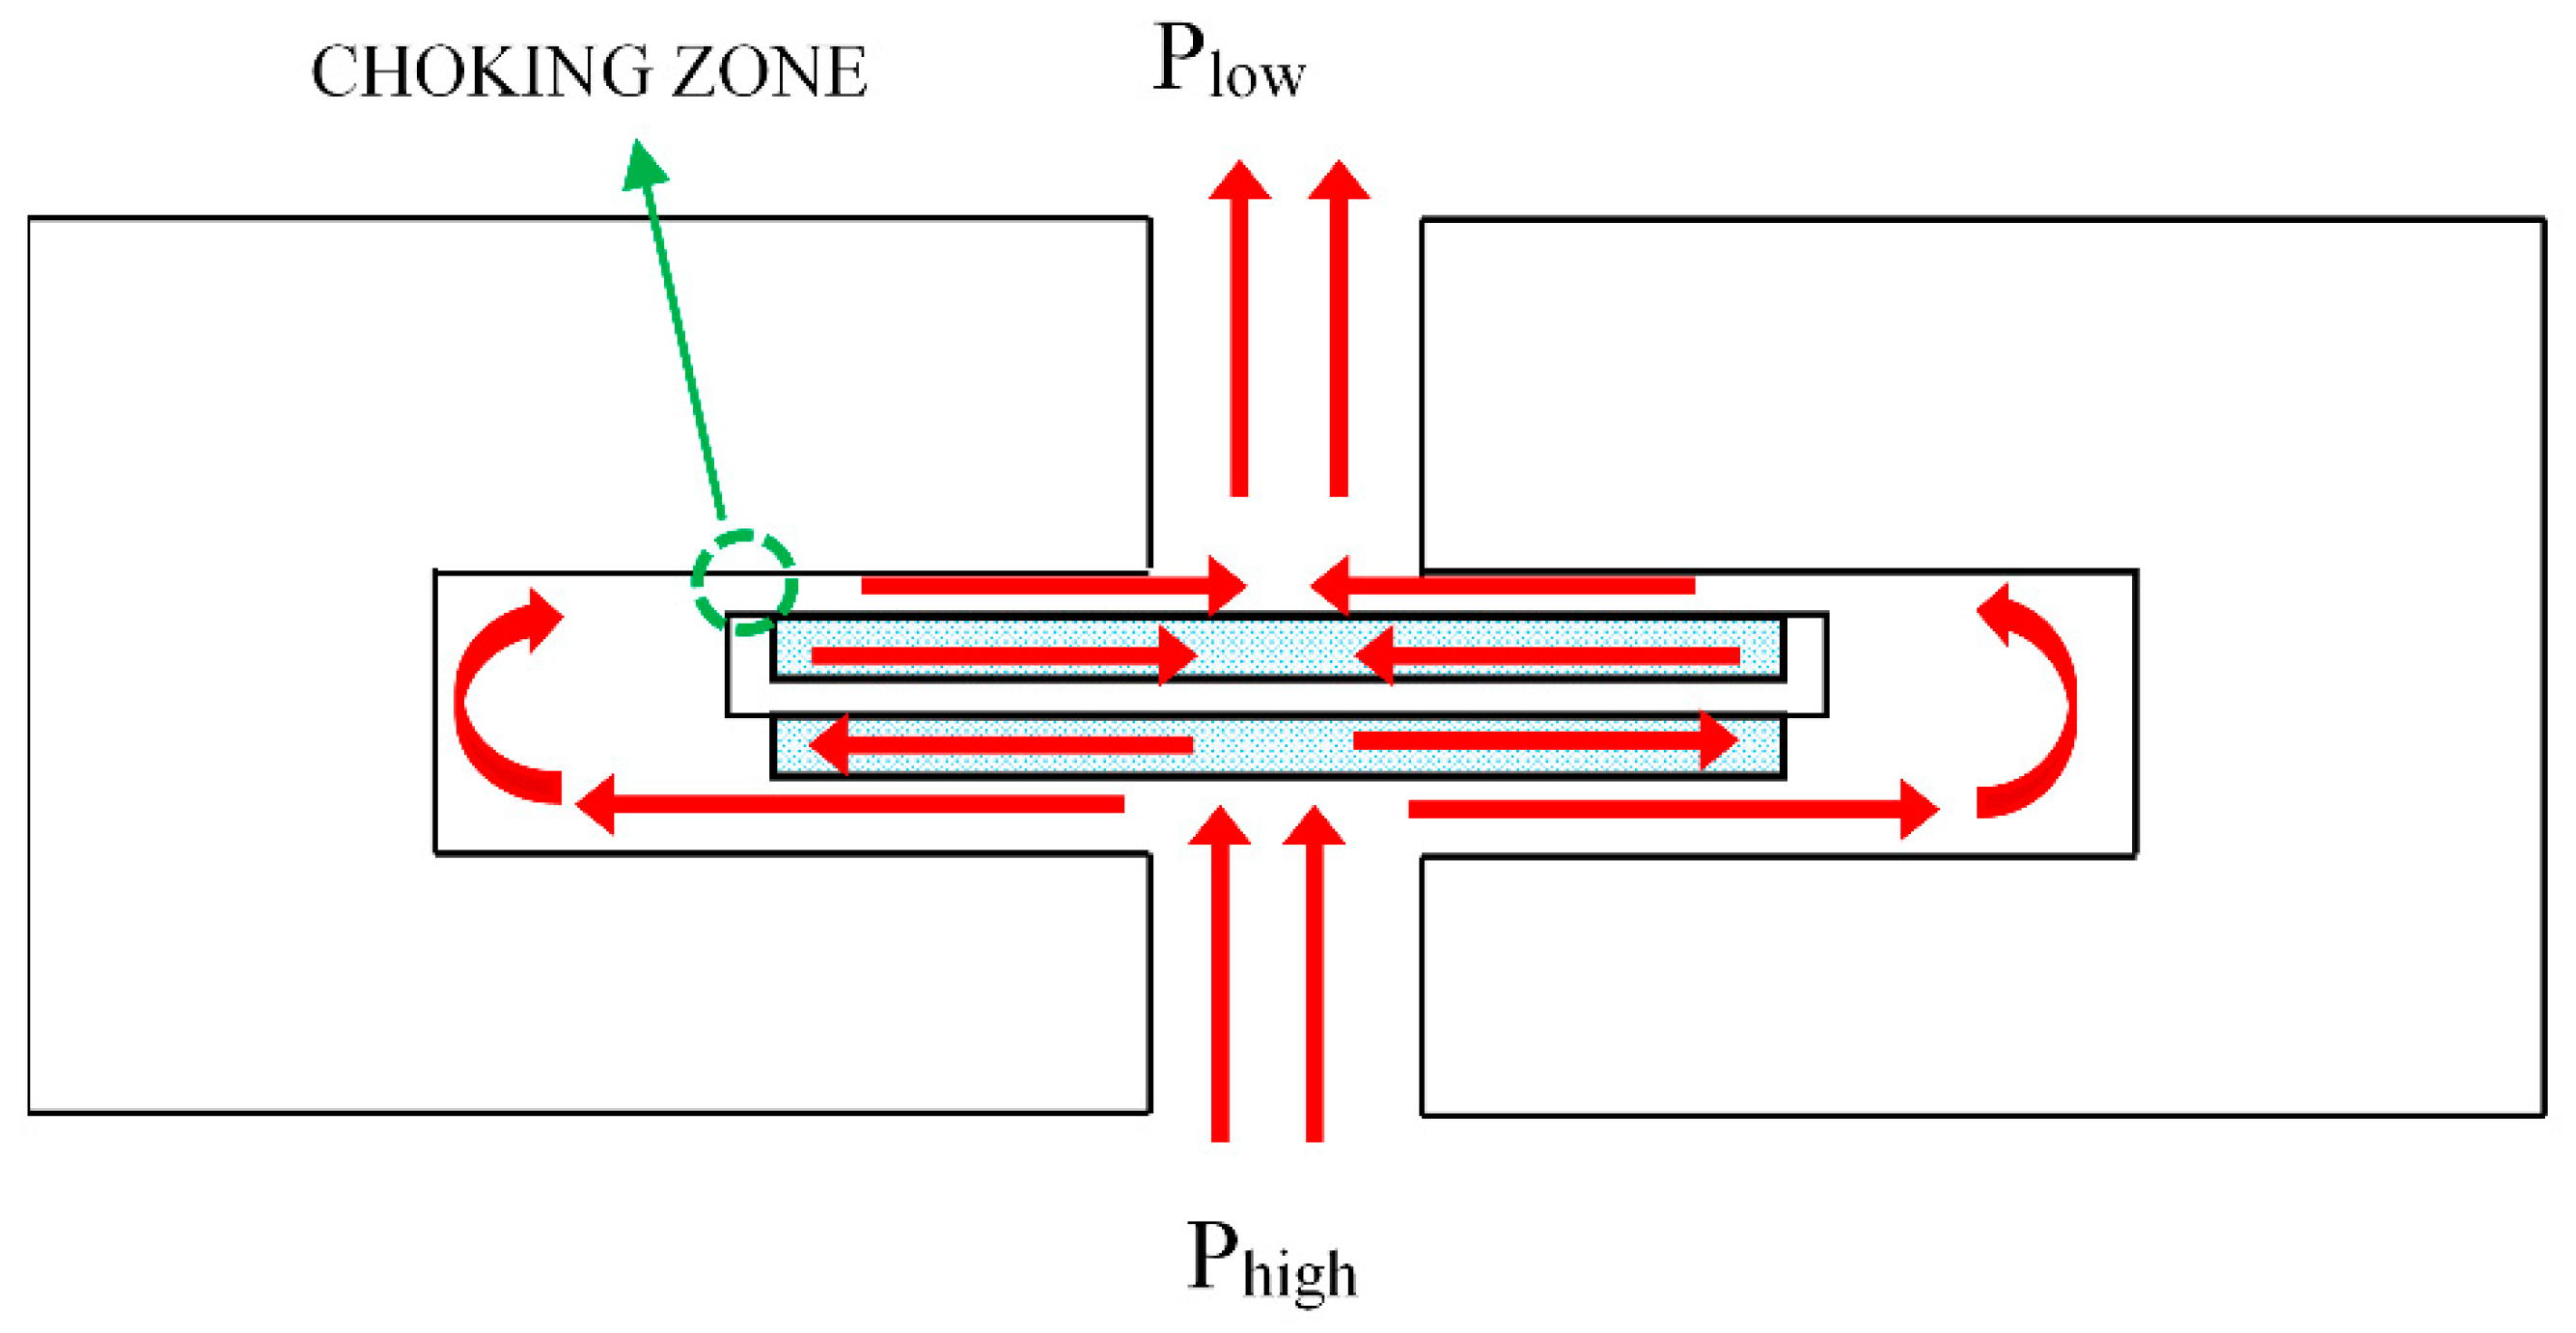
Figure 5.
Schematic and connections of the test system.
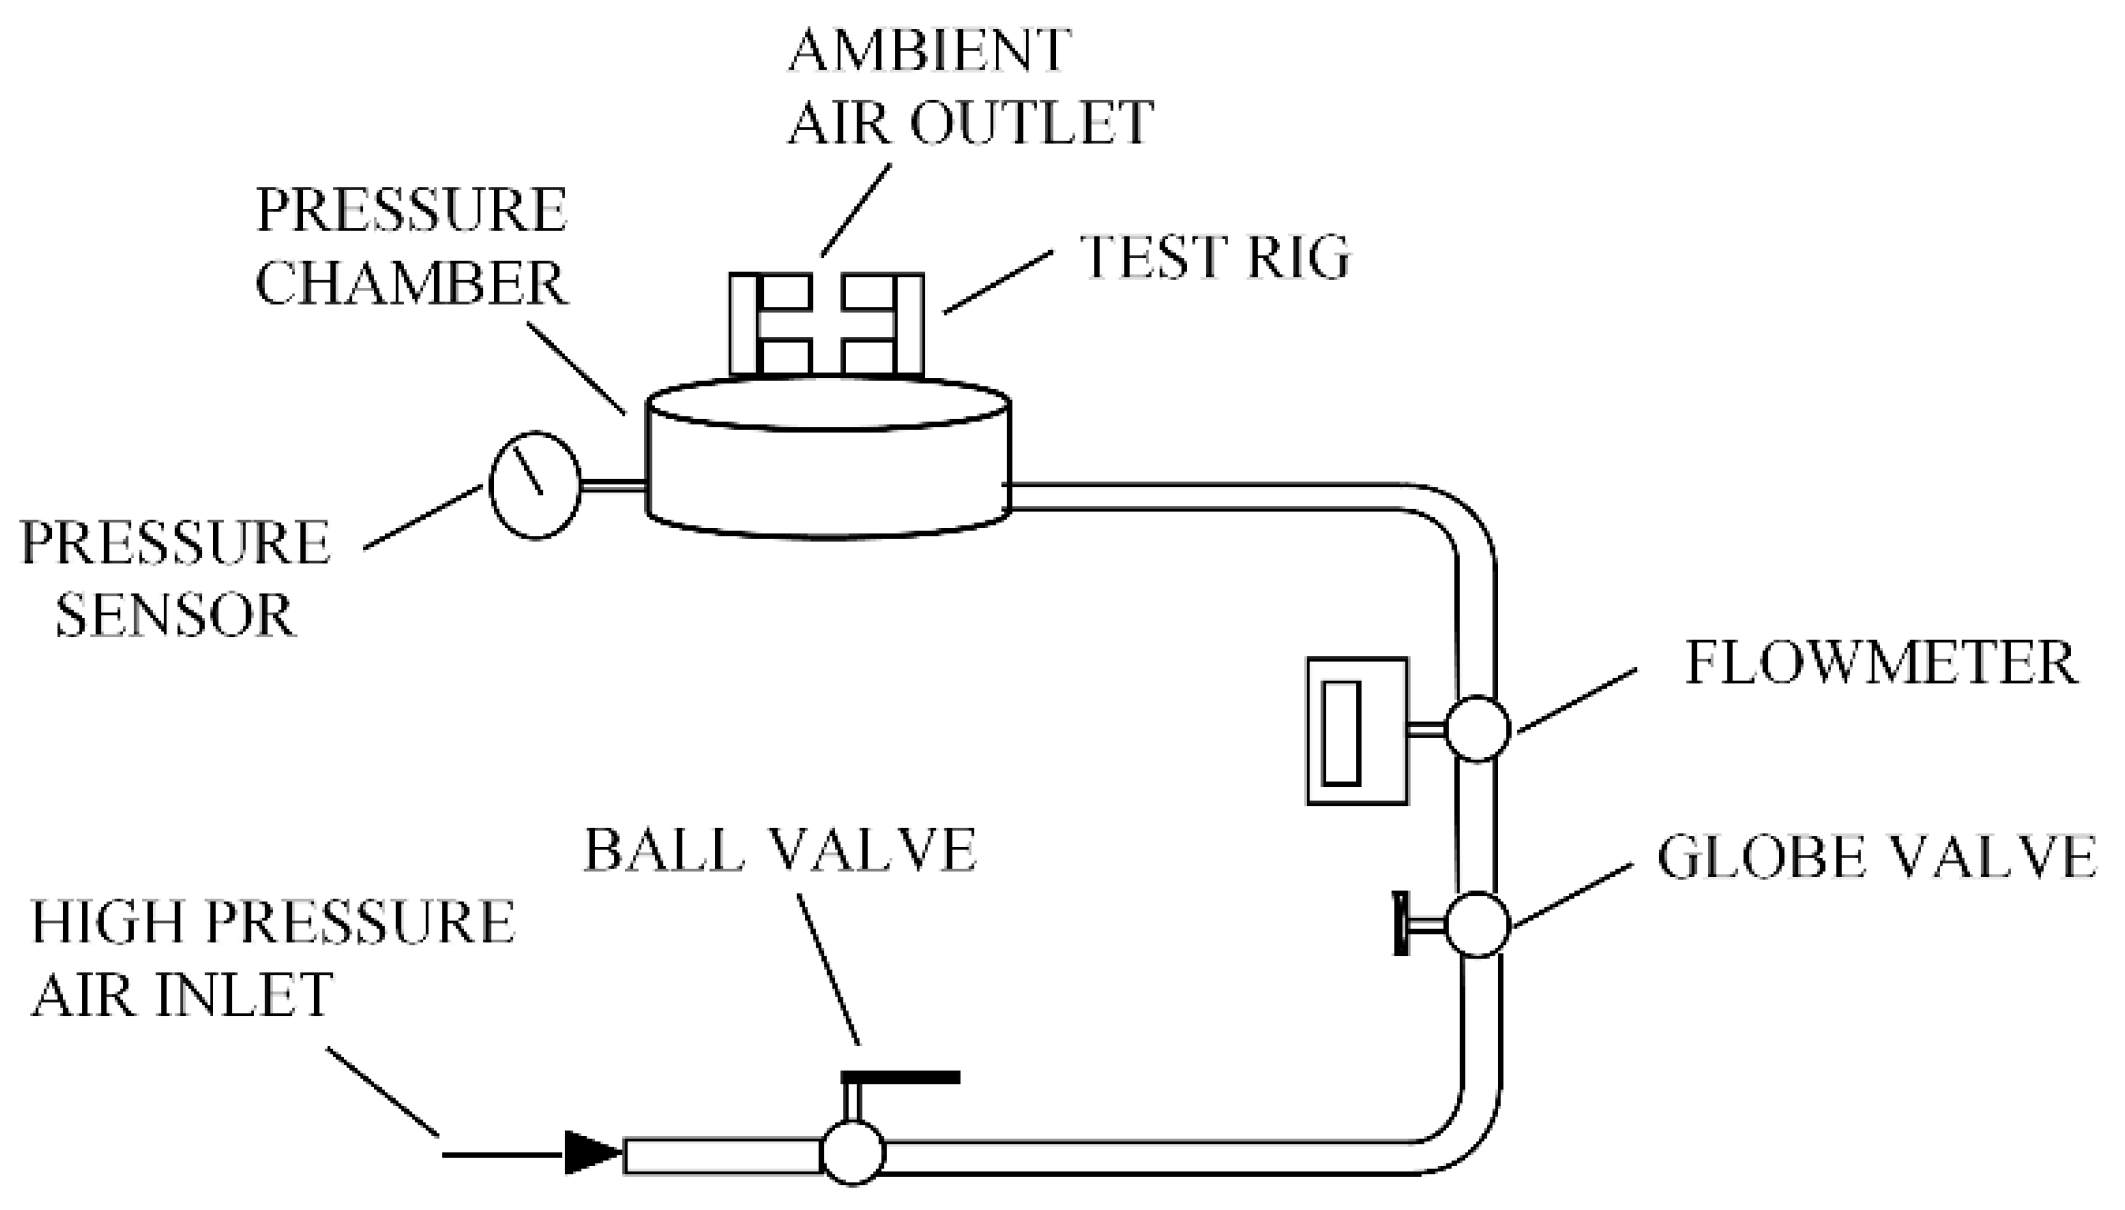
Figure 6.
Pressure chamber and leakage test rig design.

Figure 7.
Leakage test rig dimensions (the units are in mm).

Figure 8.
Cloth seal geometric parameters.
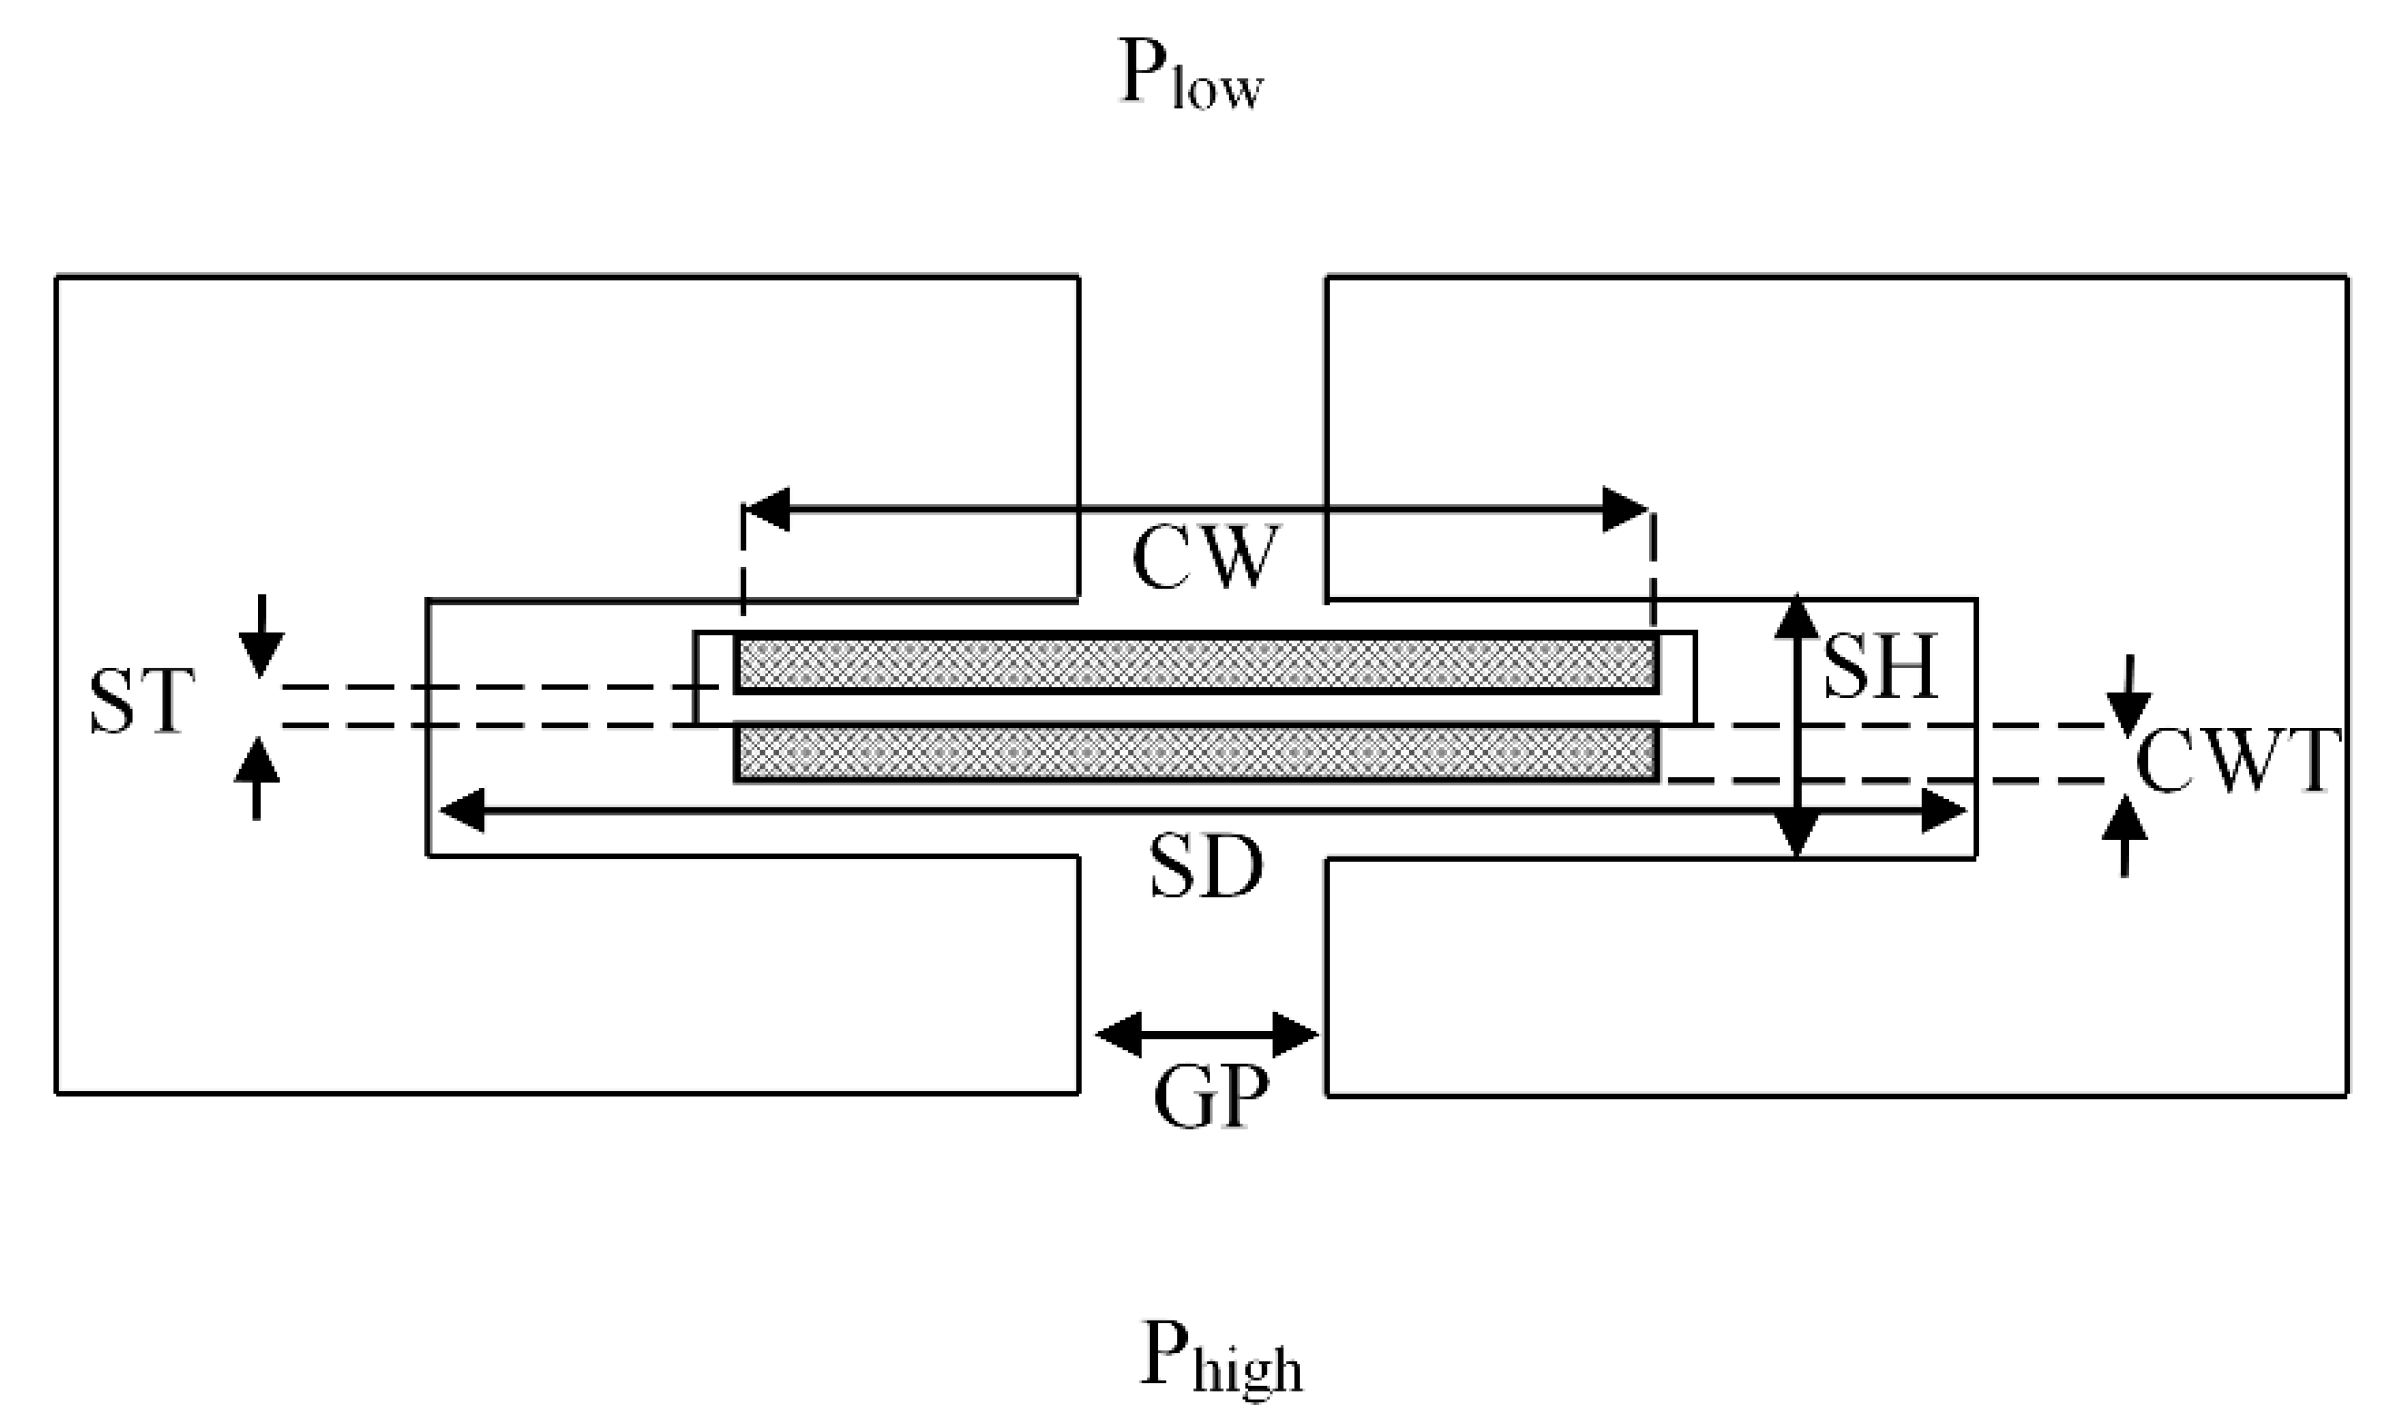
Figure 9.
Pareto chart for normalized leakage rate (screening experiments).

Figure 10.
The effect plots for normalized leakage rate (screening experiments).
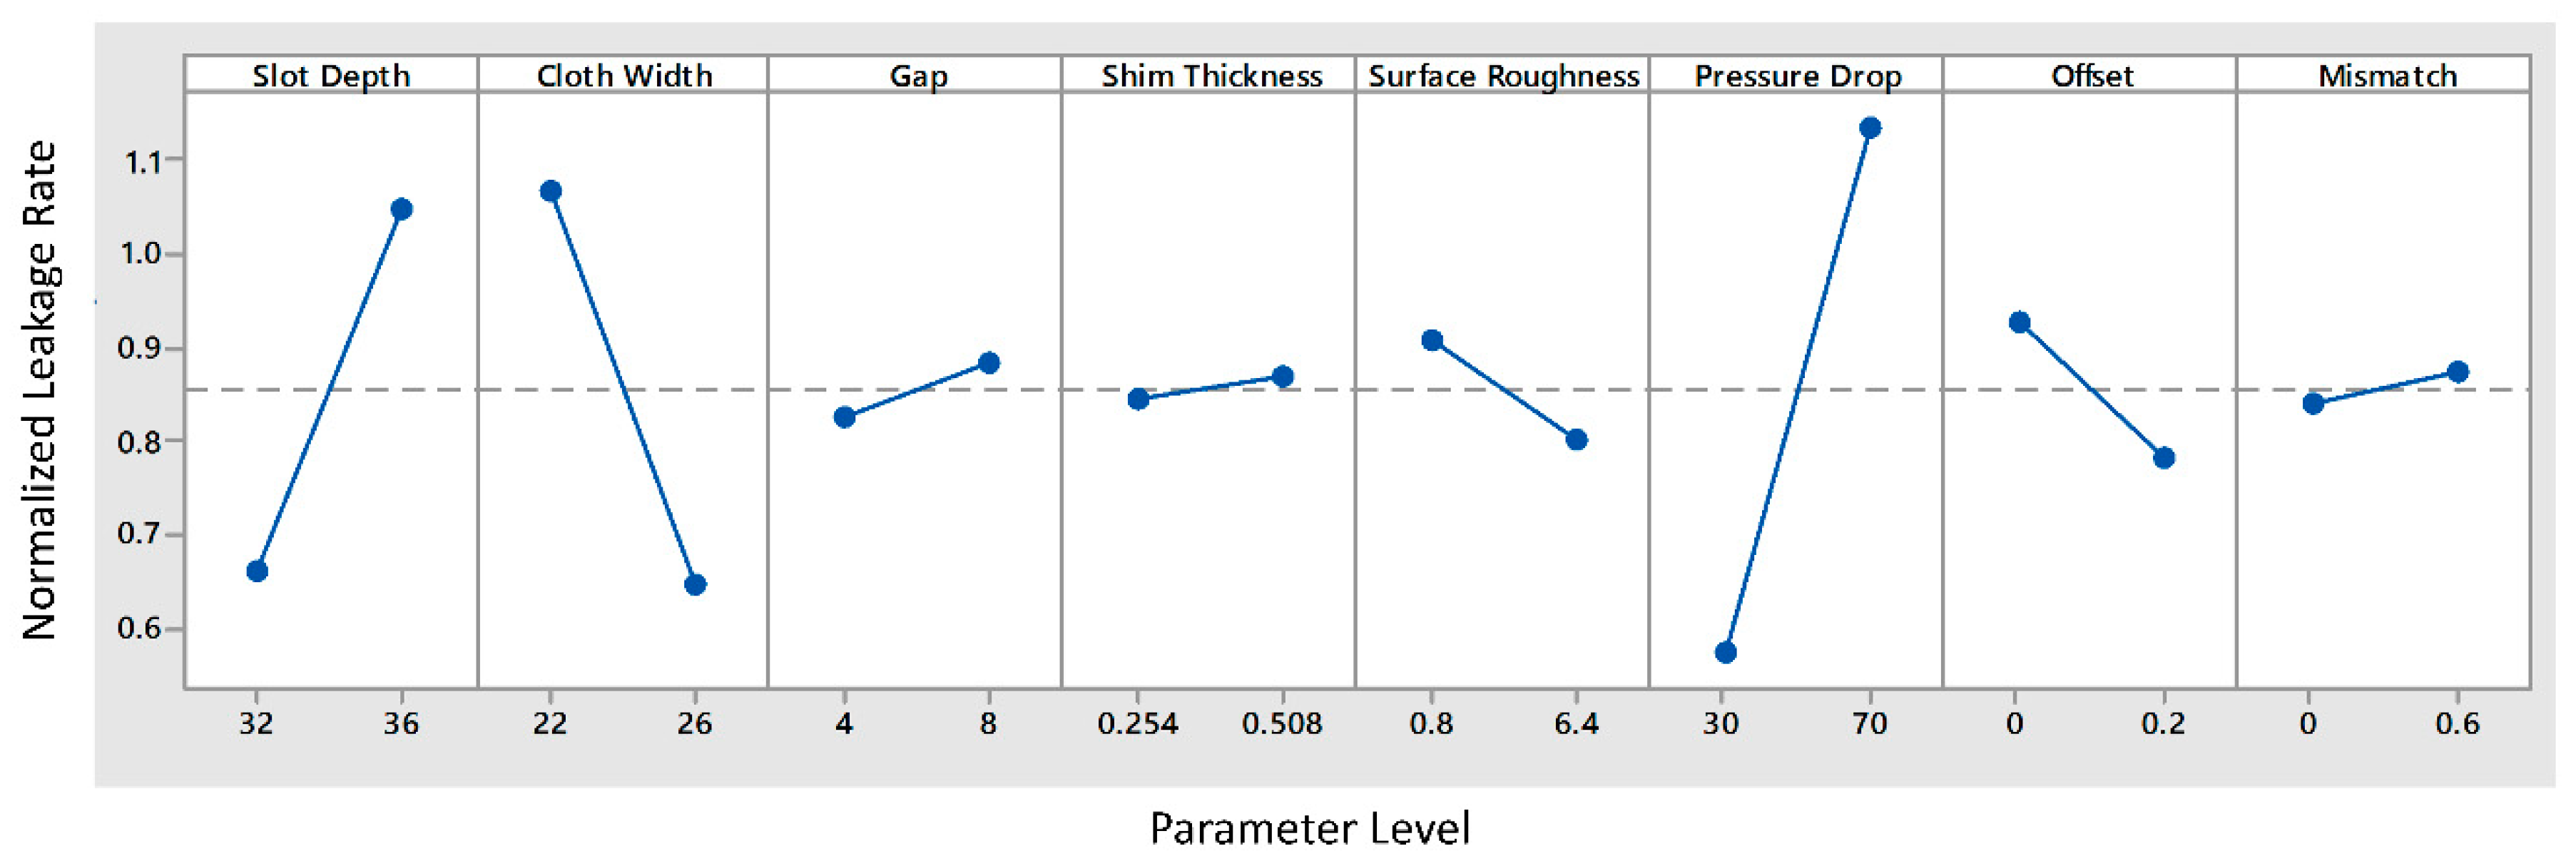
Figure 11.
Diagrams for dimensional changes, (a) slot depth; (b) cloth width; (c) gap; (d) shim thickness.
Figure 11.
Diagrams for dimensional changes, (a) slot depth; (b) cloth width; (c) gap; (d) shim thickness.

Figure 12.
Normalized leakage rate of experiments (screening experiments).

Figure 13.
Normalized equivalent gap data (baseline condition).

Figure 14.
Normalized equivalent gap data (offset and mismatch condition).

Figure 15.
The effect plots for normalized leakage rate (main experiments).

Table 1.
Candidate parameters for cloth seal leakage performance study.
| No | Parameter Name | Abbreviation | No | Parameter Name | Abbreviation |
|---|---|---|---|---|---|
| 1 | Slot depth | SD | 10 | Cloth material | CM |
| 2 | Cloth width | CW | 11 | Cloth weave thickness | CWT |
| 3 | Gap | GP | 12 | Dia. of warp fiber | DW |
| 4 | Shim thickness | ST | 13 | Dia. of shute fiber | DS |
| 5 | Surface roughness | SR | 14 | Weave type | WT |
| 6 | Pressure drop | PD | 15 | Weave density | WD |
| 7 | Offset | OF | 16 | Spot weld dia. | SW |
| 8 | Mismatch | MI | 17 | Slot height | SH |
| 9 | Shim material | SM | 18 | Temperature | TE |
Table 2.
Parameters of screening experiments with levels.
| No | Parameter Name | Unit | Abbreviation | Level |
|---|---|---|---|---|
| 1 | Slot depth | mm | SD | 32–36 |
| 2 | Cloth width | mm | CW | 22–26 |
| 3 | Gap | mm | GP | 4–8 |
| 4 | Shim thickness | mm | ST | 0.254–0.508 |
| 5 | Surface roughness | µm | SR | 0.8–6.4 |
| 6 | Pressure drop | kPad | PD | 206.8–482.6 |
| 7 | Offset | mm | OF | 0–0.2 |
| 8 | Mismatch | ° | MI | 0–0.6 |
Table 3.
Screening experiments.
| Exp. No. | SD (mm) | CW (mm) | GP (mm) | ST (mm) | SR (µm) | PD (kPad) | OF (mm) | MI (°) |
|---|---|---|---|---|---|---|---|---|
| 1 | 32 | 22 | 4 | 0.254 | 0.8 | 206.8 | 0 | 0 |
| 2 | 36 | 22 | 4 | 0.254 | 0.8 | 482.6 | 0.2 | 0.6 |
| 3 | 32 | 26 | 4 | 0.254 | 6.4 | 206.8 | 0.2 | 0.6 |
| 4 | 36 | 26 | 4 | 0.254 | 6.4 | 482.6 | 0 | 0 |
| 5 | 32 | 22 | 8 | 0.254 | 6.4 | 482.6 | 0.2 | 0 |
| 6 | 36 | 22 | 8 | 0.254 | 6.4 | 206.8 | 0 | 0.6 |
| 7 | 32 | 26 | 8 | 0.254 | 0.8 | 482.6 | 0 | 0.6 |
| 8 | 36 | 26 | 8 | 0.254 | 0.8 | 206.8 | 0.2 | 0 |
| 9 | 32 | 22 | 4 | 0.508 | 6.4 | 482.6 | 0 | 0.6 |
| 10 | 36 | 22 | 4 | 0.508 | 6.4 | 206.8 | 0.2 | 0 |
| 11 | 32 | 26 | 4 | 0.508 | 0.8 | 482.6 | 0.2 | 0 |
| 12 | 36 | 26 | 4 | 0.508 | 0.8 | 206.8 | 0 | 0.6 |
| 13 | 32 | 22 | 8 | 0.508 | 0.8 | 206.8 | 0.2 | 0.6 |
| 14 | 36 | 22 | 8 | 0.508 | 0.8 | 482.6 | 0 | 0 |
| 15 | 32 | 26 | 8 | 0.508 | 6.4 | 206.8 | 0 | 0 |
| 16 | 36 | 26 | 8 | 0.508 | 6.4 | 482.6 | 0.2 | 0.6 |
Table 4.
The parameters of the main experiments with levels.
| No | Parameter Name | Unit | Abbreviation | Level |
|---|---|---|---|---|
| 1 | Slot depth | mm | SD | 32–34–36 |
| 2 | Cloth width | mm | CW | 22–24–26 |
| 3 | Gap | mm | GP | 4 |
| 4 | Shim thickness | mm | ST | 0.254 |
| 5 | Surface roughness | µm | SR | 6.4 |
| 6 | Pressure drop | kPad | PD | 206.8–344.7–482.6 |
| 7 | Offset | mm | OF | 0–0.1–0.2 |
| 8 | Mismatch | ° | MI | 0 |
Table 5.
Main experiments.
| Exp. No. | SD (mm) | CW (mm) | GP (mm) | ST (mm) | SR (µm) | PD (kPad) | OF (mm) | MI (°) |
|---|---|---|---|---|---|---|---|---|
| 1 | 32 | 22 | 4 | 0.254 | 6.4 | 344.7 | 0.1 | 0 |
| 2 | 32 | 26 | 4 | 0.254 | 6.4 | 344.7 | 0.1 | 0 |
| 3 | 32 | 24 | 4 | 0.254 | 6.4 | 344.7 | 0 | 0 |
| 4 | 32 | 24 | 4 | 0.254 | 6.4 | 344.7 | 0.2 | 0 |
| 5 | 32 | 24 | 4 | 0.254 | 6.4 | 206.8 | 0.1 | 0 |
| 6 | 32 | 24 | 4 | 0.254 | 6.4 | 482.6 | 0.1 | 0 |
| 7 | 34 | 24 | 4 | 0.254 | 6.4 | 206.8 | 0 | 0 |
| 8 | 34 | 24 | 4 | 0.254 | 6.4 | 482.6 | 0 | 0 |
| 9 | 34 | 24 | 4 | 0.254 | 6.4 | 206.8 | 0.2 | 0 |
| 10 | 34 | 24 | 4 | 0.254 | 6.4 | 482.6 | 0.2 | 0 |
| 11 | 34 | 22 | 4 | 0.254 | 6.4 | 206.8 | 0.1 | 0 |
| 12 | 34 | 26 | 4 | 0.254 | 6.4 | 206.8 | 0.1 | 0 |
| 13 | 34 | 22 | 4 | 0.254 | 6.4 | 482.6 | 0.1 | 0 |
| 14 | 34 | 26 | 4 | 0.254 | 6.4 | 482.6 | 0.1 | 0 |
| 15 | 34 | 22 | 4 | 0.254 | 6.4 | 344.7 | 0 | 0 |
| 16 | 34 | 26 | 4 | 0.254 | 6.4 | 344.7 | 0 | 0 |
| 17 | 34 | 22 | 4 | 0.254 | 6.4 | 344.7 | 0.2 | 0 |
| 18 | 34 | 26 | 4 | 0.254 | 6.4 | 344.7 | 0.2 | 0 |
| 19 | 34 | 24 | 4 | 0.254 | 6.4 | 344.7 | 0.1 | 0 |
| 20 | 34 | 24 | 4 | 0.254 | 6.4 | 344.7 | 0.1 | 0 |
| 21 | 34 | 24 | 4 | 0.254 | 6.4 | 344.7 | 0.1 | 0 |
| 22 | 36 | 22 | 4 | 0.254 | 6.4 | 344.7 | 0.1 | 0 |
| 23 | 36 | 26 | 4 | 0.254 | 6.4 | 344.7 | 0.1 | 0 |
| 24 | 36 | 24 | 4 | 0.254 | 6.4 | 344.7 | 0 | 0 |
| 25 | 36 | 24 | 4 | 0.254 | 6.4 | 344.7 | 0.2 | 0 |
| 26 | 36 | 24 | 4 | 0.254 | 6.4 | 206.8 | 0.1 | 0 |
| 27 | 36 | 24 | 4 | 0.254 | 6.4 | 482.6 | 0.1 | 0 |
Table 6.
Leakage rate error between experiments and closed form equation.
| Case | Outlier No(s) (from Main Experiments) | Max Error % (Main Experiments) | Max Error % (Confirmation Experiments) |
|---|---|---|---|
| Without Outlier | - | 53 | 53 |
| One Outlier Excluded | 3 | 56 | 38 |
| 6 | 55 | 49 | |
| 17 | 45 | 41 | |
| 20 | 53 | 53 | |
| Two Outliers Excluded | 3, 6 | 58 | 26 |
| 3, 17 | 33 | 40 | |
| 3, 20 | 43 | 50 | |
| 6, 17 | 35 | 29 | |
| 6, 20 | 30 | 37 | |
| 17, 20 | 47 | 43 | |
| Three Outliers Excluded | 3, 6, 17 | 35 | 33 |
| 3, 6, 20 | 39 | 44 | |
| 3, 17, 20 | 36 | 38 | |
| 6, 17, 20 | 39 | 33 | |
| Four Outliers Excluded | 3, 6, 17, 20 | 20 | 20 |
Table 7.
Leakage rate error between confirmation experiments and closed form equation.
| Exp. No. | SD (mm) | CW (mm) | GP (mm) | ST (mm) | SR (µm) | PD (kPad) | OF (mm) | MI (°) | Norm. Leak. (Eq.) | Norm. Leak. (Exp.) | Error |
|---|---|---|---|---|---|---|---|---|---|---|---|
| 1 | 32 | 22 | 4 | 0.254 | 6.4 | 206.8 | 0.1 | 0 | 0.3869 | 0.3306 | 15% |
| 2 | 32 | 24 | 4 | 0.254 | 6.4 | 206.8 | 0.2 | 0 | 0.4155 | 0.3339 | 20% |
| 3 | 32 | 24 | 4 | 0.254 | 6.4 | 344.7 | 0.1 | 0 | 0.7139 | 0.6651 | 7% |
| 4 | 34 | 22 | 4 | 0.254 | 6.4 | 344.7 | 0.1 | 0 | 1.0388 | 1.1325 | 9% |
| 5 | 34 | 26 | 4 | 0.254 | 6.4 | 344.7 | 0.1 | 0 | 0.4042 | 0.4850 | 20% |
| 6 | 34 | 22 | 4 | 0.254 | 6.4 | 206.8 | 0.2 | 0 | 0.6588 | 0.5273 | 20% |
| 7 | 34 | 24 | 4 | 0.254 | 6.4 | 206.8 | 0.1 | 0 | 0.6481 | 0.6007 | 7% |
| 8 | 36 | 24 | 4 | 0.254 | 6.4 | 206.8 | 0 | 0 | 1.1235 | 1.0195 | 9% |
Table 8.
Leakage rate error between additional confirmation experiments and closed form equation.
| Exp. No. | SD (mm) | CW (mm) | GP (mm) | ST (mm) | SR (µm) | PD (kPad) | OF (mm) | MI (°) | Norm. Leak. (Eq.) | Norm. Leak. (Exp.) | Error |
|---|---|---|---|---|---|---|---|---|---|---|---|
| 1 | 32 | 22 | 4 | 0.254 | 6.4 | 482.6 | 0.1 | 0 | 1.0464 | 1.0196 | 3% |
| 2 | 32 | 24 | 4 | 0.254 | 6.4 | 482.6 | 0.2 | 0 | 0.6285 | 0.6654 | 6% |
| 3 | 34 | 24 | 4 | 0.254 | 6.4 | 344.7 | 0.2 | 0 | 0.4863 | 0.5188 | 7% |
| 4 | 34 | 26 | 4 | 0.254 | 6.4 | 482.6 | 0 | 0 | 1.0652 | 0.9064 | 15% |
| 5 | 34 | 22 | 4 | 0.254 | 6.4 | 482.6 | 0.2 | 0 | 1.0389 | 0.9112 | 12% |
| 6 | 34 | 24 | 4 | 0.254 | 6.4 | 482.6 | 0.1 | 0 | 1.0147 | 0.9193 | 9% |
| 7 | 36 | 24 | 4 | 0.254 | 6.4 | 482.6 | 0 | 0 | 1.6437 | 1.7629 | 7% |
| 8 | 36 | 24 | 4 | 0.254 | 6.4 | 482.6 | 0.2 | 0 | 0.6748 | 0.7511 | 11% |
Publisher’s Note: MDPI stays neutral with regard to jurisdictional claims in published maps and institutional affiliations. |
© 2020 by the authors. Licensee MDPI, Basel, Switzerland. This article is an open access article distributed under the terms and conditions of the Creative Commons Attribution (CC BY) license (http://creativecommons.org/licenses/by/4.0/).
Share and Cite
MDPI and ACS Style
Gorgun, E.; Aksit, M.F.; Dogu, Y. A Study of Cloth Seal Leakage Performance Based on Geometry and Pressure Load. Energies 2020, 13, 5884. https://doi.org/10.3390/en13225884
AMA Style
Gorgun E, Aksit MF, Dogu Y. A Study of Cloth Seal Leakage Performance Based on Geometry and Pressure Load. Energies. 2020; 13(22):5884. https://doi.org/10.3390/en13225884
Chicago/Turabian StyleGorgun, Erdem, Mahmut Faruk Aksit, and Yahya Dogu. 2020. "A Study of Cloth Seal Leakage Performance Based on Geometry and Pressure Load" Energies 13, no. 22: 5884. https://doi.org/10.3390/en13225884
Note that from the first issue of 2016, this journal uses article numbers instead of page numbers. See further details here.