Investigating the Effect of Several Model Configurations on the Transient Response of Gas-Insulated Substation during Fault Events Using an Electromagnetic Field Theory Approach


 ,
, 
 and
and
Abstract
:1. Introduction
- Based on a rigorous state-of-the-art analysis, the authors wanted to highlight the drawbacks of the numerical methods applied toward GIS transient behavior analysis due to several important reasons. The paper aimed to address two major drawbacks of the electromagnetic modeling techniques:
- The lack of a validated digital avatar of the three-dimensional GIS metallic ensemble and adjacent metallic structures;
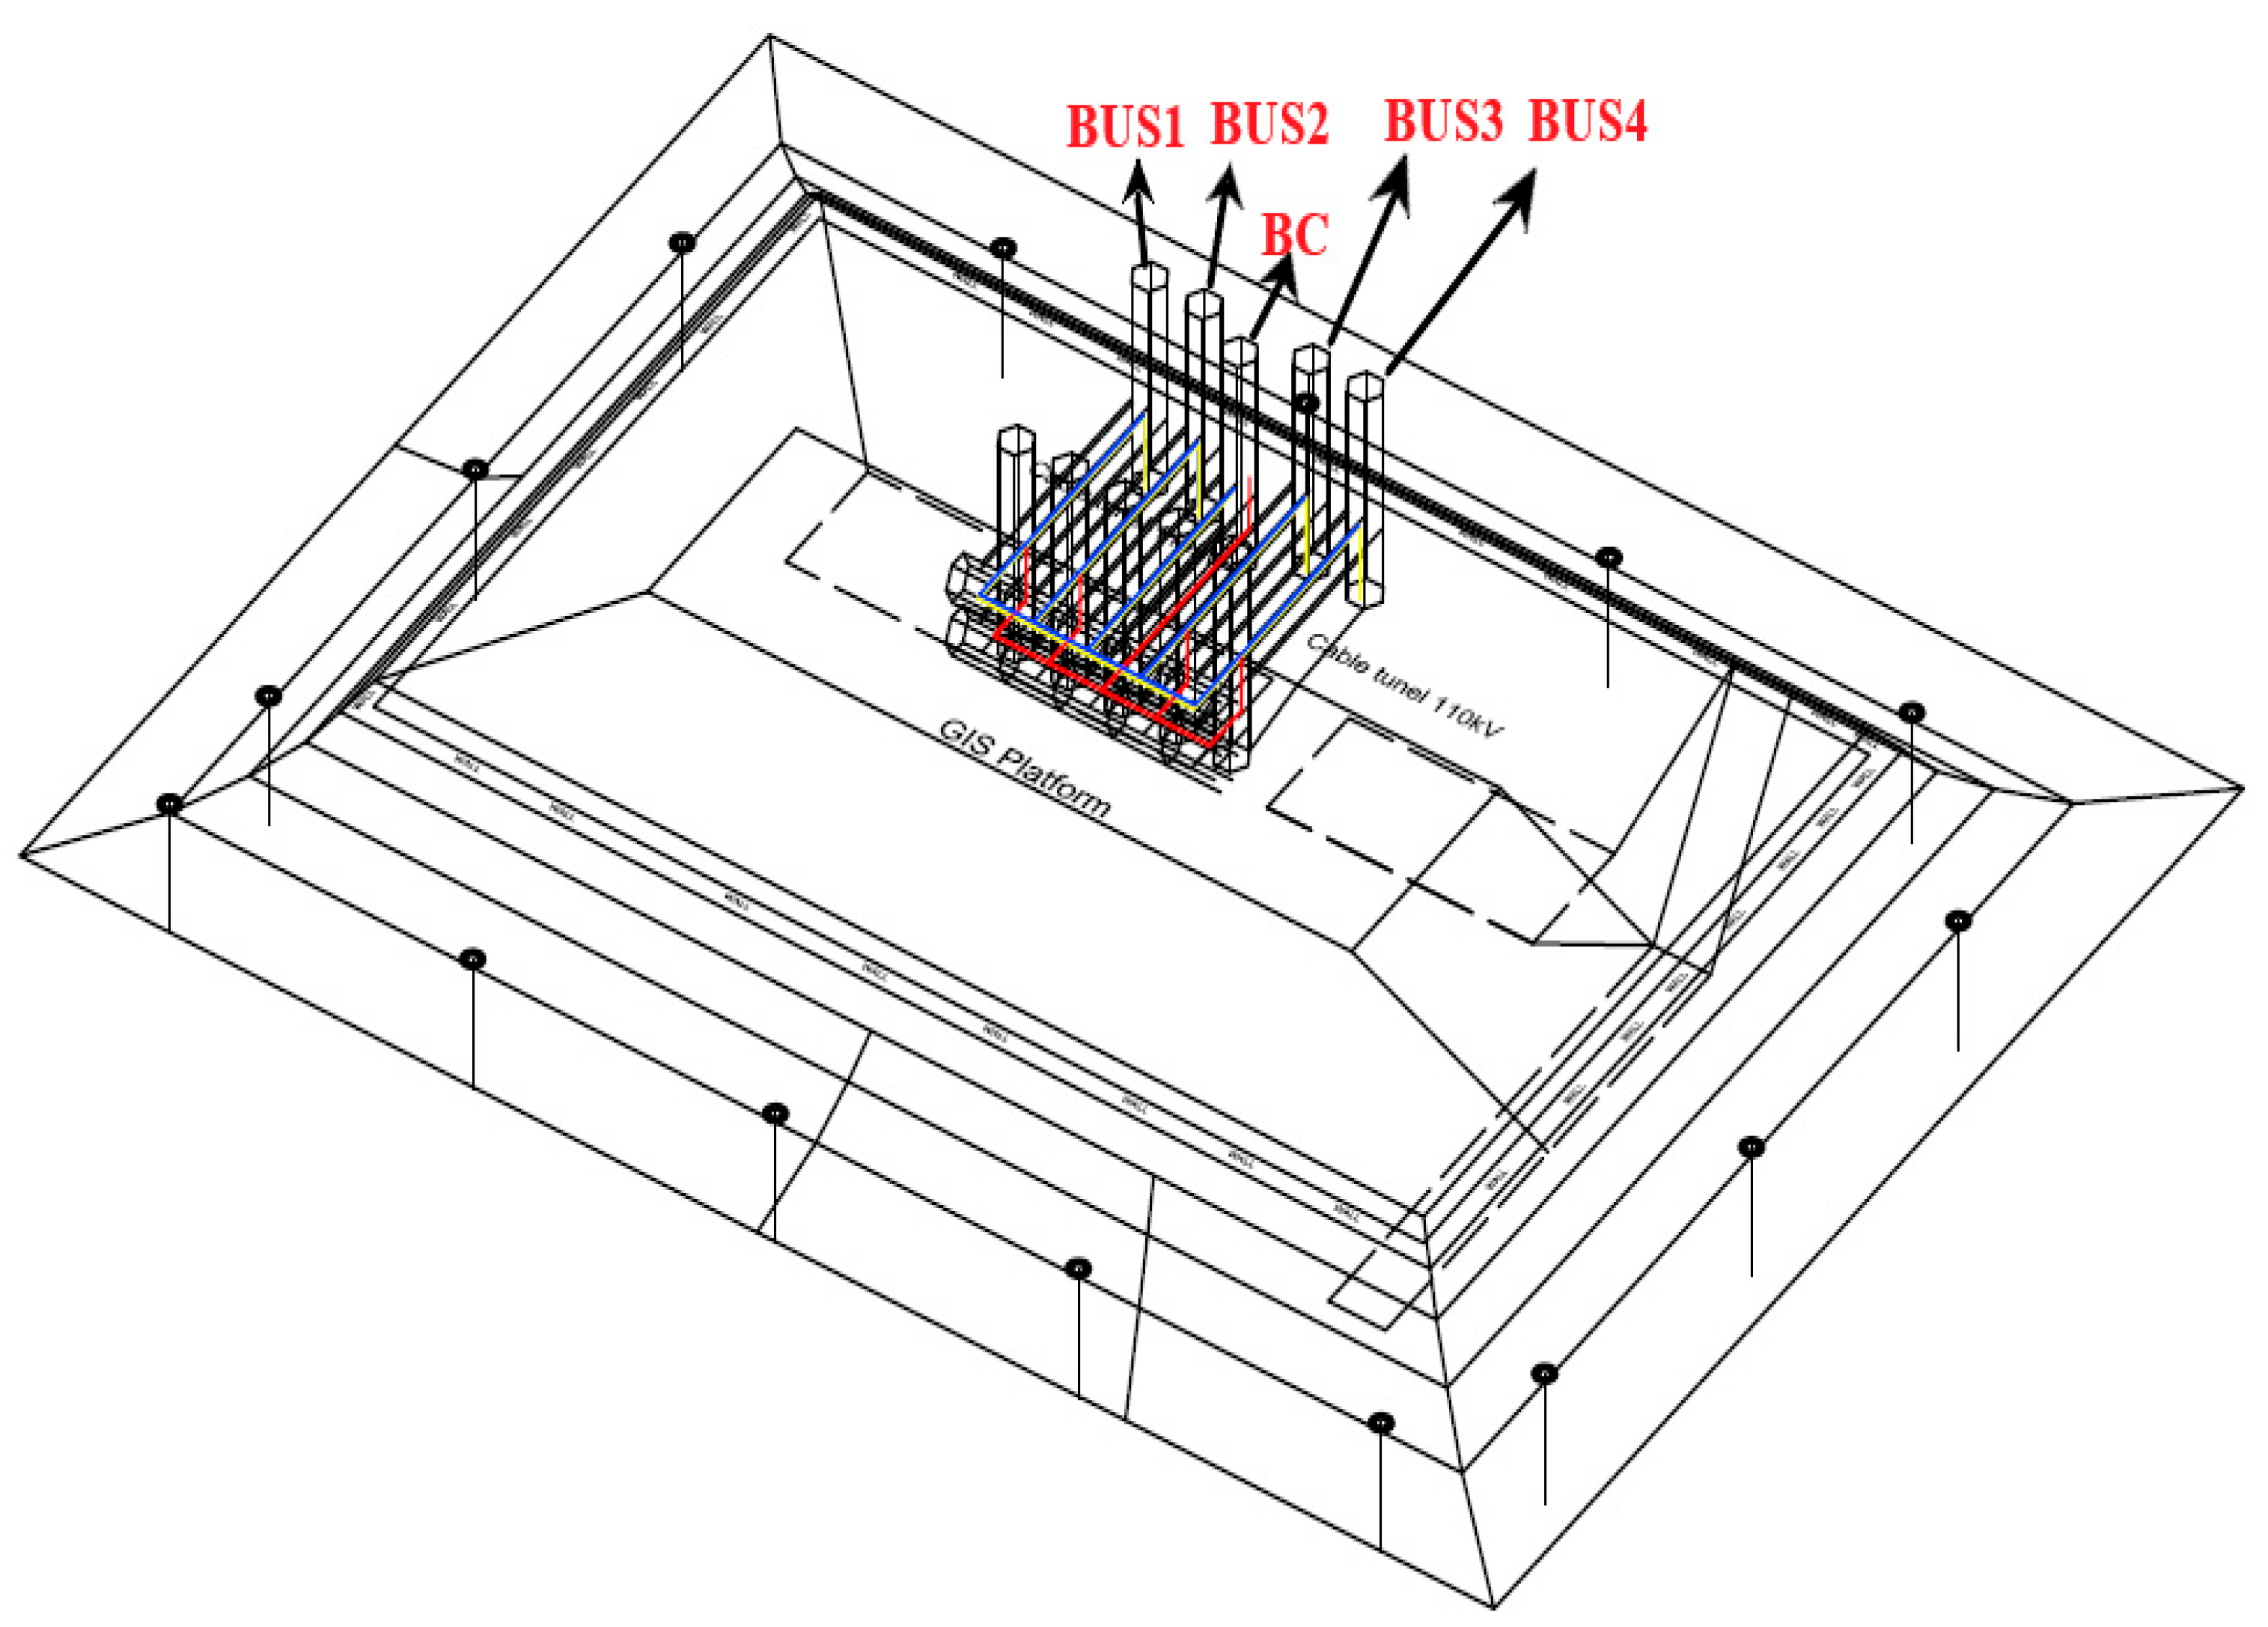
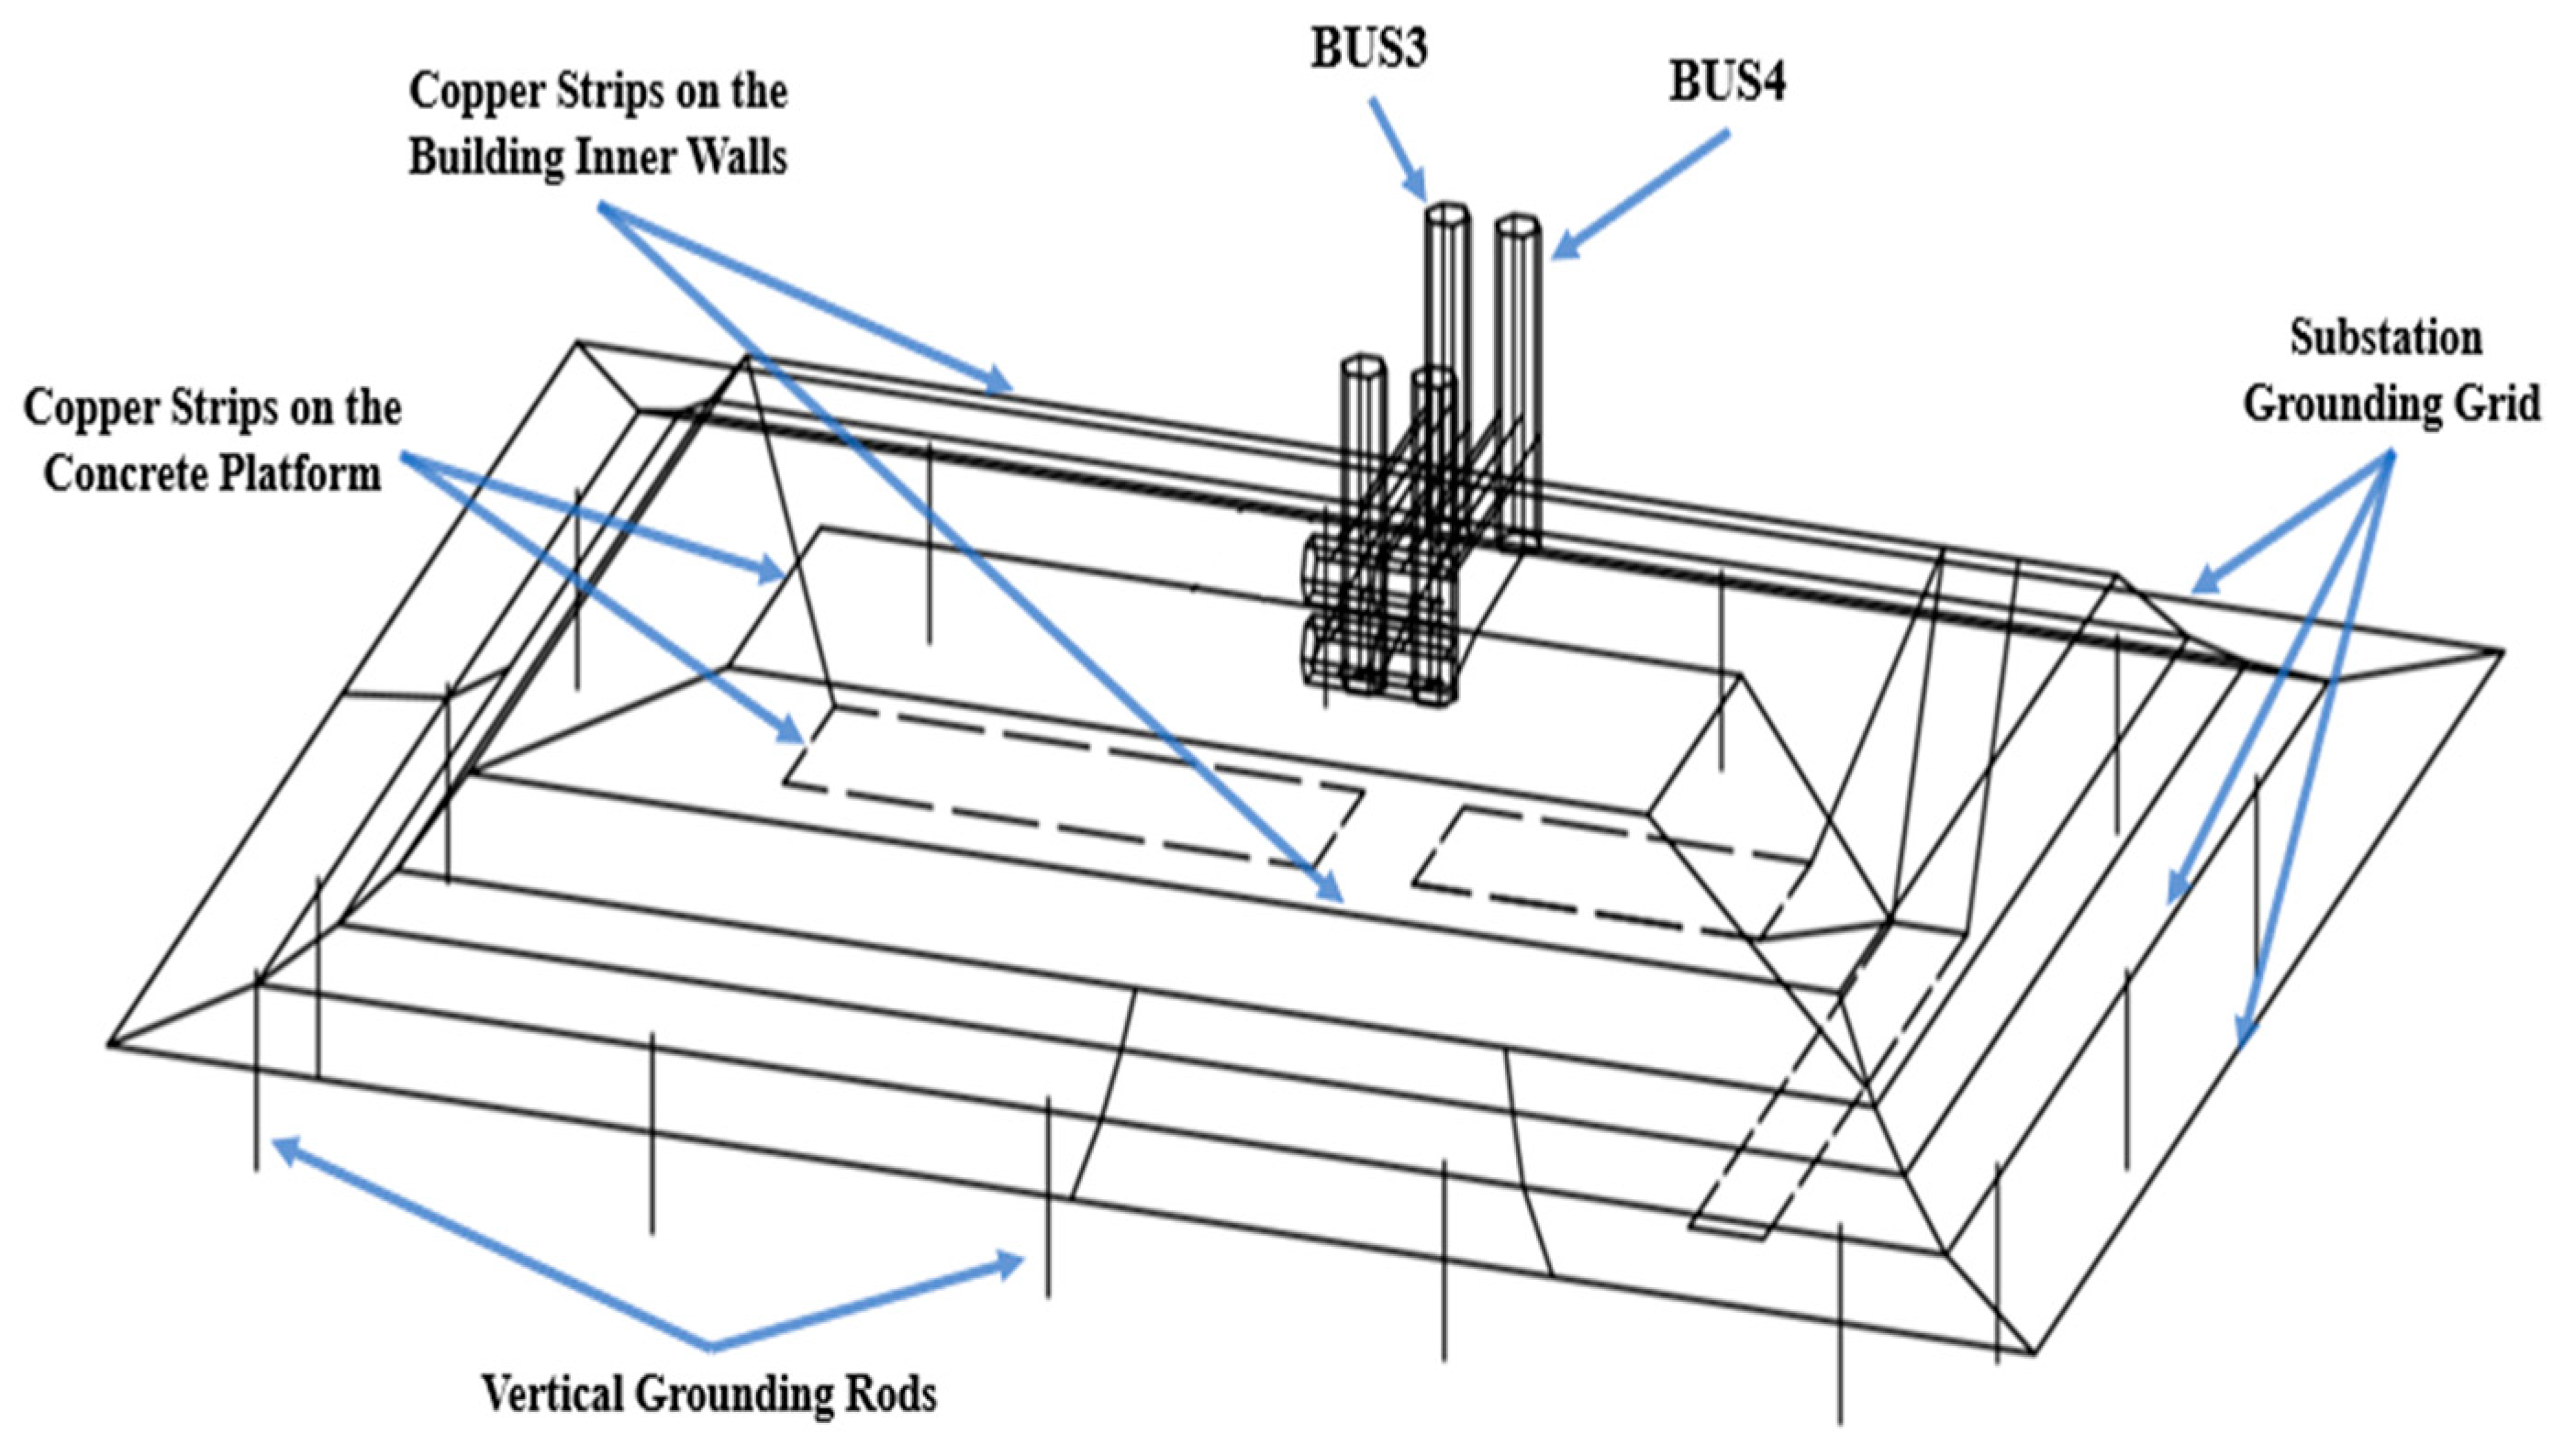
General Description of the System
2. Modeling Concept
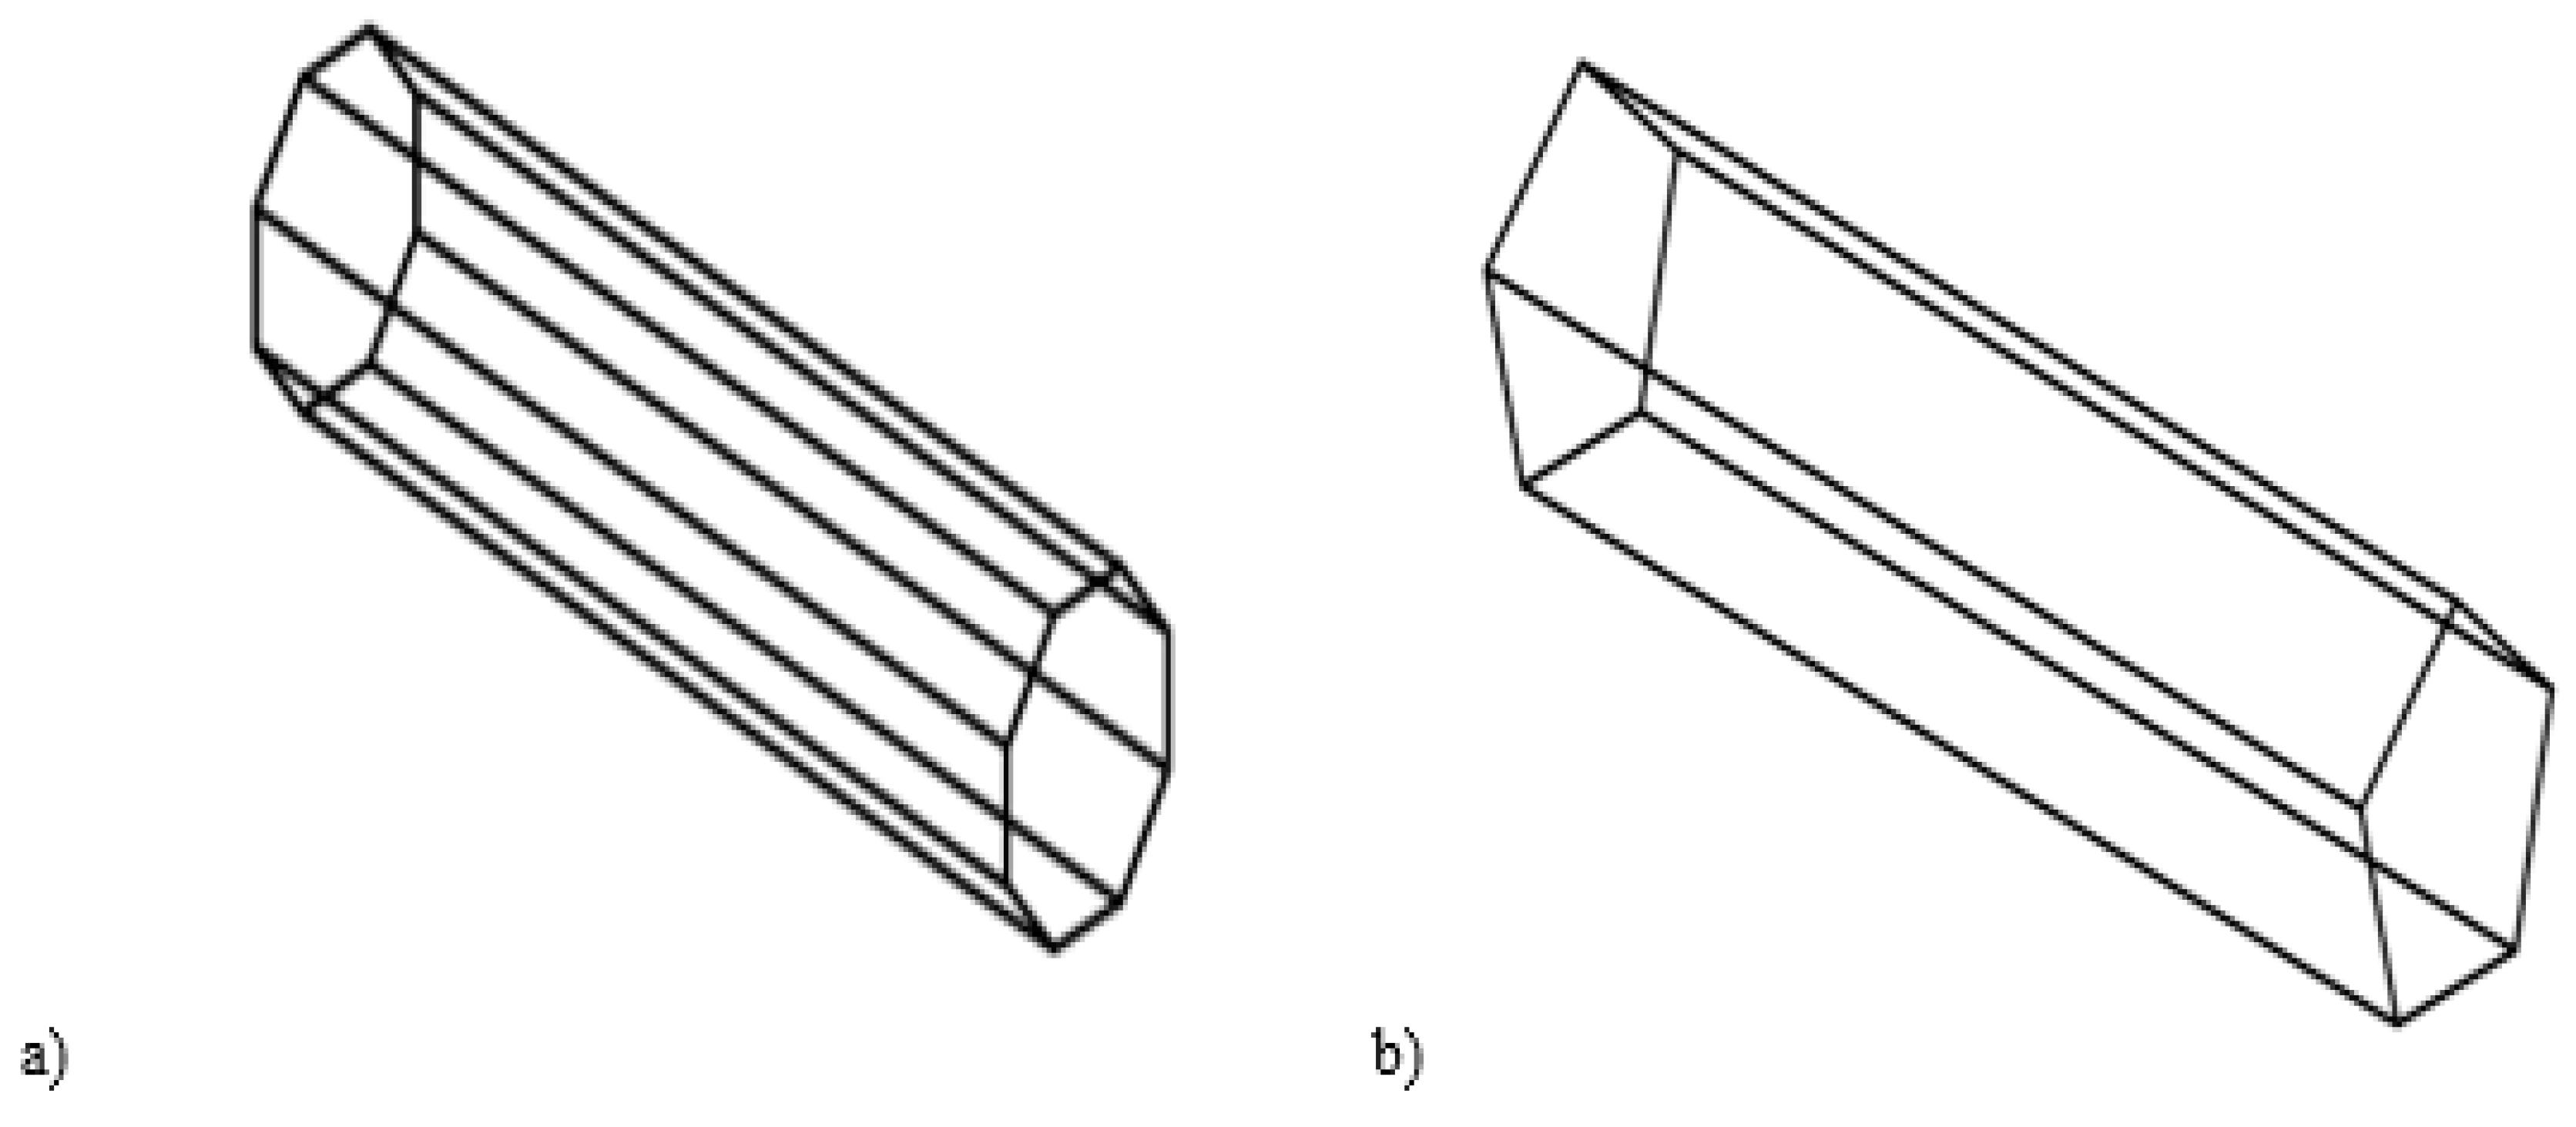
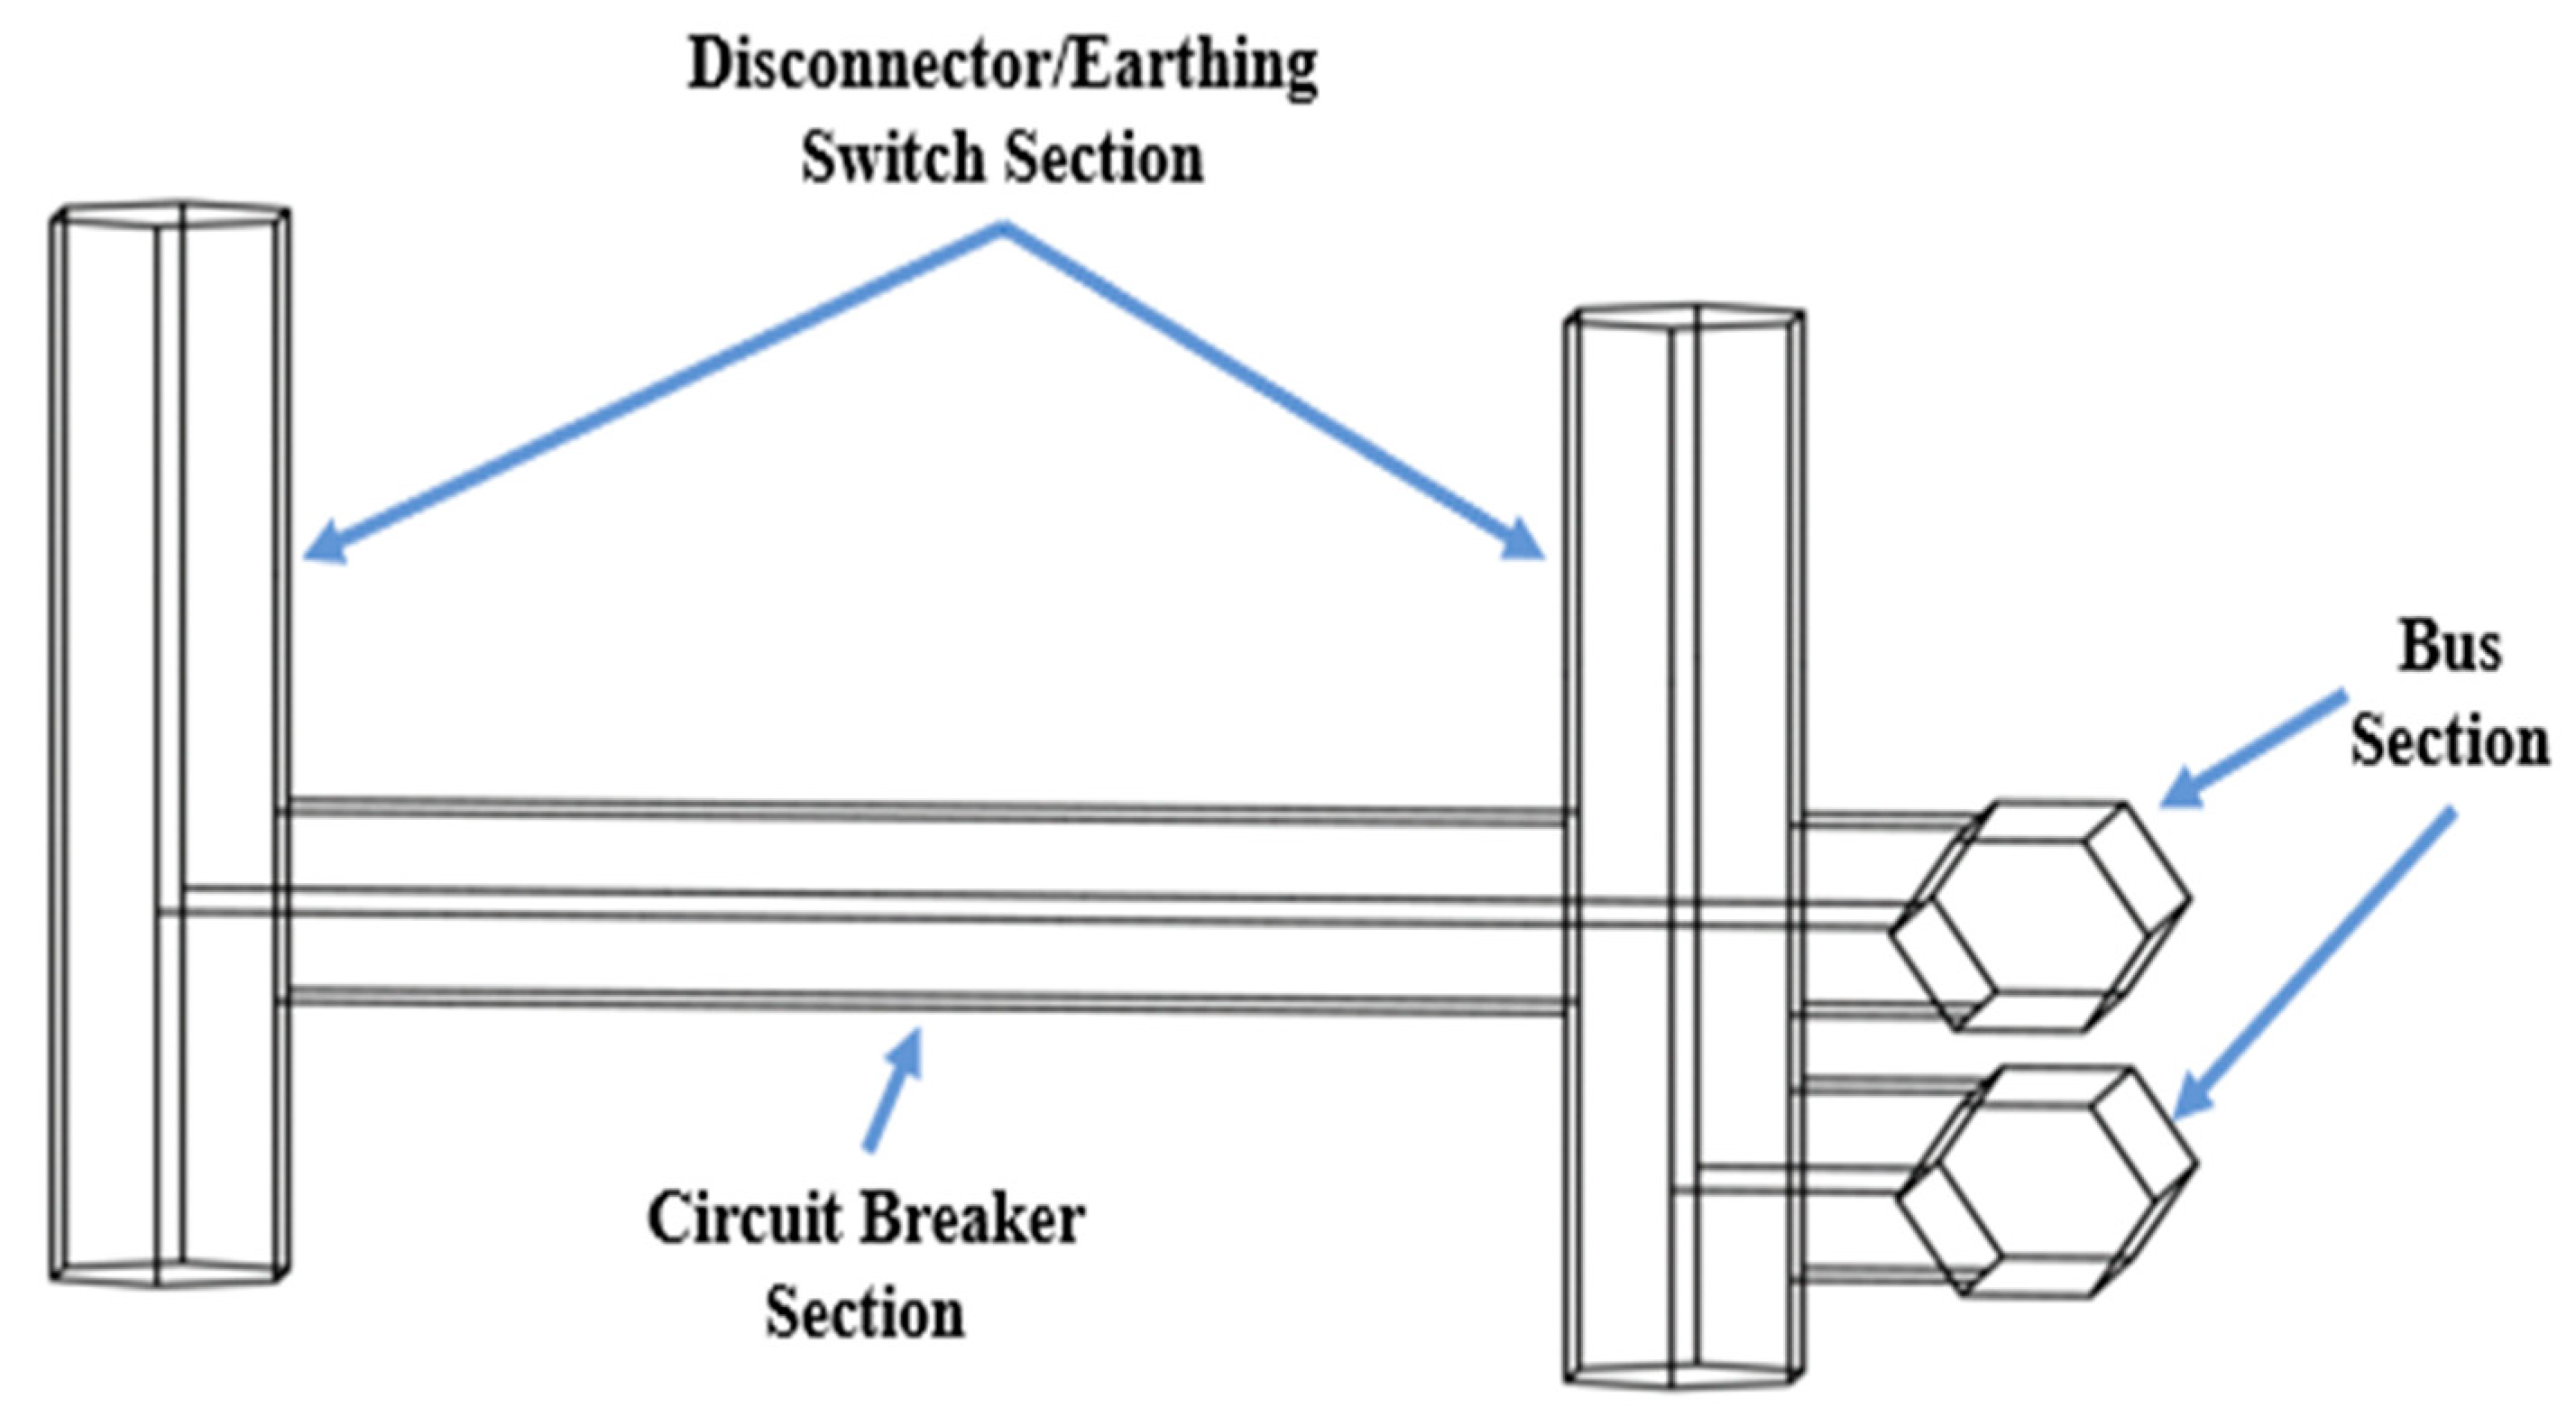
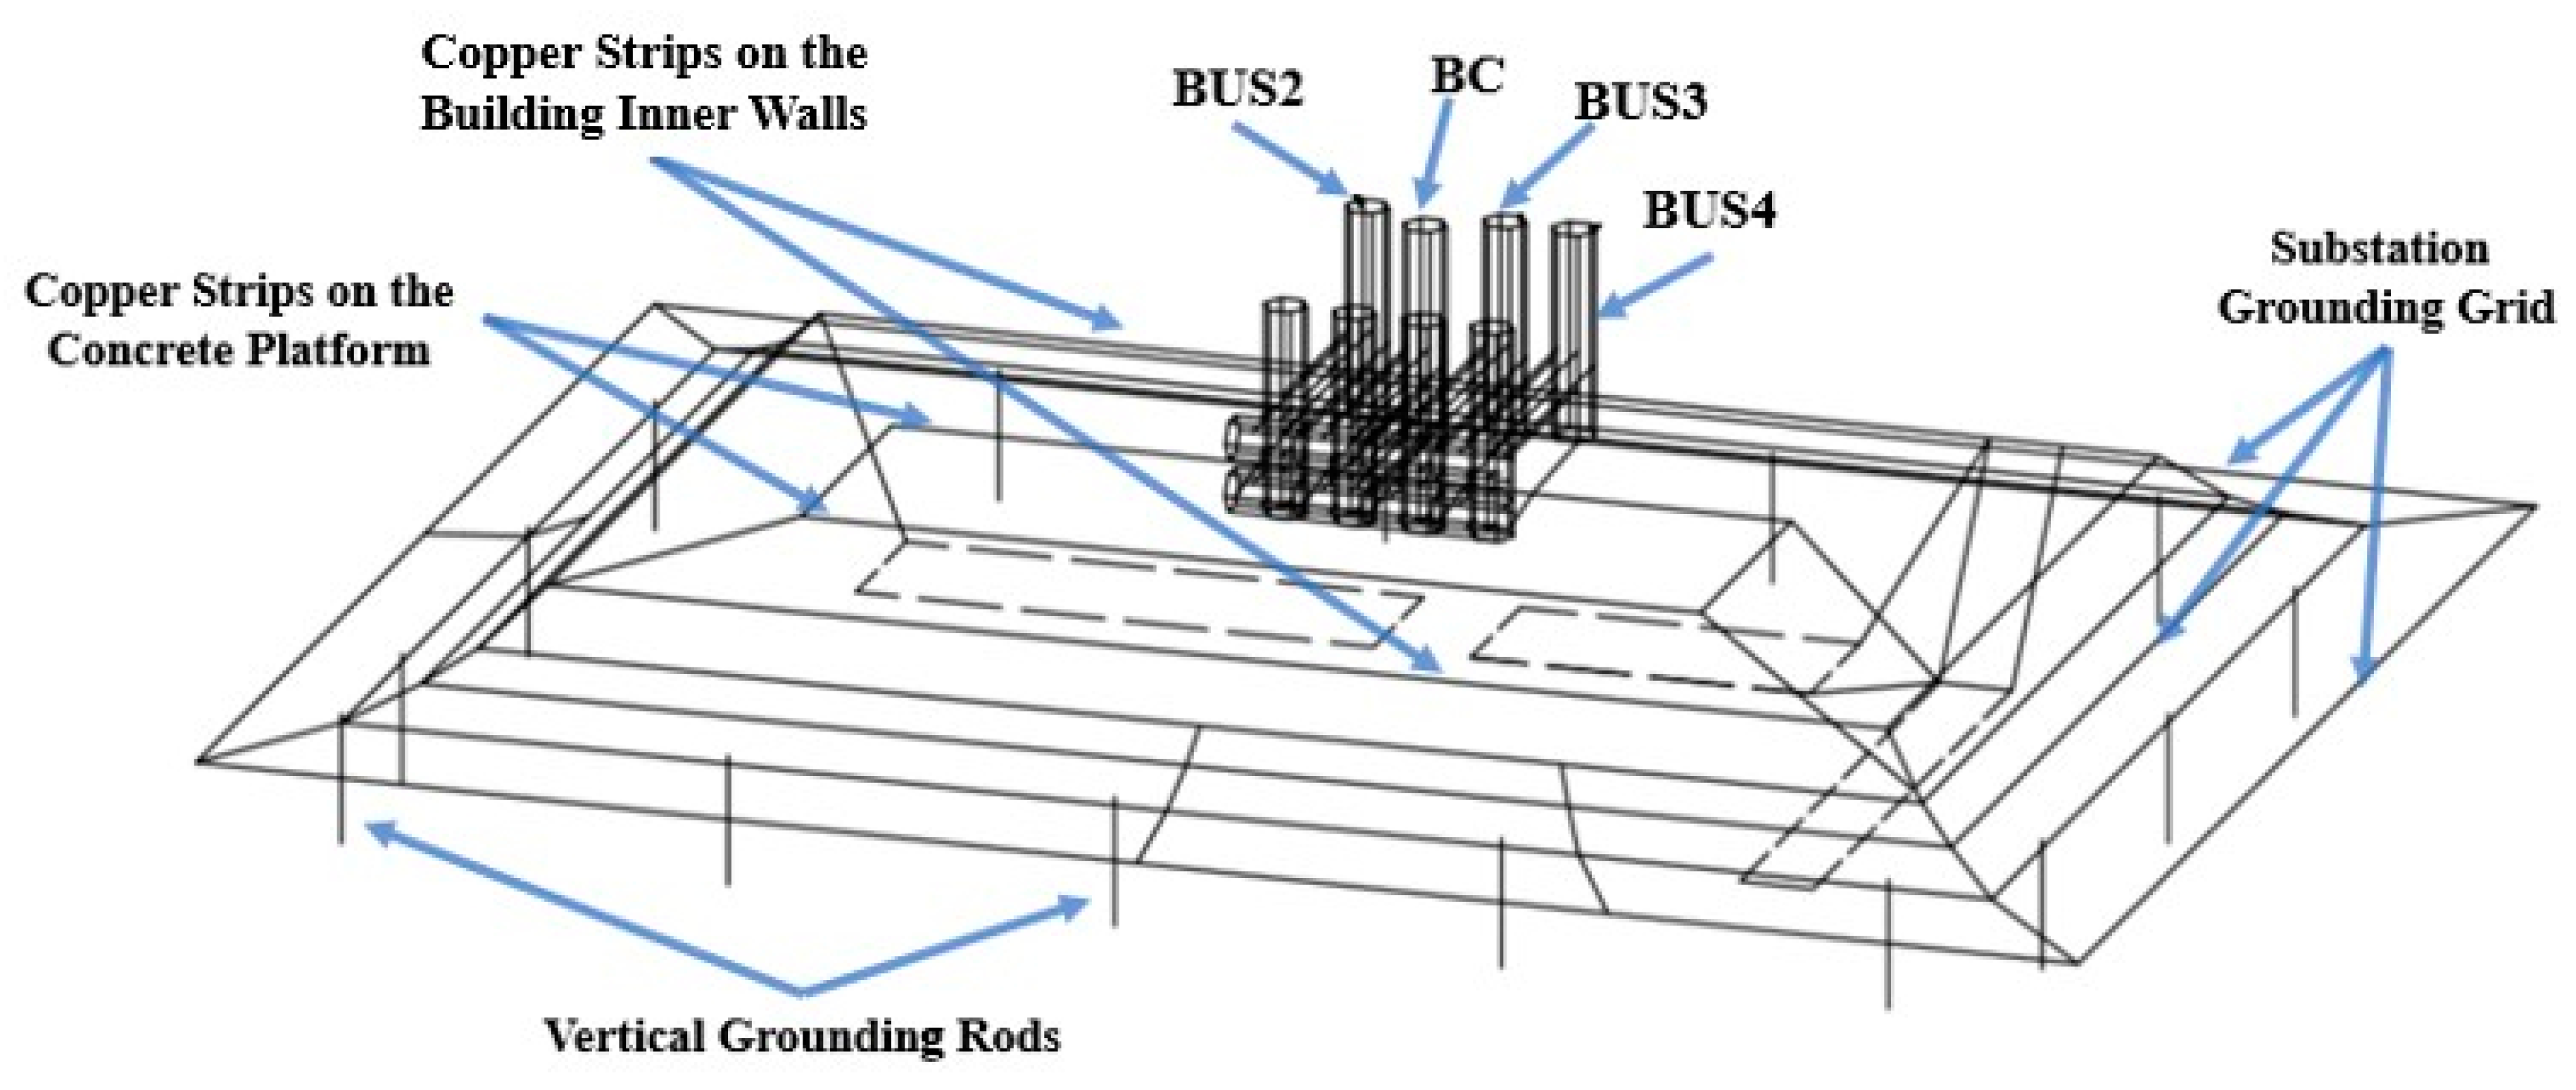
2.1. CAD Approach
2.2. Adopted Electromagnetic Field Theory Approach: Partial Equivalent Element Circuit Method
- k = correction factor,
- = maximum amplitude of the voltage waveform,
- = time to peak parameter, and
- = time to half value.
2.3. Assessment Methodology
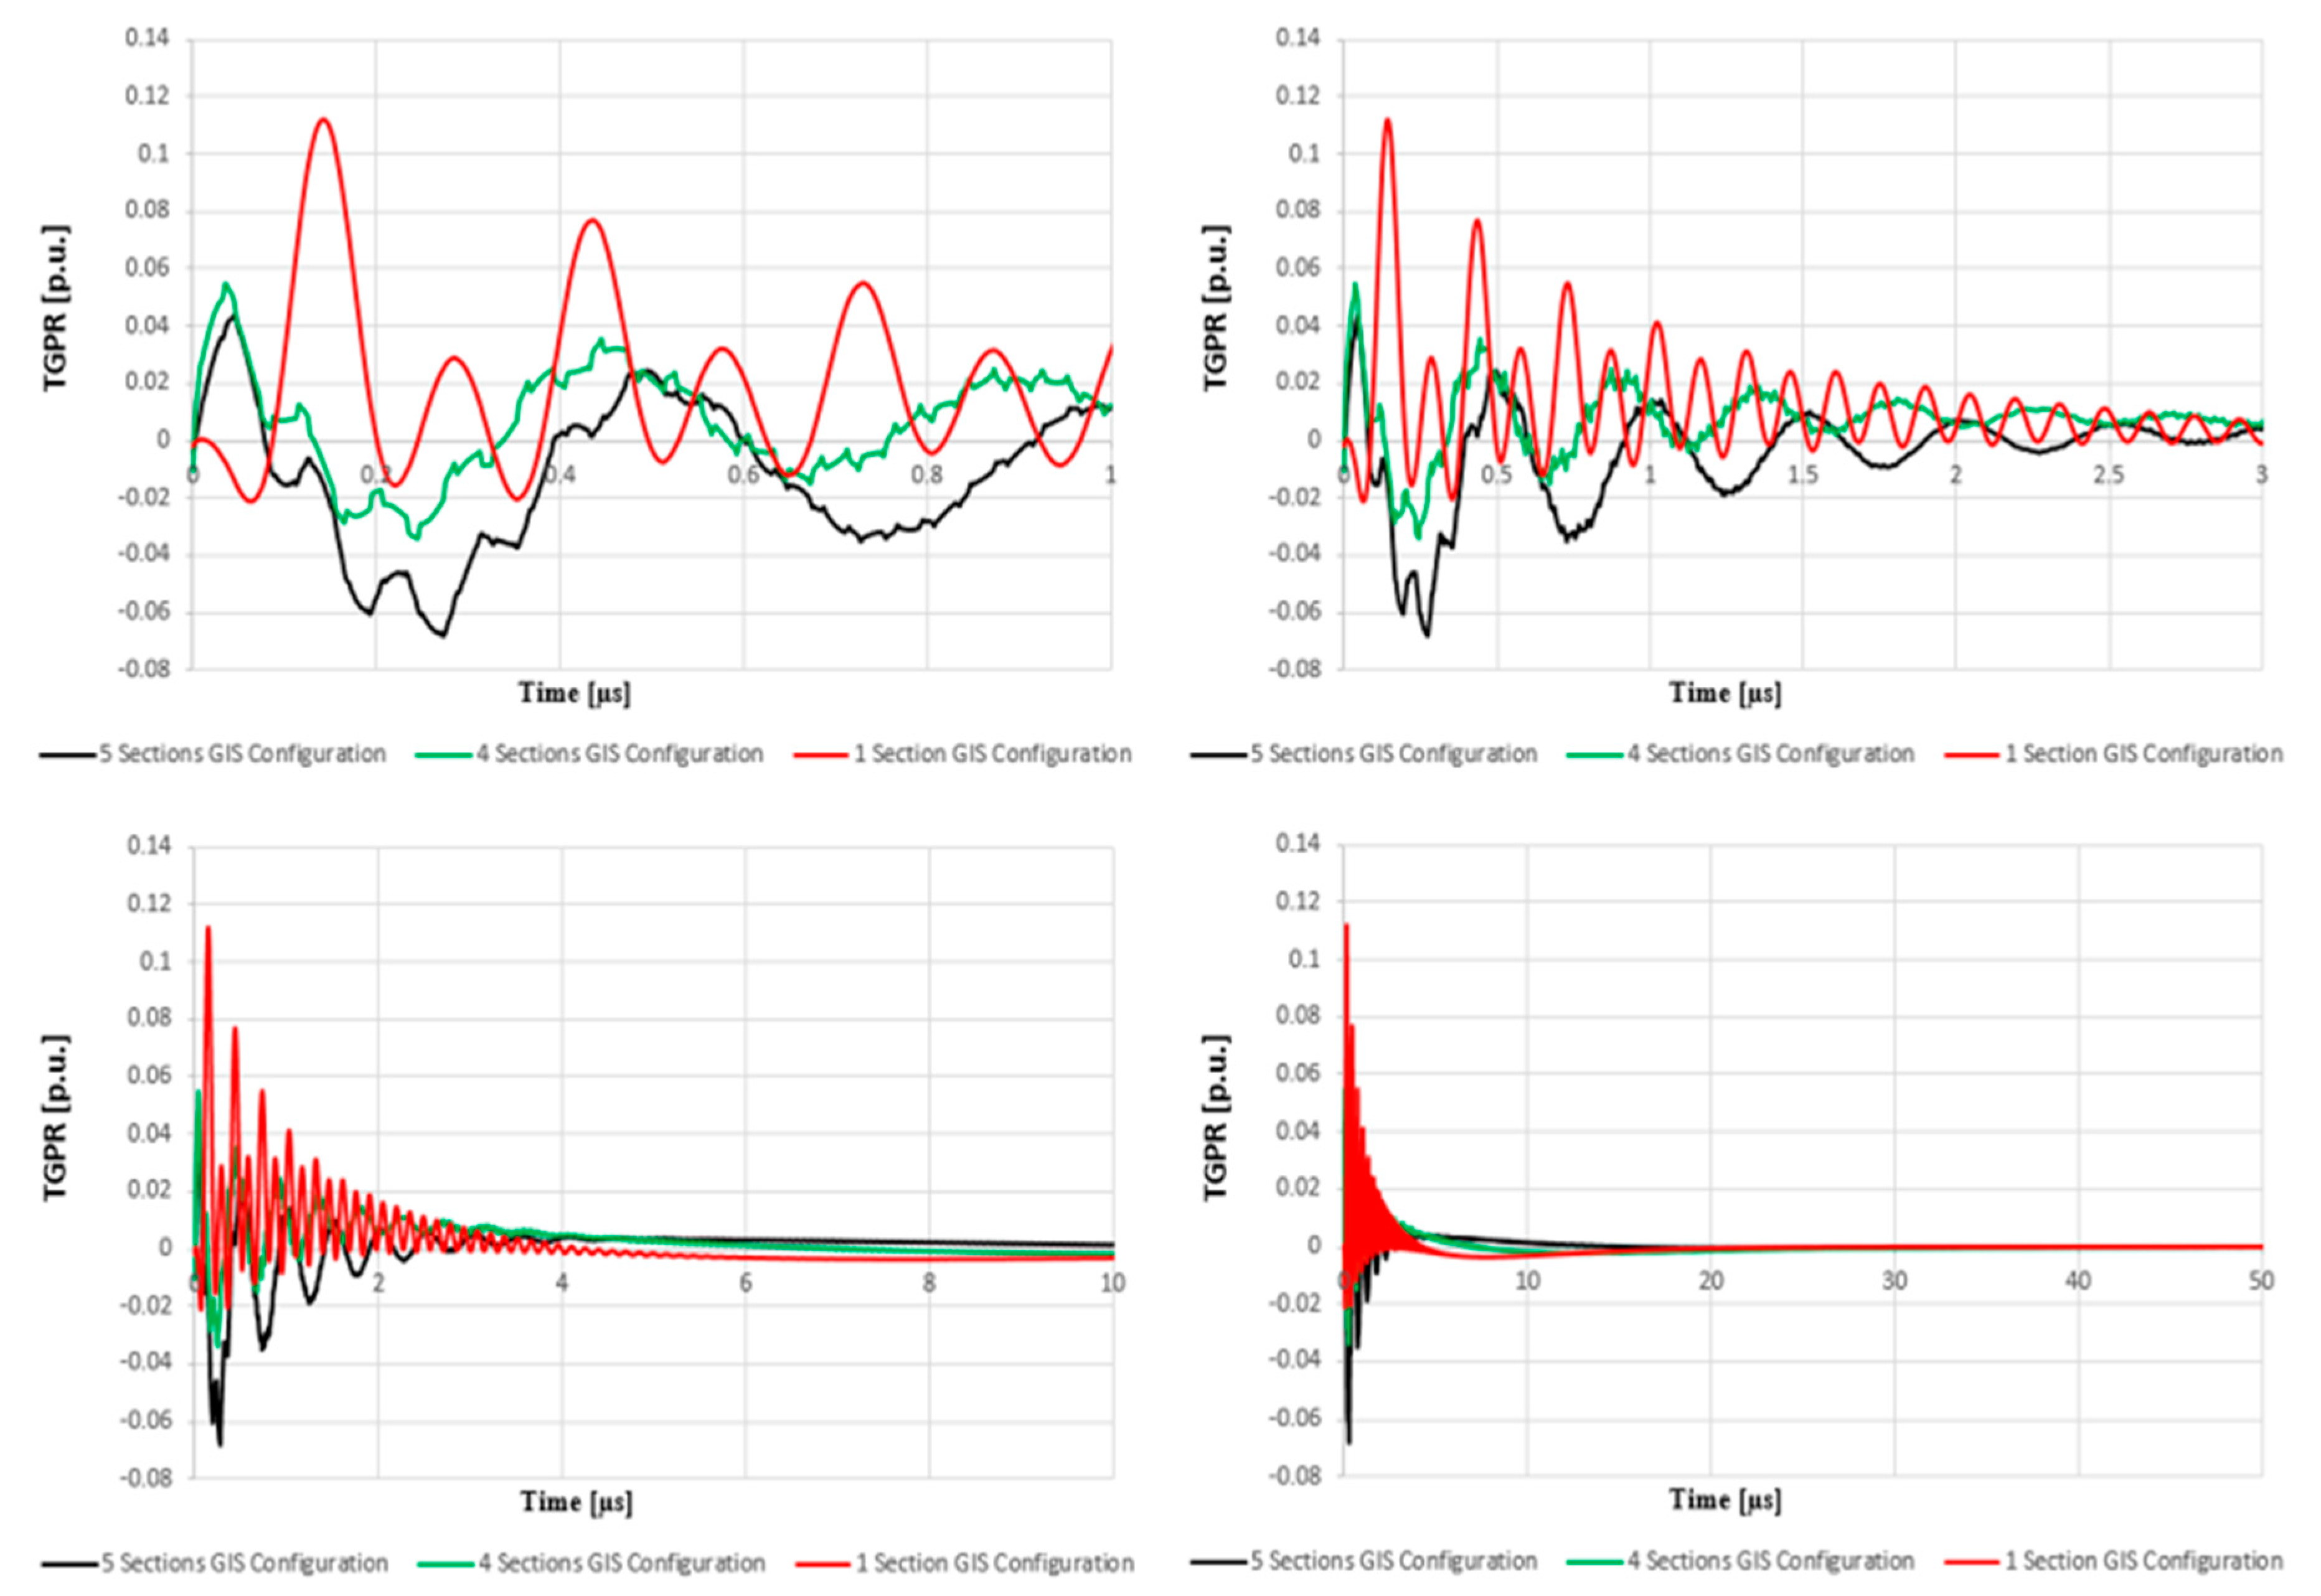
3. Simulations and Results
4. Discussions
5. Conclusions
Author Contributions
Funding
Conflicts of Interest
References
- IEEE Guide for Specifications for High-Voltage Gas-Insulated Substations Rated 52 kV and Above. In IEEE Std C37.123-2016 (Revision of IEEE Std C37.123-1996); IEEE: New York, NY, USA, 2016; pp. 1–60. [CrossRef]
- Lackovic, V. E-045 Gas Insulated Substation Definitions and Basics. Continuing Education and Development Inc., Stony Point, NY 10980. 2017. Available online: https://pdhstar.com/wp-content/uploads/2019/01/E-045-Gas-Insulated-Substation-Definitions-and-Basics-FINAL.pdf (accessed on 1 November 2020).
- Ram, A.R. Estimation of Very Fast Transient Overvoltages on bushing connected in GIS. Int. J. Eng. Sci. Technol. 2012, 4, 457–472. [Google Scholar]
- Kho, D.T.A.; Smith, K.S. Analysis of Very Fast Transient Overvoltages in a proposed 275 kV Gas Insulated Substation. In Proceedings of the International Conference on Power Systems Transients (IPST2011), Delft, The Netherlands, 14–17 June 2011. [Google Scholar]
- Boggs, S.A.; Chu, F.Y.; Fujimoto, N.; Krenicky, A.; Plessl, A.; Schlicht, D. Disconnect Switch Induced Transients and Trapped Charge-Insulated Substations. IEEE Power Eng. Rev. 1982, 2, 21. [Google Scholar] [CrossRef]
- Zhan, H.; Duan, S.; Li, C.; Yao, L.; Zhao, L. A Novel Arc Model for Very Fast Transient Overvoltage Simulation in a 252-kV Gas-Insulated Switchgear. IEEE Trans. Plasma Sci. 2014, 42, 3423–3429. [Google Scholar] [CrossRef]
- Zhongyuan, Z.; Gui-Shu, L.; Xiang, C. Modeling of potential transformers in gas insulated substation for the very fast transient simulation. In Proceedings of the 2003 IEEE International Symposium on Electromagnetic Compatibility (EMC ’03), Istanbul, Turkey, 11–16 May 2003; Volume 1, pp. 308–311. [Google Scholar]
- Liu, B.; Tong, Y.; Deng, X.; Feng, X. Measuring of very fast transient overvoltage and very fast transient current generated by disconnector operating. In Proceedings of the 2014 International Conference on Power System Technology, Chengdu, China, 20–22 October 2014; pp. 1349–1354. [Google Scholar] [CrossRef]
- Kuczek, T.; Florkowski, M. Modeling of Overvoltages in Gas Insulated Substations; ABB Corporate Research Center: Krakow, Poland, 2012. [Google Scholar]
- Kondalu, M.; Subramanyam, P.S. Estimation of Re-striking Transient Over voltages in a 132 KV Gas insulated Substation. Int. Electr. Eng. J. IEEJ 2012, 3, 757–763. [Google Scholar]
- Cai, Y.; Guan, Y.; Liu, W. Measurement of transient enclosure voltage in a 220 kV gas insulated substation. In Proceedings of the 2015 IEEE International Instrumentation and Measurement Technology Conference (I2MTC) Proceedings, Pisa, Italy, 11–14 May 2015; pp. 115–120. [Google Scholar]
- Ruan, W.; Dawlibi, F.P.; Ma, J. Study of Transient Grounding Potential Rise in Gas Insulated Substation during Fault Conditions Using Electromagnetic Field and Circuit Theory Approaches. 1999, pp. 123–130. Available online: https://sestech.com/pdf/User2000_A.pdf (accessed on 1 November 2020).
- Hong, A. Dielectric Strength of Air. In The Physics Factbook; 2000; Available online: https://hypertextbook.com/facts/2000/RachelChu.shtml (accessed on 1 November 2020).
- Nechmi, H.E.; Beroual, A.; Girodet, A.; Vinson, P. Fluoronitriles/CO2 gas mixture as promising substitute to SF6 for insulation in high voltage applications. IEEE Trans. Dielectr. Electr. Insul. 2016, 23, 2587–2593. [Google Scholar] [CrossRef]
- Li, Q.; Wu, M. Simulation Method for the Applications of Ferromagnetic Materials in Suppressing High-Frequency Transients Within GIS. IEEE Trans. Power Deliv. 2007, 22, 1628–1632. [Google Scholar] [CrossRef]
- Pathak, N.; Bhatti, T.S. Ibraheem Study of very fast transient overvoltages and mitigation techniques of a gas insulated substation. In Proceedings of the 2015 International Conference on Circuits, Power and Computing Technologies [ICCPCT-2015], Nagercoil, India, 19–20 March 2015; pp. 1–6. [Google Scholar]
- Reddy, P.R.; Amarnath, J. Simulation of mitigation methods for VFTO’ sand VFTC’s in Gas Insulated Substations. In Proceedings of the 2013 15th International Conference on Advanced Computing Technologies (ICACT), Rajampet, India, 21 September 2013; pp. 1–4. [Google Scholar]
- Bamne, S.; Kinhekar, N. Estimation and Analysis of VFTO at Various Locations in 132kV GIS Substation. In Proceedings of the 2018 International Conference on Computation of Power, Energy, Information and Communication (ICCPEIC), Chennai, India, 28–29 March 2018; pp. 399–403. [Google Scholar] [CrossRef]
- Zhao, L.; Ye, L.; Wang, S.; Yang, Y.; Jiang, P.; Zou, X. Research on Very Fast Transient Overvoltage During Switching of Disconnector in 550kV GIS. In Proceedings of the 2018 IEEE 3rd International Conference on Integrated Circuits and Microsystems (ICICM), Shanghai, China, 24–26 November 2018; pp. 114–118. [Google Scholar] [CrossRef]
- Zhuo, W.; Weiquan, W.; Qiang, W. Research of suppressing VFTO for 500kV GIS substation based on EMTP/ATP. In Proceedings of the 2011 International Conference on E-Business and E-Government (ICEE), Shanghai, China, 6–8 May 2011; pp. 1–4. [Google Scholar]
- Na, W.; Li-ping, F.; Yu, L. The effect of apparatus model on Very Fast Transient Over-voltage. In Proceedings of the 2011 International Conference on Electric Information and Control Engineering, Wuhan, China, 25–27 March 2011; pp. 833–835. [Google Scholar]
- Tavakoli, A.; Gholami, A.; Nouri, H.; Negnevitsky, M. Comparison Between Suppressing Approaches of Very Fast Transients in Gas-Insulated Substations (GIS). IEEE Trans. Power Deliv. 2012, 28, 303–310. [Google Scholar] [CrossRef]
- Na, W.; Yu, L. Influence of Model of Circuit-breaker on Very Fast Transient Over-voltage. Phys. Procedia 2012, 24, 283–289. [Google Scholar] [CrossRef] [Green Version]
- Haseeb, M.A.; Thomas, M.J. Computation of very fast transient overvoltages (VFTO) in a 1000 kV gas insulated substation. In Proceedings of the 2017 IEEE PES Asia-Pacific Power and Energy Engineering Conference (APPEEC), Bangalore, India, 8–10 November 2017; pp. 1–6. [Google Scholar]
- Conference Internationale Des Grands Reseaux electriques (CIGRE) Working Group C4.501. Guideline for Numerical Electromagnetic Analysis Method and its Application to Surge Phenomena. 2013. Available online: https://infoscience.epfl.ch/record/187423/files/CigreTB_543.pdf (accessed on 1 November 2020).
- Liu, J.; Dawalibi, F.P.; Brian, F. Majerowicz. Gas Insulated Substation Grounding System Design Using the Electromagnetic Field Method. In Proceedings of the 2012 China International Conference on Electricity Distribution, Shanghai, China, 10–14 September 2012. [Google Scholar]
- Dawalibi, F.P.; Joyal, M.; Liu, J.; Li, Y. Realistic Integrated Grounding and Electromagnetic Interference Analysis Accounting for GIS, Cables and Transformers During Normal and Fault Conditions. In Proceedings of the 2013 IEEE PES Asia-Pacific Power and Energy Engineering Conference (APPEEC), Kowloon, China, 8–11 December 2013. [Google Scholar]
- Zhang, J.; Qian, F.; Guo, B.; Li, Y.; Dawalibi, F. Grounding of Urban GIS Substation Connected to Commercial Buildings and Metallic Infrastructures. Int. J. Mater. Mech. Manuf. 2015, 3, 191–196. [Google Scholar] [CrossRef] [Green Version]
- Chen, L.; Zhang, J.; Zeng, K.; Jiao, P. An edge-based smoothed finite element method for adaptive analysis. Struct. Eng. Mech. 2011, 39, 767–793. [Google Scholar] [CrossRef]
- Chen, J.S.; Wu, C.T.; Belytschko, T. Regularization of material instabilities by mesh free approximations with intrinsic length scales. Int. J. Numer. Meth. Eng. 2000, 47, 1303–1322. [Google Scholar] [CrossRef]
- Smajic, J.; Holaus, W.; Kostovic, J.; Riechert, U. 3D Full-Maxwell Simulations of Very Fast Transients in GIS. IEEE Trans. Magn. 2011, 47, 1514–1517. [Google Scholar] [CrossRef]
- Smajic, J.; Shoory, A.; Burow, S.; Holaus, W.; Riechert, U.; Tenbohlen, S. Simulation-Based Design of HF Resonators for Damping Very Fast Transients in GIS. IEEE Trans. Power Deliv. 2014, 29, 2528–2533. [Google Scholar] [CrossRef]
- James, J.; Albano, M.; Clark, D.; Guo, D.; Haddad, A. (Manu) Analysis of Very Fast Transients Using Black Box Macromodels in ATP-EMTP. Energies 2020, 13, 698. [Google Scholar] [CrossRef] [Green Version]
- Tanaka, H.; Ohki, H.; Nagaoka, N.; Takeuchi, M.; Tanahashi, D.; Okada, N.; Baba, Y. Finite-difference time-domain simulation of partial discharges in a gas insulated switchgear. High Volt. 2016, 1, 52–56. [Google Scholar] [CrossRef]
- Hikita, M.; Ohtsuka, S.; Okabe, S.; Wada, J.; Hoshino, T.; Maruyama, S. Influence of disconnecting part on propagation properties of PD-induced electromagnetic wave in model gis. IEEE Trans. Dielectr. Electr. Insul. 2010, 17, 1731–1767. [Google Scholar] [CrossRef]
- Rao, M.M.; Thomas, M.J.; Singh, B.P. Electromagnetic Field Emission from Gas-to-Air Bushing in a GIS During Switching Operations. IEEE Trans. Electromagn. Compat. 2007, 49, 313–321. [Google Scholar] [CrossRef]
- Nishigouchi, K.; Kozako, M.; Hikita, M.; Hoshino, T.; Maruyama, S.; Nakajima, T. Waveform estimation of particle discharge currents in straight 154 kV GIS using electromagnetic wave propagation simulation. IEEE Trans. Dielectr. Electr. Insul. 2013, 20, 2239–2245. [Google Scholar] [CrossRef]
- Hikita, M.; Ohtsuka, S.; Wada, J.; Okabe, S.; Hoshino, T.; Maruyama, S. Study of partial discharge radiated electromagnetic wave propagation characteristics in an actual 154 kV model GIS. IEEE Trans. Dielectr. Electr. Insul. 2012, 19, 8–17. [Google Scholar] [CrossRef]
- Yao, R.; Zhang, Y.; Si, G.; Wu, C.; Yang, N.; Wang, Y. Simulation Analysis on the Propagation Characteristics of Electromagnetic Wave in T-branch GIS Based on FDTD. In Proceedings of the 2015 IEEE 15th Mediterranean Microwave Symposium (MMS), Lecce, UK, 30 November–2 December 2015; pp. 1–4. [Google Scholar] [CrossRef]
- Ruehli, A. Equivalent Circuit Models for Three-Dimensional Multiconductor Systems. IEEE Trans. Microw. Theory Tech. 1974, 22, 216–221. [Google Scholar] [CrossRef]
- Yutthagowith, P.; Ametani, A.; Nagaoka, N.; Baba, Y. Application of a Partial Element Equivalent Circuit Method to Lightning Surge Analyses. In Proceedings of the 7th Asia-Pacific International Conference on Lightning, Chengdu, China, 1–4 November 2011. [Google Scholar]
- Yutthagowith, P.; Ametani, A.; Nagaoka, N.; Baba, Y. Application of the Partial Element Equivalent Circuit Method to Analysis of Transient Potential Rises in Grounding Systems. IEEE Trans. Electromagn. Compat. 2011, 53, 726–736. [Google Scholar] [CrossRef]
- Antonini, G.; Cristina, S.; Orlandi, A. PEEC modeling of high voltage towers under direct and nearby lightning strike. In Proceedings of the 10th International Symposium on High Voltage Engineering, Montreal, QC, Canada, 24–30 August1997; pp. 187–203. [Google Scholar]
- Antonini, G.; Cristina, S.; Orlandi, A. PEEC modeling of lightning protection systems and coupling coaxial cable. IEEE Trans. Electromagn. Compat. 1998, 40, 481–491. [Google Scholar] [CrossRef]
- Yutthagowith, P.; Ametani, A.; Nagaoka, N.; Baba, Y. Lightning-Induced Voltage Over Lossy Ground by a Hybrid Electromagnetic Circuit Model Method with Cooray–Rubinstein Formula. IEEE Trans. Electromagn. Compat. 2009, 51, 975–985. [Google Scholar] [CrossRef]
- Wang, S.; He, J.; Zhang, B.; Zeng, R.; Yu, Z. A Time-Domain Multiport Model of Thin-Wire System for Lightning Transient Simulation. IEEE Trans. Electromagn. Compat. 2010, 52, 128–135. [Google Scholar] [CrossRef]
- Alexandru, M.; Czumbil, L.; Polycarpou, A.; Nouri, H.; Andolfato, R.; Micu, D.D. Novel Electromagnetic Field Theory approach applied to Gas Insulated Substation Transient Behaviour during Lightning Surge Impulse. In Proceedings of the MedPower 2020, Online, 9–12 November 2020. [Google Scholar]
- XGSLab User Guide. Available online: https://www.scribd.com/document/405051708/XGSLab-UserGuide-pdf (accessed on 1 November 2020).
- Gope, D.; Ruehli, A.; Jandhyala, V. Solving Low-Frequency EM-CKT Problems Using the PEEC Method. IEEE Trans. Adv. Packag. 2007, 30, 313–320. [Google Scholar] [CrossRef]
- Gür, U.M.; Ergül, O. Low-frequency breakdown of the potential integral equations and its remedy. In Proceedings of the 2017 Progress in Electromagnetics Research Symposium—Fall (PIERS—FALL), Singapore, 19–22 November 2017; pp. 676–682. [Google Scholar]


| Model Component | Diameter d [mm] | Conductor Material |
|---|---|---|
| Phase conductor | 30 | Copper |
| aluminum Bar | 40 | aluminum |
| Copper strip | 28.65 | Copper |
| Copper conductor | 12.36 | Copper |
| Vertical rods | 20 | Copper |
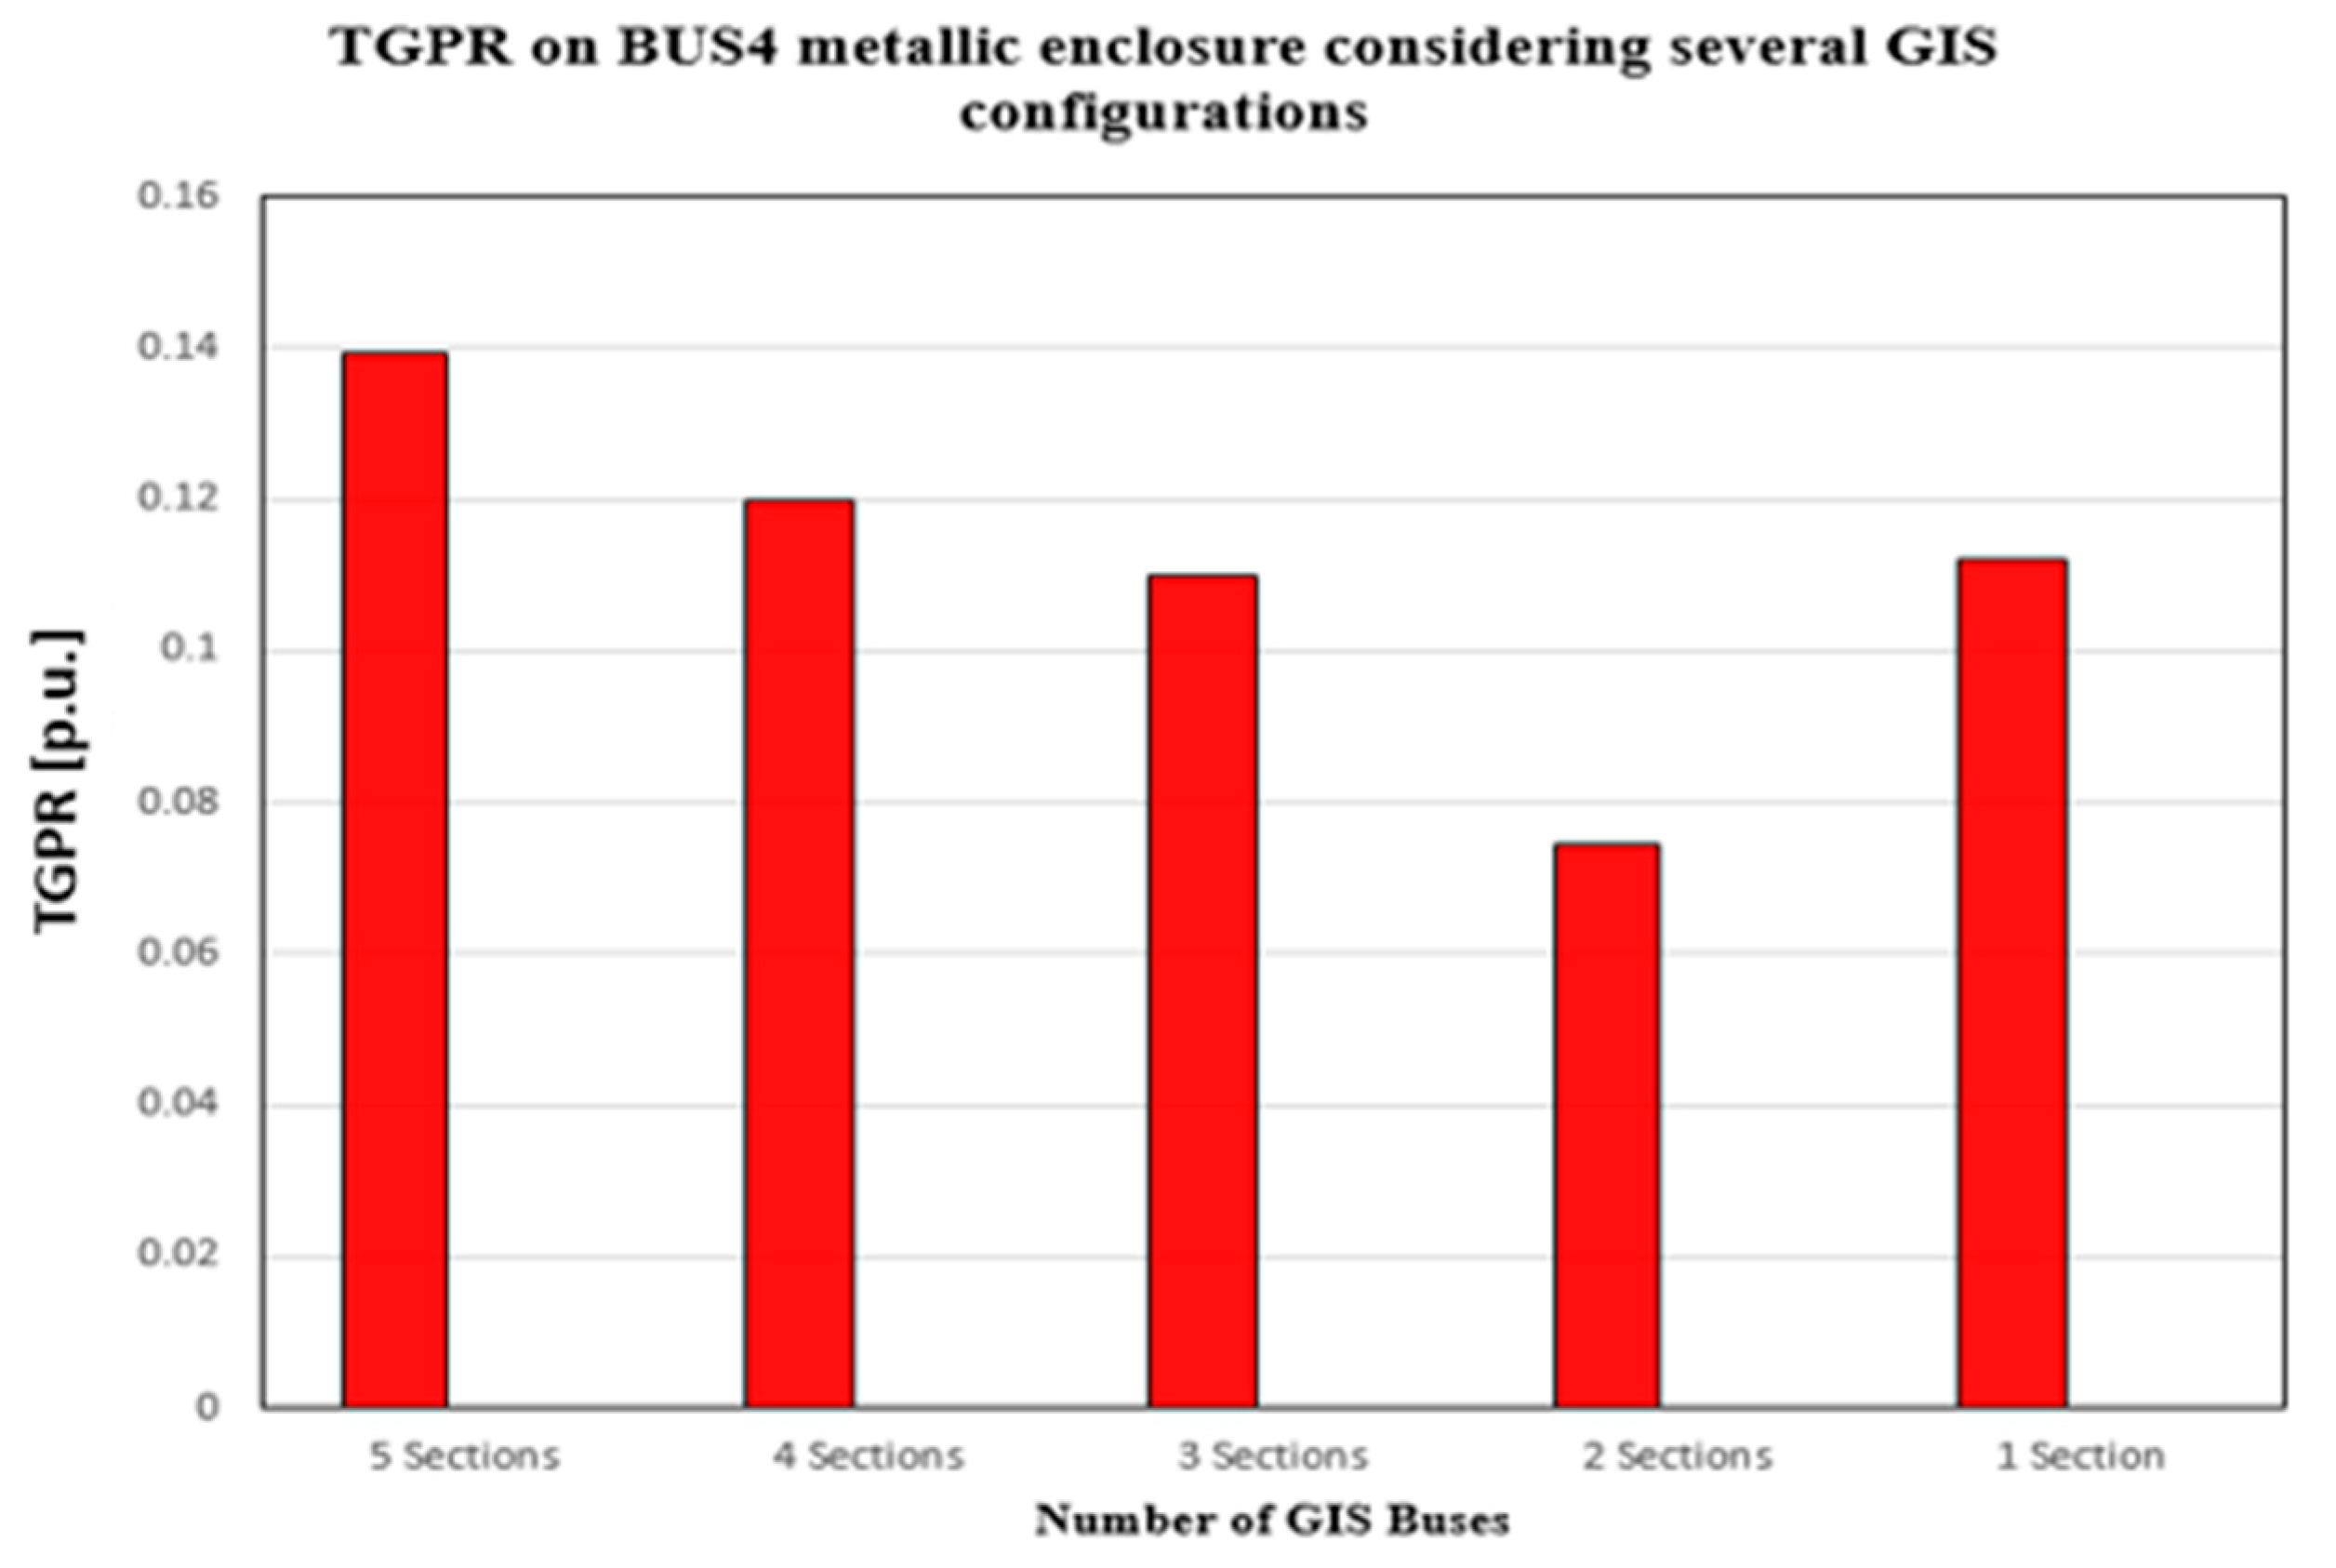
| TGPR on BUS4’s Metallic Enclosure | |||||
| 5 Sections | 4 Sections | 3 Sections | 2 Sections | 1 Section | |
| Max Potential [p.u.] | 0.13927 | 0.12002 | 0.11002 | 0.07458 | 0.11208 |
| TGPR on the BUS4’s Grounding Lead | |||||
| 5 Sections | 4 Sections | 3 Sections | 2 Sections | 1 Section | |
| Max Potential [p.u.] | 0.04369 | 0.05475 | 0.05475 | 0.04396 | 0.11208 |
| Attenuation [%] | 69% | 54% | 50% | 41% | 0% |
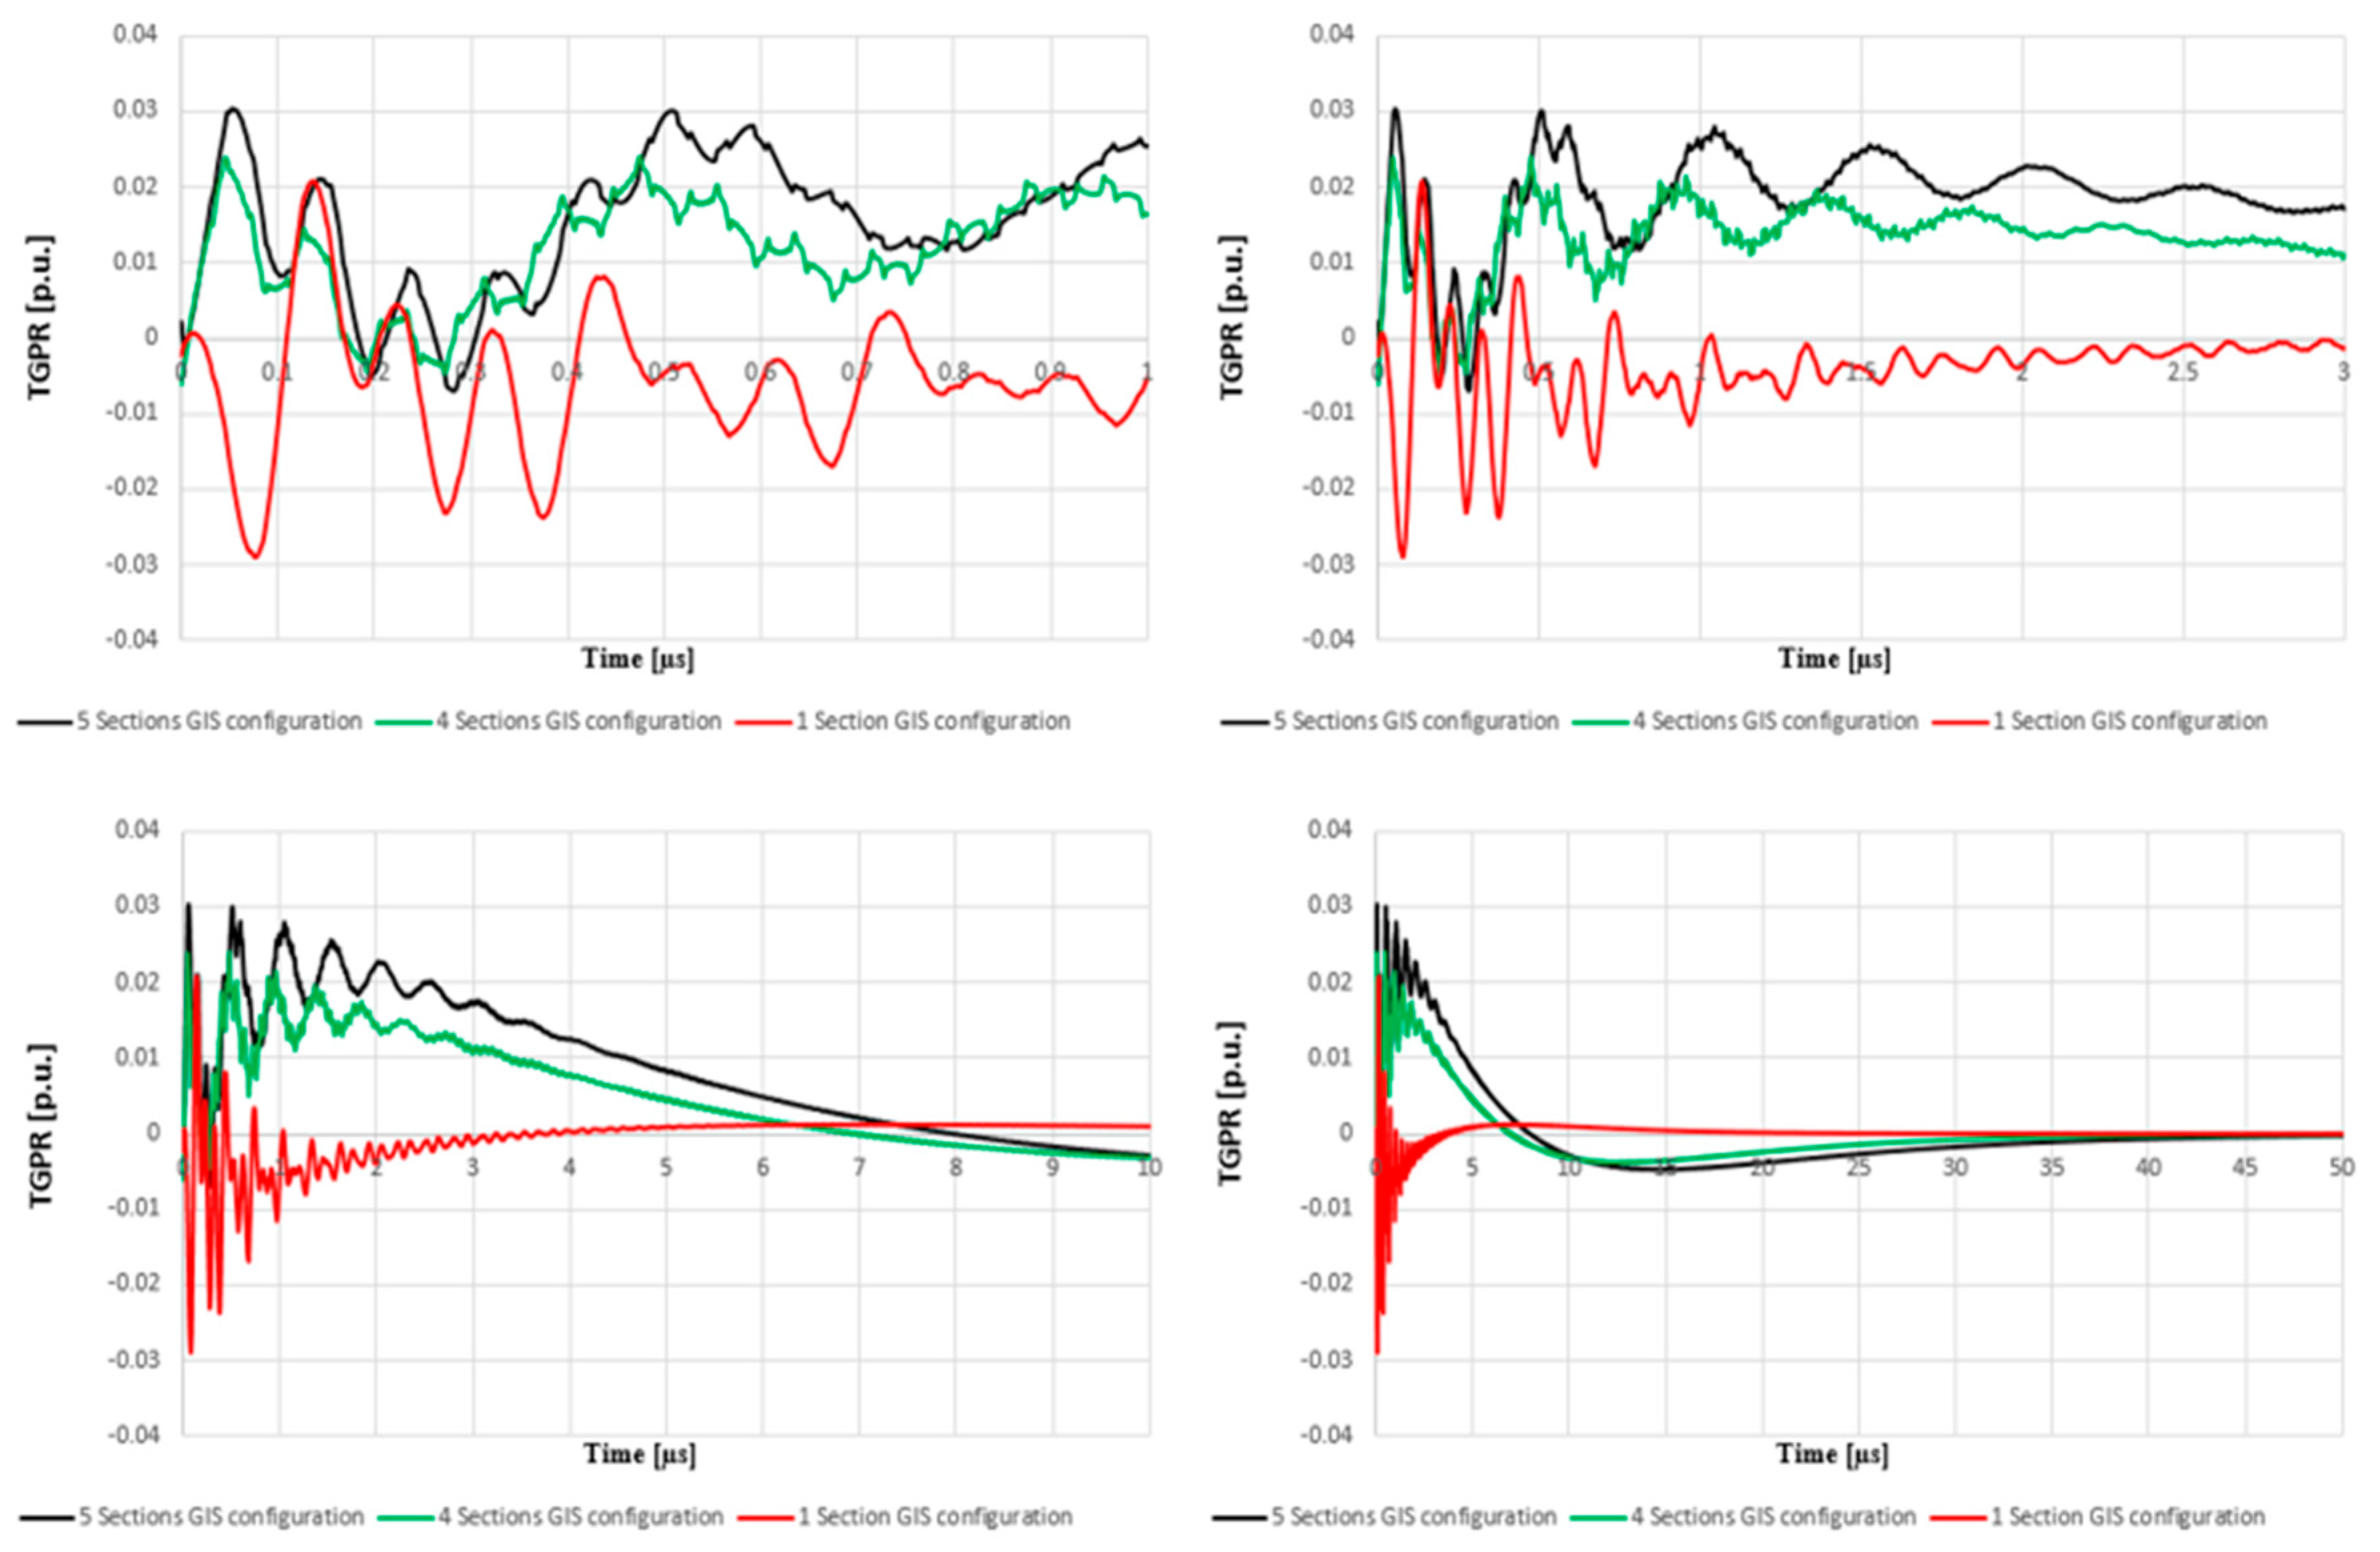
| TGPR Copper Strip Located on GIS Platform | |||||
| 5 Sections | 4 Sections | 3 Sections | 2 Sections | 1 Section | |
| Max Potential [p.u.] | 0.03037 | 0.02355 | 0.02102 | 0.01707 | 0.02897 |
| Attenuation [%] | 30% | 57% | 62% | 61% | 74% |
| TGPR on Copper Strip Located on the Inner Wall of GIS Building | |||||
| 5 Sections | 4 Sections | 3 Sections | 2 Sections | 1 Section | |
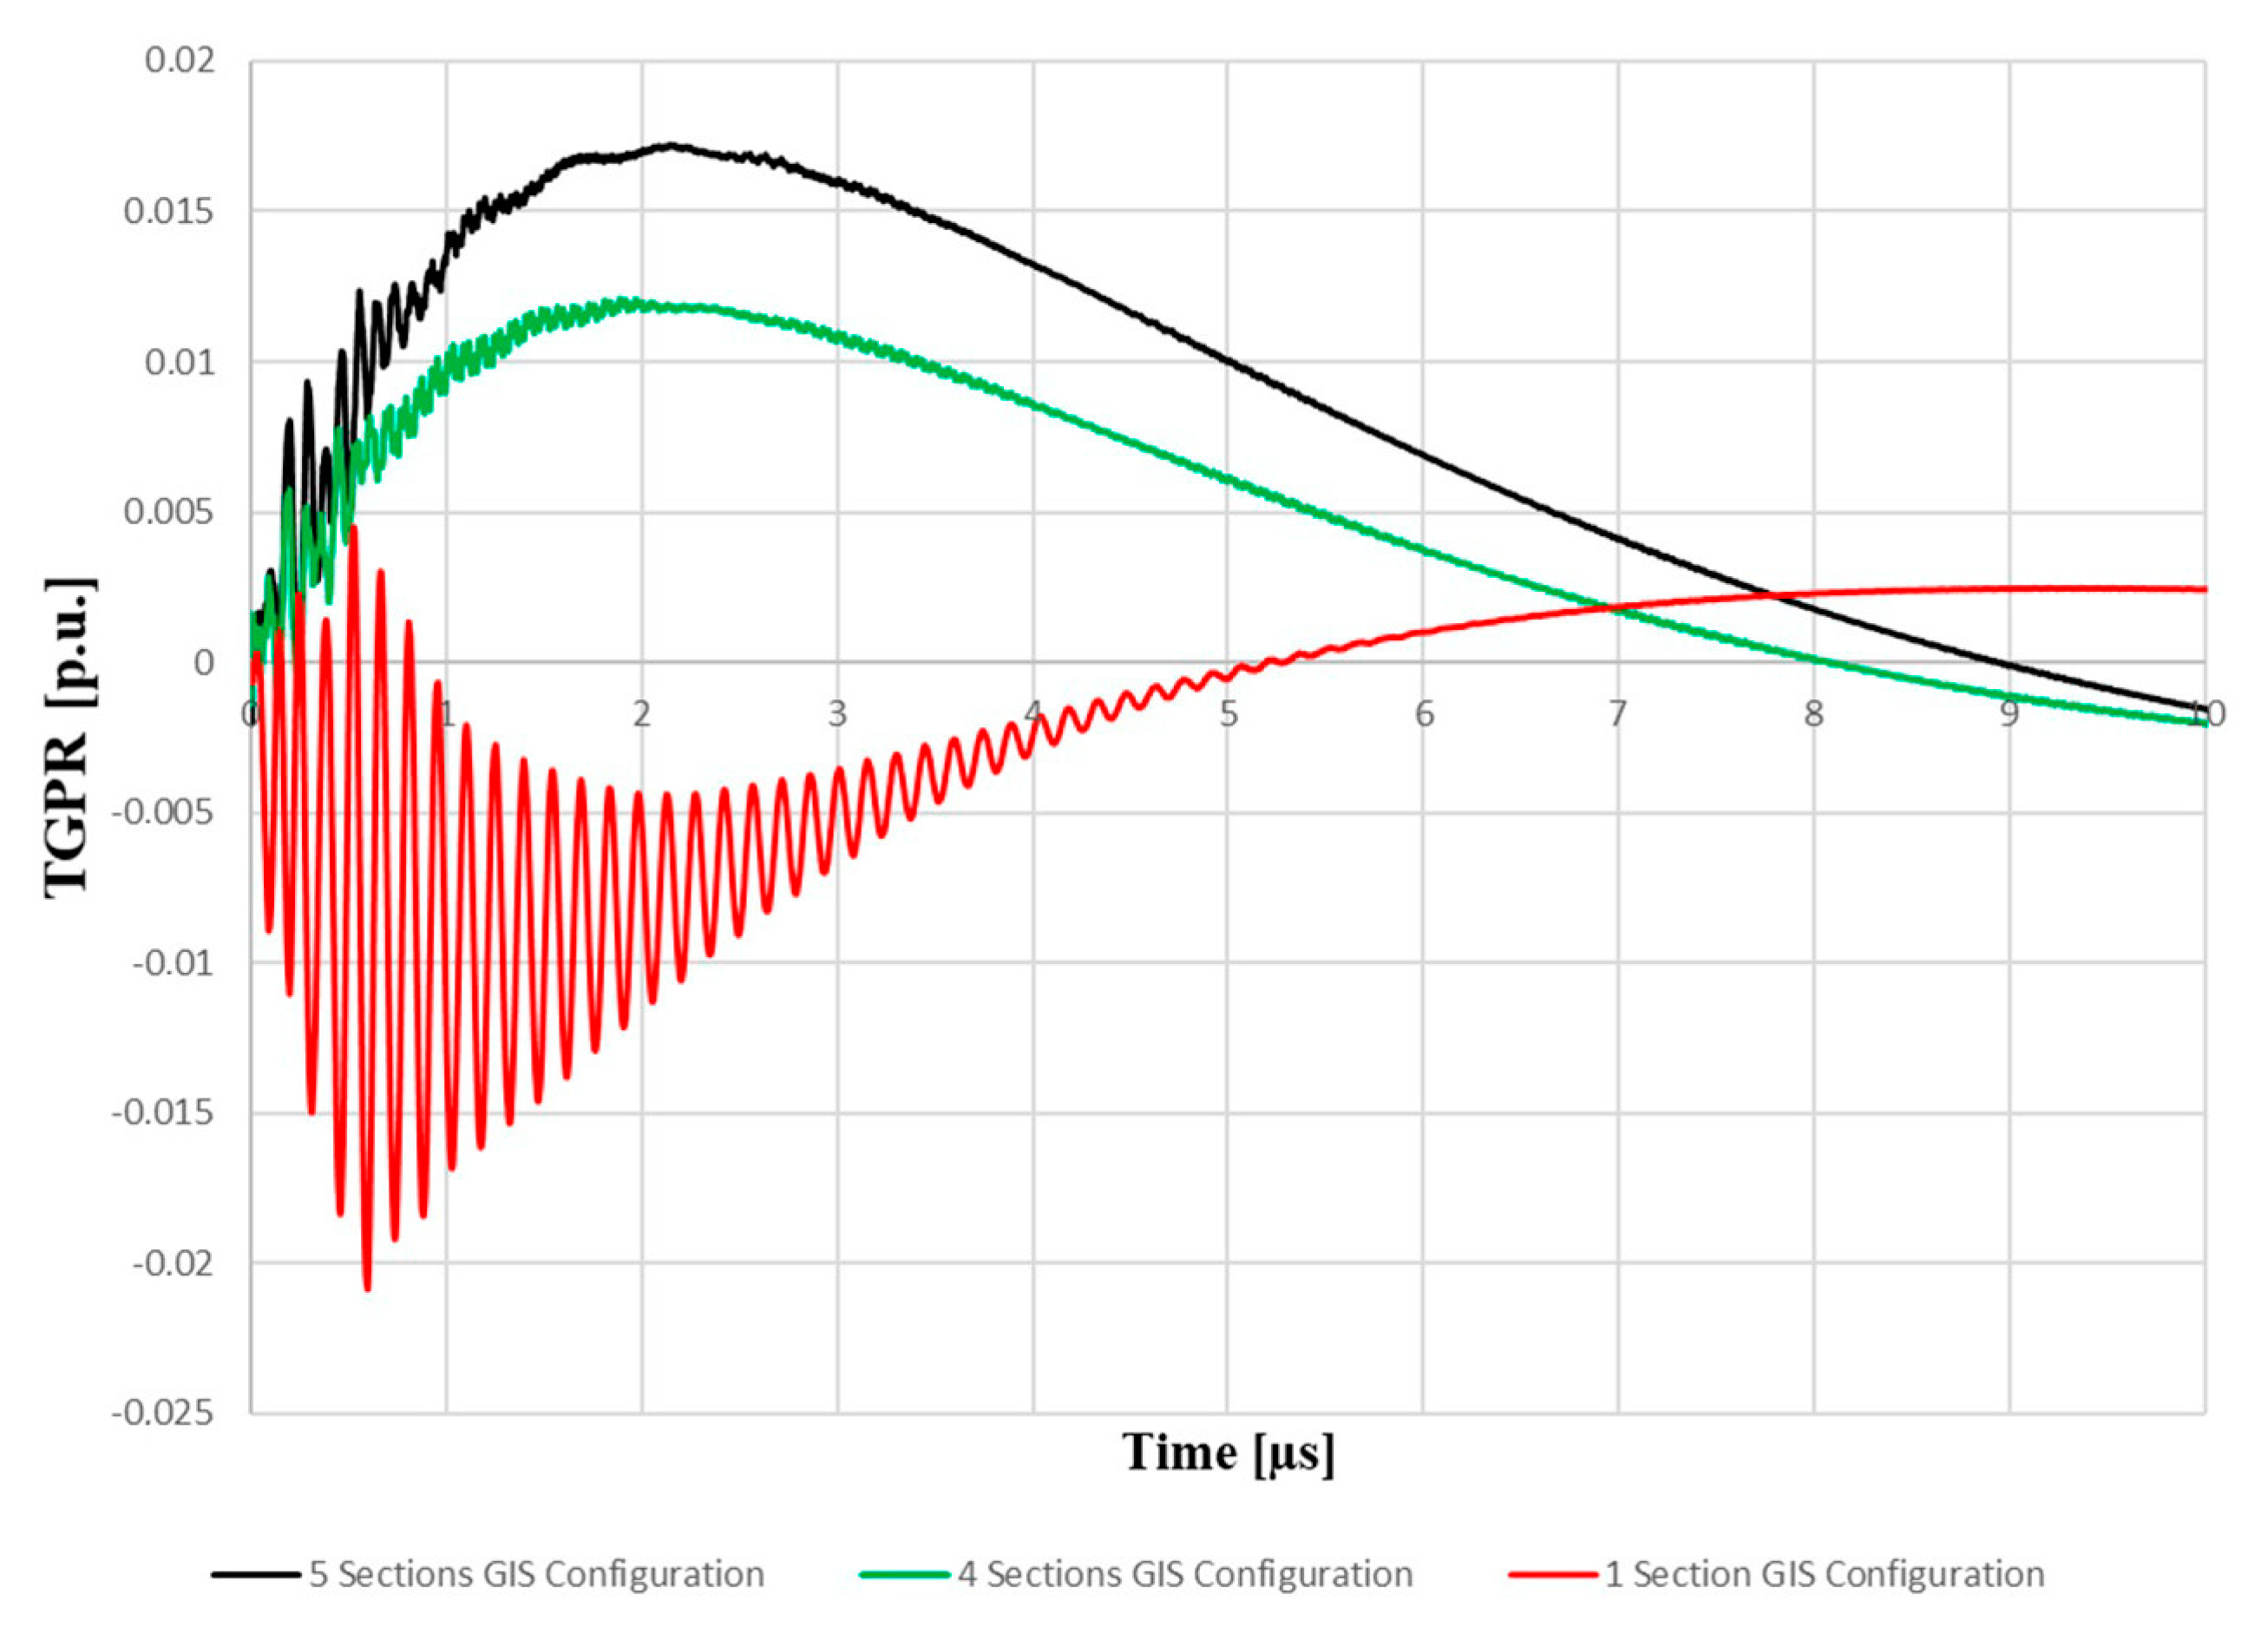
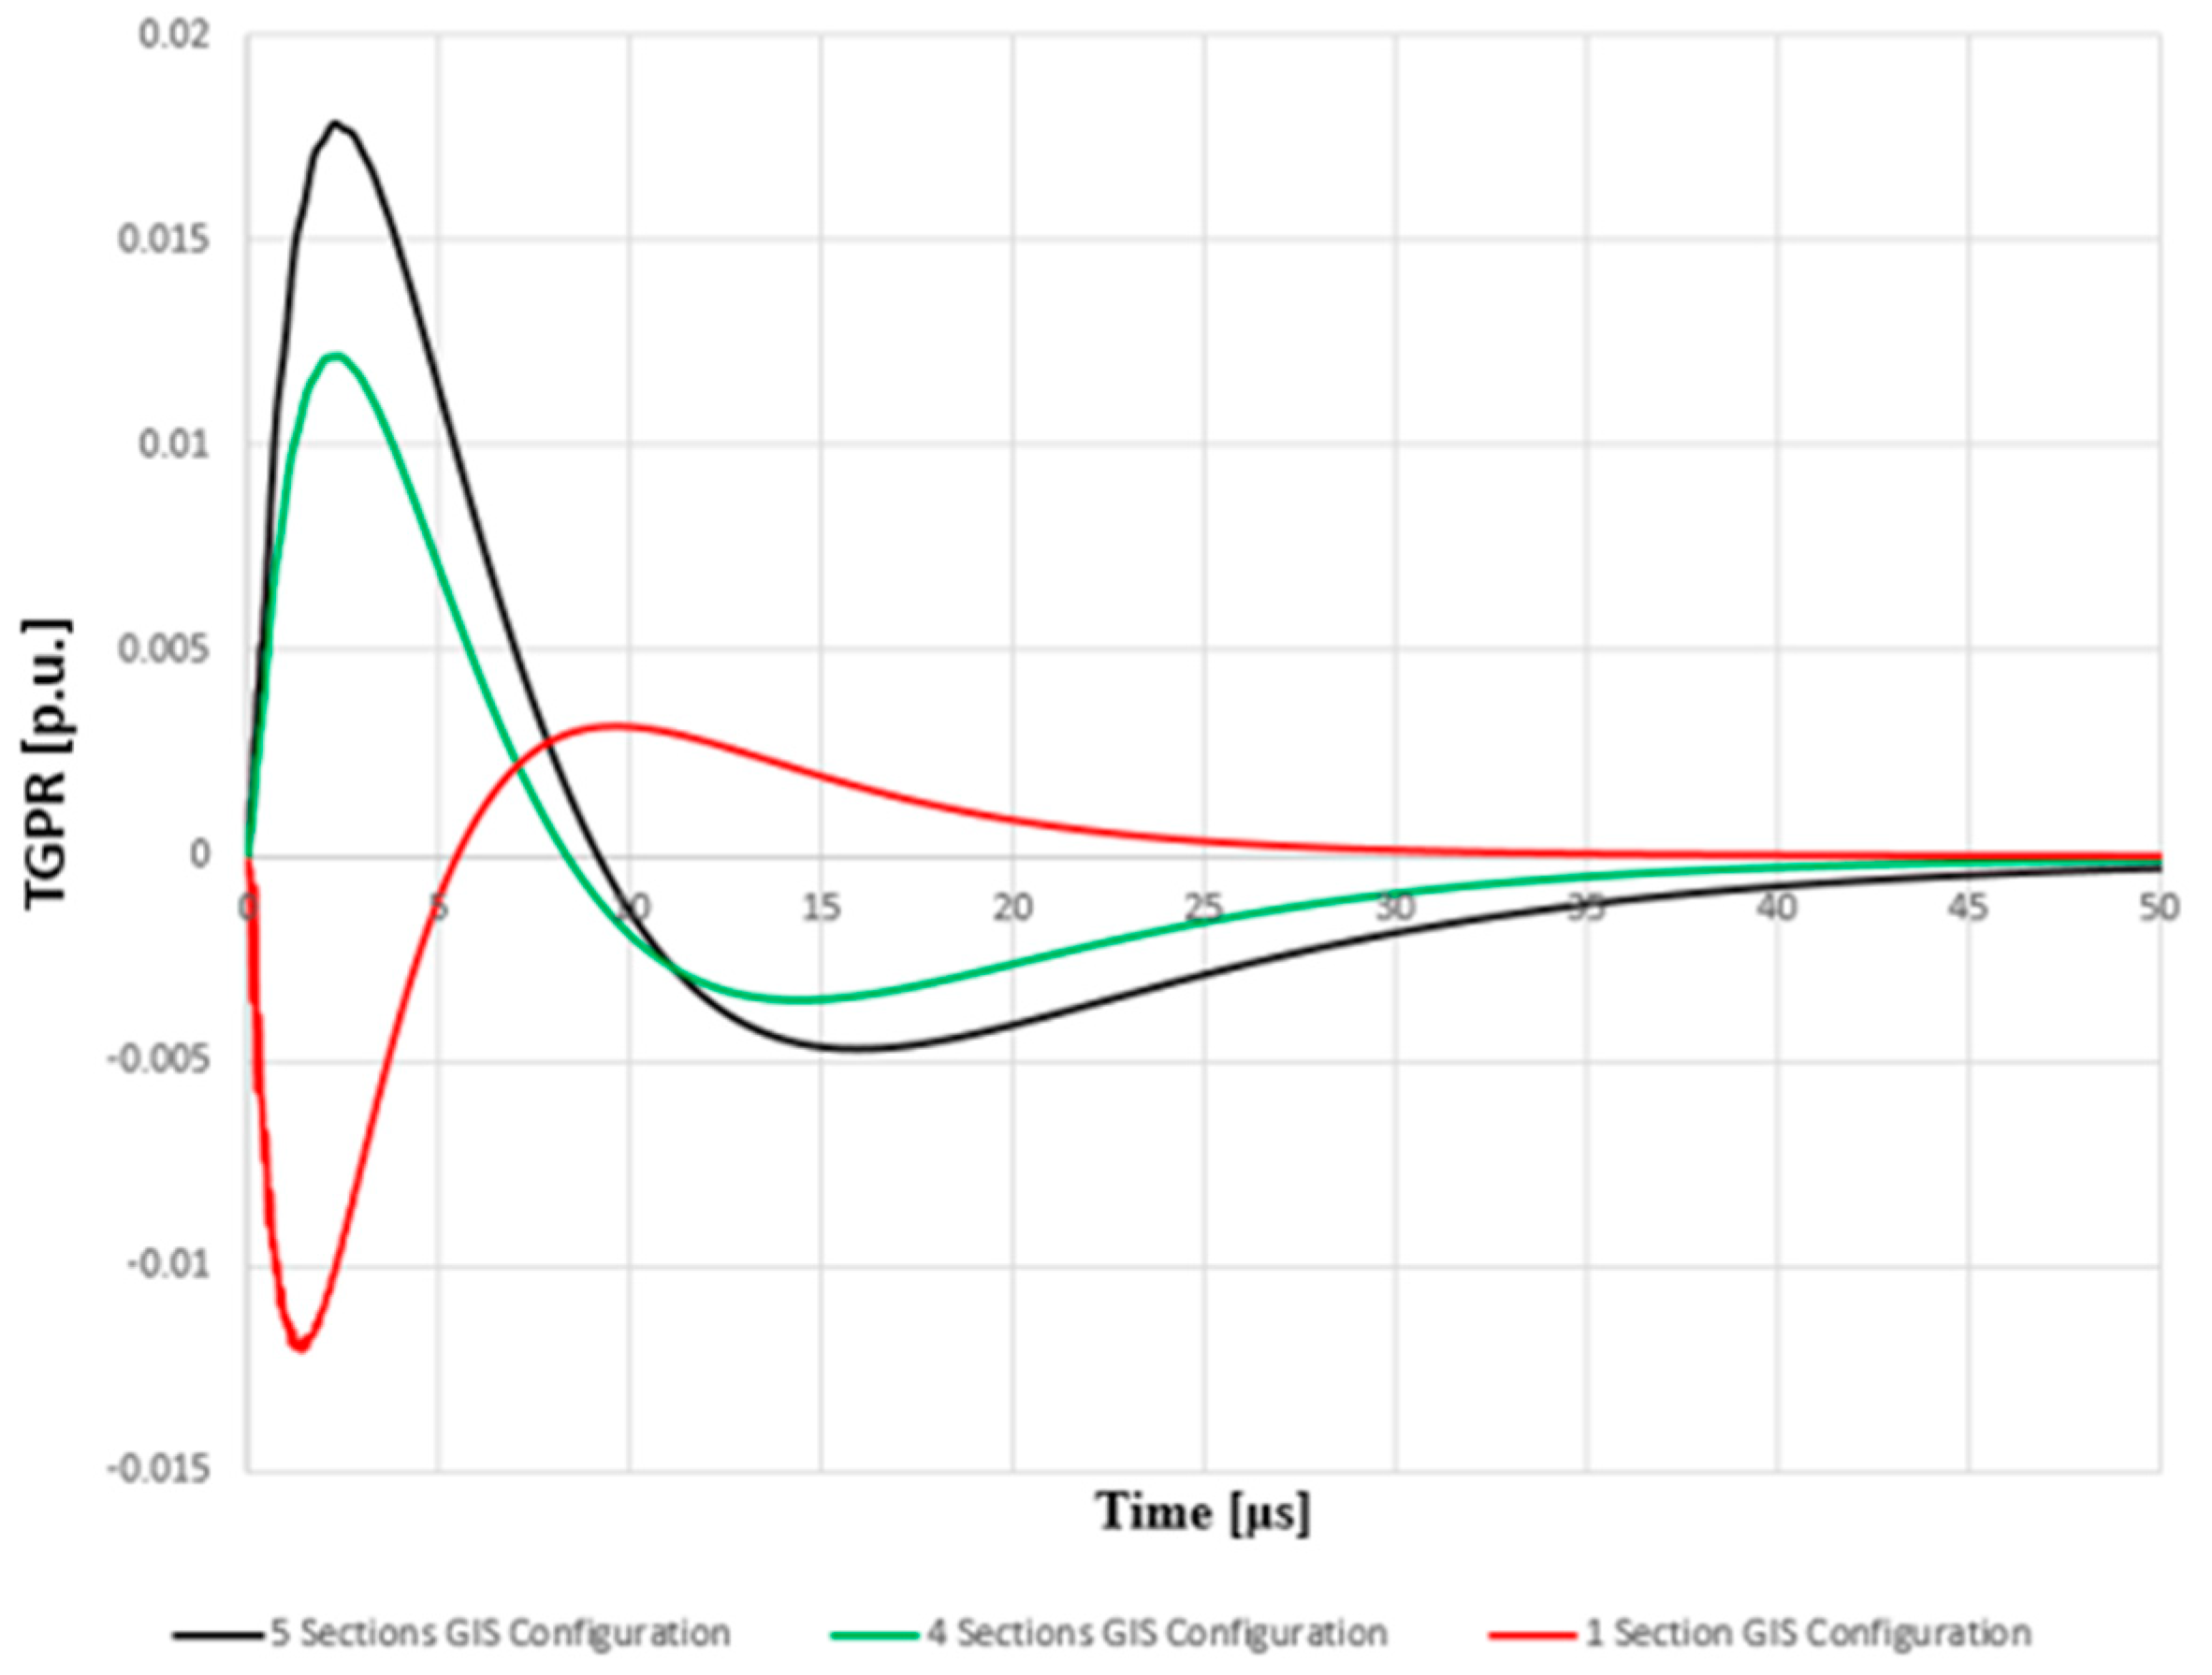
| Max Potential [p.u.] | 0.01723 | 0.01209 | 0.01209 | 0.00605 | 0.02086 |
| Attenuation [%] | 43% | 49% | 42% | 65% | 28% |
| TGPR on Vertical Rod | |||||
| 5 Sections | 4 Sections | 3 Sections | 2 Sections | 1 Section | |
| Max Potential [p.u.] | 0.01785 | 0.01218 | 0.01119 | 0.0021 | 0.01202 |
| Attenuation [%] | −4% | −1% | 7% | 65% | 42% |
Publisher’s Note: MDPI stays neutral with regard to jurisdictional claims in published maps and institutional affiliations. |
© 2020 by the authors. Licensee MDPI, Basel, Switzerland. This article is an open access article distributed under the terms and conditions of the Creative Commons Attribution (CC BY) license (http://creativecommons.org/licenses/by/4.0/).
Share and Cite
Alexandru, M.; Czumbil, L.; Andolfato, R.; Nouri, H.; Micu, D.D. Investigating the Effect of Several Model Configurations on the Transient Response of Gas-Insulated Substation during Fault Events Using an Electromagnetic Field Theory Approach. Energies 2020, 13, 6231. https://doi.org/10.3390/en13236231
Alexandru M, Czumbil L, Andolfato R, Nouri H, Micu DD. Investigating the Effect of Several Model Configurations on the Transient Response of Gas-Insulated Substation during Fault Events Using an Electromagnetic Field Theory Approach. Energies. 2020; 13(23):6231. https://doi.org/10.3390/en13236231
Chicago/Turabian StyleAlexandru, Muresan, Levente Czumbil, Roberto Andolfato, Hassan Nouri, and Dan Doru Micu. 2020. "Investigating the Effect of Several Model Configurations on the Transient Response of Gas-Insulated Substation during Fault Events Using an Electromagnetic Field Theory Approach" Energies 13, no. 23: 6231. https://doi.org/10.3390/en13236231