Article

Evaluation of Experimental Setup and Procedure for Rapid Preparation of Natural Gas Hydrate

State Key Laboratory of Oil and Gas Reservoir Geology and Exploitation, Southwest Petroleum University, Chengdu 610500, China
*
Authors to whom correspondence should be addressed.
Energies 2020, 13(3), 531; https://doi.org/10.3390/en13030531
Submission received: 4 November 2019 / Revised: 15 January 2020 / Accepted: 15 January 2020 / Published: 21 January 2020

Abstract

:
The natural gas hydrate (NGH) reservoir in China is mainly distributed in the continental shelf with water depths ranging from 600–1500 m, about 90% of which is stored in the shallow area of the deep sea, with weak cementation and non-diagenetic characteristics. In order to test and study this type of NGH, samples must be prepared in situ, in large quantities, and at fast speed. At present, there are problems with the common stirring, spraying, and bubbling preparation techniques available, such as slow generation rate, low gas storage density, and lack of rapid preparation. Therefore, the rapid preparation of large samples of non-diagenetic natural gas hydrate has received extensive attention at home and abroad. In view of this technical bottleneck, Southwest Petroleum University innovatively established a rapid preparation kettle of 1062 L. In this paper, the preparation experiment of natural gas hydrate in the South China Sea (the pressure of the preparation kettle was reduced from 7 MPa to 3.3 MPa) was carried out in the preparation method of the ‘three-in-one’ (stirring method, spraying method, bubbling method) and experimental test method. In the process of preparation of non-diagenetic gas hydrate, the data of dynamic image, temperature, pressure, electrical resistivity, and reaction time are tested. During the preparation of natural gas hydrate, temperature, pressure, and electrical resistivity curves in four preparation methods were made, respectively. Through the experimental data analysis of different preparation methods of natural gas hydrate, it has been found that the preparation time of natural gas hydrate using the stirring method, the spraying method, and the bubbling method alone require a longer preparation time. However, when the three-in-one method is used to prepare natural gas hydrate, the preparation cycle of natural gas hydrate is obviously shortened. The preparation time of the single method of stirring method, spraying method, and bubbling method is respectively about 5.13, 3.59, and 3.37 times as long as that of three-in-one method. The three-in-one method for preparing natural gas hydrate greatly improves the preparation efficiency, which has a great significance to the scientific and technological progress of experimental research and evaluation methods of natural gas hydrate.

Graphical Abstract

1. Introduction

Natural gas hydrate (hereinafter referred to as hydrate) is one of the most promising potential alternative energy sources after shale gas, coal bed gas, and tight gas. It is a crystalline clathrate, commonly known as “combustible ice” [1], formed by the interaction of hydrocarbon gases, such as methane, or volatile liquids with water. Methane gas of 164 m3 and water of 0.8 m3 can be obtained by decomposition of hydrate per unit volume [2]. The potential of natural gas hydrate is huge, and the resources in the South China Sea alone are about 85 trillion m3 [3,4,5,6,7]. The gas hydrates in the South China Sea are mainly distributed in the continental shelf with water depths ranging about 600–1500 m [8]. Hydrate reservoirs in the South China Sea are mainly distributed in argillaceous silt with a depth of less than 220 m below the seafloor. The thickness of the hydrate layer is about 50 m, the saturation of the hydrate reservoir is about 45% to 100%, the seawater temperature is about 2.5 °C, and the methane content measured by hydrate sampling is more than 99% [9,10,11]. The temperature range of gas hydrate reservoir in the South China Sea is 2.5–8.5 °C, and the pressure of gas hydrate reservoir is 6–17.5 MPa [12,13]. Some gas hydrates in the South China Sea are in bulk, nodular, and veined. The sediments are mainly composed of mud, silt, sandy mud, and clay silt, of which mud and silt account for 80% [14].
Currently, the rapid preparation methods of natural gas hydrate at home and abroad mainly include mechanical strengthening, chemical strengthening, and rapid preparation technology under the action of external field, and the research of mechanical strengthening is mainly carried out in this paper. Gudmundsson et al. [15] invented a three-stage continuous stirring hydrating device, in which the mixed slurry of natural gas and ice water was injected into a reactor with a stirred paddle, and the gas hydrate containing 30% gas was quickly obtained by stirring at 5 MPa and 10 °C. Hao Wenfeng et al. [16] studied the effect of spray reactor on the preparation of methane hydrate in the experiment and found that the hydration rate was up to 0.46 Vg/(VH·min) at the gas pressure of 2.4 MPa and the spray pressure of 4 MPa. Compared with semi-continuous stirred tank reactor, higher hydration rate was obtained at lower gas pressure. Yang Qunfang et al. [17] designed an experimental system for the preparation of natural gas hydrate by spraying, which enhanced the direct contact heat transfer between water in low temperature and natural gas. The rate of hydrate preparation can be improved by increasing the binding ratio of water molecules to gas groups and enlarging the contact area. Xu et al. [18] used hydrate method to separate CO2 from preparation gas of integrated gasification combined cycle (IGCC). It was found that the shape of hydrate is affected by gas flow rate. When gas flow rate is low, hydrate is needle-like crystal, but when gas flow rate is high, hydrate becomes fine sand crystal. It was also proven that too large or too small air bubbles are not helpful for hydrate preparation. Tajima et al. [19] set multiple helical structures in the middle of the static mixer to divide the cross section into two nearly semicircular channels. They found that it can prolong the gas residence time and improve the synthesis rate of hydrate. Takahashi et al. [20] proved that microbubbles can increase the solubility of gas in water, thus accelerating the nucleation rate of gas hydrate and contributing to the formation of gas hydrate.
Currently, the key problem of hydrate preparation technology is slow preparation speed and low gas storage density, so it is impossible to realize rapid and large-scale preparation in the laboratory. It was found that the largest prepared sample was 550 L at home (Guangzhou Energy Institute, Chinese Academy of Science), and 750 L abroad (Hokkaido, Japan), and the average preparation time was about one month. In view of the current situation of this industry, Southwest Petroleum University, in cooperation with China National Offshore Oil Corporation and Honghua Group, has independently developed a kettle for rapid preparation of non-diagenetic natural gas hydrate. A comparative experiment was carried out between the preparation of natural gas hydrate by stirring, bubbling, and spraying, and by the ‘three-in-one’ method. The so-called three-in-one method is to use stirring, bubbling, and spraying methods simultaneously in one single experiment. Moreover, a unique marine non-diagenetic natural gas hydrate in situ preparation method and experimental research platform has been formed in China. As for the kind of non-diagenetic natural gas hydrate, it has no rock skeleton—the hydrate itself is the rock skeleton instead, and it has the characteristics of weak cementation, instability, easy collapse due to external influence, and disordered decomposition [3].

2. Experimental Equipment

Southwest Petroleum University, in cooperation with China National Offshore Oil Corporation and Honghua Group, has independently developed a kettle for rapid preparation of non-diagenetic natural gas hydrate. The preparation kettle is composed of a preparation system, a crushing system, and a slurry modulation system. The preparation system can simulate the hydrate formation process at 1500 m water depth, and can be used for the rapid preparation of three-in-one hydrate sample by spraying–bubbling–stirring method and the experimental comparison of the single preparation method (the flow chart of the experiment is shown in Figure 1). In this paper, we only study the reaction rate under each promotion mode, so we only carry out the simulation experiment with the initial pressure of 7 MPa. The inner dimension of the preparation kettle is Φ 950 mm × 1500 mm, and the volume is 1062 L. The preparation kettle is forged from alloy steel and is coated with anti-corrosion coating. The simulation experiment of in situ hydrate breakage at 1500 m water depth can be realized by the crushing system. The slurry modulation system is capable of quantitatively mixing seawater, mud, and sand to precisely modulate hydrate slurry (The preparation kettle of non-diagenetic natural gas hydrate in three-in-one method is shown in Figure 2). The preparation kettle has the following functions: ① Simulation of different water depths (0–15 MPa) and low temperature (2–5 °C) at 0 m and 1500 m, simulation of marine non-diagenetic gas hydrate formation process; rapid preparation of large samples of undersea non-diagenetic gas hydrate reservoirs (Φ 950 mm × 1500 mm, 1062 L). ② After the hydrate ore body is formed in the autoclave, the crushing system can be started in situ to simulate and evaluate the advantages and disadvantages of various mining processes and the working performances of various crushing tools (such as hydraulic crushing, entrainment crushing, drum crushing, etc.). The key scientific problems in the process of hydrate ore body breaking, especially the phase equilibrium and stability of hydrate on the fracture surface, are studied in this paper. ③ The modulation function of slurry sample can ensure the quantitative and accurate preparation of various types of hydrate slurry under constant temperature and constant pressure for other experiments (such as multiphase pipeline transportation, etc.). ④ Hydrate slurry can keep heat, keep pressure, keep particle size, and ensure safe migration to hydrate slurry efficient pipeline transportation and separation module.
A visual observation system is installed on the cover top of the preparation kettle, through which the on-line real-time monitoring and image data acquisition of the experimental process in the preparation kettle can be realized. The preparation kettle has its own refrigeration system, and the outer layer of the preparation kettle is designed with refrigerant jacket. With the help of refrigeration compressor, the rapid and accurate refrigeration function is realized. The temperature control precision of the refrigeration system is ±0.1 °C. A heat preservation sleeve is installed around the preparation kettle body to reduce heat loss in the kettle. In addition, a temperature and pressure sensor is installed on the preparation kettle, which can collect the temperature and pressure data in the kettle and the refrigerant temperature in the jacket in real time. The accuracy of the temperature sensor is ±0.01 °C. A total of six temperature sensors were installed on the preparation kettle, which were divided into two groups with three in each group. Each group of temperature sensors were uniformly distributed longitudinally in the preparation kettle, and the two groups were symmetrically distributed in 180 degrees on the preparation kettle. The accuracy of the pressure sensor is ±0.01 MPa. A total of six pressure sensors were installed on the preparation kettle, which were divided into two groups with three in each group. Each group of pressure sensors were uniformly distributed longitudinally in the preparation kettle, and the two groups were symmetrically distributed in 180 degrees on the preparation kettle. The pressure sensor and temperature sensor are distributed at 90 degrees. Four resistivity sensors are installed on the preparation kettle, and the four resistivity sensors are symmetrically distributed on the same plane at an angle of 90 degrees. The distribution plane of the resistivity sensor is 300 mm from the bottom of the preparation kettle. In the process of hydrate preparation, the resistivity of hydrate sediment is mainly determined by the mobility of conductive ions of pore water in pore channel and the salinity of pore water. When the highly insulating hydrate begins to block the pores of the porous media, it seriously affects the fluidity of the pores and the migration rate of solution ions, so the resistivity increases gradually with the formation of hydrate. At present, the change of resistivity is an important monitoring method to determine the formation of hydrate.
A real-time image capture, data acquisition, and automation module of safety control (as shown in Figure 3) was developed for the rapid preparation of gas hydrate kettle by three-in-one method, which realizes the automation and safety control of the equipment of the whole process experiment system. It can automatically and accurately collect and store dynamic images, temperature, pressure, flow, and other experimental data during the whole experimental process. It mainly consists of flowmeter, temperature sensor, pressure sensor, resistivity sensor, electric valve, safety valve, and other hardware equipment and supporting computer control software.

3. Evaluation Experiment of Rapid Preparation of Marine Non-Diagenetic Natural Gas Hydrate

3.1. Experimental Purpose

According to the physical properties of natural gas hydrates in the South China Sea, and based on different times it takes to consume methane gas with the same pressure difference in hydrate preparation, the preparation efficiency of the single preparation method of stirring, spraying, bubbling, and the three-in-one method were tested. Through the study, China’s unique marine non-diagenetic natural gas hydrate indoor in situ preparation methods and experimental research platform were formed.

3.2. Experiment Steps

1. Experimental parameter setting
The speed of stirring is 100 tr/min, the discharge of methane circulation pump is 12 L/min, the discharge of spray pump is 10 L/min, the experiment water is tap water, the output of injection pump is 40 L/min, and the refrigeration temperature of refrigerator is set at 2.5 °C.
2. Experiment steps
• Preparation for the preparation experiment of marine non-diagenetic natural gas hydrate
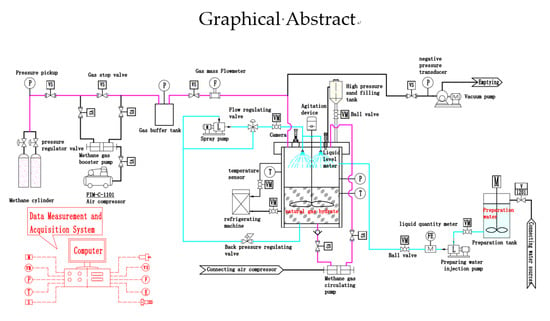
① Equipment testing: Check all the equipment, instruments, instrument connection, and working status to ensure the complete and normal operation of the equipment connection. ② Preparation kettle cleaning: Open the preparation kettle cover, rinse the preparation kettle repeatedly with distilled water three times to ensure that the preparation kettle is clean, and then close the preparation kettle cover. ③ Vacuum pumping: Start the vacuum pump to extract the vacuum, and close the vacuum tube valve when the preset vacuum degree is reached. ④ Inject preparation water (the prepared water is 32% salt water, which is the same as the salinity of the South China Sea [12]): Start the preparation water injection pump, inject 0.5 m3 of preparation water into the preparation kettle, and shut off the injection pump to stop water injection after quantitative addition of the preparation water. ⑤ Open the sand filling valve and add 0.05 m3 of sand to the preparation kettle. The added sand comes from the sample of hydrate in the South China Sea, and the particle size is about 40 μm.
• Preparation experiment of marine non-diagenetic natural gas hydrate
① Start the refrigeration unit of the preparation kettle, set the experimental temperature of hydrate formation at 2.5 °C, until the temperature of preparation water inside the preparation kettle is 2.5 °C, then start to inject methane gas. ② Open the methane valve, start the methane gas booster pump, inject methane gas into the preparation kettle; when the pressure in the preparation kettle is 7 MPa, stop the methane injection. ③ Start agitation device, that is, using agitation method to prepare hydrate (if spraying method is used to prepare natural gas hydrate experiment, then start to prepare water spray pump; if bubbling method is used to prepare natural gas hydrate experiment, then start methane circulation pump; if the three-in-one gas hydrate preparation experiment is carried out, the stirring device, the preparation water spray pump, and the methane gas circulation pump shall be opened simultaneously.) ④ Data acquisition starts when the pressure in the preparation kettle reaches 7 MPa and stops at 3.3 MPa. The reaction time, temperature, pressure, and resistivity when the pressure in the kettle decreases from 7 MPa to 3.3 MPa in the experiments of stirring, spraying, bubbling, and three-in-one methods are recorded, respectively, and the real time image acquisition and processing are carried out by preparing the windows on the top of the kettle cover. When 3.7 MPa methane gas is consumed under the four experimental conditions, the amount of hydrate produced is the same, but the reaction time is different under different experimental conditions, which means that the reaction rate is different under different experimental conditions. The longer the reaction time is under certain experimental conditions, the lower the hydrate formation rate is. ⑤ Finishing and cleaning of experimental equipment; end of experiment. ⑥ Experimental phenomenon analysis and data processing.

3.3. Experimental Phenomena and Data Processing

The data of image, temperature, pressure, resistivity, and reaction time in the experiment of gas hydrate preparation by stirring method, bubbling method, spraying method, and three-in-one method were recorded and processed, and the curves of temperature, pressure, and resistivity (as shown in Figures 5, 6, 8, 9, 11, 12, 14, and 15) in the preparation of natural gas hydrate by stirring, spraying, bubbling, and three-in-one methods and the experimental phenomena (as shown in Figures 4, 7, 10, and 13) in the process of preparation were obtained, respectively.
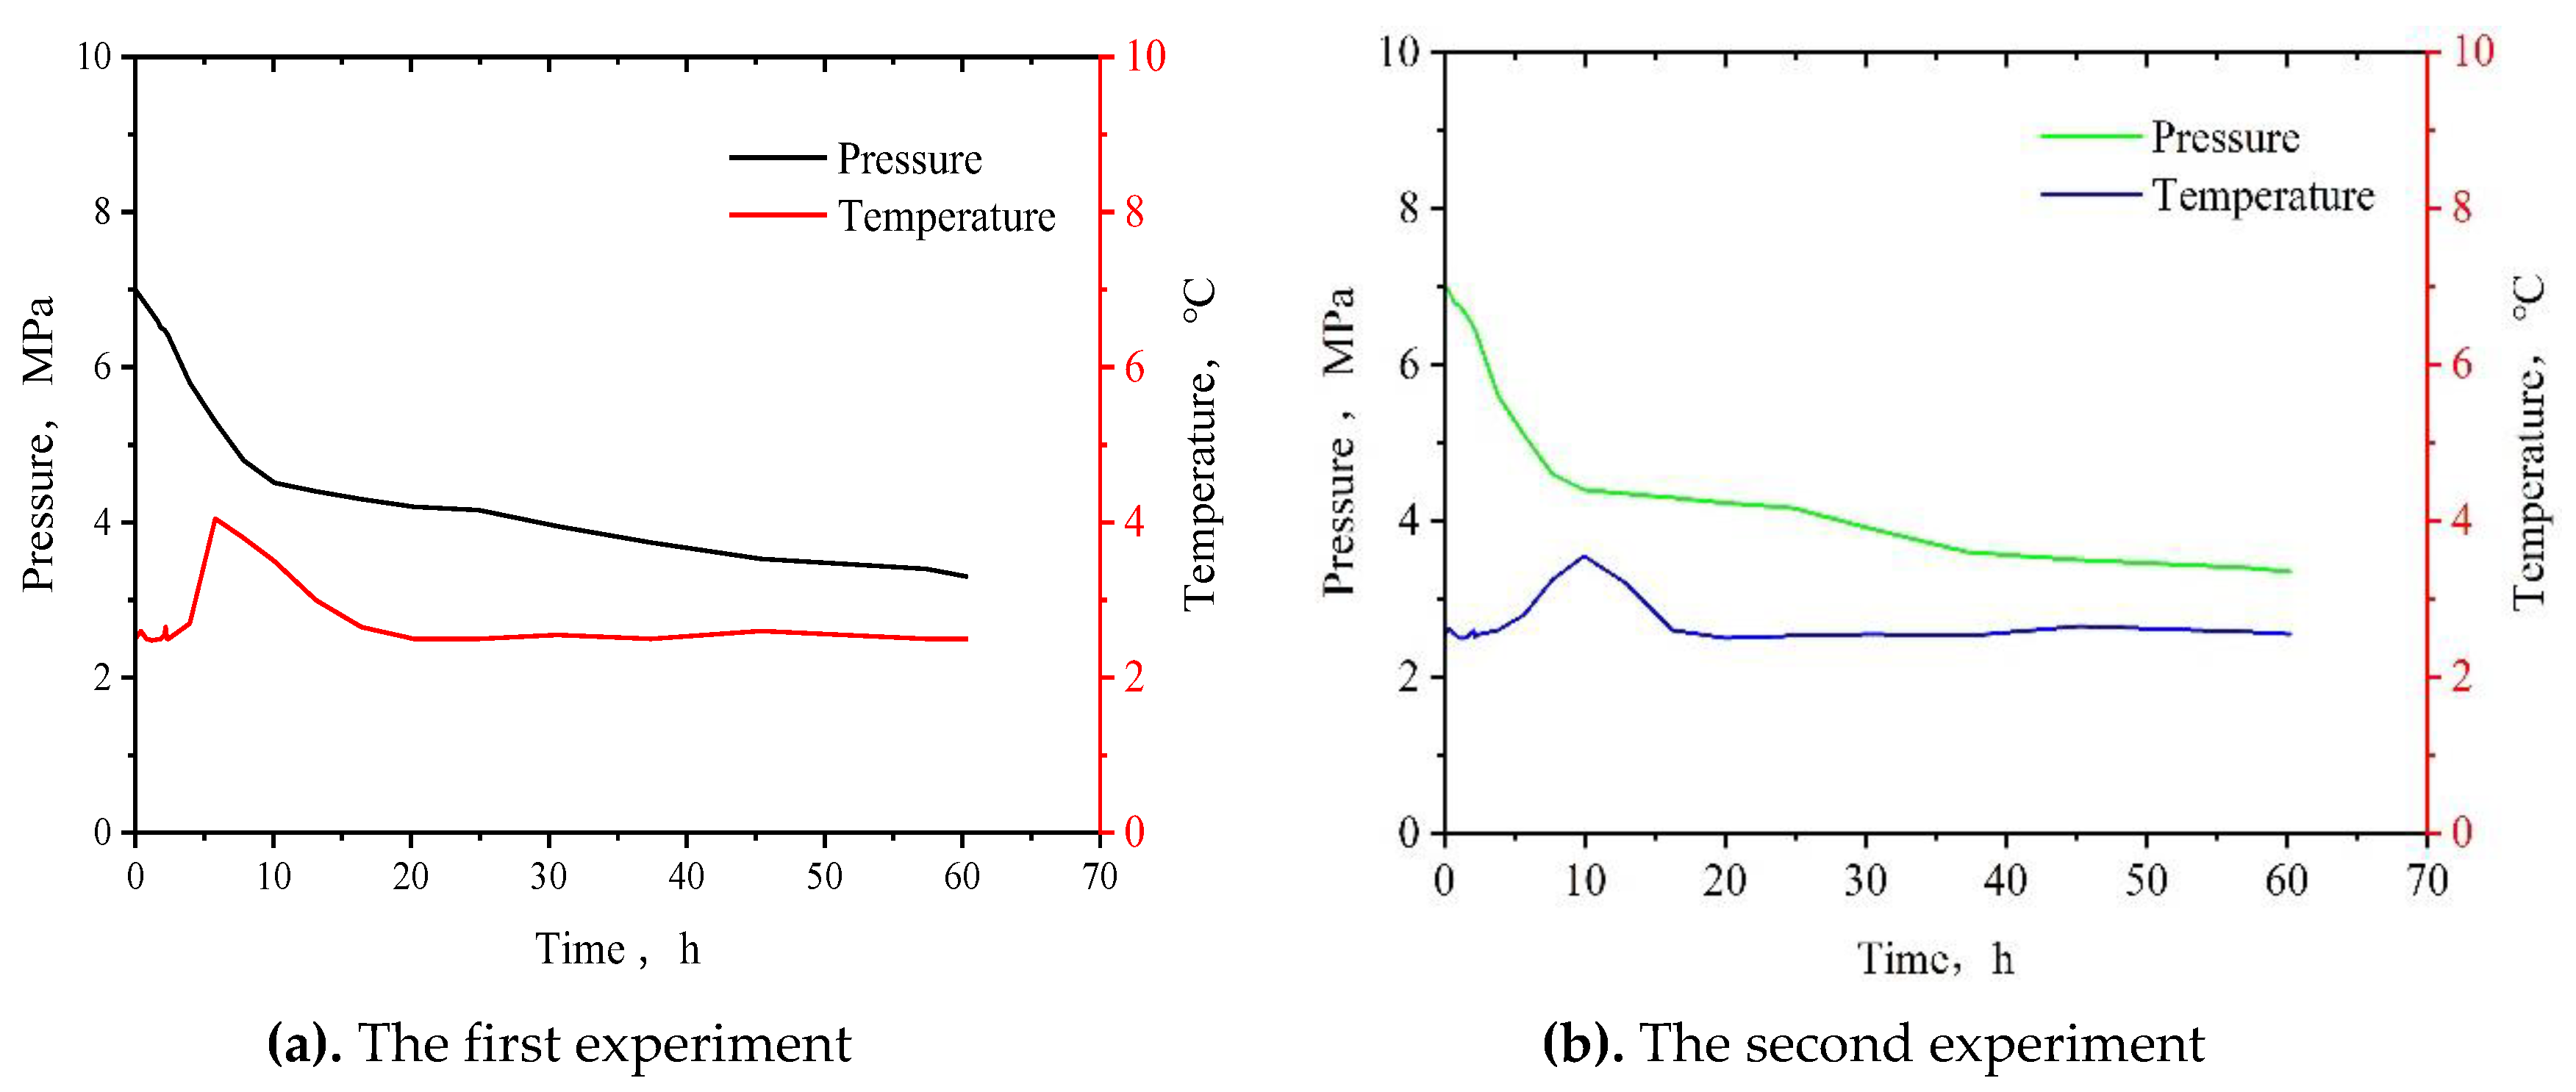
Figure 4 shows the experimental phenomena in the preparation of gas hydrate by stirring method. It can be seen that as the agitation continues, the amount of gas hydrate generated increases slowly and gradually covers the entire liquid surface. Figure shows the temperature and pressure curves during the preparation of gas hydrate by stirring method, Figure 5a shows the first group of experiments, and Figure 5b shows the second group of experiments. It can be seen from Figure 5a that in the initial stage of the experiment, part of the methane gas is gradually dissolved into the preparation water with the progress of stirring after methane gas is injected into the preparation kettle because the temperature in the preparation kettle is relatively low, and the pressure in the preparation kettle is reduced accordingly, and the pressure decreases from 7 MPa to 6.5 MPa after lasting for 2 h, which is the dissolution stage of methane gas. With the reaction going on, there is a step change in temperature and pressure at 5.6 h, the pressure suddenly dropped and the temperature increased suddenly, which is the induction stage. Subsequently, the reaction period enters into rapid growth stage from the induction stage, the pressure dropped abruptly from 6.4MPa to 4.5 MPa, the temperature increased abruptly from 2.5 °C to 4 °C, and the rapid growth period ended at 15.8 h. Then the hydrate preparation enters a stable growth period, the experimental pressure drops to the end of the 3.3 MPa experiment, the cumulative preparation time is 98.3 h. It can be seen from Figure 5b that in the initial stage of the experiment, part of the methane gas is gradually dissolved into the preparation water with the progress of stirring after methane gas is injected into the preparation kettle because the temperature in the preparation kettle is relatively low, and the pressure in the preparation kettle is reduced accordingly, and the pressure decreases from 7 MPa to 6.6 MPa after lasting for 1.9 h, which is the dissolution stage of methane gas. With the reaction going on, there is a step change in temperature and pressure at 5.65 h, the pressure suddenly dropped and the temperature increased suddenly, which is the induction stage. Subsequently, the reaction period enters into rapid growth stage from the induction stage, the pressure dropped abruptly from 6.3 MPa to 4.55 MPa, the temperature increased abruptly from 2.5 °C to 3.8 °C, and the rapid growth period ended at 15.85 h. Then the hydrate preparation enters a stable growth period, the experimental pressure drops to the end of the 3.3 MPa experiment, the cumulative preparation time is 98.75 h. The average cumulative preparation time of the two groups was 98.53 h.
Figure 6 shows the curve of resistivity change during preparation of natural gas hydrate by stirring method, Figure 6a shows the first group of experiments, and Figure 6b shows the second group of experiments. It can be seen that at the early stage of the experiment, part of the methane gas gradually dissolved into the preparation water with the proceeding of agitation after methane gas was injected into the preparation kettle. The measured resistivity increased with the continuous increase of methane gas solubility. During the rapid induction period of hydrate, the change of resistivity was small. After entering the rapid growth period of hydrate, the resistivity increased rapidly with the reaction time because of the rapid rate of hydrate preparation. After entering the stable growth period of hydrate, the hydrate preparation rate decreased and the resistivity increased with the increase of reaction time, but the increase rate was relatively slow.
Figure 7 shows the experimental phenomenon in the preparation of gas hydrate by spray method. It can be seen that as the spray continued, the amount of gas hydrate generated increased slowly and gradually covered the whole impeller (the impeller was used as a reference in order to observe the experimental phenomena conveniently; the impeller was located at the liquid surface). Figure 8 shows the temperature and pressure curves during the preparation of gas hydrate by spray method, Figure 8a shows the first group of experiments, and Figure 8b shows the second group of experiments. It can be seen from Figure 8a that in the initial stage of the experiment, part of the methane gas was gradually dissolved into the preparation water with the progress of spray after methane gas was injected into the preparation kettle because the temperature in the preparation kettle was relatively low, and the pressure in the preparation kettle was reduced accordingly, and the pressure decreased from 7 MPa to 6.5 MPa after lasting for 1.9 h. As the experiment went on, the temperature and pressure had a step change at the same time. There was a sudden drop in pressure and a sudden increase in temperature. The pressure dropped sharply from 6.5 MPa to 4.52 MPa, and the temperature rose abruptly from 2.5 °C to 4.1 °C. The rapid growth period ended after the experiment was carried out for 7.94 h. In the experimental process of preparing hydrate by spray method, the induction period was so short that it is difficult to observe from the diagram. Subsequently, the hydrate preparation entered a stable growth period, the experimental pressure dropped to 3.3 MPa and the experiment ended, and the cumulative preparation time was 68.74 h. It can be seen from Figure 8b that in the initial stage of the experiment, part of the methane gas was gradually dissolved into the preparation water with the progress of spray after methane gas was injected into the preparation kettle, because the temperature in the preparation kettle was relatively low, and the pressure in the preparation kettle was reduced accordingly, and the pressure decreased from 7 MPa to 6.53 MPa after lasting for 2.05 h. As the experiment went on, the temperature and pressure had a step change at the same time. There was a sudden drop in pressure and a sudden increase in temperature. The pressure dropped sharply from 6.2 MPa to 4.3 MPa, and the temperature rose abruptly from 2.4 °C to 4 °C. The rapid growth period ended after the experiment was carried out for 7.99 h. In the experimental process of preparing hydrate by spray method, the induction period was so short that it is difficult to observe from the diagram. Subsequently, the hydrate preparation entered a stable growth period, the experimental pressure dropped to 3.3 MPa and the experiment ended, and the cumulative preparation time was 69 h. The average cumulative preparation time of the two groups was 68.87 h.
Figure 9 shows the curve of resistivity change during preparation of natural gas hydrate by spray method, Figure 9a shows the first group of experiments, and Figure 9b shows the second group of experiments. It can be seen that at the early stage of the experiment, part of the methane gas gradually dissolved into the preparation water with the proceeding of spray after methane gas was injected into the preparation kettle. The measured resistivity increased with the continuous increase of methane gas solubility. During the rapid induction period of hydrate, the change of resistivity was small. After entering the rapid growth period of hydrate, the resistivity increased rapidly with the reaction time because of the rapid rate of hydrate preparation. After entering the stable growth period of hydrate, the hydrate preparation rate decreased and the resistivity increased with the increase of reaction time, but the increase rate was relatively slow.
Figure 10 shows the experimental phenomenon in the preparation of gas hydrate by bubbling method. It can be seen that as the bubbling continued, the amount of gas hydrate generated increased slowly and gradually covered the whole liquid surface. Figure 11 shows the temperature and pressure curves during the preparation of gas hydrate by bubbling method, Figure 11a shows the first group of experiments, and Figure 11b shows the second group of experiments. It can be seen from Figure 11a that in the initial stage of the experiment, part of the methane gas was gradually dissolved into the preparation water with the progress of bubbling after methane gas was injected into the preparation kettle, because the temperature in the preparation kettle was relatively low, and the pressure in the preparation kettle was reduced accordingly, and the pressure decreased from 7 MPa to 6.51 MPa after lasting for 1.85 h. As the experiment went on, the temperature and pressure had a step change at the same time. There was a sudden drop in pressure and a sudden increase in temperature. The pressure dropped sharply from 6.51 MPa to 4.51 MPa, and the temperature rose abruptly from 2.5 °C to 4.05 °C. The rapid growth period ended after the experiment was carried out for 10.1 h. In the experimental process of preparing hydrate by bubbling method, the induction period was so short that it is difficult to observe from the diagram. Subsequently, the hydrate preparation entered a stable growth period, the experimental pressure dropped to 3.3 MPa and the experiment ended, and the cumulative preparation time was 60.39 h. It can be seen from Figure 11b that in the initial stage of the experiment, part of the methane gas was gradually dissolved into the preparation water with the progress of bubbling after methane gas was injected into the preparation kettle, because the temperature in the preparation kettle was relatively low, and the pressure in the preparation kettle was reduced accordingly, and the pressure decreased from 7 MPa to 6.55 MPa after lasting for 1.9 h. As the experiment went on, the temperature and pressure had a step change at the same time. There was a sudden drop in pressure and a sudden increase in temperature. The pressure dropped sharply from 6.4 MPa to 4.4 MPa, and the temperature rose abruptly from 2.54 °C to 3.55 °C. The rapid growth period ended after the experiment was carried out for 9.93 h. In the experimental process of preparing hydrate by bubbling method, the induction period was so short that it is difficult to observe from the diagram. Subsequently, the hydrate preparation entered a stable growth period, the experimental pressure dropped to 3.3 MPa and the experiment ended, and the cumulative preparation time was 60.22 h. The average cumulative preparation time of the two groups was 64.63 h.
Figure 12 shows the resistivity curve in the preparation process of gas hydrate by bubbling method, Figure 12a shows the first group of experiments, and Figure 12b shows the second group of experiments. It can be seen that in the initial stage of the experiment, part of the methane gas was gradually dissolved into the preparation water with the progress of bubbling after methane gas was injected into the preparation kettle. The measured resistivity increased with the continuous increase of methane gas dissolution. In the hydrate preparation process by spray method, the induction period was very short, and the hydrate directly entered the fast growing period after the dissolution period; we can see from the resistivity curve that the resistivity also had the phenomenon of sudden step increase. During the fast growth period of hydrate, the resistivity of hydrate increased rapidly with the reaction time because of the fast hydrate preparation rate. After entering the stable growth period of hydrate, the rate of hydrate preparation decreased, and the resistivity increased with the increase of reaction time, but at a slower rate.
Figure 13 shows the experimental phenomenon in the preparation of gas hydrate by three-in-one method. It can be seen that as the stirring, spraying, and bubbling continue, the amount of gas hydrate generated increased rapidly and covered the whole liquid surface in a short period. Figure 14 shows the temperature and pressure curves during the preparation of gas hydrate by three-in-one method, Figure 14a shows the first group of experiments, and Figure 14b shows the second group of experiments. It can be seen from Figure 14a that in the initial stage of the experiment, part of the methane gas was gradually dissolved into the preparation water with the progress of spraying after methane gas was injected into the preparation kettle, because the temperature in the preparation kettle was relatively low, and the pressure in the preparation kettle was reduced accordingly, and the pressure decreased from 7 MPa to 6.4 MPa after lasting for 1.2 h. As the experiment went on, the temperature and pressure had a step change at the same time. There was a sudden drop in pressure and a sudden increase in temperature. The pressure dropped sharply from 6.49 MPa to 4.52 MPa, and the temperature rose abruptly from 2.5 °C to 4.15 °C. The rapid growth period ended after the experiment was carried out for 5.1 h. The induction period was so short that it is difficult to observe from the diagram. Subsequently, the hydrate preparation entered a stable growth period, the experimental pressure dropped to 3.3 MPa and the experiment ended, and the cumulative preparation time was 19.1 h. It can be seen from Figure 14b that in the initial stage of the experiment, part of the methane gas was gradually dissolved into the preparation water with the progress of spraying after methane gas was injected into the preparation kettle, because the temperature in the preparation kettle was relatively low, and the pressure in the preparation kettle was reduced accordingly, and the pressure decreased from 7 MPa to 6.5 MPa after lasting for 1.25 h. As the experiment went on, the temperature and pressure had a step change at the same time. There was a sudden drop in pressure and a sudden increase in temperature. The pressure dropped sharply from 6.33 MPa to 4.47 MPa, and the temperature rose abruptly from 2.55 °C to 4.2 °C. The rapid growth period ended after the experiment was carried out for 5.16 h. The induction period was so short that it is difficult to observe from the diagram. Subsequently, the hydrate preparation entered a stable growth period, the experimental pressure dropped to 3.3 MPa and the experiment ended, and the cumulative preparation time was 19.29 h. The average cumulative preparation time of the two groups was 19.20 h.
Figure 15 shows the resistivity curve in the preparation process of gas hydrate by three-in-one method, Figure 15a shows the first group of experiments, and Figure 15b shows the second group of experiments. It can be seen that in the initial stage of the experiment, part of the methane gas was gradually dissolved into the preparation water with the progress of stirring, spraying, and bubbling after methane gas was injected into the preparation kettle. The measured resistivity increased with the continuous increase of methane gas dissolution. In the hydrate preparation process by three-in-one method, the induction period was very short, and the hydrate directly entered the fast-growing period after the dissolution period. It can be seen from the resistivity curve that the resistivity saw a step sudden increase phenomenon. During the fast growth period of hydrate, the resistivity of hydrate increased rapidly with the reaction time because of the fast hydrate preparation rate. After entering the stable growth period of hydrate, the rate of hydrate preparation decreased, and the resistivity increased with the increase of reaction time, but at a slower rate.
Through the analysis of the experimental data of the different preparation methods of gas hydrate, it can be seen that the single methods of stirring, spraying, and bubbling need a longer experimental time, but the preparation period of natural gas hydrate by the three-in-one method is obviously shortened. It can be seen from Figure 16 that the preparation times of the single preparation methods of stirring method, spraying method, and bubbling method are about 5.13, 3.59, and 3.37 times of that of the three-in-one method, respectively. Therefore, the preparation efficiency of gas hydrate by three-in-one method is much higher than that by a single method.

4. Conclusions

(1)
Marine natural gas hydrates in China are characterized by weak cementation and non-diagenesis. In order to test and study this type of natural gas hydrate, non-diagenetic gas hydrate must be prepared in situ. At present, there are some problems in the common preparation technology of natural gas hydrate, such as slow formation speed, low gas storage density, and so on, which cannot realize the rapid preparation of large samples of non-diagenetic natural gas hydrate. Therefore, the rapid preparation technology of large samples of natural gas hydrate has been a concern at home and abroad. In view of the bottleneck of this technology, Southwest Petroleum University has innovatively developed the world’s largest and fastest 1062 L three-in-one natural gas hydrate preparation kettle, which is of positive significance for the scientific and technological progress of experimental research and evaluation methods of natural gas hydrate.
(2)
In the preparation process of natural gas hydrate by stirring method, the amount of gas hydrate generated increases slowly and gradually spreads the entire liquid level. In the preparation process of natural gas hydrate by spraying method, the amount of gas hydrate generated increases slowly and gradually covers the entire impeller. In the preparation process of natural gas hydrate by bubbling method, the amount of gas hydrate generated increases slowly and gradually covers the entire liquid level. The induction period can be observed during the preparation of gas hydrate by stirring method, but there is no obvious induction period by spraying method, bubbling method, and three-in-one method.
(3)
When gas hydrate is prepared by three-in-one method, the preparation period of gas hydrate is obviously shortened. The preparation times of stirring method, spraying method, and bubbling method are 5.13, 3.59, and 3.37 times as long as that of three-in-one method. The preparation efficiency of natural gas hydrate is greatly improved through three-in-one method.

Author Contributions

Conceptualization, H.L. and N.W.; methodology, H.L. and N.W.; validation, L.Z.; formal analysis, J.Z.; investigation, Z.C. and L.J.; resources, H.L. and H.X.; experiment, X.Z., C.Z., W.S. and X.W.; data curation, H.L. and N.W.; writing—original draft preparation, H.L. and N.W.; writing—review and editing, H.L., Z.C. and L.J.; supervision, S.Z.; project administration, H.L. and N.W.; funding acquisition, H.L. and N.W. All authors have read and agreed to the published version of the manuscript.

Funding

This research was funded by the Open Fund Project of State Key Laboratory of Oil and Gas Reservoir Geology and Exploitation (No. PLN201816), Scientific Research Starting Project of Southwest Petroleum University (No. 2018QHZ007), National Natural Science Foundation Item of China (No. 51874252 and No. 5177041544), National Key Research and Development Program (No. 2018YFC0310203 and No. 2016YFC0304008), and Basic Applied Research Projects of Science and Technology Department of Sichuan Province (No. 2019YJ0419 and No. 2019YJ0351), which are gratefully acknowledged.

Acknowledgments

This research was supported by State Key Laboratory of Oil and Gas Reservoir Geology and Exploitation, Marine Natural Gas Hydrate Research Institute in Southwest Petroleum University, CNOOC Research Institutes Limited Liability Company, and Geological Explorations and Development Institute in Chuanqing Drilling Engineering Company Limited.

Conflicts of Interest

The authors declare no conflict of interest.

References

  1. Xiao, G.; Bai, Y.H. Natural Gas Hydrates—Flammableice; Wuhan University Press: Wuhan, China, 2012. [Google Scholar]
  2. Guo, P. Theory and Application of Fluid Phase State in Oil and Gas Reservoirs; Petroleum Industry Press: Beijing, China, 2004; pp. 185–187. [Google Scholar]
  3. Zhou, S.; Chen, W.; Li, Q.P.; Zhou, J.L.; Shi, H.S. Research on the solid fluidization well testing and production for shallow non-diagenetic natural gas hydrate in deep water area. China Offshore Oil Gas 2017, 29, 1–8. [Google Scholar]
  4. Zhou, S.W.; Zhao, J.Z.; Li, Q.P.; Chen, W.; Zhou, J.L.; Wei, N. Optimal design of the engineering parameters for the first global trial production of marine natural gas hydrates through solid fluidization. Nat. Gas Ind. 2017, 37, 1–14. [Google Scholar] [CrossRef]
  5. Zhou, S.W.; Chen, W.; Li, Q.P. Gas hydrate solid state fluidization green mining technology in the deep water shallow surface. China Offshore Oil Gas 2014, 26, 1–7. [Google Scholar]
  6. Zhao, J.Z. Latest achievement of SKL of SWPU. Science 2017, 358, 637–638. [Google Scholar]
  7. Zhao, J.Z.; Zhou, S.W.; Zhang, L.H.; Wu, K.S.; Guo, P.; Li, Q.P. The first global physical simulation experimental systems for the exploitation of marine natural gas hydrates through solid fluidization. Nat. Gas Ind. 2017, 37, 15–22. [Google Scholar]
  8. Yao, B.C. Gas hydrate resources in the South China Sea. In Proceedings of the 2001 National Sedimentological Congress, Wuhan, China, 16–19 October 2001; pp. 262–263. [Google Scholar]
  9. Zhang, G.X.; Liang, J.Q.; Lu, J.A.; Yang, S.X.; Zhang, M.; Su, X.; Xu, H.M.; Fu, S.Y.; Kuang, Z.G. Characteristics of natural gas hydrate reservoirs on the northeastern slope of the South China Sea. Nat. Gas Ind. 2014, 34, 9–18. [Google Scholar]
  10. Liu, J.; Zhang, J.Z.; Sun, Y.B.; Zhao, T.H. Gas hydrate reservoir parameter evaluation using logging data in the Shenhu area, South China Sea. Nat. Gas Geosci. 2017, 28, 164–172. [Google Scholar]
  11. Xu, Q. Environmental Magnetism Research of Site 1148 in South China Sea and the Significance for Gas Hydrate Occurrence; China University of Geosciences: Beijing, China, 2013. [Google Scholar]
  12. Qiu, C.H.; Jia, Y.L. Seasonal and Inter-Annual Variations of Temperature and Salinity in the Northern South China Sea. Period. Ocean Univ. China 2009, 39, 376–386. [Google Scholar]
  13. Zheng, Y.J.; Zeng, T.; Li, Y.L.; Bai, K.S.; Xiong, Y. Establishment of external temperature field and calculation of bottom-hole pressure of HTHP gas wells in the South China Sea. China Offshore Oil Gas 2019, 31, 125–134. [Google Scholar]
  14. Shang, T. Geochemistry Study of Marine Surface Sediment in South China Sea and Arctic Sea Area; Northwestern University: Xi’an, China, 2008. [Google Scholar]
  15. Gudmundsson, J.S.; Parlaktuna, M.; Khokhar, A.A. Storage of Natural Gas as Frozen Hydrate. SPE Prod. Facil. 1994, 9, 69–73. [Google Scholar] [CrossRef]
  16. Hao, W.F.; Sheng, W.; Fan, S.S.; Wang, J.Q. Experimental Investigation of Methane Hydrate Formation in a Spraying Reactor. J. Wuhan Univ. Technol. 2007, 12, 39–43. [Google Scholar]
  17. Yang, Q.F.; Liu, D.P.; Xie, Y.M.; Hu, H.H.; Xu, X.Y.; Pan, Y.X. The Experiment System of Natural Gas Hydrate Formation by Water Spray. Chem. Eng. Oil Gas 2006, 35, 256–259. [Google Scholar]
  18. Xu, C.G.; Li, X.S.; Lv, Q.N.; Chen, Z.Y.; Cai, J. Hydrate-based CO2 (carbon dioxide) capture from IGCC (integrated gasification combined cycle) synthesis gas using bubble method with a set of visual equipment. Energy 2012, 44, 358–366. [Google Scholar] [CrossRef]
  19. Tajima, H.; Nagata, T.; Abe, Y.; Yamasaki, A.; Kiyono, F.; Yamagiwa, K. HFC-134a hydrate formation kinetics during continuous gas hydrate formation with a kenics static mixer for gas separation. Ind. Eng. Chem. Res. 2010, 49, 2525–2532. [Google Scholar] [CrossRef]
  20. Takahashi, M.; Kawamura, T.; Yamamoto, Y.; Ohnari, H.; Himuro, S.; Shakutsui, H. Effect of shrinking microbubble on gas hydrate formation. J. Phys. Chem. B 2003, 107, 2171–2173. [Google Scholar] [CrossRef]
Figure 1. The flow chart of rapid preparation of non-diagenetic natural gas hydrate in three-in-one method.
Energies 13 00531 g001
Figure 2. The preparation kettle of non-diagenetic natural gas hydrate in three-in-one method.
Energies 13 00531 g002
Figure 3. The real-time image capture, data acquisition, and automation module of safety control.
Energies 13 00531 g003
Figure 4. The preparation process of natural gas hydrate in stirring method. The yellow dotted line indicates the hydrate boundary. (a) In the first panel, The white flocculent is hydrate. The area of darker color in contact with hydrate is the prepared water. The white bright spot is the light of the fill light lamp. (b) In the second panel, The white flocculent is hydrate. The area of darker color in contact with hydrate is the prepared water. The white bright spot is the light of the fill light lamp. (c) In the third panel, The white flocculent is hydrate. The area of darker color in contact with hydrate is the prepared water. The white bright spot is the light of the fill light lamp. (d) In the fourth panel, The white flocculent is hydrate. The white bright spot is the light of the fill light lamp.
Energies 13 00531 g004
Figure 5. Temperature and pressure changes during preparation of hydrate in stirring method.
Energies 13 00531 g005
Figure 6. Resistivity changes during preparation of hydrate by stirring method.
Energies 13 00531 g006
Figure 7. The preparation process of natural gas hydrate in spray method. The yellow dotted line indicates the hydrate boundary. (a)In the first panel, The white flocculent is hydrate. The area of darker color in contact with hydrate is the prepared water. The black bar is the stirring blade. The round bright iron plate is a fixed arc of the stirring blade. (b)In the second panel, The white flocculent is hydrate. The area of darker color in contact with hydrate is the prepared water. The black bar is the stirring blade. The round bright iron plate is a fixed arc of the stirring blade. (c)In the third panel, The white flocculent is hydrate. The area of darker color in contact with hydrate is the prepared water. The black bar is the stirring blade. The round bright iron plate is a fixed arc of the stirring blade. (d)In the fourth panel, The white flocculent is hydrate. The area of darker color in contact with hydrate is the prepared water.
Energies 13 00531 g007
Figure 8. Temperature and pressure changes during preparation of hydrate in spray method.
Energies 13 00531 g008
Figure 9. Resistivity changes during preparation of hydrate in spray method.
Energies 13 00531 g009
Figure 10. Preparation process of natural gas hydrate by bubbling method. The yellow dotted line indicates the hydrate boundary. (a)In the first panel, The white flocculent is hydrate. The area of darker color in contact with hydrate is the prepared water. (b)In the second panel, The white flocculent is hydrate. The area of darker color in contact with hydrate is the prepared water. (c)In the third panel, The white flocculent is hydrate. The area of darker color in contact with hydrate is the prepared water. (d)In the fourth panel, The white flocculent is hydrate.
Energies 13 00531 g010
Figure 11. Temperature and pressure changes during preparation of hydrate by bubbling method.
Energies 13 00531 g011
Figure 12. Resistivity changes during preparation of hydrate by bubbling method.
Energies 13 00531 g012
Figure 13. Preparation process of natural gas hydrate by three-in-one method. The yellow dotted line indicates the hydrate boundary. (a) In the first panel, The white flocculent is hydrate. The area of darker color in contact with hydrate is the prepared water. The white bright spot is the light of the fill light lamp. (b) In the second panel, The white flocculent is hydrate. The area of darker color in contact with hydrate is the prepared water. The white bright spot is the light of the fill light lamp. (c) In the third panel, The white flocculent is hydrate. The area of darker color in contact with hydrate is the prepared water. The white bright spot is the light of the fill light lamp. (d) In the fourth panel, The white flocculent is hydrate. The white bright spot is the light of the fill light lamp.
Energies 13 00531 g013
Figure 14. Temperature and pressure changes during preparation of hydrate by three-in-one method.
Energies 13 00531 g014
Figure 15. Resistivity changes during preparation of hydrate by three-in-one method.
Energies 13 00531 g015
Figure 16. Comparison of average preparation time and induction time in methods of stirring, spraying, bubbling, and three-in-one. The error is calculated according to the standard deviation of experiment 1 and 2.
Energies 13 00531 g016

