Article

A Comprehensive Coal Reservoir Classification Method Base on Permeability Dynamic Change and Its Application

1
School of Energy Resources, China University of Geosciences, Beijing 100083, China
2
MOE Key Lab of Marine Reservoir Evolution and Hydrocarbon Accumulation Mechanism, China University of Geosciences, Beijing 100083, China
3
Beijing Key Laboratory of Unconventional Natural Gas Geological Evaluation and Development Engineering, Beijing 100083, China
4
China United Coalbed Methane Corporation Ltd., Beijing 100011, China
*
Author to whom correspondence should be addressed.
Energies 2020, 13(3), 644; https://doi.org/10.3390/en13030644
Submission received: 9 January 2020 / Revised: 23 January 2020 / Accepted: 25 January 2020 / Published: 3 February 2020

Abstract

:
Due to the unique adsorption and desorption characteristics of coal, coal reservoir permeability changes dynamically during coalbed methane (CBM) development. Coal reservoirs can be classified using a permeability dynamic characterization in different production stages. In the single-phase water flow stage, four demarcating pressures are defined based on the damage from the effective stress on reservoir permeability. Coal reservoirs are classified into vulnerable, alleviative, and invulnerable reservoirs. In the gas desorption stage, two demarcating pressures are used to quantitatively characterize the recovery properties of permeability based on the recovery effect of the matrix shrinkage on permeability, namely the rebound pressure (the pressure corresponding to the lowest permeability) and recovery pressure (the pressure when permeability returns to initial permeability). Coal reservoirs are further classified into recoverable and unrecoverable reservoirs. The physical properties and influencing factors of these demarcating pressures are analyzed. Twenty-six wells from the Shizhuangnan Block in the southern Qinshui Basin of China were examined as a case study, showing that there is a significant correspondence between coal reservoir types and CBM well gas production. This study is helpful for identifying geological conditions of coal reservoirs as well as the productivity potential of CBM wells.

1. Introduction

Coal reservoir permeability is a key property controlling fluid migration. Many studies and production experiences have shown that permeability is crucial for coalbed methane (CBM) production [1,2]. Coal reservoir permeability varies significantly with variation in effective stress, matrix shrinkage, and gas slippage during CBM development [3,4,5,6]. Specifically, coal reservoirs are sensitive to pressure, and reservoir permeability decreases exponentially with increasing effective stress during the complete depressurization process [7,8]. When the reservoir pressure drops below the critical desorption pressure, CBM desorbs from the coal matrix, and the coal pore structure deforms, resulting in increasing permeability [9,10,11]. Gas slippage also increases the apparent permeability when reservoir permeability is low, but the effect is small [12,13].
Multiple permeability models have been developed to describe coal permeability behavior. Coal permeability models considering the effect of effective stress were first proposed [14,15,16], followed by models considering the effect of sorption-induced strain on coal permeability evolution [17,18,19]. Some models have proven popular with practitioners, such as the Seidle model, P&M model, S&D model, and Pan & Connell model [12,14,20,21,22,23]. These models either consider more complicated conditions or use different interpretations and have been widely used to match historical field production data. Two important motivations for using coal permeability behavior models include the development of models that can provide a practical means for explaining permeability behavior when analyzing reservoir behavior or during laboratory tests and improve our fundamental understanding permeability control mechanisms, which are more theoretically focused [24]. Most scholars obtained a parabolic relation between permeability and reservoir pressure. The permeability of coal reservoirs changes significantly during gas production, commonly initially decreasing but then increasing as the reservoir pressure and gas content are drawn down [20,24,25]. However, in some cases, reservoir permeability does not increase after gas desorption, but it decreases continuously with decreasing reservoir pressure, or, conversely, reservoir permeability increases monotonously during the complete production process. Therefore, there are still some crucial questions, for example: what are the specific characteristics of the permeability dynamic behavior; what parameters can be used to quantitatively characterize this dynamic behavior; what is the physical significance of these parameters; how do these parameters affect coalbed methane (CBM) development? Additionally, the roles of coal physical and chemical properties on permeability behavior have been investigated [25,26,27,28,29,30,31]. These contributions primarily analyze the influence of a single factor on the dynamic change in reservoir permeability based on laboratory testing. Although much work has been done on the influencing factors of permeability with remarkable results, there is still a lack of quantitative research on the comprehensive impact of various factors on reservoir permeability. In summary, the advanced characterization of dynamic change in coal reservoir permeability and its influence are still urgent problems to be solved.
Presently, studies on permeability dynamics are primarily used in CBM numerical simulation, including history matching, productivity prediction, and well pattern optimization. Few studies have applied permeability dynamic behavior to reservoir classification. Meanwhile, most previous studies on coal reservoir classification primarily focus on initial geological conditions such as geologic structure, hydrodynamic conditions, and initial physical properties of coal reservoirs [2,31,32,33,34,35,36,37]. These works have made a significant contribution to the early exploration of CBM. However, coal reservoir classification needs to remain relevant and modern. On the one hand, the initial geological conditions may not be the key factor determining the productivity potential of wells with CBM development for decades, and reservoir classification based on static geological conditions is often inconsistent with gas production; on the other hand, the dynamic behavior of coal reservoir physical properties has become more and more important for CBM production. Therefore, it is a very meaningful work to classify coal reservoirs based on the dynamic behavior of reservoir permeability.
In this contribution, the effects of effective stress and sorption-induced strain, which have been fully considered relative to the permeability of a high-rank coal reservoir in China [12,38], were applied to examine the permeability dynamic characterization in the single-phase water flow stage and gas desorption stage. Some demarcating pressures and corresponding permeabilities were proposed to quantitatively characterize the dynamic permeability in various stages. Furthermore, the influence of geologic parameters on these pressures was analyzed in detail, and the type of coal reservoir was determined based on the permeability dynamic behavior. This method is applied to classify reservoirs in the Shizhuangnan Block, and the results are consistent with the actual production, which show the validity of this method and its important role in reservoir classification and CBM production.

2. Methods

2.1. Reservoir Properties in the Single-Phase Water Flow Stage

For unsaturated coal reservoirs, when reservoir pressure is greater than the critical desorption pressure, CBM cannot desorb from the coal matrix, and pores are filled with coal seam water, which defines CBM production in the single-phase water flow stage. Coal reservoirs are only affected by effective stress, and the mathematical model for the permeability change induced in the in situ coal condition was established (Equation (1)) [12,39]. The permeability damage rate is defined as the slope of a dynamic permeability curve, which can be obtained from the first derivative of the dynamic permeability formula. Its physical meaning refers to the change degree of reservoir permeability caused by the drop of reservoir pressure in the single-phase water flow stage. This parameter is used to reasonably characterize the effect of a drop in reservoir pressure on permeability (Equation (2)).
k 1 = k i e C f ( 1 + v 1 v ) ( P i P )
k = C f ( 1 + v 1 v ) k i e C f ( 1 + v 1 v ) ( P i P )
where k 1 is the dynamic permeability in the single-phase water flow stage, mD; k i is the initial permeability, mD; P i is the initial reservoir pressure, MPa; P is the reservoir pressure, MPa; C f is the cleat-volume compressibility, MPa−1; and v is Poisson’s ratio, dimensionless. In order to analyze the trend of the curve more intuitively, the initial values of each parameter are set to k i = 4 , C f = 1 , v = 0.3 , P i = 4 .
Reservoir permeability and its damage rate decrease monotonously with decreasing pressure (Figure 1). The effect of effective stress on coal reservoir permeability is significant at high reservoir pressure. Then, the permeability damage rate decreases with decreasing reservoir pressure, indicating that the effect of effective stress on permeability gradually decreases. When the reservoir pressure drops to a low level, the permeability damage rate is almost zero. Since coal reservoirs with permeability less than 0.1 mD are impermeable [40], the invulnerable pressure ( P n ) is defined as the pressure at which the permeability damage rate is equal to 0.1 mD/MPa. When reservoir pressure is less than the invulnerable pressure, the effective stress has a minimal effect and can be ignored (Equation (3)).
P n = P i ln ( 10 C f k i ( 1 + v 1 v ) ) C f ( 1 + v 1 v )    ( k = 0.1 )
In order to quantitatively characterize the dynamic change in reservoir permeability in the single-phase water flow stage, the curvature of the dynamic permeability ( k q ) was calculated (Equation (4)). Generally, the curvature positively correlates with the permeability damage rate [41]. The shape of the curve is similar to a parabola; that is, the curvature of the dynamic permeability curve rises first and then decreases with the depletion of pressure, indicating that the permeability damage rate changes from rapid decrease to a slow decrease (Figure 2). The turning pressure ( P t ) is defined as the reservoir pressure corresponding to the maximum curvature, and its value is the result of the first derivative of k q being zero (Equations (5) and (6)).
k q = | k | ( 1 + k 2 ) 3 2 = C f 2 ( 1 + v 1 v ) 2 k i e C f ( 1 + v 1 v ) ( P i P ) ( 1 + C f 2 ( 1 + v 1 v ) 2 k i 2 e 2 C f ( 1 + v 1 v ) ( P i P ) ) 3 2 .
k q = C f 3 ( 1 + v 1 v ) 3 k i e C f ( 1 + v 1 v ) ( P i P ) ( 1 2 C f 2 ( 1 + v 1 v ) 2 k i 2 e 2 C f ( 1 + v 1 v ) ( P i P ) ) ( 1 + C f 2 ( 1 + v 1 v ) 2 k i 2 e 2 C f ( 1 + v 1 v ) ( P i P ) ) 5 2 .
P t = P i ln ( 2 C f k i ( 1 + v 1 v ) ) C f ( 1 + v 1 v )     ( k q = 0 ) .
where k and k are the first and second derivatives of the dynamic change formula of permeability, respectively. k q is the curvature of the dynamic curve of permeability.
The k q curve also has two extrema, and the corresponding pressures are defined as the vulnerable pressure ( P v ) and alleviate pressure ( P a ), respectively. The extrema can be obtained by calculating k q = 0 (Equation (7)).
k q = C f 4 ( 1 + v 1 v ) 4 k i e C f ( 1 + v 1 v ) ( P i P ) 10 C f 6 ( 1 + v 1 v ) 6 k i 3 e 3 C f ( 1 + v 1 v ) ( P i P ) + 4 C f 8 ( 1 + v 1 v ) 8 k i 5 e 5 C f ( 1 + v 1 v ) ( P i P ) ( 1 + C f 2 ( 1 + v 1 v ) 2 k i 2 e 2 C f ( 1 + v 1 v ) ( p i p ) ) 7 2 .
P v = P i ln ( 2 C f k i ( 1 + v 1 v ) 5 + 21 ) C f ( 1 + v 1 v )   ( k q = 0 ) .
P a = P i ln ( 2 C f k i ( 1 + v 1 v ) 5 21 ) C f ( 1 + v 1 v )   ( k q = 0 ) .
In summary, according to coal permeability dynamic characterization in the single-phase water flow stage, the coal permeability undergoes five stages during depressurization: the vulnerable stage, vulnerable transition stage, alleviative transition stage, alleviative stage, and invulnerable stage. The vulnerable pressure, turning pressure, alleviate pressure, and invulnerable pressure are the demarcating pressures corresponding to the five stages. Based on these stages, the coal reservoir can be further classified such that if P i > P t , the reservoir is a vulnerable reservoir; if P n < P i < P t , the reservoir is an alleviative reservoir; if P i < P n , the reservoir is an invulnerable reservoir (Figure 3).

2.2. Reservoir Properties in the CBM Desorption Stage

For saturated coal reservoirs or unsaturated coal reservoirs when reservoir pressure drops below the critical desorption pressure, CBM desorbs from the coal matrix with decreasing pressure, and pores are filled with not only coal seam water but also desorbed gas. At this time, CBM development is in the gas desorption stage, and reservoir permeability is not only damaged by the effective stress effect, but also restored by the matrix shrinkage and gas slippage effects. The effect of gas slippage on permeability is very small (the permeability increase due to the gas slippage effect is 1/10th of the matrix shrinkage effect), and the gas slippage effect is commonly significant at low pressure (<1 MPa) [12,13]; hence, the gas slippage effect on permeability is not considered in this study. The dynamic change formula for reservoir permeability in the CBM desorption stage is as follows [42,43]:
k 2 = k c d e C f ( 1 + v 1 v ) ( P c d P ) + k c d [ π S v ρ 3 162 ( R ( P c d ) 3 R ( P ) 3 ) + φ i φ i   ] 3 k c d .
R ( P ) = 10 3 V L P S v ( P L + P ) + r i .
r i = 3 × 10 3 S v ρ .
where k2 is the dynamic permeability in the CBM desorption stage, mD; P c d is the critical desorption pressure, MPa; k c d is the reservoir permeability corresponding to the critical desorption pressure, mD; S v is the specific surface area, m2/kg;   r i is the matrix particle radius, m; φ i is the initial porosity, dimensionless; R ( P ) is the equivalent matrix particle radius, m; V L is the Langmuir volume, m3/t; P L is the Langmuir pressure, MPa; and ρ is the coal density, g/cm3.
The relationship between permeability and reservoir pressure is parabolic (Figure 4). Coal reservoir permeability changes significantly during gas production, commonly initially decreasing due to the dominate effective stress but then increasing due to the dominate matrix shrinkage effect as reservoir pressure and gas content are drawn down. This turning point is defined as the rebound pressure ( P r b ) [21,22]. P r b is given by the solution to the equation k 2 = 0 , which can be solved using Matlab (Equation (13)).
k 2 = C f ( 1 + v 1 v ) k c d e C f ( 1 + v 1 v ) ( P c d P r b ) 9 π S r 3 ρ 3 162 k c d R ( P r b ) 2 R ( P r b ) [ π S r 3 ρ 3 162 ( R ( P c d ) 3 R ( P r b ) 3 ) + φ i φ i ] 2 = 0 .
The first derivative of the reservoir permeability equation in the CBM desorption stage increases monotonically with increasing reservoir pressure, indicating that the rebound pressure has at most one solution [13]. If the rebound pressure is between 0 P c d , reservoir permeability will rebound in the CBM desorption stage. The effective stress effect on permeability is greater than the matrix shrinkage effect in the early stage, and the matrix shrinkage effect is greater than the effective stress effect in the later stage. However, if the rebound pressure is less than or equal to 0, the effective stress is greater than the matrix shrinkage effect throughout pressure depletion, and the permeability decreases continually. If the rebound pressure is greater than or equal to P c d , the matrix shrinkage effect is greater than the effective stress effect throughout pressure depletion, and the permeability increases continually.

2.3. Reservoir Properties in the Whole Production Stage

For unsaturated coal reservoirs, dynamic changes in reservoir permeability during the complete drainage process include the dynamic change in the single-phase water flow stage and the CBM desorption stage. Therefore, the reservoir permeability dynamic change formula is given by Equation (14). In order to quantitatively analyze the permeability recovery, the recovery pressure ( P r c ) is defined as the reservoir pressure, where reservoir permeability is recovered to initial permeability (Equation (15)). If the recovery pressure is greater than 0, the coal reservoir is a recoverable reservoir. On the contrary, if the recovery pressure is less than or equal to 0, the coal reservoir is an unrecoverable reservoir.
k 3 = { k i e C f ( 1 + v 1 v ) ( P i P )    ( P c d < P < P i ) k i e C f ( 1 + v 1 v ) ( P i P ) + k i e C f ( 1 + v 1 v ) ( P i P c d ) [ π S r 3 ρ 3 162 ( R ( P c d ) 3 R ( P ) 3 ) + φ i φ i ] 3 k i e C f ( 1 + v 1 v ) ( P i P c d ) ( P < P c d )
e C f ( 1 + v 1 v ) ( P i P c d ) * { e C f ( 1 + v 1 v ) ( P c d P r c ) + [ π S r 3 ρ 3 162 ( R ( P c d ) 3 R ( P r c ) 3 ) + φ i φ i ] 3 1 } = 1 .
In summary, based on the dynamic change in the permeability during CBM well development, coal reservoirs can be classified as vulnerable reservoirs, alleviative reservoirs, and invulnerable reservoirs in the single-phase water flow stage, as well as recoverable reservoirs and unrecoverable reservoirs in the CBM desorption stage (Figure 5). Reservoir classification is helpful for studying the geological conditions of CBM development and optimizing CBM well locations.

3. Discussion

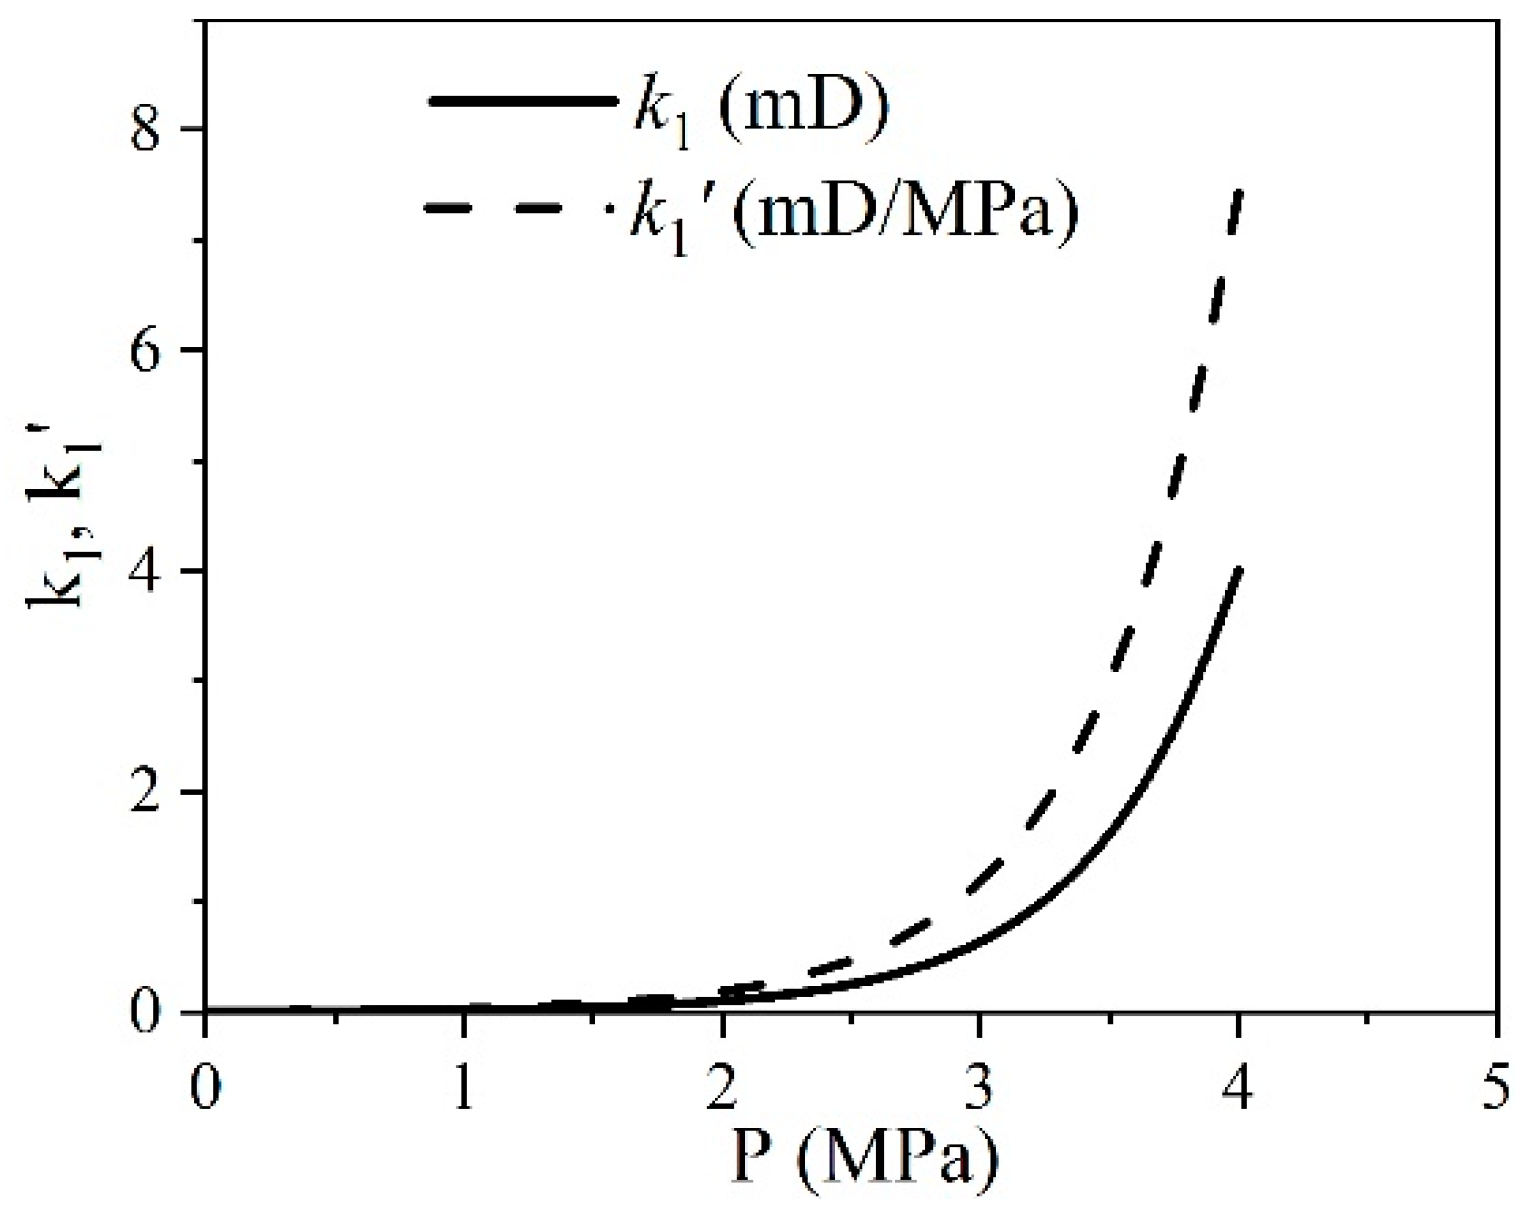
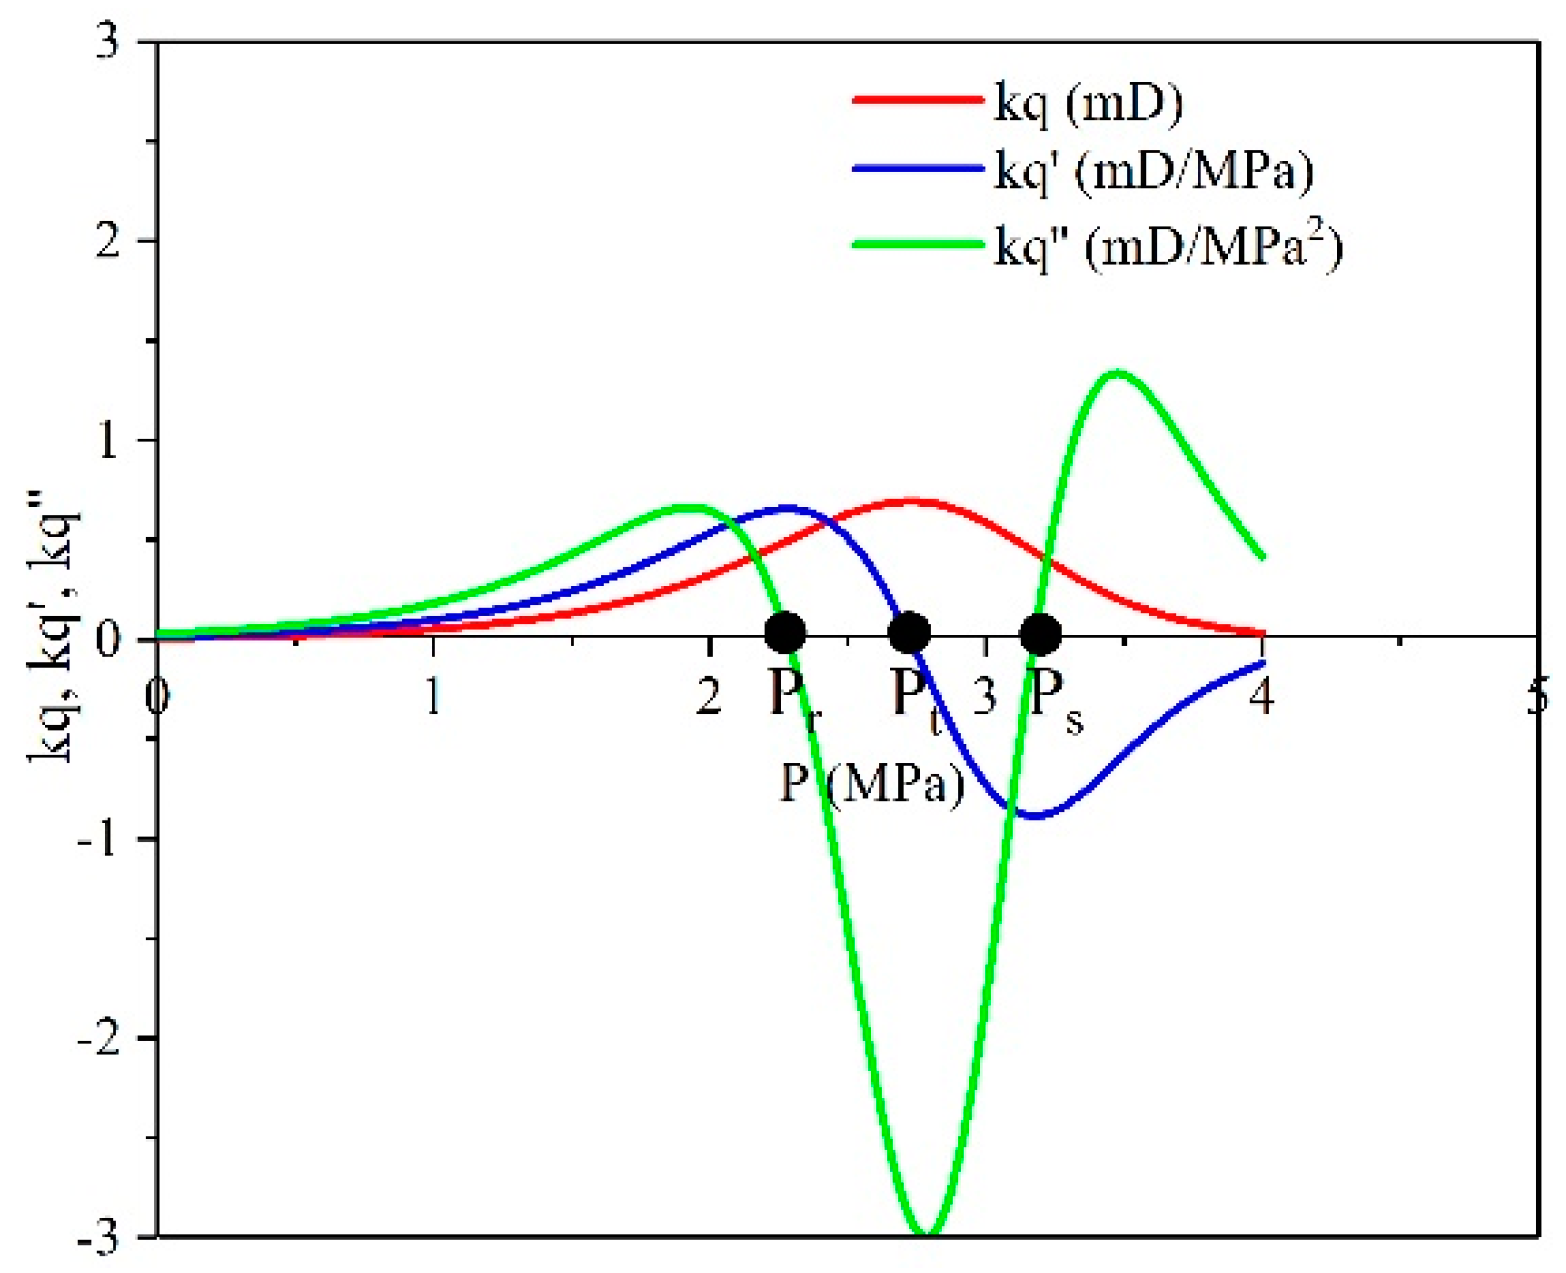
3.1. Advanced Characterization of the Four Demarcating Pressures in the Single-Phase Water Stage

The above research shows that the coal permeability undergoes five stages in the single-phase water flow stage: vulnerable stage, vulnerable transition stage, alleviative transition stage, alleviative stage, and invulnerable stage. Vulnerable pressure, turning pressure, alleviate pressure, and invulnerable pressure are the demarcating pressures corresponding to the five stages. Therefore, the physical properties of these demarcating pressures are further examined.
Firstly, the permeability may not experience all five of these stages in the single-phase water stage depending on the coal reservoir properties. For example, if P i > P m , permeability can experience from the vulnerable stage. It is worth noting that if P i > P m is to be matched, ln ( 2 C f k i ( 1 + v 1 v ) 5 + 21 ) C f ( 1 + v 1 v ) > 0 ; that is, C f k i ( 1 + v 1 v ) > 5 + 21 2 . In other words, if P z < P i < P m , the permeability may not experience the vulnerable stage, but it will experience the vulnerable transition stage, and 2 2 < C f k i ( 1 + v 1 v ) < 5 + 21 2 is matched in this condition. Similarly, the conditions for the other stages are shown in Table 1.
The permeability and permeability damage rate at the demarcating pressures can be obtained by substituting the formula of the demarcating pressure into the corresponding dynamic change formulas. The reservoir permeability of the demarcating pressures is independent of the initial permeability but is related to the reservoir properties, specifically, cleat-volume compressibility and Poisson’s ratio. The reservoir permeability damage rate corresponding to the demarcating pressures is constant. The lower the pressure, the lower the permeability damage rate.

3.2. Advanced Characterization of P r b and P r c

P r b and P r c can be calculated based on the coal reservoir parameters using Equations (13) and (15). In order to study the influence of geological factors on P r b and P r c , an orthogonal test was designed, which is one of the most effective and time-saving methods for studies involving multiple variables to determine which factors (or variables) primarily influence the properties of the target product [44]. The basic feature of the orthogonal test involves replacing the comprehensive experiments with some characteristic experiments and examining the comprehensive experiments by analyzing some experimental results [45]. Through the analysis of a part of the experimental results, the comprehensive experiment is studied, and the optimal level combination is determined.
Target geological parameters include cleat-volume compressibility, Poisson’s ratio, critical adsorption pressure, porosity, Langmuir volume, Langmuir pressure, and coal density (Table 2). The Langmuir volume, Langmuir pressure, and critical desorption pressure can reflect the coal reservoir adsorption performance, while the cleat-volume compressibility, Poisson’s ratio, porosity, and density can reflect the physical properties of coal reservoirs. The parameters are independent of each other, and the joint collocation between the parameters has little effect on the experimental results; hence, the interaction between the parameters is ignored. Finally, an orthogonal test is designed according to the standard orthogonal array L9 (37). It is worth noting that the initial reservoir pressure is equal to the critical desorption pressure in Equation (13) to calculate the rebound pressure. However, when the properties of P r c are studied, the dynamic change of permeability in the single-phase water flow stage cannot be ignored; so, P i P c d and P i = 4 MPa in this test (Table 3).
The influence degree of geological parameters on the results can be intuitively analyzed (Table 4). The influence degree of geological parameters on the rebound pressure from large to small are critical desorption pressure, cleat-volume compressibility, porosity, and Langmuir volume. The influence degree of geological parameters on the ratio of rebound pressure to critical desorption pressure from large to small are cleat-volume compressibility, porosity, Langmuir volume, and critical desorption pressure. The influence degree of geological parameters on the recovery pressure from large to small are critical desorption pressure, density, cleat-volume compressibility, and Langmuir volume. In addition, cleat-volume compressibility, porosity, and Langmuir pressure are inversely proportional to rebound pressure and recovery pressure. In contrast, at large critical desorption pressures, Langmuir volume and coal density are conducive to the rebound and recovery permeability. The critical desorption pressure positively correlates with rebound pressure and recovery pressure but negatively correlates with the ratio of rebound pressure to critical desorption pressure.
The above experimental results can reasonably explain the problems faced in actual CBM production. (1) An increased cleat-volume compressibility indicates that a coal reservoir is more easily compacted, resulting in coal reservoirs being more susceptible to damage. (2) The larger the porosity, the greater the water content of the coal seam. Therefore, the reason for low gas production in high water-yield wells is closely related to the difficult recovery of permeability. (3) A high Langmuir volume indicates that the gas content in the coal seam is high, so large CMB desorption is beneficial to the easy recovery of permeability. (4) The higher the critical desorption pressure, the greater the rebound pressure and recovery pressure, but the smaller the ratio of rebound pressure to critical desorption pressure, indicating that there is a relatively large gap between the rebound pressure and critical desorption pressure for coal seams with high critical desorption pressure. Therefore, gas production should be controlled to prevent gas lock in the early stage of production. For coal seams with low critical desorption pressure, permeability will gradually increase after gas production.

3.3. Example Analysis in the Shizhuangnan Block

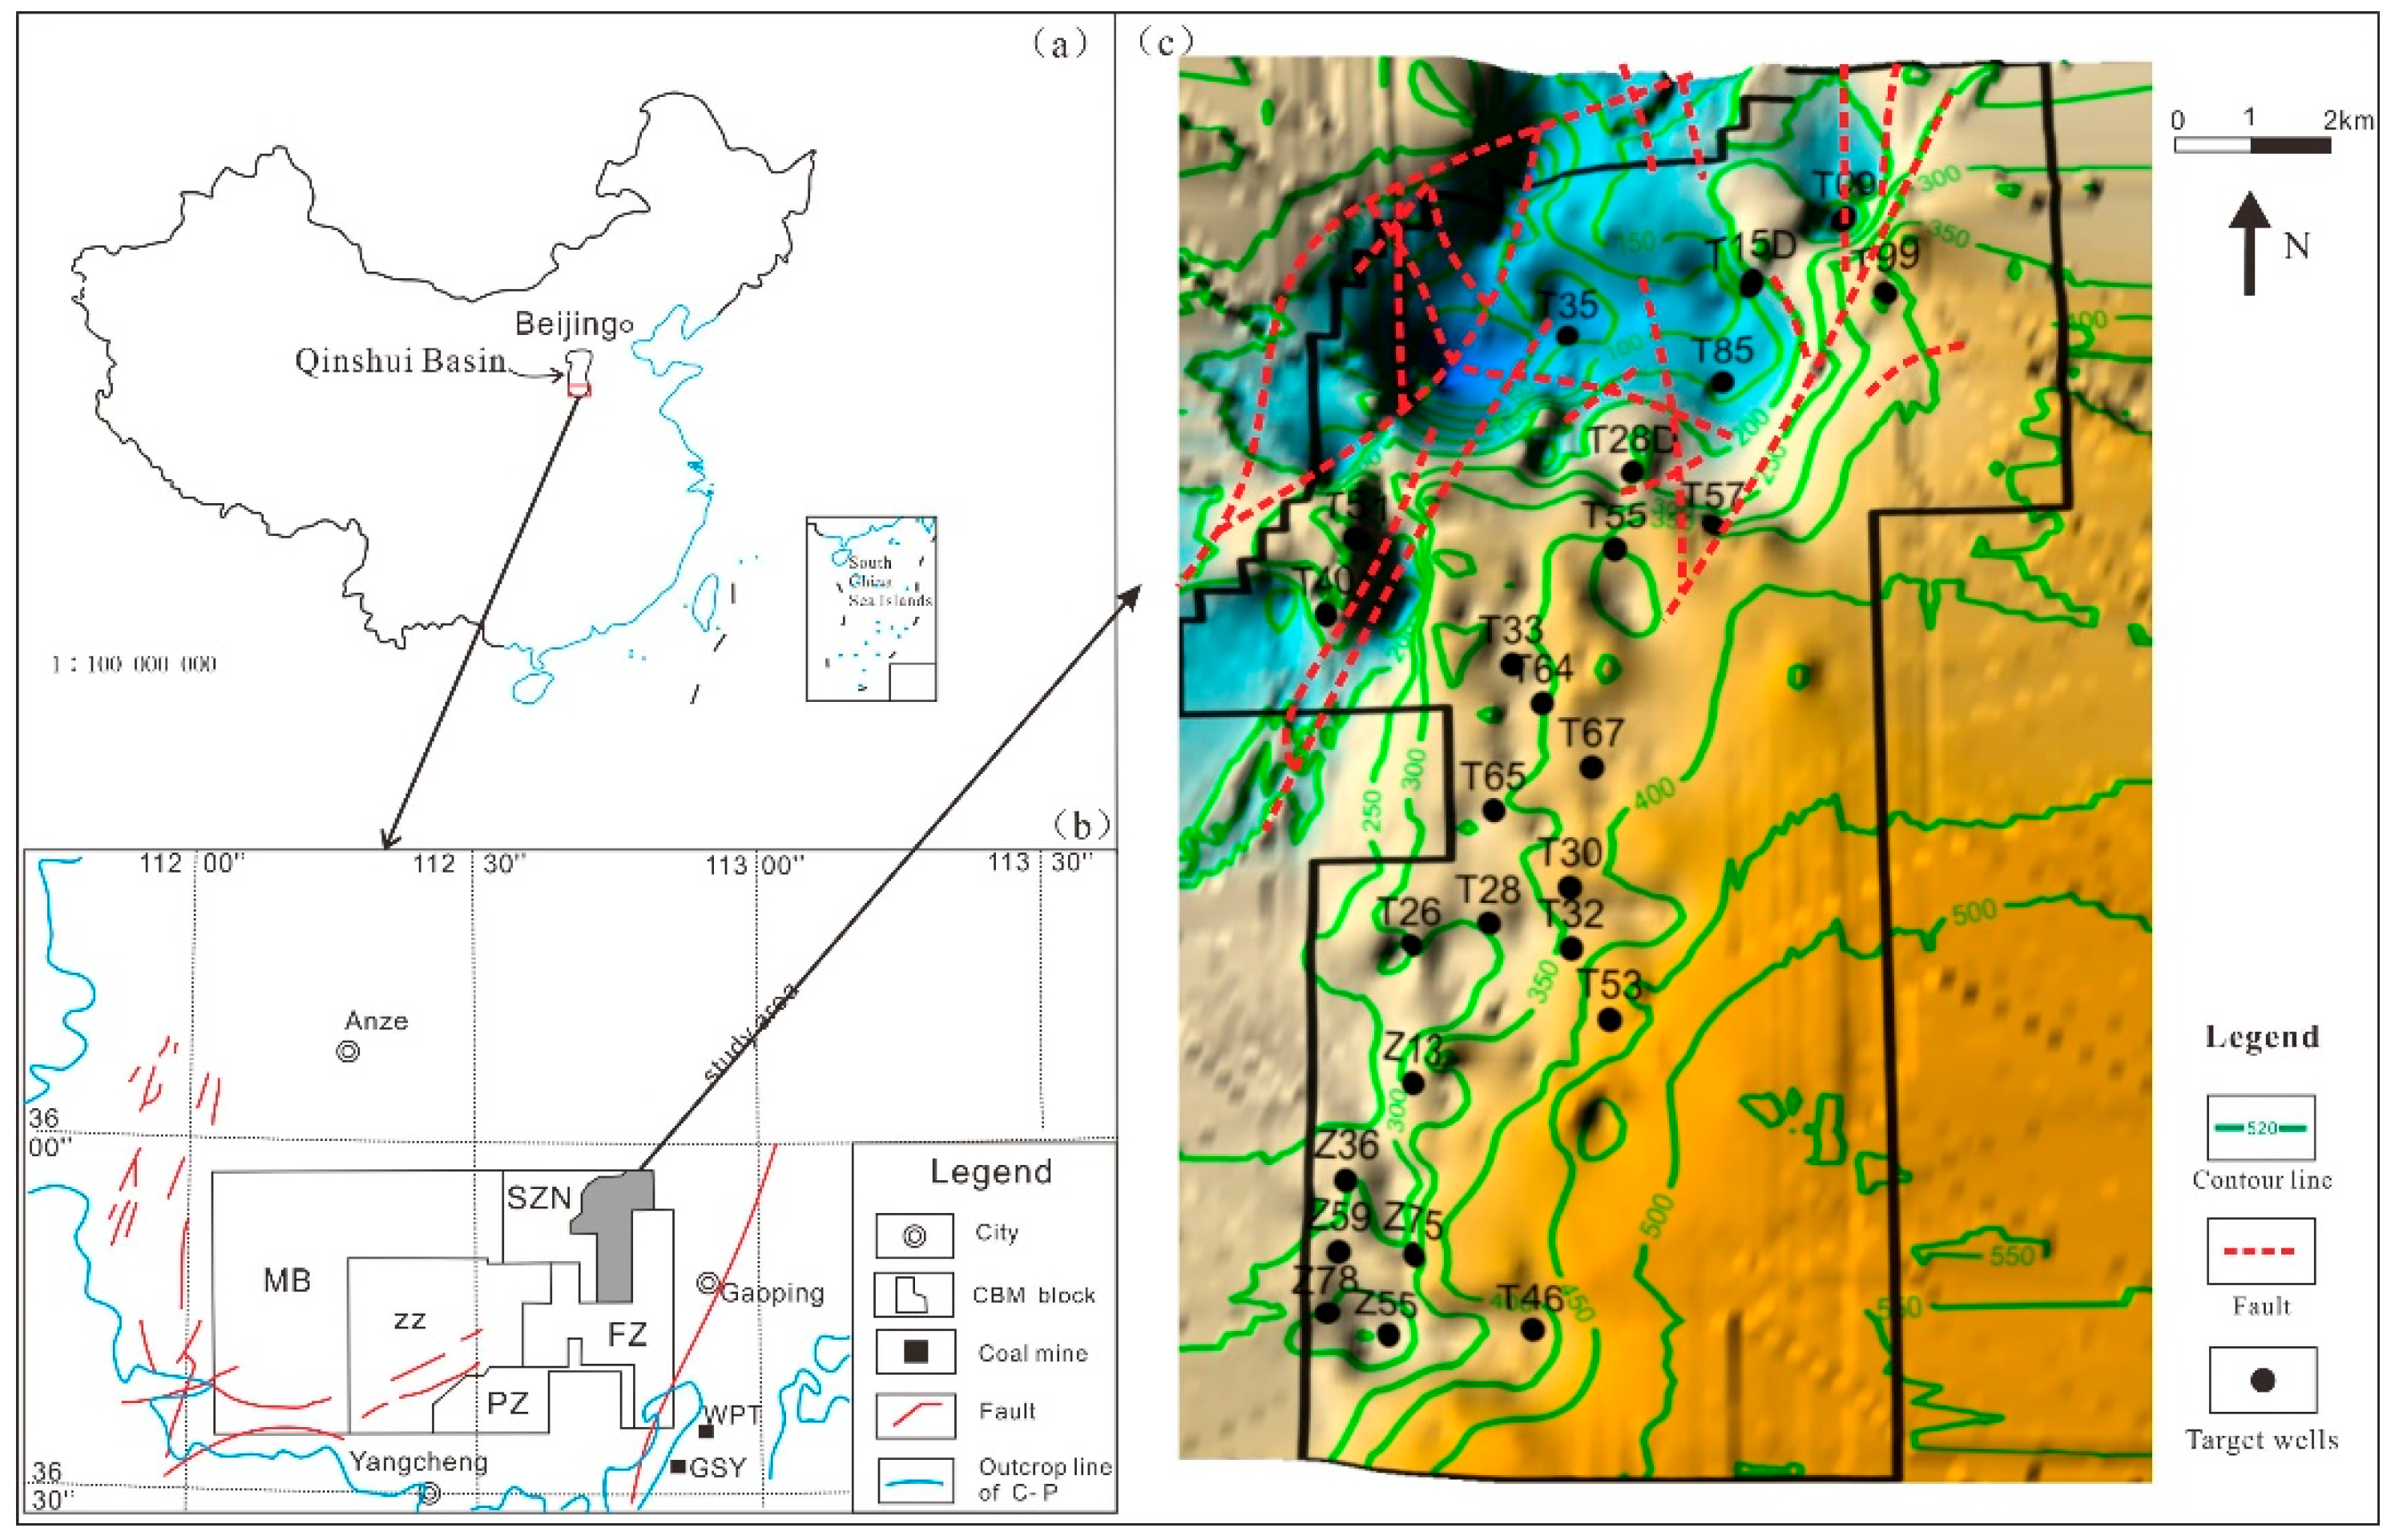
3.3.1. Regional Geology

The Shizhuangnan Block is located in the southern region of the Qinshui Basin, Shanxi Province (Figure 6a,b). At present, the minefield primarily produces CBM in the No.3 coal reservoir, which primarily consists of anthracite with a vitrinite reflectance (Romax) ranging from 2.92% to 3.02%. The No.3 coal seam has a simple structure, and it is generally deeper in the northern and the central regions, while it is shallower in the southern and the eastern regions, with depths ranging from 451 to 1030 m. There are more than 10 secondary high-angle normal faults in the northern study area near the Sitou Faults, which cut the coal strata and limit CBM production. The coal seam is stable, and the thickness ranges from 4.45 to 8.75 m, with an average of 6.35 m. Coal gas content ranges from 7 to 21 m3/t. The gas content in the west and north is greater than in the east and south [35,36]. There are 937 wells in the entire field, which are primarily distributed in the north, central, and southwest regions, and there are no production wells in the east and southeast regions. The CBM wells have been produced for more than four years and more than eight years in the central region. The distribution map of the maximum gas production of CBM wells is drawn using the production data from all wells. The western and central regions are the primary gas-producing areas, while most of the CBM wells in the north are low gas-yield wells (Figure 9a).

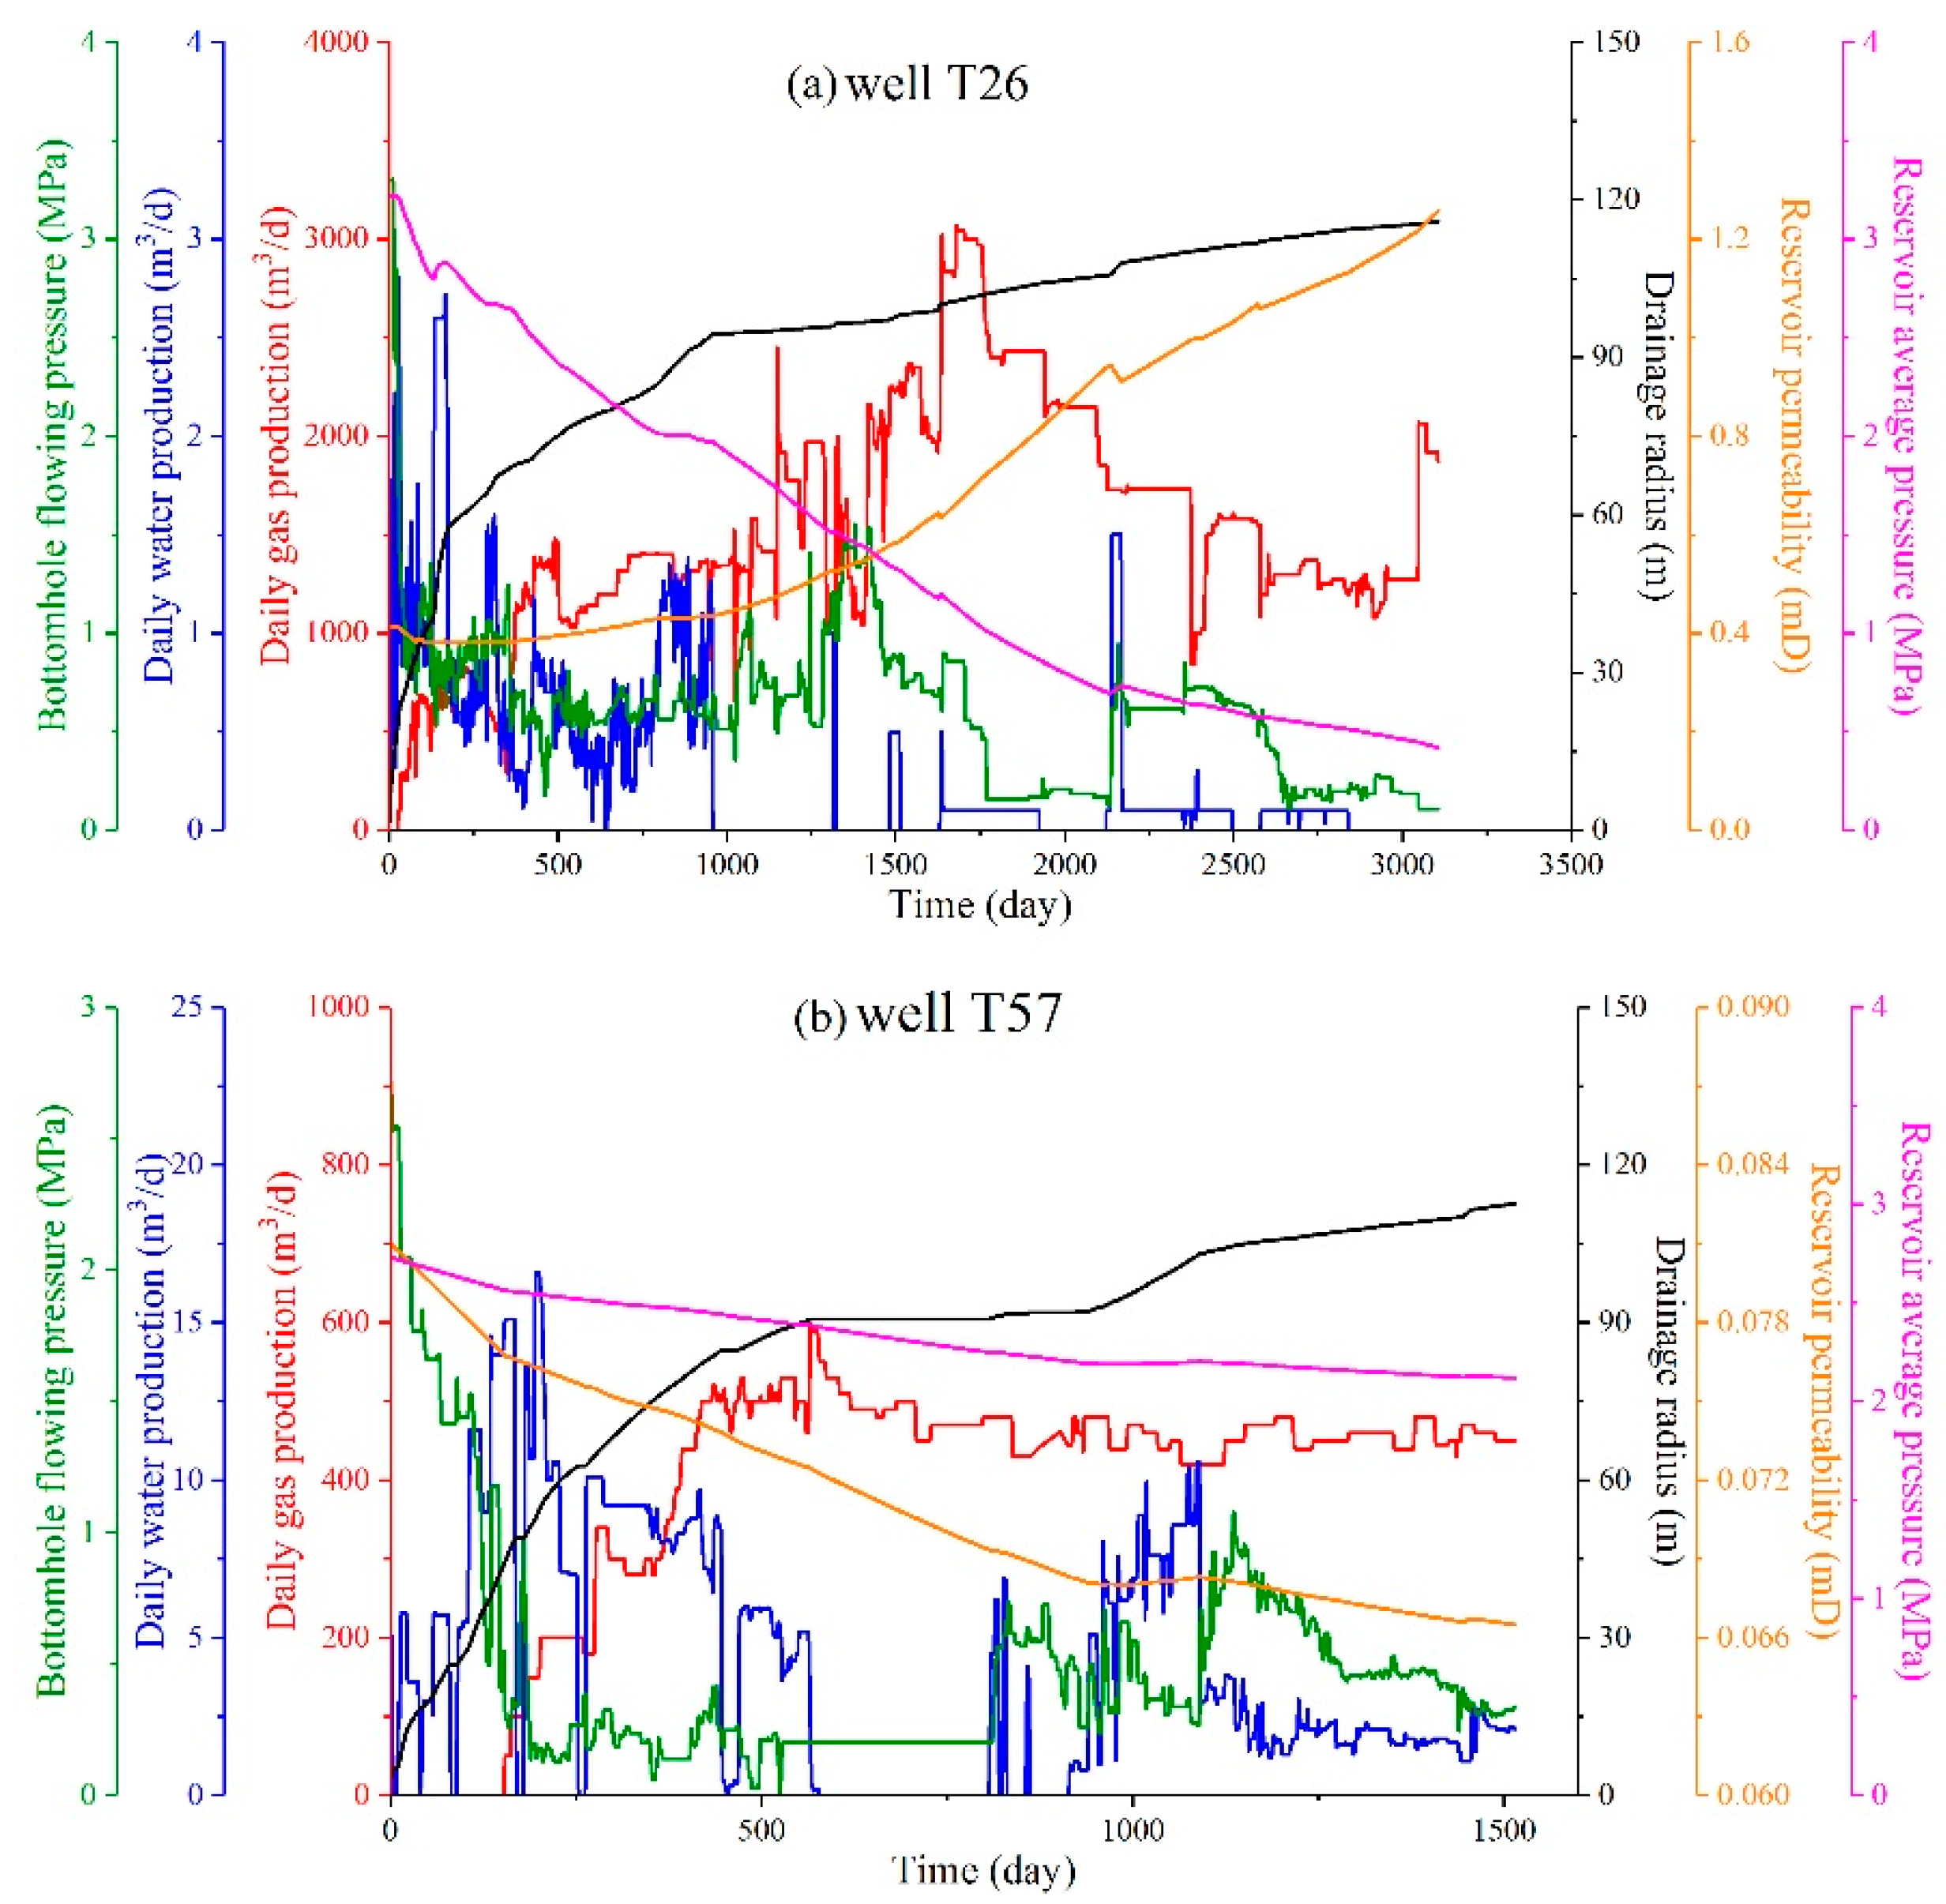
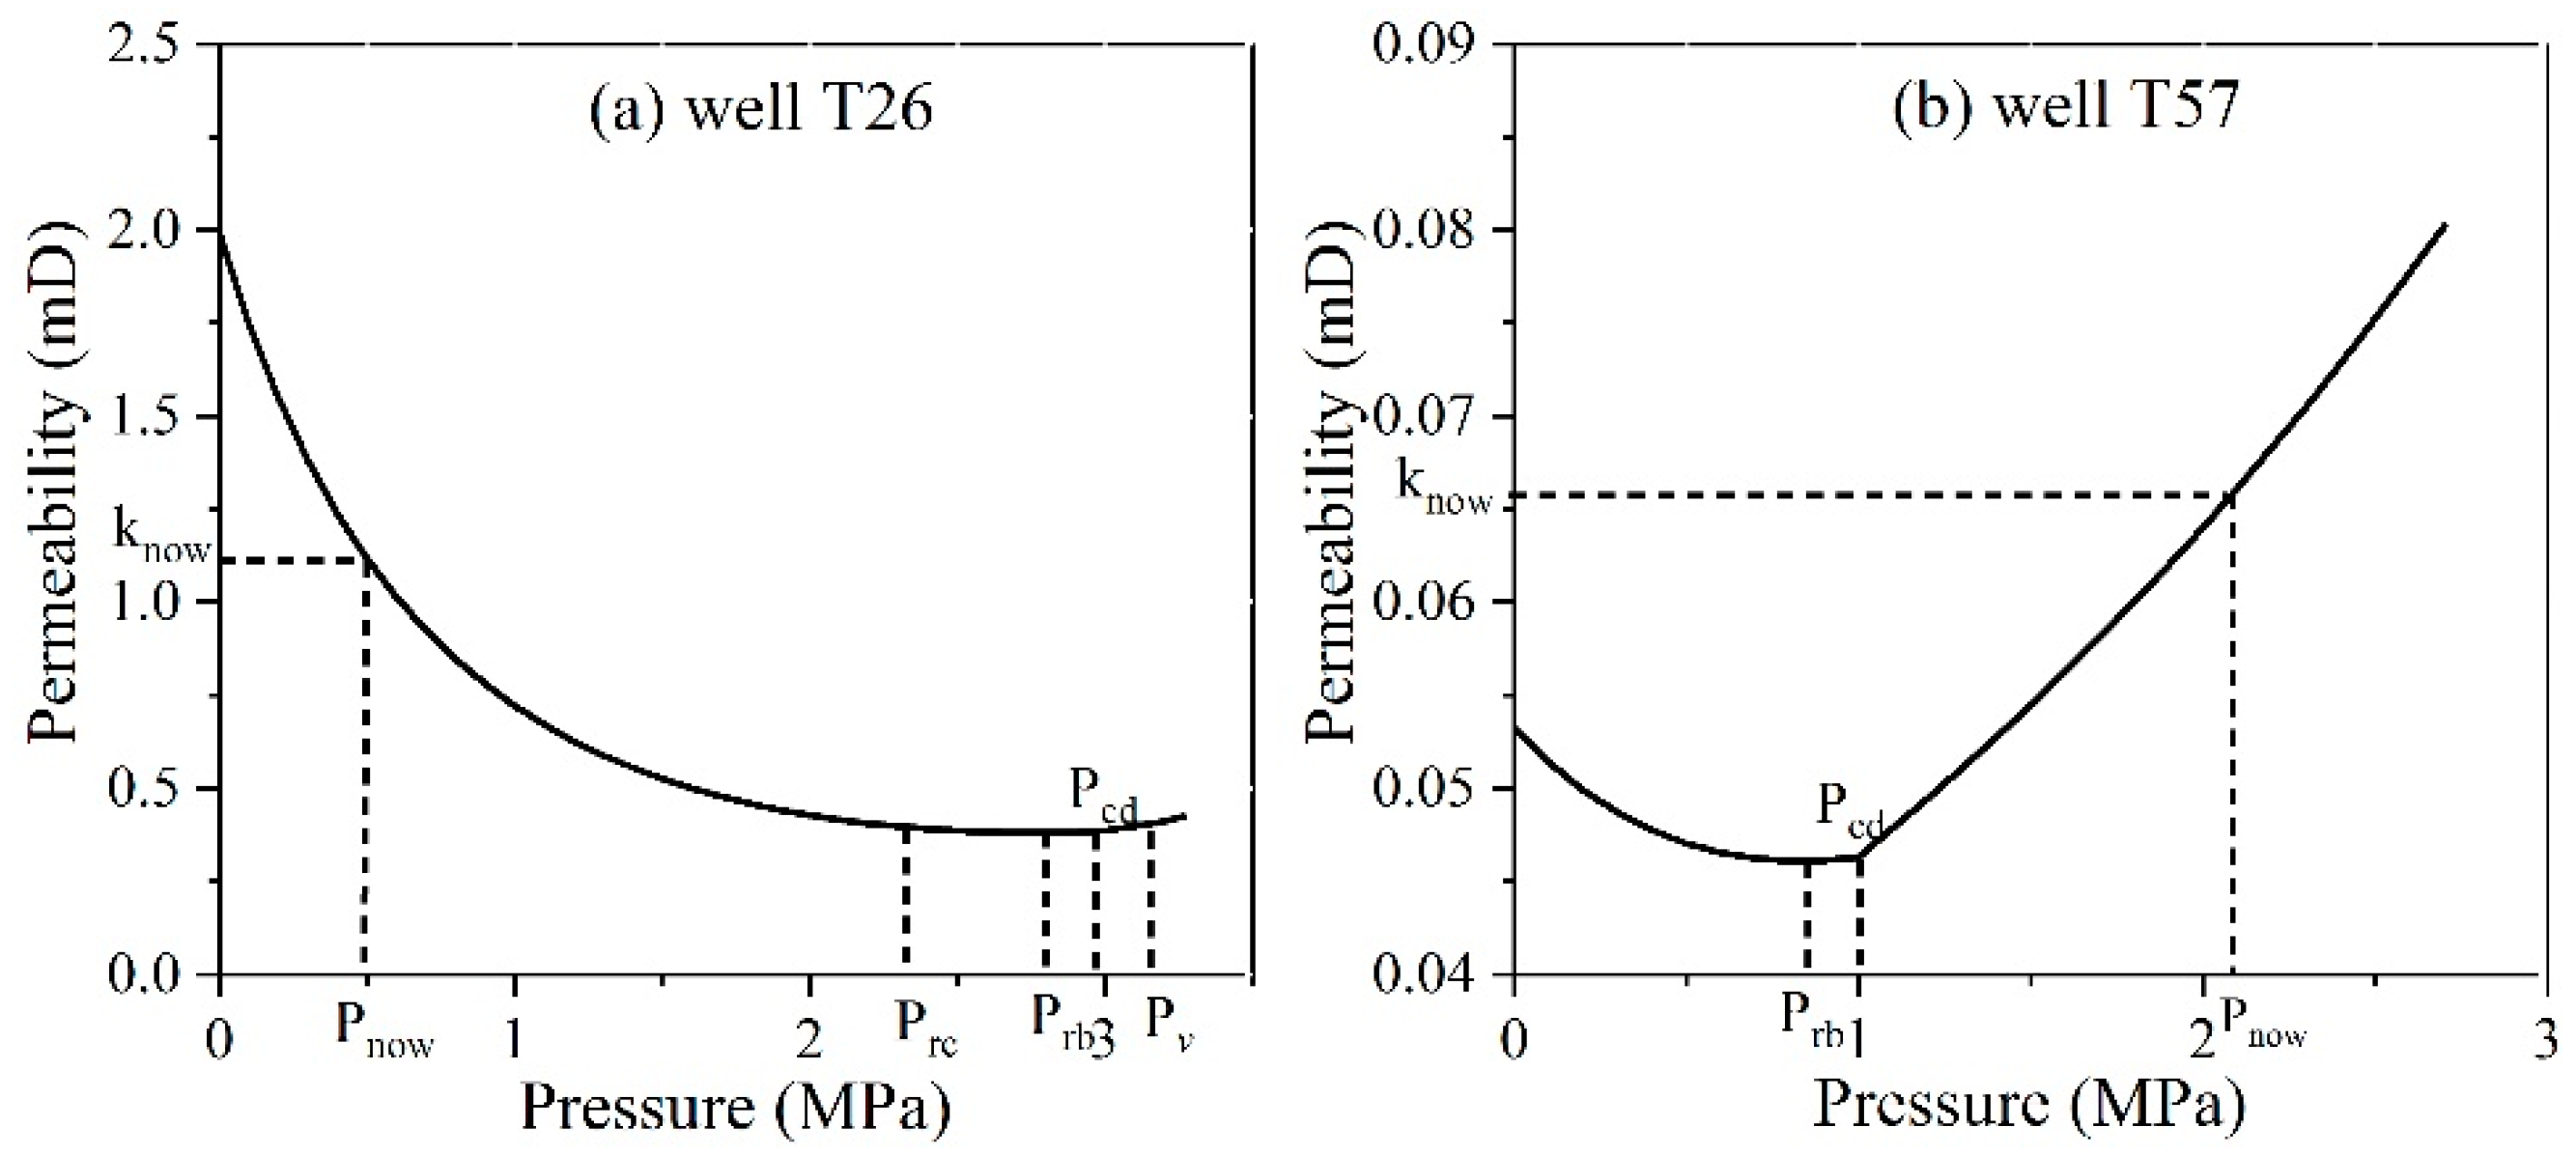
3.3.2. Characteristic Analysis of the Target Wells

The reservoir dynamic characterization of two CBM wells located in different areas was analyzed. Using basic experiment, logging data analysis, and simulation historical matching, the actual geologic parameters of each well are obtained. v is equal to 0.3 (experimental data), Sv is equal to 1295 m2/kg (cite from [12]), and ρ is equal to 1.4 g/cm3 (logging data) with small differences, while other geological parameters vary significantly (Table 5). Based on the above methods, six demarcating pressures for each well were calculated, and the recovery factor of CBM wells (Rc) was obtained by combining the numerical simulation and volumetric method. Additionally, a reservoir pressure prediction model based on the material balance equation (MBE) for coal reservoirs was used, which considers the self-regulating effects of coal reservoirs and the dynamic change of the equivalent drainage area, such that the actual reservoir average pressure and permeability can be calculated based on the reservoir conditions and actual production data [38].
The initial reservoir pressure of well Z26 is greater than the invulnerable pressure, while the rebound and recovery pressure is 2.7 MPa and 2.3 MPa, respectively (Table 5), indicating that permeability transitions from the alleviative stage and gradually increases in the later period. The reservoir at well Z26 is slightly damaged in the single-phase water flow stage and recoverable in the gas desorption stage. Although low initial permeability is not conductive to CBM production, the effective depressurization of a coal reservoir benefits from artificial fractures and reasonable drainage strategies (Figure 7a). Reservoir permeability can be increased to more than 1 mD by the matrix shrinkage effect (Figure 8a). This type of reservoir has excellent development potential, and artificial construction should receive more attention. The correlation between drainage strategies and reservoir physical properties in the early production cycle as well as the recovery factor and residual gas content in the late stage should also be thoroughly examined.
The reservoir at well T57 is invulnerable in the single-phase water flow stage and unrecoverable in the gas desorption stage. Additionally, due to the low reservoir permeability, the reservoir pressure cannot be effectively dropped (Figure 7b), so desorption of the coal reservoir is primarily concentrated in the fracturing area near the well. More importantly, reservoir permeability cannot increase significantly throughout the field life (Figure 8b), so this type of reservoir has little development potential.

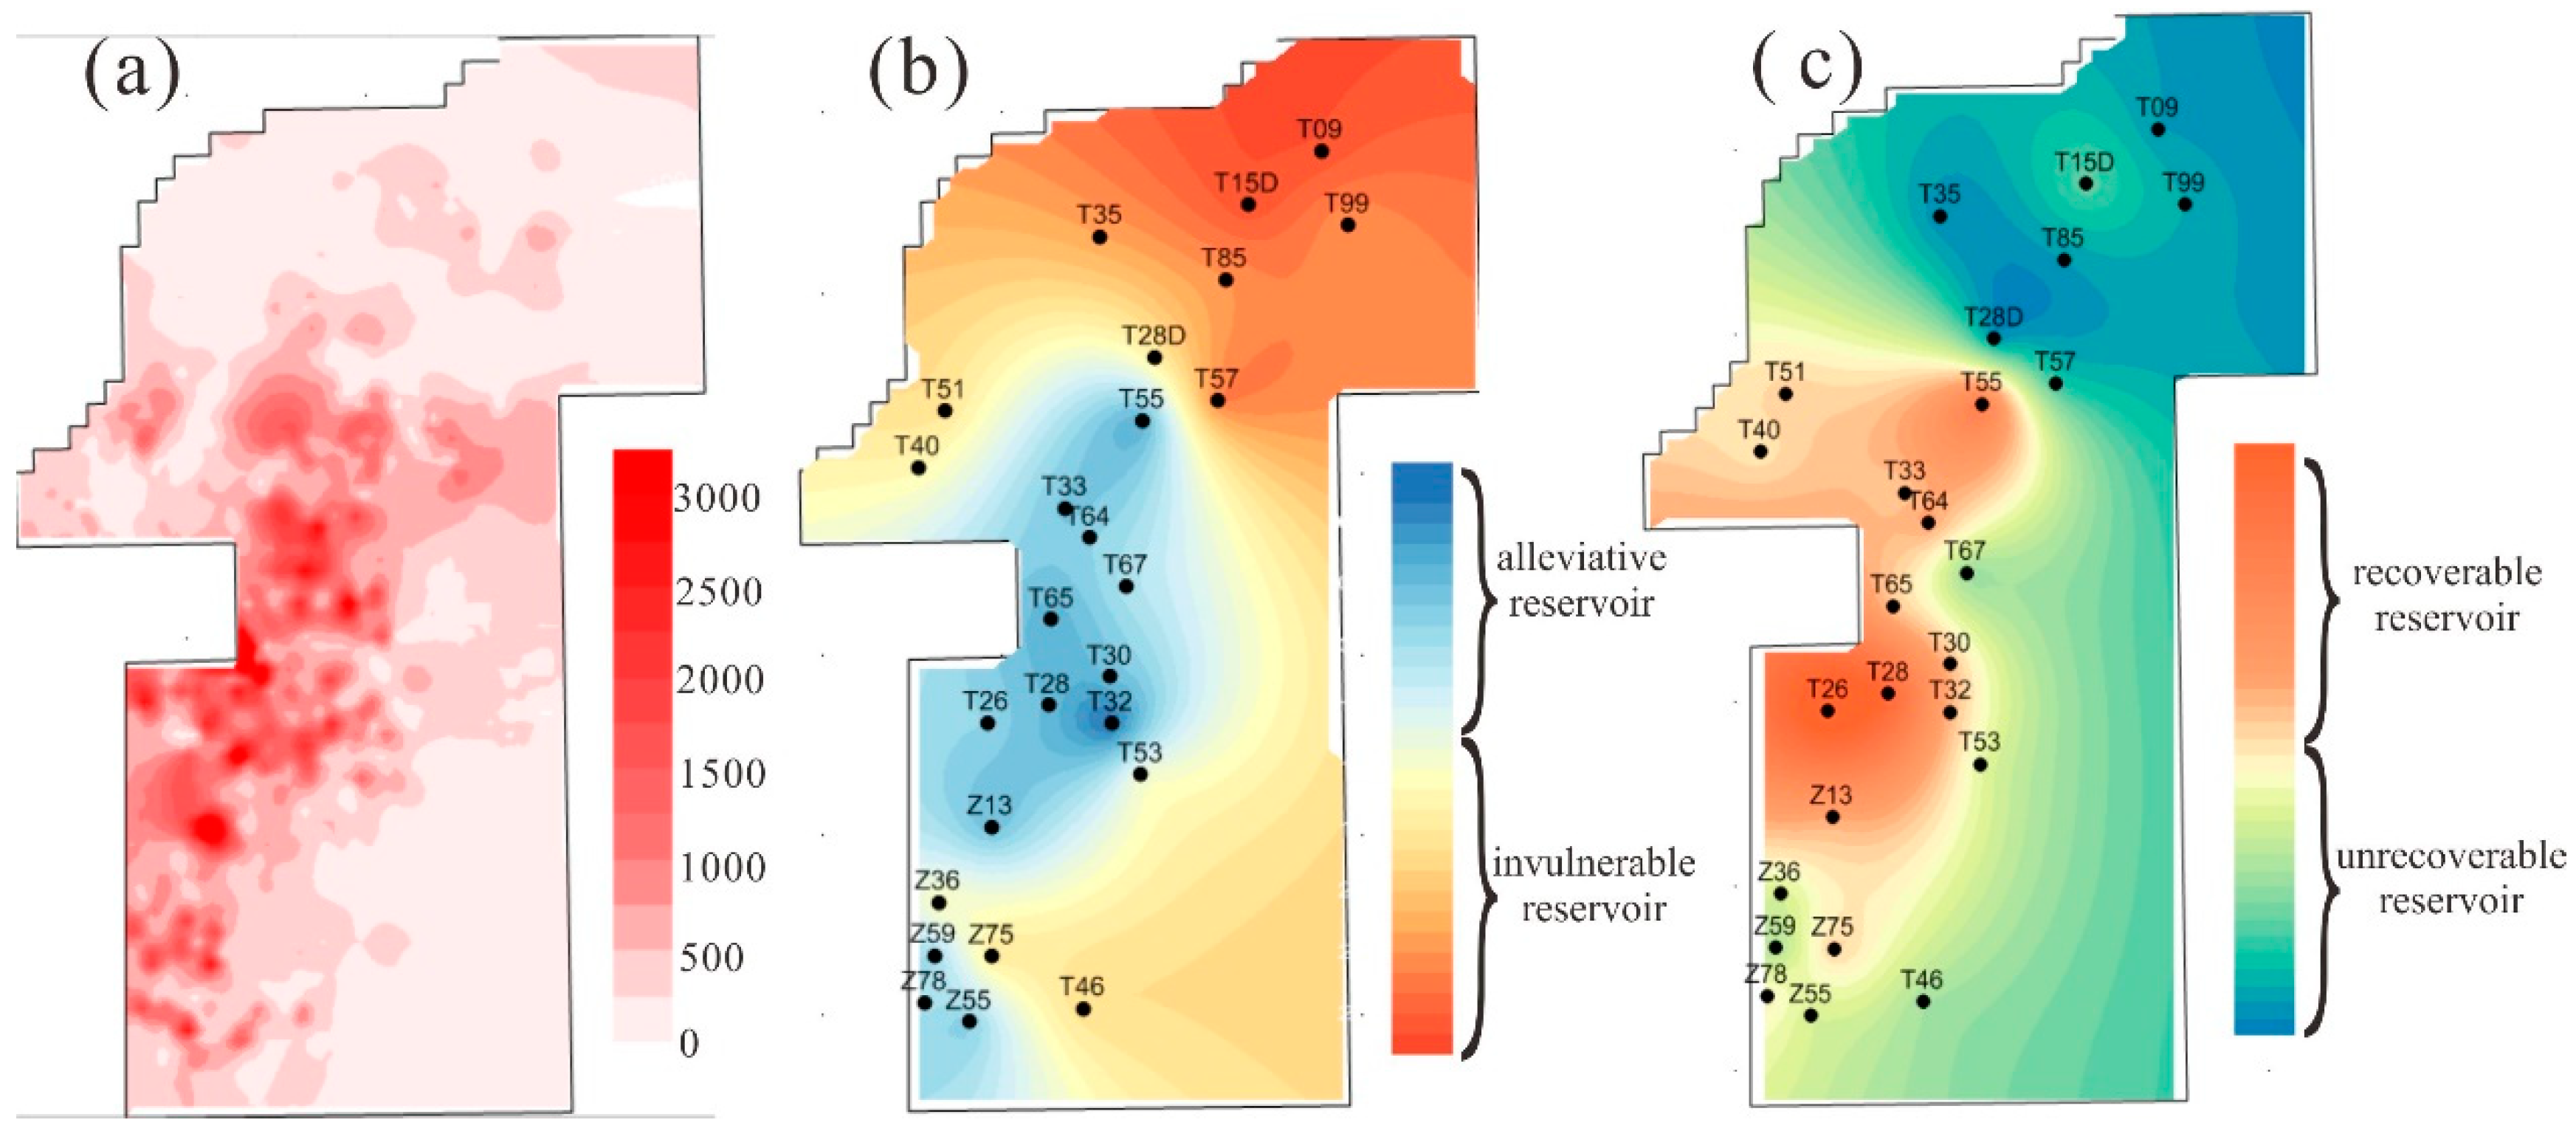
3.3.3. Coal Reservoir Classification

In order to study the types of coal reservoirs in the Shizhuangnan Block, 26 wells were selected to further analyze the dynamic change in coal reservoir permeability (Figure 6c). These wells are distributed throughout the region and include both high and low gas production wells. The specific parameters of these wells are shown in Table 6.
The coal reservoirs in this block were classified according to the methods described above (Figure 9). For the damaged nature of permeability, due to the influence of faults and the deep burial depth, the coal seam in the northern region is mostly tectonic coal with low permeability, which has led to an invulnerable permeability; hence, the coal reservoirs in the northern region is classified as invulnerable. In contrast, the coal reservoirs in the central and southwestern region are shallow and less affected by tectonism. The permeability of coal seam is relatively high and slightly damaged (Figure 9b). For the recovery nature of permeability, the dynamic permeability in the central region can restore to the initial permeability during pressure depletion due to its characterization of high gas content and low water content, so the reservoir is recoverable. However, because of the low gas content and high water content in the northern coal reservoirs, the permeability cannot be restored to its initial stage, so the reservoir is unrecoverable (Figure 9c).
Combining the reservoir type and the gas production characterization of CBM wells, it is concluded that although coal reservoir permeability in the central region decreases gradually during the development process, reservoir permeability can return to the initial level or even greater after the CBM desorption. Therefore, the CBM wells in the central region have high gas production and excellent development potential. On the contrary, reservoir permeability in the northern region is invulnerable, and it cannot increase after CBM desorption. In addition, the reservoir is controlled by low initial permeability and natural faults, so the gas production is low (Figure 9a).
A high-rank coal reservoir in the Shizhuangnan Block is employed as an example to analyze in detail. However, this model is universally applicable, regardless of the conditions of any coal rank. The key is to obtain the accurate geological parameters of coal reservoirs as shown in the paper, and researchers can use this model to analyze the types of coal reservoirs in different blocks with complete geological parameters.

4. Conclusions

The permeability dynamic characterization of coal reservoirs in the single-phase flow stage and the gas desorption stage are comprehensively analyzed, and coal reservoir geologic conditions in the Shizhuangnan Block are examined.
(1)
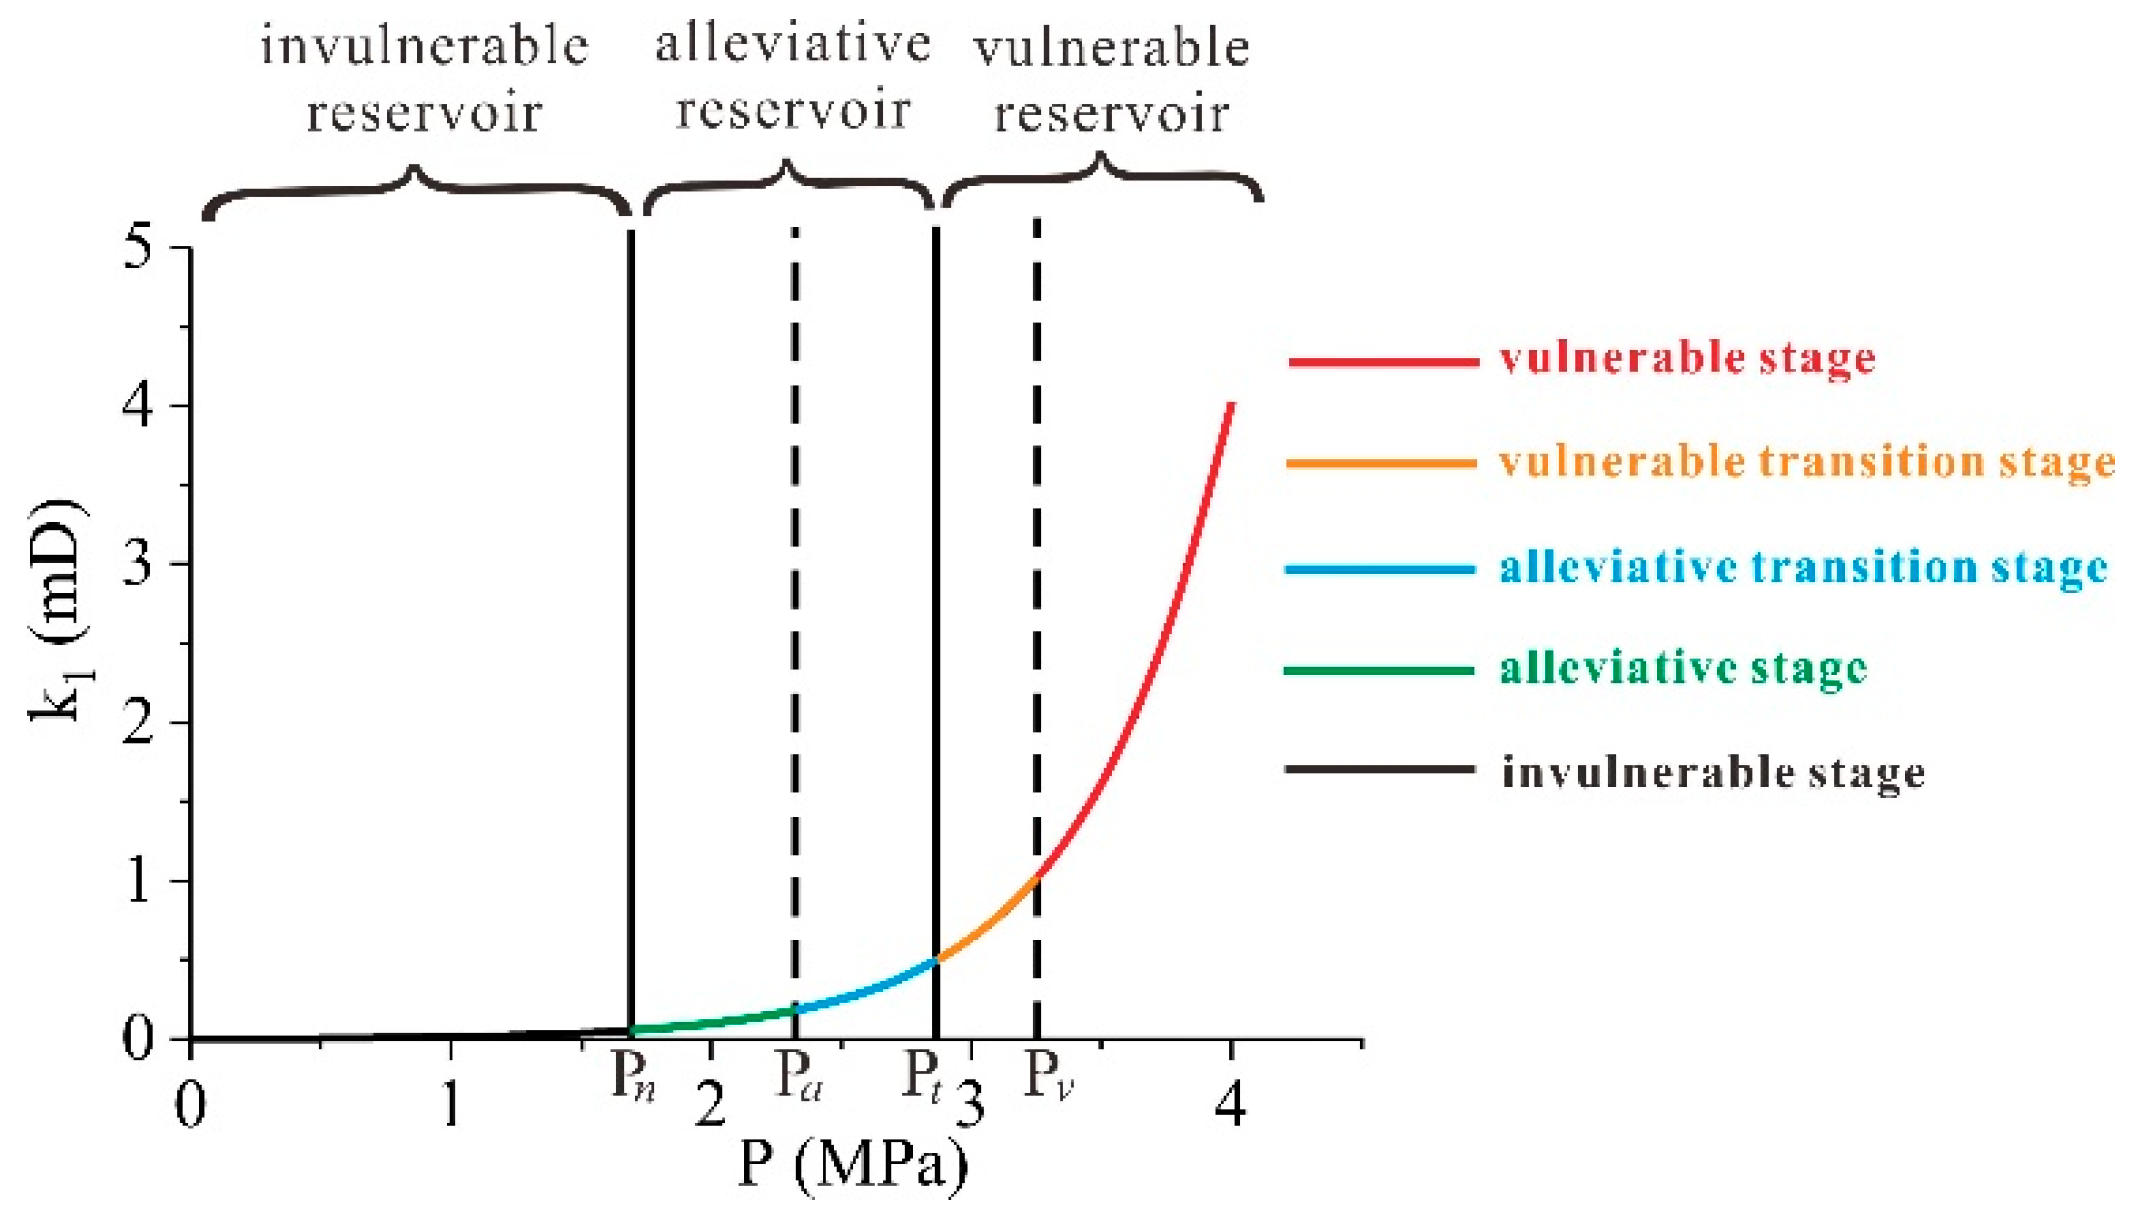
The damage of effective stress on reservoir permeability in the single-water flow stage is analyzed. The coal permeability damage rate can be divided into the vulnerable stage, vulnerable transition stage, alleviative transition stage, alleviative stage, and invulnerable stage based on the law of decreasing permeability. Vulnerable pressure, turning pressure, alleviate pressure, and invulnerable pressure are defined as the demarcating pressures. The permeability damage rate of these demarcating pressures is constant, and their permeability is only related to the reservoir physical properties, but not to initial reservoir permeability.
(2)
The influence of geologic factors on the rebound pressure and recovery pressure is quantitatively analyzed. The critical desorption pressure has the greatest influence on rebound pressure, followed by cleat-volume compressibility, porosity, and Langmuir volume. The influence order of recovery pressure with the geological parameters is as follows: the critical desorption pressure, density, formation compressibility, and Langmuir volume. Cleat-volume compressibility, porosity, and Langmuir pressure are inversely proportional to rebound pressure and recovery pressure. At large critical desorption pressure, Langmuir volume and coal density are conducive to permeability rebound and recovery. The higher the critical desorption pressure, the smaller the ratio of rebound pressure to critical desorption pressure, indicating that gas lock should be prevented in coal reservoirs with high gas content.
(3)
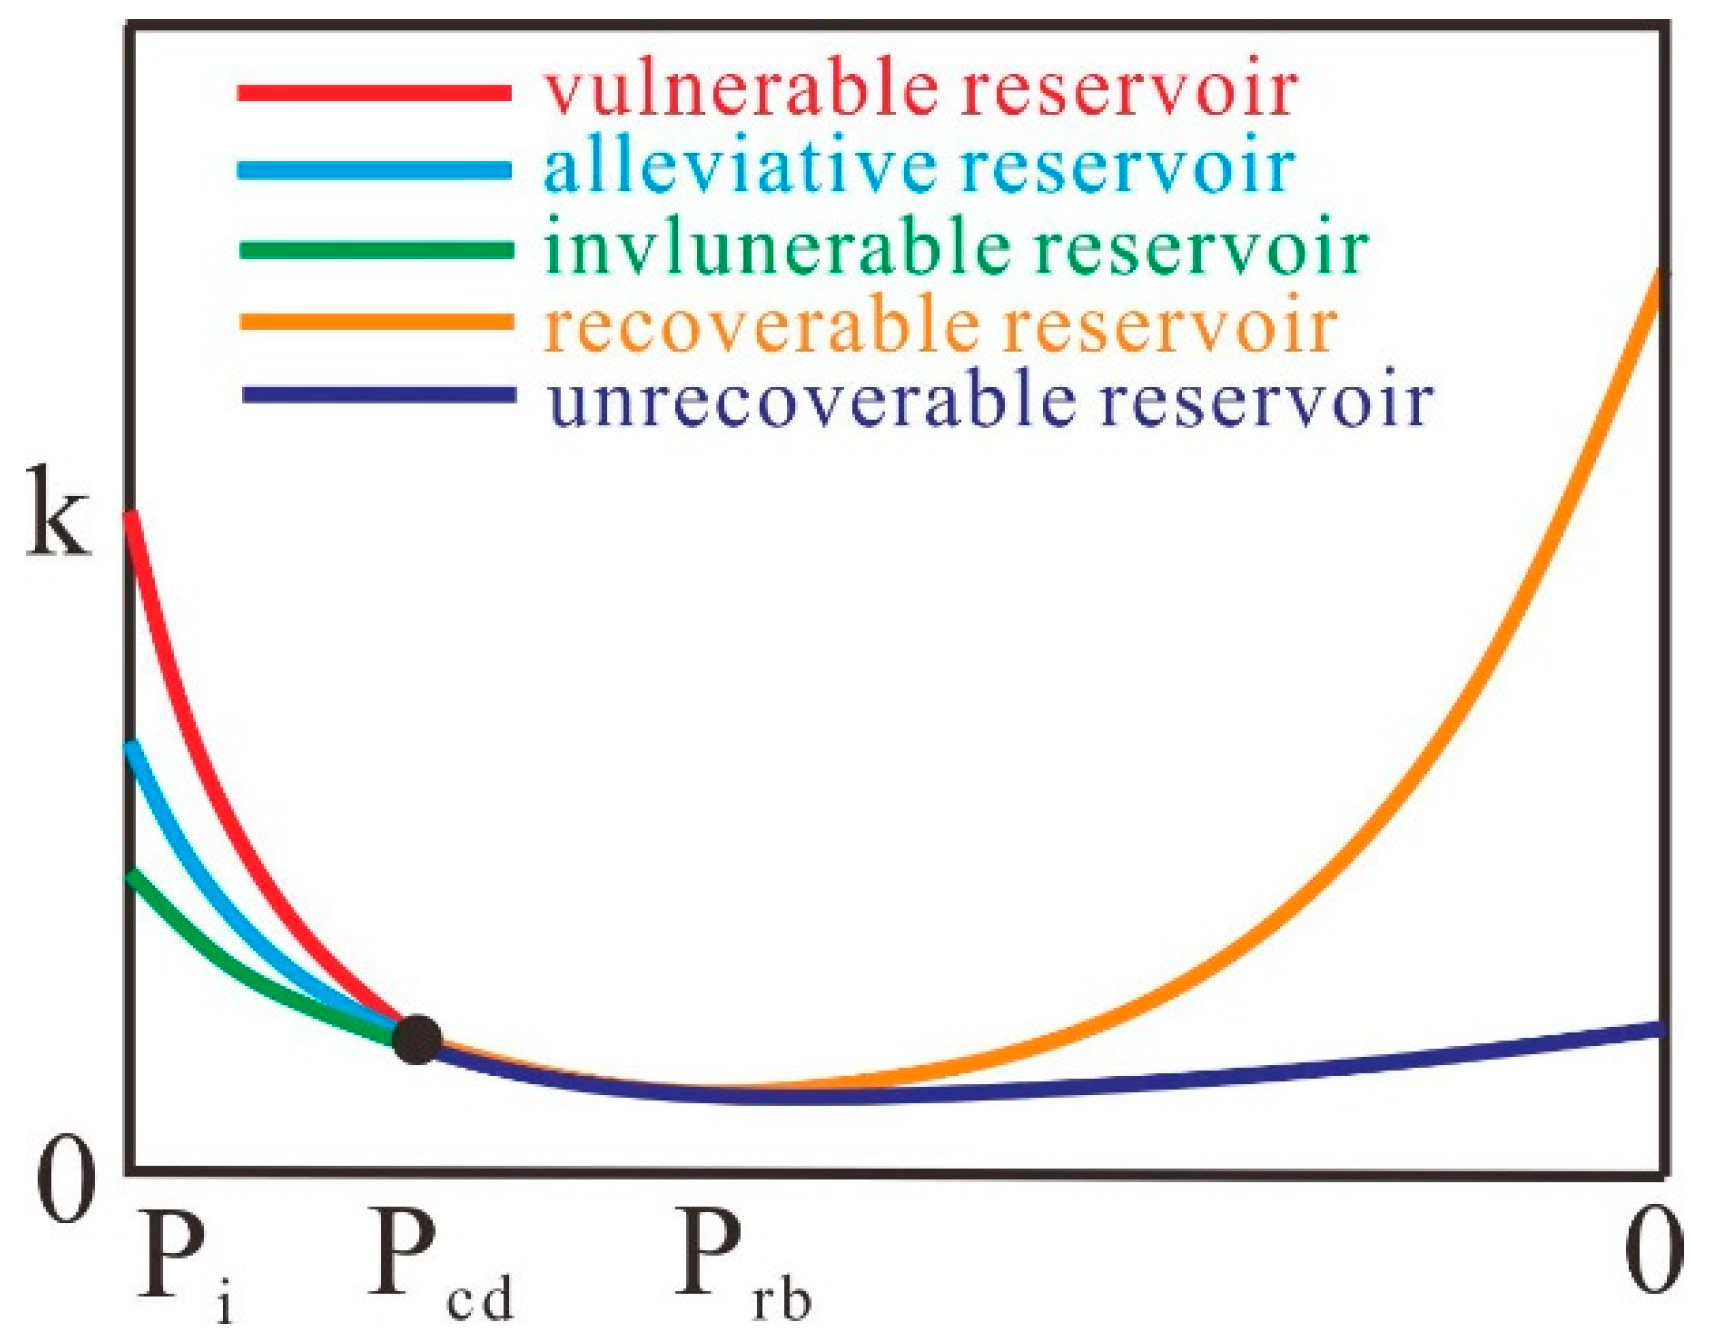
Coal reservoirs are classified according to the coal reservoir dynamic characteristics. When the initial reservoir pressure is greater than the critical desorption pressure, coal reservoirs can be classified as vulnerable, alleviative, or invulnerable based on the effect of effective stress. When the reservoir pressure is less than the critical desorption pressure, coal reservoirs can be classified as recoverable and unrecoverable reservoirs on the permeability recovery properties. In addition, this study on the types of coal reservoirs in the Shizhuangnan Block found that there is a significant correspondence between the types of coal reservoirs and CBM well gas production.

Author Contributions

Conceptualization, X.Y.; methodology, X.Y.; validation, S.Z., S.T.; formal analysis, X.Y.; investigation, Y.Y., Q.Z.; resources, Z.L., Q.H., Y.L.; data curation, X.Y., Q.H.; writing—original draft preparation, X.Y.; writing—review and editing, X.Y., S.Z.; supervision, S.T.; project administration, S.T., Z.L.; funding acquisition, S.T. All authors have read and agreed to the published version of the manuscript.

Funding

This research was funded by the National Natural Science Foundation of China, grant number 41772159, 41872178 and U1910205; and the National Major Science and Technology Project of China, grant number 2017ZX05064003.

Acknowledgments

We would like to thank China United Coalbed Methane Corporation for providing the production well date.

Conflicts of Interest

The authors declare no conflict of interest.

References

  1. Durucan, S.; Edwards, J.S. The effects of stress and fracturing on permeability of coal. Min. Sci. Technol. 1986, 3, 205–216. [Google Scholar] [CrossRef]
  2. Tao, S.; Tang, D.Z.; Xu, H.; Gao, L.J.; Fang, Y. Factors controlling high-yield coalbed methane vertical wells in the Fanzhuang Block, Southern Qinshui Basin. Int. J. Coal. Geol. 2014, 134–135, 38–45. [Google Scholar] [CrossRef]
  3. Harpalani, S.; Chen, G.L. Influence of gas production induced volumetric strain on permeability of coal. Geotech. Geolog. Eng. 1997, 15, 303–325. [Google Scholar] [CrossRef]
  4. Wang, X. Effect of variation in coal permeability with pressure drop on coalbed methane production. In 2004 International Coalbed Methane Symposium Proceedings; Univ. Alabama: Tuscaloosa, AL, USA, 2004; No. 0401. [Google Scholar]
  5. Cui, X.J.; Bustin, R.M. Volumetric strain associated with methane desorption and its impact on coalbed gas production from deep coal seams. AAPG Bull. 2005, 89, 1181–1202. [Google Scholar] [CrossRef]
  6. Li, J.Q.; Liu, D.M.; Yao, Y.B.; Cai, Y.D.; Chen, Y. Evaluation and modeling of gas permeability changes in anthracite coals. Fuel 2013, 111, 606–612. [Google Scholar] [CrossRef]
  7. Somerton, W.H.; Söylemezoḡlu, I.M.; Dudley, R.C. Effect of stress on permeability of coal. Int. J. Rock Mech. Min. 1975, 12, 129–145. [Google Scholar] [CrossRef]
  8. Zheng, G.Q.; Pan, Z.J.; Chen, Z.W.; Tang, S.H.; Connell, L.D.; Zhang, S.H.; Wang, B. Laboratory study of gas permeability and cleat compressibility for CBM/ECBM in Chinese coals. Energy Explor. Exploit. 2012, 30, 451–476. [Google Scholar] [CrossRef] [Green Version]
  9. Fan, L.; Liu, S.M. Numerical prediction of in situ horizontal stress evolution in coalbed methane reservoirs by considering both poroelastic and sorption induced strain effects. Int. J. Rock Mech. Min. 2018, 104, 156–164. [Google Scholar] [CrossRef]
  10. Robertson, E.; Christiansen, R. Measurement of Sorption-Induced Strain. Soc. Pet. Eng. 2005, 17–19. [Google Scholar] [CrossRef] [Green Version]
  11. Karacan, C. Swelling-induced volumetric strains internal to a stressed coal associated with CO2 sorption. Int. J. Coal Geol. 2007, 72, 209–220. [Google Scholar] [CrossRef]
  12. Chen, Y.X.; Liu, D.M.; Yao, Y.B.; Cai, Y.D.; Chen, L.W. Dynamic permeability change during coalbed methane production and its controlling factors. J. Nat. Gas. Sci. Eng. 2015, 25, 335–346. [Google Scholar] [CrossRef]
  13. Meng, Y.; Wang, J.Y.; Li, Z.P.; Zhang, J.X. An improved productivity model in coal reservoir and its application during coalbed methane production. J. Nat. Gas. Sci. Eng. 2018, 49, 342–351. [Google Scholar] [CrossRef]
  14. Seidle, J.; Huitt, L. Experimental Measurement of Coal Matrix Shrinkage Due to Gas Desorption and Implications for Cleat Permeability Increases. In Proceedings of the International Meeting on Petroleum Engineering, Beijing, China, 14–17 November 1995; pp. 575–582. [Google Scholar]
  15. Zhao, J.L.; Tang, D.Z.; Lin, W.J.; Xu, H.; Li, Y.; Tao, S.; Lv, Y.M. Permeability dynamic variation under the action of stress in the medium and high rank coal reservoir. J. Nat. Gas. Sci. Eng. 2015, 26, 1030–1041. [Google Scholar] [CrossRef]
  16. Schwerer., F.; Pavone, A. Effect of pressure-dependent permeability on well-test analyses and long-term production of methane from coal seams. In Proceedings of the SPE Unconventional Gas Recovery Symposium, Pittsburgh, PA, USA, 13–15 May 1984. [Google Scholar]
  17. Pan, Z.J.; Connell, L.D. A theoretical model for gas adsorption-induced coal swelling. Int. J. Coal. Geol. 2007, 69, 243–252. [Google Scholar] [CrossRef]
  18. Gray, I. Reservoir Engineering in Coal Seams Part 1-The Physical Process of Gas Storage and Movement in Coal Seams. SPE Reserv. Eval. Eng. 1987, 2, 28–34. [Google Scholar] [CrossRef]
  19. Shi, J.Q.; Pan, Z.J.; Durucan, S. Analytical models for coal permeability changes during coalbed methane recovery: Model comparison and performance evaluation. Int. J. Coal. Geol. 2014, 136, 17–24. [Google Scholar] [CrossRef]
  20. Palmer, I.; Mansoori, J. How permeability depends on stress and pore pressure in coalbeds, a new model. SPE Reserv. Eval. Eng. 1998, 1, 539–544. [Google Scholar] [CrossRef]
  21. Shi, J.Q.; Durucan, S. Drawdown Induced Changes in Permeability of Coalbeds: A New Interpretation of the Reservoir Response to Primary Recovery. Transport. Porous. Med. 2004, 56, 1–16. [Google Scholar] [CrossRef]
  22. Shi, J.Q.; Durucan, S. A model for changes in coalbed permeability during primary and enhanced methane recovery. SPE Reserv. Eval. Eng. 2005, 8, 291–299. [Google Scholar] [CrossRef]
  23. Pan, Z.J.; Connell, L.D. Modelling of anisotropic coal swelling and its impact on permeability behaviour for primary and enhanced coalbed methane recovery. Int. J. Coal. Geol. 2011, 85, 257–267. [Google Scholar] [CrossRef]
  24. Pan, Z.J.; Connell, L.D. Modelling permeability for coal reservoirs: A review of analytical models and testing data. Int. J. Coal. Geol. 2012, 92, 1–44. [Google Scholar] [CrossRef]
  25. Connell, L.D. Coupled flow and geomechanical processes during gas production from coal seams. Int. J. Coal. Geol. 2009, 79, 18–28. [Google Scholar] [CrossRef]
  26. Connell, L.D.; Detournay, C. Coupled flow and geomechanical processes during enhanced coal seam methane recovery through CO2 sequestration. Int. J. Coal. Geol. 2009, 77, 222–233. [Google Scholar] [CrossRef]
  27. Gu, F.G.; Chalaturnyk, R. Permeability and porosity models considering anisotropy and discontinuity of coalbeds and application in coupled simulation. J. Petrol. Sci. Eng. 2010, 74, 113–131. [Google Scholar] [CrossRef]
  28. Wei, Z.J.; Zhang, D.X. Coupled fluid-flow and geomechanics for triple-porosity/dual-permeability modeling of coalbed methane recovery. Int. J. Rock Mech. Min. 2010, 47, 1242–1253. [Google Scholar] [CrossRef]
  29. Clarkson, C.; Bustin, R. Variation in permeability with lithotype and maceral composition of Cretaceous coals of the Canadian Cordillera. Int. J. Coal. Geol. 1997, 33, 135–151. [Google Scholar] [CrossRef]
  30. Harpalani, S. Compressibility of coal and its impact on gas production from coalbed reservoirs. Rock Mech. Industry 1999, 1–2, 301–308. [Google Scholar]
  31. Peng, Y.; Liu, J.S.; Pan, Z.J.; Connell, L.D.; Chen, Z.W.; Qu, H.Y. Impact of coal matrix strains on the evolution of permeability. Fuel 2017, 189, 270–283. [Google Scholar] [CrossRef]
  32. Yao, Y.B.; Liu, D.M.; Tang, D.Z.; Huang, W.H.; Tang, S.H.; Che, Y. A Comprehensive Model for Evaluating Coalbed Methane, Reservoirs in China. ACTA Geol. Sin. Eng. 2008, 82, 1253–1270. [Google Scholar]
  33. Cai, Y.D.; Liu, D.M.; Yao, Y.B.; Li, J.Q.; Qiu, Y.K. Geological controls on prediction of coalbed methane of No. 3 coal seam in Southern Qinshui Basin, North China. Int. J. Coal. Geol. 2011, 88, 101–112. [Google Scholar] [CrossRef]
  34. Meng, Y.J.; Tang, D.Z.; Xu, H.; Li, C.; Li, L.; Meng, S.Z. Geological controls and coalbed methane production potential evaluation: A case study in Liulin area, eastern Ordos Basin, China. J. Nat. Gas. Sci. Eng. 2014, 21, 95–111. [Google Scholar] [CrossRef]
  35. Yang, G.Q.; Tang, S.H.; Zhang, S.H.; Hu, W.H.; Xi, Z.D.; Li, L.; Li, Y.P.; Li, J.; Wang, M.X.; Gong, M.H. Impacts of vertical variation of different coal texture types on coalbed methane production in Zaoyuan area of the Shizhuangnan Block, Southern Qinshui Basin, North China. Energ. Source Part A 2017, 39, 1617–1624. [Google Scholar] [CrossRef]
  36. Zhang, S.H.; Tang, S.H.; Li, Z.C.; Guo, Q.L.; Pan, Z.J. Stable isotope characteristics of CBM co-produced water and implications for CBM development: The example of the Shizhuangnan block in the southern Qinshui Basin, China. J. Nat. Gas. Sci. Eng. 2015, 27, 1400–1411. [Google Scholar] [CrossRef]
  37. Zhang, J.Y.; Liu, D.M.; Cai, Y.D.; Pan, Z.J.; Yao, Y.B.; Wang, Y.J. Geological and hydrological controls on the accumulation of coalbed methane within the No. 3 coal seam of the southern Qinshui Basin. Int. J. Coal. Geol. 2017, 182, 94–111. [Google Scholar] [CrossRef]
  38. Yan, X.L.; Zhang, S.H.; Tang, S.H.; Li, Z.C.; Wang, K.F.; Hu, Q.P. The Prediction Model of Coal Reservoir Pressure and its Implication for the Law of Coal Reservoir Depressurization. ACTA Geol. Sin Eng. 2019, 93, 692–703. [Google Scholar] [CrossRef]
  39. Seidle, J.; Jeansonne, M.; Erickson, D. Application of Matchstick Geometry to Stress Dependent Permeability in Coals. In Proceedings of the SPE Rocky Mountain Regional Meeting, Casper, Wyoming, 18–21 May 1992; pp. 433–444. [Google Scholar]
  40. Su, X.B.; Fang, W.D. Permeability of coal-bed methane reservoir and its grade and classification. J. Jiaozuo Inst. Technol. 1998, 17, 94–99, (In Chinese with English abstract). [Google Scholar]
  41. Meng, Y.J.; Tang, D.Z.; Xu, H.; Qiu, Y.J.; Li, Y.; Zhang, W.Z. Division of coalbed methane desorption stages and its significance. Petrol. Explor. Dev. 2014, 41, 671–677. [Google Scholar] [CrossRef]
  42. Lai, F.P.; Li, Z.P.; Fu, Y.K.; Yang, Z.H. A drainage data-based calculation method for coalbed permeability. J. Geophys. Eng. 2013, 10, 1–8. [Google Scholar] [CrossRef]
  43. Lai, F.P.; Li, Z.P.; Wang, Y.J.; Yao, J.J. Theoretical method for calculating porosity and permeability under self-regulating effect. Int. J. Min. Sci. Technol. 2013, 5, 18–22. [Google Scholar]
  44. Ross, P.J. Taguchi Techniques for Quality Engineering: Loss Function, Orthogonal Experiments, Parameter and Tolerance Design; McGraw-Hill: New York, NY, USA, 1988. [Google Scholar]
  45. Li, S. Applied Statistics; Tsinghua University Press: Beijing, China, 2005. (In Chinese) [Google Scholar]
  46. Li, J.Q.; Liu, D.M.; Yao, Y.B.; Cai, Y.D.; Xu, L.L.; Huang, S.P. Control of CO2 permeability change in different rank coals during pressure depletion: An experimental study. Energ. Fuel 2014, 28, 987–996. [Google Scholar] [CrossRef]
Figure 1. Reservoir permeability dynamic change and permeability damage rate in the single-phase water flow stage.
Energies 13 00644 g001
Figure 2. The dynamic curve of permeability curvature and its first and second derivatives in the single-phase water flow stage.
Energies 13 00644 g002
Figure 3. Reservoir classification and corresponding demarcation points in the single-phase water flow stage.
Energies 13 00644 g003
Figure 4. Permeability dynamic change in the coalbed methane (CBM) desorption stage.
Energies 13 00644 g004
Figure 5. Sketch graph of the coal reservoir classification method.
Energies 13 00644 g005
Figure 6. Location of the sampling and study area (a) Location of the study area in China; (b) The study area, showing CBM blocks in the southern Qinshui basin; (c) Structure outline of the study area and distribution map of maximum gas production in CBM wells.
Energies 13 00644 g006
Figure 7. The actual production data and calculation results of reservoir dynamic characterization of the target wells.
Energies 13 00644 g007
Figure 8. Dynamic characterization of reservoir permeability of the target wells. P now and k now are the current reservoir average pressure and corresponding reservoir permeability, respectively.
Energies 13 00644 g008
Figure 9. Distribution map of coal reservoir dynamic characterization in the Shizhuangnan block. (a) Distribution map of the maximum daily gas production (m3/d). (b) Damaged nature of permeability. (c) Recovery nature of permeability.
Energies 13 00644 g009
Table 1. Characteristics of reservoir permeability in single-phase water flow stage.
Demarcating Pressure and StagesConditions k (mD) k (mD/MPa)
Vulnerable stage
( P i > P v )
C f k i ( 1 + v 1 v ) > 5 + 21 2 k i > k v k i > k v
Vulnerable pressure
( P i = P v )
C f k i ( 1 + v 1 v ) = 5 + 21 2 k v = 5 + 21 2 C f ( 1 + v 1 v ) k v = 5 + 21 2
Vulnerable transition stage
( P t < P i < P v )
2 2 < C f k i ( 1 + v 1 v ) < 5 + 21 2 k t < k i < k v k t < k i < k v
Turing pressure
( P i = P t )
C f k i ( 1 + v 1 v ) = 2 2 k t = 2 2 C f ( 1 + v 1 v ) k t = 2 2
Alleviative transition stage
( P a < P i < P t )
5 21 2 < C f k i ( 1 + v 1 v ) < 2 2 k a < k i < k t k a < k i < k t
Alleviate pressure
( P i = P a )
C f k i ( 1 + v 1 v ) = 5 21 2 k a = 5 21 2 C f ( 1 + v 1 v ) k a = 5 21 2
Alleviative stage
( P n < P i < P a )
0.1 < C f k i ( 1 + v 1 v ) < 5 21 2 k n < k i < k a k n < k i < k a
Invulnerable pressure
( P i = P n )
C f k i ( 1 + v 1 v ) = 0.1 k n = 1 10 C f ( 1 + v 1 v ) k n = 0.1
Invulnerable stage
( P i < P n ) )
C f k i ( 1 + v 1 v ) < 0.1 k i < k n k i < k n
Table 2. Parameters of the orthogonal test.
Cf(MPa−1) v P c d ( MPa ) φ i V L ( m 3 / t ) P L ( MPa ) ρ (g/cm3)
10.10.220.022021.2
20.20.330.033031.4
30.30.440.044041.6
Table 3. The orthogonal test design and results.
ParametersResults
C f
(MPa−1)
v P c d
(MPa)
φ i V L
(m3/t)
P L
(MPa)
ρ
(g/cm3)
P r b
(MPa)
P r b / P c d P r c
(MPa)
10.10.220.022021.22.611.310.4
20.10.330.033031.43.001.001.4
30.10.440.044041.63.390.853.6
40.20.220.033041.61.940.970.2
50.20.330.044021.22.060.690
60.20.440.022031.42.620.661.3
70.30.230.024031.62.950.981.9
80.30.340.032041.21.880.47−0.9
90.30.420.043021.41.160.58−0.9
100.10.240.043031.22.980.741.1
110.10.320.024041.43.251.631.1
120.10.430.032021.62.290.761.1
130.20.230.042041.41.310.44−0.9
140.20.340.023021.63.360.843.4
150.20.420.034031.21.620.81−0.8
160.30.240.034021.42.940.742
170.30.320.042031.60.870.43−1.2
180.30.430.023041.22.070.69−0.6
Table 4. The orthogonal test results.
Results C f
(MPa−1)
v P c d
(MPa)
φ i V L
(m3/t)
P L
(MPa)
ρ
(g/cm3)
P r b K117.5214.7311.4416.8711.5614.4213.21
K212.9014.4113.6813.6714.5114.0414.28
K311.8713.1517.1611.7516.2113.8314.80
k12.922.451.912.811.932.402.20
k22.152.402.282.282.422.342.38
k31.982.192.861.962.702.312.47
R0.940.260.950.850.770.100.27
Influence order
Correlationnegativenegativepositivenegativepositivenegativepositive
P r b / P c d K16.295.175.726.104.064.914.70
K24.405.054.564.754.824.635.03
K33.894.354.293.725.695.044.84
k11.050.860.951.020.680.820.78
k20.730.840.760.790.800.770.84
k30.650.720.720.620.950.840.81
R0.400.140.240.400.270.070.05
Influence order
Correlationnegativenegativenegativenegativepositive--
K18.704.70−1.207.50−0.206.00−0.80
K23.203.802.903.004.603.704.00
K30.303.7010.501.707.802.509.00
k11.450.78−0.201.25−0.031.00−0.13
k20.530.630.480.500.770.620.67
k30.050.621.750.281.300.421.50
R1.400.171.950.971.330.581.63
Influence order
Correlationnegativenegativepositivenegativepositivenegativepositive
Note: Ki represents the sum of the calculation results of the same horizontal component of the corresponding parameter; ki is the average value of Ki. R indicates the range of the corresponding parameters that is used to judge the order of the factors affecting the results. A greater range indicates that the factor has a greater influence on the experimental results. The calculation method of the range is R = max(ki) − min(ki)).
Table 5. The geologic parameters and calculation results of well T26 and T57.
ParametersT26T57Date SourcesResultsT26T57
C f (MPa−1)0.1640.173calculation by the method from [46] P v (MPa)11.215.4
P i (MPa)3.32.7actual field date P t (MPa)8.712.9
P c d (MPa)2.971.02actual field date P a (MPa)6.210.5
V L (m3/t)36.6834.39experimental data P n (MPa)2.46.9
P L (MPa)1.52.4experimental data P r b (MPa)2.70.8
k i (mD)0.420.081simulation historical matching P r c (MPa)2.3<0
φ 0.020.06simulation historical matchingRc51.0%13.3%
Table 6. Geological parameters and calculation results of the target wells in the Shizhuangnan Block.
Wellsφ P i
(MPa)
Pcd
(MPa)
VL
(m3/d)
PL
(MPa)
ki
(mD)
C f
(MPa−1)
Pv
(MPa)
Pt
(MPa)
P a
(MPa)
P n
(MPa)
Prb
(MPa)
P r c
(MPa)
T990.083.33.126.83.30.070.16816.714.211.67.90.9<0
T090.086.02.633.33.00.010.16625.623.120.516.71.1<0
T15D0.084.4235.81.70.030.16221.418.916.312.41.8<0
T850.085.43.826.83.10.030.16322.119.516.913.11.3<0
T350.084.91.128.82.50.050.16220.417.815.211.30.8<0
T510.023.42.233.52.80.130.16715.112.610.16.32.10.7
T400.023.81.833.33.00.170.16415.112.610.06.21.80.5
T550.0153.52.634.42.40.580.16610.47.85.31.52.61.8
T28D0.064.61.233.92.60.120.16217.014.411.87.90.9<0
T330.0153.01.334.52.10.440.17010.68.15.61.91.30.7
T640.0152.91.536.61.50.380.17110.98.46.02.31.51
T650.0153.61.527.91.80.560.16510.88.25.71.91.50.7
T670.053.01.833.62.70.320.17011.59.06.62.91.3<0
T300.023.41.835.51.80.470.16710.98.45.92.11.80.8
T280.0153.42.736.32.10.570.16710.37.85.31.52.72.3
T260.023.23.036.61.50.420.16811.18.66.13.232.3
T320.023.41.935.52.30.880.1669.16.54.00.21.90.8
T530.023.00.8341.50.200.17013.010.58.14.40.80.2
Z130.023.11.7341.70.470.17010.47.95.51.71.70.9
Z360.034.32.127.71.50.160.16215.813.210.76.81.90.1
Z590.044.41.935.12.00.410.16212.710.27.63.71.7<0
Z750.033.22.333.23.10.140.16814.412.09.55.72.10.7
Z780.033.62.3342.80.340.16512.49.97.33.52.10.5
Z550.044.02.334.62.10.460.16312.09.46.82.91.90.1
T460.033.31.333.43.00.130.16715.212.63410.16.31.3<0
T570.062.71.034.42.30.080.17315.412.910.56.90.8<0

