Direct Assessment of Separator Strain in Li-Ion Batteries at the Onset of Mechanically Induced Short Circuit


1
Mechanical Engineering Department, Wayne State University, Detroit, MI 48202, USA
2
Ford Motor Co., Research and Innovation Center, Dearborn, MI 48124, USA
*
Author to whom correspondence should be addressed.
Energies 2020, 13(3), 669; https://doi.org/10.3390/en13030669
Submission received: 26 December 2019
/
Revised: 26 January 2020
/
Accepted: 31 January 2020
/
Published: 4 February 2020
(This article belongs to the Special Issue Advanced Battery Technologies for Energy Storage Devices)
Abstract
:In the literature, mechanical deformation of Li-ion batteries (LIB) is characterized in terms of global or volumetric strain of the entire cell to develop load vs. strain plots. In characterizing the mechano-electrical–thermal–chemical interaction of the battery in relation to internal short circuit (ISC) due to mechanical load, these estimated strains are “indirect strains” at best. Direct evaluation of “internal local strains” between the layers, particularly, in the first separator layer should be a critical material parameter as it relates to separator rupture and should be the key link in ISC in LIBs. We make an effort to assess “internal local strains” which is not reported elsewhere, first by using the Oak Ridge National Laboratory (ORNL) approach to use plastic deformation of aluminum casing to “freeze” deformation states of the LIBs followed by microscopy to image undeformed and deformed cells. An image analysis procedure is developed to estimate transverse compression strains in the cells, e.g., in Cu anode, Al cathode, and the polymeric separator. The local strain experienced by the polymeric separator nearest to ball indentation is found to be close to 65–70% and this strain level is much higher than 40–50% maximum average strains estimated for the same sample.
Keywords:
internal local strain; average strain; separator; ISC; Li-ion battery; indentation; mechanical abuse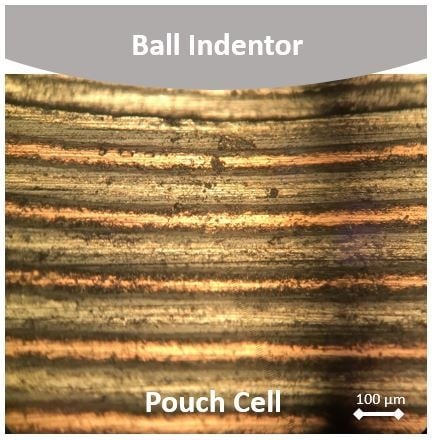
1. Introduction
In recent years, Li-ion batteries (LIB) or cells have transitioned from power electronics into much larger-scale applications such as electric vehicles (EV) and aerospace applications [1,2]. Battery safety is a consideration in relation to crashworthiness as vehicle crash events can deform batteries to develop internal short circuits (ISC) which can potentially create conditions of thermal runaway. Understanding the behavior of battery pack and individual cells during severe mechanical deformation is critical for lithium-ion battery and EV safety. Additionally, understanding the deformation levels in anode and cathode layers and the separator in relation to their properties under certain loading conditions contributed to safe design. However, lack of precise strain information in the Cu and Al layers and separator leading to ISC precluded developing a reliable failure criterion for the onset of ISC.
In the literature, studies related to the internal short circuit of lithium-ion batteries have been reported experimentally using nail penetration, indentation and pinch tests [2,3,4,5,6,7,8]. These types of abuse tests are fairly common to ensure the robustness of the battery systems. Thermal and electrochemical failure modes in LIB has also been reported in the literature. Progressive damage in pouch cells also have been conducted and damage evolution have been mapped including presence of slant fracture modes in the battery cross-section and application of Mohr–Coulomb type failure models [1,3,4,5]. It is recognized that in situ evidence of battery failure is lacking [3]. A constant uniaxial strain-to-failure from punch or ball indentation tests of Li-ion cells can be used as an effective criterion at macro level to detect onset of short circuit [6]. In several studies, microscale failure mechanisms are explained and good correlation to model results with experimental indentation results in terms of force vs. global strain are obtained [7,8]. The global strain in experiments are estimated from the overall deformation of the sample [7]. Nonetheless, there is a limited amount of available research in the area of external induced indentation and mechanical conditions at a micro level that addresses what strain level is necessary for the Cu and Al layers to initiate ISC with damage to the separator. The precise mechanism is still being investigated by many researchers whether rupture or tear of the polymeric separator or folding of the thin Cu and Al layers cutting into the separator promote the necessary pathway to ISC. Dynamic computational simulation and experiments to validate model simulation results have been reported in the literature [9]. Multi-scale model also has been reported [10]. A modified pinch-torsion test to induce ISC at smaller load is introduced [11]. Load-time curve is superimposed with voltage–time curve to understand the behavior of cell during mechanical abuse. Others examine the interaction between mechanical failure and electrical–thermal responses and use Finite-Element (FE) model and LS-DYNA solver to predict separator failure induced ISC [5,6,7].
Researchers point out a series of mechanical tests and numerical simulation on commercial LIB cells that elaborate on free and confinement induced deformation and related failure modes in common prismatic battery cells [12,13,14,15]. The experiments are based on in-plane and out of plane constrained compression. These articles rely on idealized kinematic model that explain kink and shear band formation. Also, the effect of friction between constrained wall and battery on load–displacement curves are studied [14,15]. However, these studies do not address ISC directly in relation to deformation. Other researchers report number of tests to characterize the mechanical properties of component of battery cell-like electrodes, separator etc. [13]. In general, macro-scale homogenized FE models are developed to simulate the tests such as punch indentation, bending, and compression tests. Normalized critical displacements to ISC are assessed for different mechanical loading. Microscale FE models are used to study sequence of failure under these loading conditions.
Computational models to explain the failure process due to ISC has been attempted with good success by the MIT group [16,17,18,19,20]. For the axial compression case, the computational models for a full-scale model are found to be effective tools to clarify the onset of ISC due to two different failure mechanisms [17]. Material properties play an important role for better understanding of the failure process and have been addressed with proper focus [20]. Coupled mechanical models including effects of thermal and electrical conditions have also seen reasonable success [21]. Simulation of abuse behavior has also been explained [22]. In many of the studies described earlier, experimental deformation response of the cell under loading has always been related to the “crosshead” displacement of the testing machine and not the “actual strain” which occurs within the LIB.
Several studies have focused on issues such as dynamic behavior, infrared (IR) imaging, and X-ray tomography for attempting to understand the local failure processes leading to better understanding of ISC and the thermal runaway process [23,24,25,26,27,28]. The role of polymer separator and its failure in the highly deformed zone has been the focus of several studies [29,30,31]. ISC is due to polymer separator failure or rupture connecting the anode and the cathode.
In summary, research work has been conducted to understand the behavior of battery cells under different mechanical loading includes nail penetration tests, pinch tests, drop tests, bending, and compression tests etc. None of the research work provided a clear idea about the local strain level which causes internal short circuit (ISC), but mainly focused on stresses, cracking, buckling, delamination, and global mechanical behavior of the cell. Most researchers have provided nominal strains or average strains from the “crosshead” displacement recorded from the test machine in a macro sense from original thickness vs. deformed thickness measured from the damaged specimen. Measuring local strain internal to the battery is a challenging task as it requires special technique to first “freeze” the deformation as spring back of internal layers are possible without restraint. Careful sectioning through the deformed region is also needed to image the deformed stage of the internal layers. Strain within the polymeric layer close to highest local deformation was of significant interest as rupture of the polymeric separator at such locations are likely.
In a study to assess strain in the polymer separator, biaxial tension experiments have been carried out at ORNL on two grades of polymer separators used in LIB: Celgard 2325 and Celgard 2075. The failure strain of Celgard 2325 is evaluated to be about 80% compared to Celgard 2075 material which is substantially lower [32]. This is relevant for our study as our LIB also has Celgard 2325 separator.
Compared to many experimental studies, combined experimental and numerical studies on the progressive failure behavior of electrodes for lithium-ion batteries are also reported subjected to external loads [33]. The tensile and compression properties of anode and cathode were tested and used to determine the constitutive properties of active materials and current collectors. The authors propose a strain-based damage model to describe compression failure of active-material layer and obtained parameter values by correlating with experimental stress–strain curves.
In this paper, we have developed a procedure to assess internal transverse compression strain between various material layers. In this context, the work of ORNL researchers has been instrumental in “freezing” the deformation state using aluminum casing after ISC is detected. After load removal from the sample, no spring back of the LIB internal anode/separator/cathode layers due to plastic deformation is observed as in the ORNL study [11]. After sectioning the sample through the deformed zone, we have been able to take precise digital images before and after test for different samples. By comparing the undeformed and deformed states and employing both numerical and digital image processing, we can estimate local strains close to the contact point of the battery at the onset of ISC. Magnitude of the local transverse compression strain that initiates ISC can be the basis for a failure criterion which can be used in crash analysis to initiate the onset of thermal runaway. Currently, crash analysis can determine local stresses and strains throughout the model under increasing load and deformation but does not have a defined failure criterion to start the thermal runway process. Average or nominal transverse strains reported in the literature are from transverse displacement of the prismatic Li-ion cells. Our approach provides more accurate local transverse strains within the internal layers. Although crash loading may have high strain rate effects, the static work presented here is a good start in understanding internal local strains.
2. Experimental
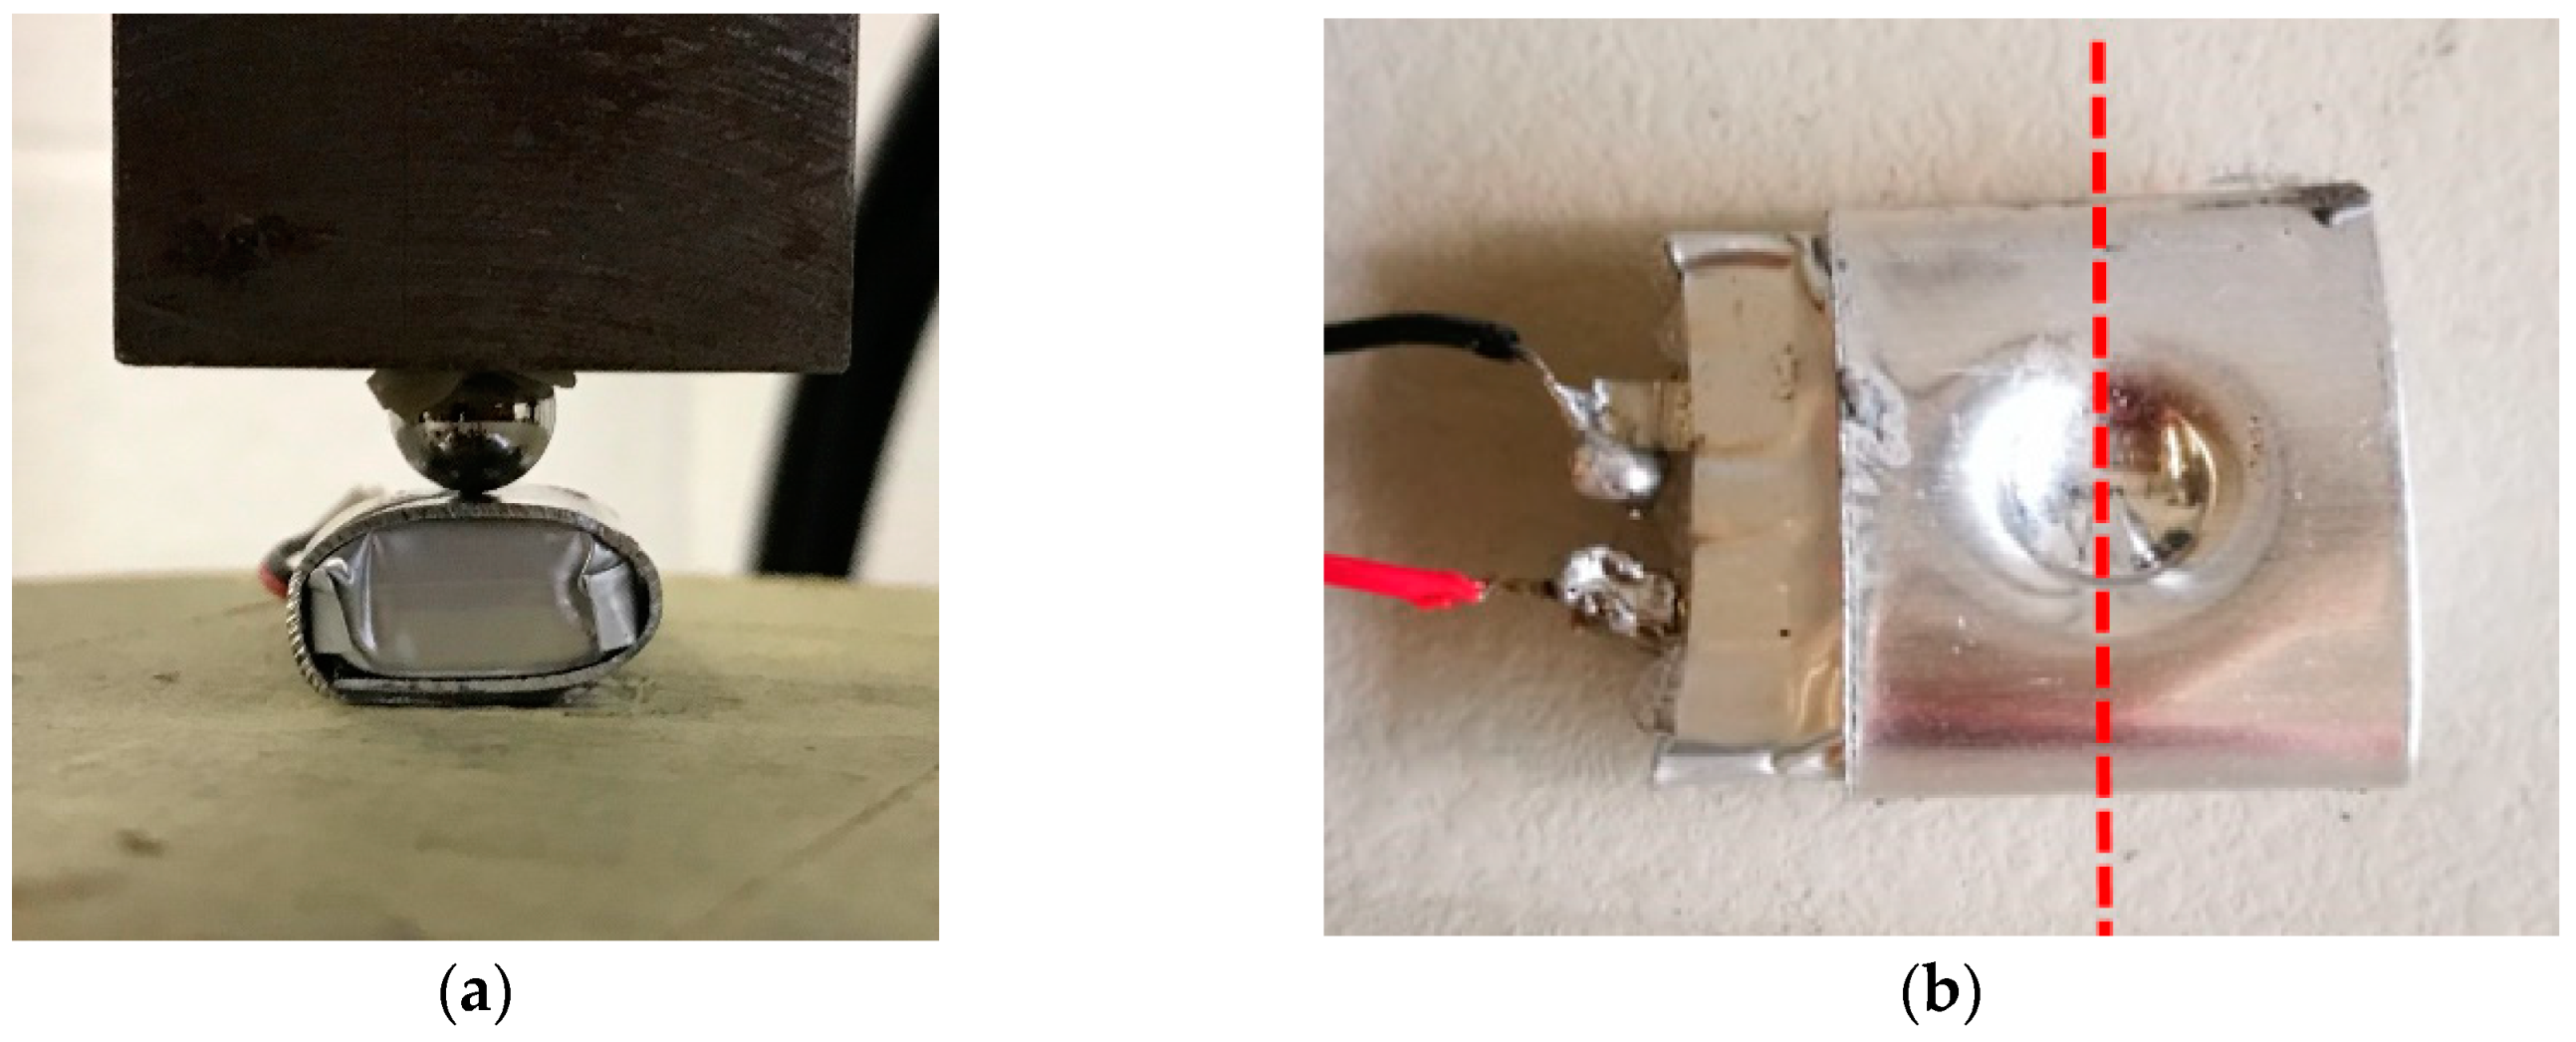
A procedure has been developed to assess the internal deformation state of Li-ion cells at the onset of electrical short circuit due to its mechanical abuse. Commercially available LiCoO2 small Li-ion pouch cells (Hubsan V272-06) with 100 mA h capacity are indented using a ball indenter of 6.35 mm diameter in a table-top MTS machine. The specification of the pouch cell is given in Table 1. The cell dimensions are: 17 mm × 24 mm × 7 mm. To avoid the thermal damage, cell was purposefully kept partially charged with voltage around ~1.1 V. The initial voltage of the battery was 3.4 V, but it had to be discharged to 1.1 V to have stable experiment and to detect ISC without fast rise in temperature. Voltage drop to zero was an indication of the onset of ISC. The aluminum foil with 0.6 mm thickness of are wrapped around the cell. This aluminum enclosure of the pouch cell permanently deforms during testing (Figure 1a) and “freeze” the internal mechanical deformation even after the removal of external load, no spring back occurs. We have conducted multiple tests to check this condition. It is consistent with the ORNL work [11]. Back filling using metallographic epoxy and polishing the samples were attempted but clarity in layer observation was not achieved and this approach was abandoned. All deformed cells after tests are cut through the center of indentation by using diamond blade cutter (IsoMate blade, 10LC, 127 mm) as shown in Figure 1b. Typically, the samples are left for 48–72 hours for drying in air. These cells are then polished using a polishing machine (using grit size of 600) and the cross-sectional area are then imaged using an optical microscope These images are then processed using MATLAB code to evaluate the internal strain in the cells through its thickness under the deformed zone.
All the experiments are conducted on 10 kN MTS compression/tension test machine with the load cell of 10 kN maximum capacity. The fixed displacement rate of 1 mm per minute is maintained during testing. The indenter is positioned over center of the cell lengthwise and widthwise. The typical voltmeter is connected to the cell terminals to measure the cell voltage over time. The indentation continues in these tests run until the cell shows the evidence of internal electrical short circuit.
3. Results and Discussion
Estimation of local strain procedure—Image correlation method is used to calculate the internal microstructural strain in deformed battery through its cross-sectional thickness. A MATLAB code is developed for this purpose. The code is based on the comparison between the optical microscopic image of undeformed (before test) cell to the deformed (after test) one. It may be noted that the untested cell represents flat lines for the anode (Cu) and cathode (Al) and serves as a reference. In the deformed cells with deformed lines for anode and cathode are then compared to the same sequence of flat lines of the undeformed cell to estimate the strain. Although polishing results in relatively high level of roughness of layers, the manual points within the layers can be easily laid with proper magnification of the layers.
First, we are interested in internal strain for the battery due to indentation. This requires that we can estimate the shape change of the layer of interest relative to the untested sample case where all the layers are flat. We fit a third order polynomial curve through the points to represent the shape change of the layer. We are able to curve fit the manual laid points with high degree of accuracy. The only non-destructive approach to assess internal condition is X-ray tomography. However, the resolution is limited to about 20 microns if it is achievable (most systems are not expected to have this resolution). In addition, the polymer layer cannot be mapped using X-ray tomography. The technique is on the other hand very useful for exploring microcracks and damage in the battery, particularly, in the Cu anode and Al cathode layers.
The polymer is the most compliant layer and it easily follows the deformation of the Cu and Al layers which may go into permanent plastic deformation. Position of all layers are held tightly due to the aluminum encasing used following the ORNL method. We had essentially “frozen” the deformation of all layers. The cross-sectional shape of the layers including the polymer layer due to indentation is more important for us to determine the local strains in relation to the straight line of the untested sample. The mapping points for each layer are taken in the middle of the layers to generate the polynomial curve. Therefore, even if the layer edges are not well defined and burred due to polishing and apparent thickness is affected by the presence of the carbon particles, it does not affect our calculation of strain in the layer. The polynomial shape is determined by the mapped dots in the middle of the layer. The magnified image as in an untested sample is shown in a later figure which clarifies that it is easy to map the dots within the layers.
There is no doubt that polishing the surface of the internal cut is not easy and requires much care as we have done in our research. Our goal was not to elucidate exact microstructure or microfeatures that we are often interested in metallic materials, rather to define the macro shape profile of the layers that can then be mathematically represented using polynomial curves. We are confident that our shape estimation process is quite accurate. Certainly, it would be desirable if we could have a perfect image of the cross-section. However, that is nearly impossible. Avoiding air/moisture issue is almost impossible; however, it could be minimized by conducting experiments in a “dry-room”.
The code allows us to map the points along the Cu and Al lines of the small pouch cell as shown in Figure 2a. The code interpolates these points and forms a curve with 3rd order polynomial along the particular anode or cathode layer that has been chosen. There are 163 pixels chosen between the two lines of Cu to provide high accuracy in characterizing the deformation. Cu lines or curves are easily visible in the microscopic images. After mapping of points and assigning a third order polynomial, the code can assign 50 points or more on the curve for greater flexibility in estimations of strains between top and bottom lines. Multiple number of lines can be drawn as specified on both the images as shown in Figure 2b. These mapped images are thereafter compared using the code to estimate the strain level within the tested cell.
The code is developed to calculate the strain in between the Cu and Al layers based on the distance between the polynomials of deformed cell in relation to the undeformed cell layers at the similar positions. If the undeformed adjacent Cu line distance is denoted by L, then the deformed and shortened distance between similar adjacent Cu lines can be given by L’. The strain is then calculated as (L − L’)/L. The code generates strain contours and provides the information about the average strain developed within selected pixel zones at the time of ISC (Figure 3 below). Also, radial strains can be mapped along various lines as shown in Figure 3. We only present data along line a in the figure to demonstrate the case. Strains along other radial lines can be estimated similarly but were not done.
Mechano-electrical response of LIB—Battery load vs. displacement response is characterized in fig.4 with the voltage curve. The test was terminated when the voltage reached zero. Complete short circuit was observed after the deformation reached to approximately 3 mm. The deformation or displacement is measured by the MTS machine. It is about this level of deformation when we found ISC to occur in these samples. Initially, voltage started increasing until the first small drop in load—displacement curve was observed. This is likely due to the gaps between cell components were decreasing with increasing compressive load. Short circuit initiates when load exceeds 3.5 kN. Soon after ISC, the test is terminated which is shown by the “X” on the load–deformation curve. Precise value of load at ISC can be found by superimposing voltage profile as a function of crosshead displacement (Figure 4) in relation to onset of voltage drop. This load is estimated to be 3.8 kN.
We have conducted 10 tests for repeatability and the overall response are similar to maximum load at ISC is 3.5 ± 0.2 kN and deflection is 3.1 ± 0.3 mm. The aluminum casing and the sample itself are softer and the initial response of the “S” shaped load–deflection curve is due to compaction and subsequent stiffening of the sample.
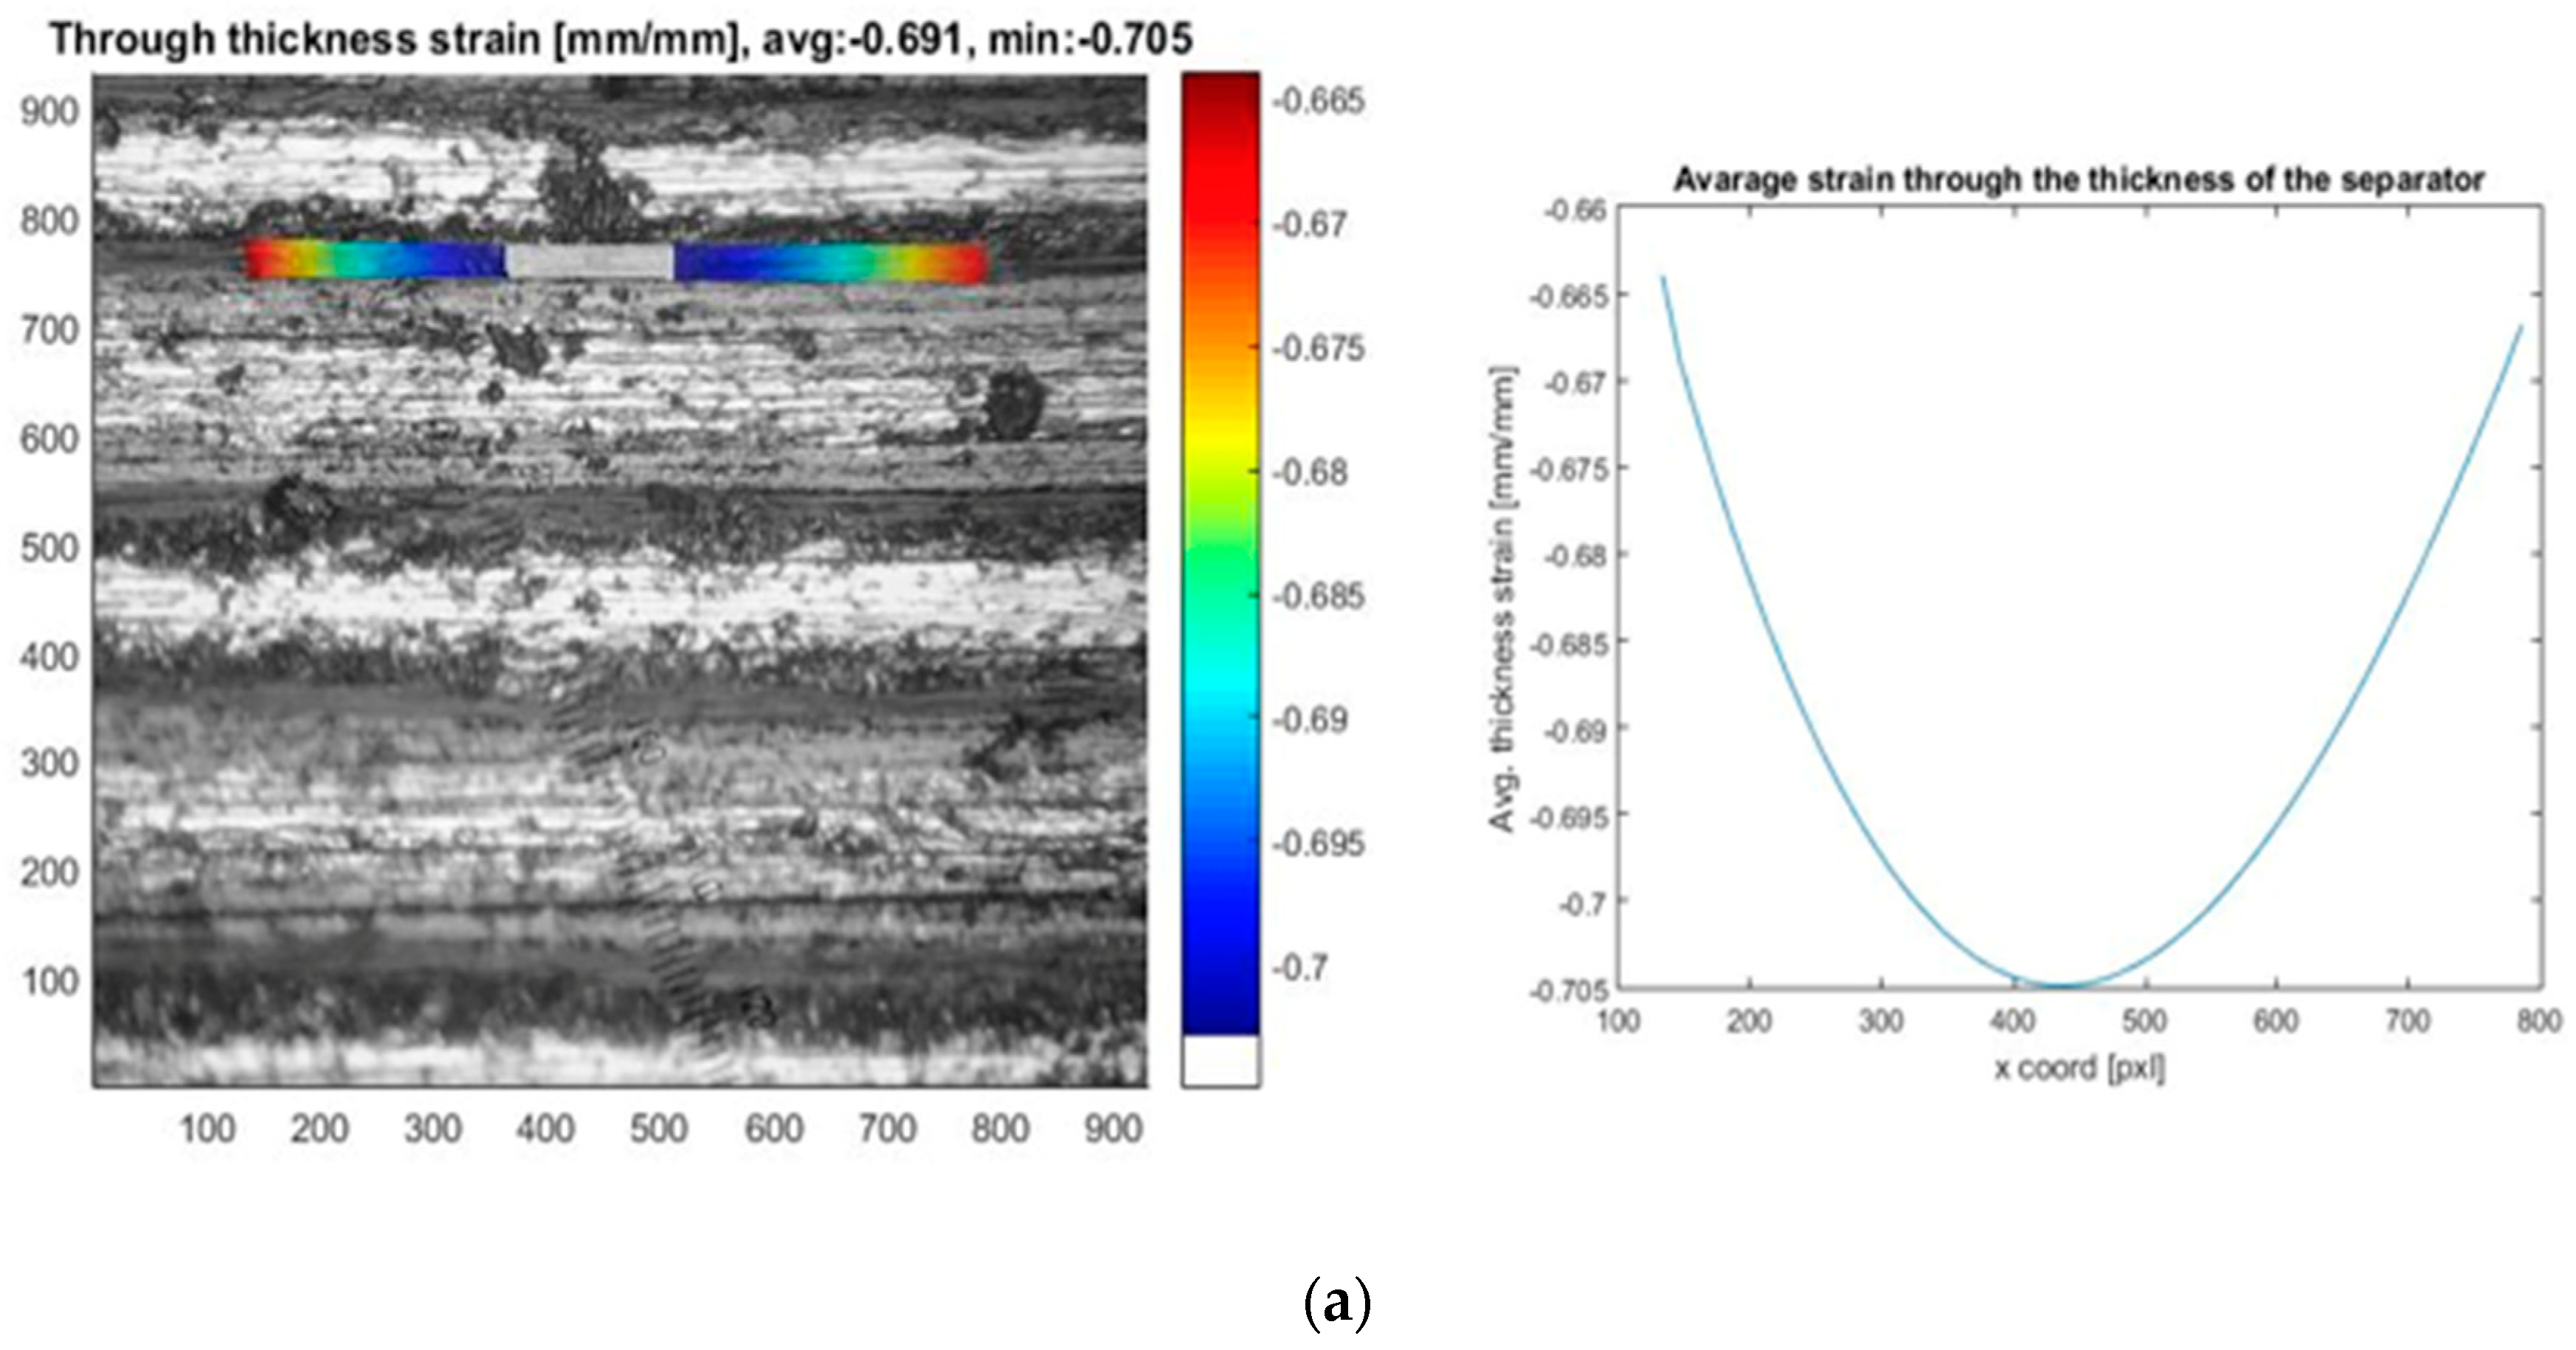
Digital image analysis and recorded strains—In estimating local strains, we have focused on strains in the Celgard 2325 polymeric separator layer. In our tests, we have been successful via good microscopy to focus attention on separator (Celgard 2325) layers. Higher magnification images of the LIB clearly delineate the various layers and their thicknesses as shown in Figure 5. The polymer separator is dark as carbon black from the anode and cathode coatings during polishing cover the cross-sectional surface of the polymer separator. A typical strain estimation result is presented in Figure 6. Within the separator layer, the strain variation in width direction is recorded and are shown also in Figure 6.
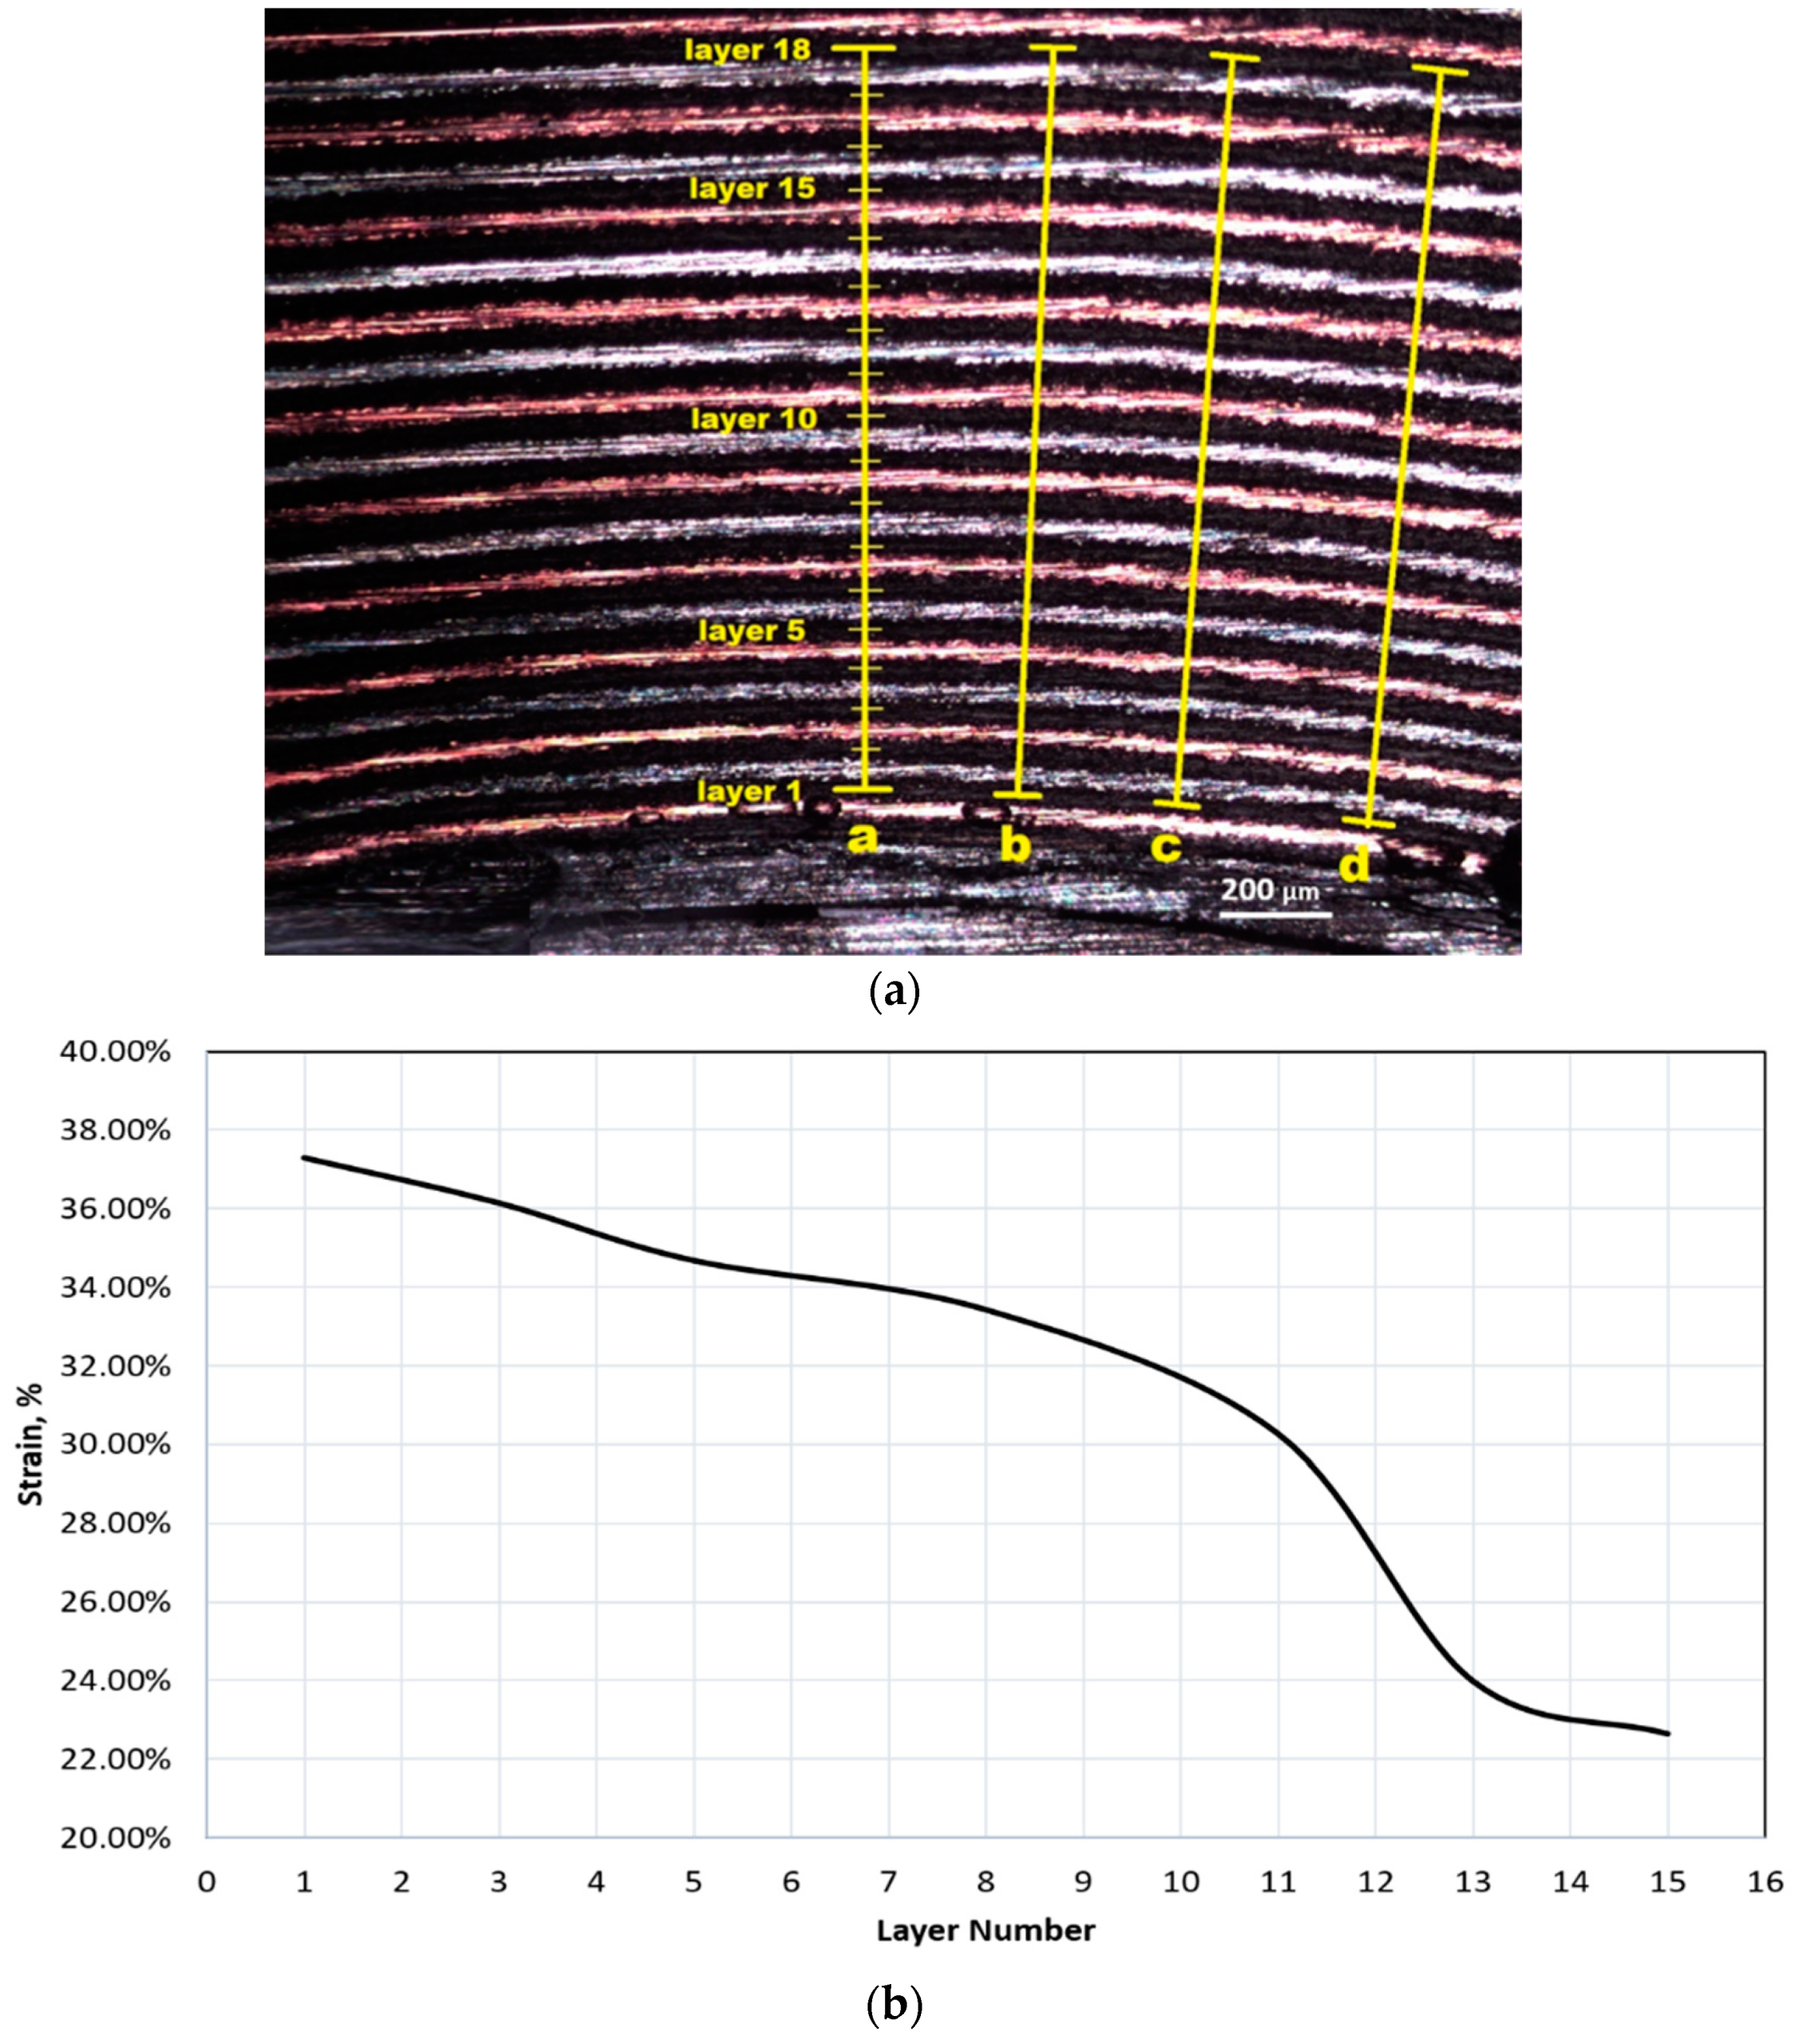
From a cross-sectioned sample, we are able to carefully assess strains within the separator layers as a function of thickness from the indenter point of contact (Figure 7) which shows that the strain in the separator layers decrease from the sample surface into the sample thickness.
Estimation of strain can be determined within any pixel zone and depending on the size of the zone, accuracy of strain measurement is dependent on the selection of the zone size: the averaging process involving many pixels include areas to the left and right and top and bottom. For more accuracy, thin layer i.e., the size of the pixel zone selected will be more ideal as shown since strain will drop off in the thickness direction (Figure 8) and will affect the average value more significantly within the selected pixel zone. Therefore, larger pixel zone produces a lower average strain vs thinner pixel zone which will produce higher strain values, especially in the thickness direction.
If larger areas are taken for strain assessment, the average values will be significantly lower due to more variation of strain. This is also the reason the average strain for the entire sample calculated from total deformation will produce lower average strain as reported generally in the literature.
In Figure 9, we present results from progressive indentation tests on different samples for different deformation levels or indentor displacement. Each point in the diagram represents a unique sample. In this figure, we plot first separator maximum strain level vs. corresponding applied load. ISC occurs close to 70% local strain experienced by the first separator in three samples.
Our results indicate that the Celgard 2325 closest to the indentor experiences a maximum transverse compression strain of about 70% at ISC under a constrained condition with all other surrounding layers next to it. Multiple tests confirm this number as shown in Figure 8. The ORNL work for biaxial strain assessment shows that in an unconstrained condition, the Celgard 2325-layer experiences about 80% strain at tensile rupture [32]. It is noted that the measurement and test conditions are quite different between the ORNL and our work, but relative high strains are reported for this separator for both studies. In our case though, we cannot confirm the compressive rupture of the separator layer as it is nearly impossible to determine this from microscopy for such a soft material. However, it is a reasonable assumption that in our case, the compressive rupture of Celgard 2325 occurs around 65–70% strain constrained by other adjacent layers to initiate ISC.
In our approach for smooth polynomial fit and subsequent strain estimation within a layer, discontinuities or strain concentrations are not considered. It is highly likely that at the onset of ISC the cell undergoes concentration of strains in the fault lines [11], especially close to ISC. This becomes a difficult area for precise strain measurement using our proposed approach. Only local FE analysis may be able to model these discontinuities and provide more accurate information. However, the utility of our approach is to provide a good estimation of local strain within a thin battery layer in the absence of any defects. The approach is fine even with highly localized concentration of strain so long as no discontinuities such as microcracks are present. We anticipate this to be the case just prior to ISC.
4. Conclusions
Microscopic image analysis is used to assess local strains in Li-ion prismatic cells subjected to transverse ball indentation. Local strains in the Celgard 2325 separators closest to the indentor and sample contact point in the range of 65–70% are recorded just prior to ISC. This strain level range may be critical for transverse compression rupture or tear of the separator layer—a failure mechanism which requires confirmation via destructive and non-destructive approaches in failed samples. The local strain values of about 65–70% in the first separator are much higher than the average or global strains of 40–50% estimated from our own indentation tests similar to most results reported in the literature. Local strains of 65–70% immediately prior to ISC as shown Figure 7 in the cell stacks can be used as a potential failure criterion range in computational codes to initiate ISC and onset of thermal runway. More importantly, the minimum strain of about 65% recorded in about the fifth separator layer farther from the indentor point can be a good single failure criterion for ISC in these pouch cell batteries.
Author Contributions
Project administration, funding acquisition, conceptualization, methodology, supervision, writing—original draft preparation, G.N.; experimentation, software, data curation, formal analysis, S.M.; project administration, funding acquisition, experimentation, review and editing, L.A.; review and editing, M.Z.; review and editing, O.F.; review and editing, S.B. All authors have read and agreed to the published version of the manuscript.
Funding
This work was conducted as part of a University Research Program (URP) funded by Ford Motor Co. Mr Alessio Leone of Polytechnique University of Delle Marche, Ancona, Italy who worked in our laboratory as an exchange student assisted in developing the MATLAB code.
Conflicts of Interest
The authors declare no conflict of interest.
References
- Chung, S.H.; Tancogne-Dejean, T.; Zhub, J.; Luo, H.; Wierzbicki, T. Failure in lithium-ion batteries under transverse indentation loading. J. Power Sources 2018, 389, 148. [Google Scholar] [CrossRef]
- Hollmotz, L. Safety of lithium ion batteries in vehicles–state of the art, risks and trends. In Proceedings of the 22nd International Technical Conference on Enhanced Safety of Vehicles (ESV), Washington, DC, USA, 13–16 June 2011. paper No. 13-0395. [Google Scholar]
- Wang, H.; Lara-Curzio, E.; Rule, E.T.; Winchester, C.S. Mechanical abuse simulation and thermal runaway risks of large-format Li-ion batteries. J. Power Sources 2017, 342, 913. [Google Scholar] [CrossRef] [Green Version]
- Zhu, J.; Wierzbicki, T.; Li, W. A review of safety-focused mechanical modeling of commercial lithium-ion batteries. J. Power Sources 2018, 378, 153. [Google Scholar] [CrossRef]
- Kermani, G.; Sahraei, E. Review: Characterization and modeling of the mechanical properties of lithium-ion batteries. Energies 2017, 10, 1730. [Google Scholar] [CrossRef] [Green Version]
- Pesaran, A.; Wierzbicki, T.; Sahraei, E.; Li, G.; Collins, L.; Sprague, M.; Kim, G.H.; Santhangopalan, S. Coupling Mechanical of Cell Components with Electrochemical-Thermal Models for Computer-Aided Engineering of Batteries under Abuse; Project ID ES199; NREL: Golden, CO, USA, 2014. [Google Scholar]
- Zhang, C.; Santhanagopalan, S.; Pesaran, A.; Sahraei, E.; Wierzbicki, T. Coupling of mechanical behavior of lithium ion cells to electrochemical-thermal (ECT) models for battery crush. In Proceedings of the Advanced Automotive Battery Conference, Detroit, Michigan, 15–16 June 2016. [Google Scholar]
- Zhang, C.; Santhanagopalan, S.; Sprague, M.A.; Pesaran, A. A representative-sandwich model for simultaneously coupled mechanical-electrical-thermal simulation of a lithium-ion cell under quasi-static indentation tests. J. Power Sources 2015, 298, 309. [Google Scholar] [CrossRef] [Green Version]
- Sahraei, E.; Bosco, E.; Dixon, B.; Lai, B. Microscale failure mechanisms leading to internal short circuit in Li-ion batteries under complex loading scenarios. J. Power Sources 2016, 319, 56. [Google Scholar] [CrossRef]
- Pannala, S.; Turner, J.A.; Allu, S.; Elwasif, W.R.; Kalnaus, S.; Simunovic, S.; Kumar, A.; Billings, J.J.; Wang, H.; Nanda, J. Multiscale modeling and characterization for performance and safety of lithium-ion batteries. J. Appl. Phys. 2015, 118, 072017. [Google Scholar] [CrossRef]
- Wang, H.; Simunovic, S.; Maleki, H.; Howard, J.N.; Hallmark, J.A. Internal configuration of prismatic lithium-ion cells at the onset of mechanically induced short circuit. J. Power Sources 2016, 306, 424. [Google Scholar] [CrossRef] [Green Version]
- Lai, W.-J.; Ali, M.Y.; Pan, J. Mechanical behavior of representative volume elements of lithium ion battery modules under various loading conditions. J. Power Sources 2014, 248, 789. [Google Scholar] [CrossRef]
- Ali, M.Y.; Lai, W.-J.; Pan, J. Computational models for simulations of lithium-ion battery cells under constrained compression tests. J. Power Sources 2013, 242, 325. [Google Scholar] [CrossRef]
- Lai, W.-J.; Ali, M.Y.; Pan, J. Mechanical behavior of representative volume elements of lithium-ion battery cells under compressive loading conditions. J. Power Sources 2014, 245, 609. [Google Scholar] [CrossRef]
- Ali, M.Y.; Lai, W.-J.; Pan, J. Computational models for simulation of a lithium-ion battery module specimen under punch indentation. J. Power Sources 2015, 273, 448. [Google Scholar] [CrossRef]
- Sahraei, E.; Wierzbicki, T.; Hill, R.; Luo, M. Crash Safety of Lithium-Ion Batteries towards Development of a Computational Model; SAE Technical Paper 2010-01-1078; Society for Automotive Engineers: Detroit, MI, USA, 2010. [Google Scholar]
- Zhu, J.; Zhang, X.; Sahraei, E.; Wierzbicki, T. Deformation and failure mechanisms of 18650 battery cells under axial compression. J. Power Sources 2016, 336, 332. [Google Scholar] [CrossRef]
- Sahraei, E.; Meier, J.; Wierzbicki, T. Characterizing and modeling mechanical properties and onset of short circuit for three types of lithium-ion pouch cells. J. Power Sources 2014, 247, 503. [Google Scholar] [CrossRef]
- Sahraei, E.; Hill, R.; Wierzbicki, T. Calibration and finite element simulation of pouch lithium-ion batteries for mechanical integrity. J. Power Sources 2012, 201, 307. [Google Scholar] [CrossRef]
- Wierzbicki, T.; Sahraei, E. Homogenized mechanical properties for the jellyroll of cylindrical Lithium-ion cells. J. Power Sources 2013, 241, 467. [Google Scholar] [CrossRef]
- Zhang, C.; Santhanagopalan, S.; Sprague, M.A.; Pesaran, A. Coupled mechanical electrical-thermal modeling for short-circuit prediction in a lithium-ion cell under mechanical abuse. J. Power Sources 2015, 290, 102. [Google Scholar] [CrossRef] [Green Version]
- Spotnitz, R.; Muller, R. Simulation of Abuse Behavior of Lithium-Ion Batteries. J. Electrochem. Soc. Interface 2012, 12, 57. [Google Scholar] [CrossRef] [Green Version]
- Kisters, T.; Sahraei, E.; Wierzbicki, T. Dynamic impact tests on lithium-ion cells. Int. J. Impact Eng. 2017, 108, 205. [Google Scholar] [CrossRef]
- Ramadass, P.; Fang, W.F.; Zhang, Z.M. Study of internal short in a Li-ion cell I. Test method development using infra-red imaging technique. J. Power Sources 2014, 248, 769. [Google Scholar] [CrossRef]
- Maleki, H.; Howard, J.N. Internal short circuit in Li-ion cells. J. Power Sources 2009, 191, 568. [Google Scholar] [CrossRef]
- Shearing, P.; Bradley, R.; Gelb, J.; Brandon, N.; Withers, P.P. Multi-Length Scale X-ray Tomography of Li-ion Batteries. Microsc. Microanal. 2011, 17, 1672. [Google Scholar] [CrossRef] [Green Version]
- Ren, F.; Cox, T.; Wang, H. Thermal runaway risk evaluation of Li-ion cells using a pinch-torsion test. J. Power Sources 2014, 249, 156. [Google Scholar] [CrossRef]
- Cai, W.; Wang, H.; Maleki, H.; Howard, J.; Lara-Curzio, E. Experimental simulation of internal short circuit in Li-ion and Li-ion-polymer cells. J. Power Sources 2011, 196, 7779. [Google Scholar] [CrossRef]
- Cannarella, J.; Liu, X.Y.; Leng, C.Z.; Sinko, P.D.; Gor, G.Y.; Arnold, C.B. Mechanical Properties of a Battery Separator under Compression and Tension. J. Electrochem. Soc. 2014, 161, F3117. [Google Scholar] [CrossRef] [Green Version]
- Zhang, S.S. A review on the separators of liquid electrolyte Li-ion batteries. J. Power Sources 2007, 164, 351. [Google Scholar] [CrossRef]
- Chen, J.C.; Yan, Y.D.; Sun, T.; Qi, Y.; Li, X.D. Deformation and fracture behaviors of microporous polymer separators for lithium ion batteries. RSC Adv. 2014, 4, 14904. [Google Scholar] [CrossRef]
- Kalnaus, S.; Kumar, A.; Wang, Y.; Li, J.; Simunovic, S.; Turner, J.A.; Gorney, P. Strain distribution and failure mode of polymer separators for Li-ion batteries under biaxial loading. J. Power Sources 2018, 378, 139. [Google Scholar] [CrossRef]
- Zhang, C.; Xu, J.; Cao, L.; Wu, Z.; Santhanagopalan, S. Constitutive behavior and progressive mechanical failure of electrodes in lithium-ion batteries. J. Power Sources 2017, 357, 126. [Google Scholar] [CrossRef]
Figure 1.
Detecting the point of short circuit in ball indentation test (a) from force, voltage and displacement measurement, and (b) deformed shape of pouch cell.
Figure 1.
Detecting the point of short circuit in ball indentation test (a) from force, voltage and displacement measurement, and (b) deformed shape of pouch cell.

Figure 2.
Mapping of the cross-sectional microscopic image of the deformed cell; (a) points selected along Cu line, (b) 3rd order polynomial lines through the selected points. Ball indentation direction from bottom to top in the figures (actual testing is ball on top of LIB sample).
Figure 2.
Mapping of the cross-sectional microscopic image of the deformed cell; (a) points selected along Cu line, (b) 3rd order polynomial lines through the selected points. Ball indentation direction from bottom to top in the figures (actual testing is ball on top of LIB sample).

Figure 3.
Mapping of local strains along specific radial lines e.g., line a. Graph of local strain at each layer from 1 to 15 along the line a in Figure 3. (a) various radial lines are shown after indentation, (b) drop off of radial strain is shown in depth for line a at various layers.
Figure 3.
Mapping of local strains along specific radial lines e.g., line a. Graph of local strain at each layer from 1 to 15 along the line a in Figure 3. (a) various radial lines are shown after indentation, (b) drop off of radial strain is shown in depth for line a at various layers.

Figure 4.
Typical load–deflection and voltage behavior of pouch cell under ball indentation.

Figure 5.
Clear delineation of various LIB layers at higher magnification in an untested sample.

Figure 6.
Strain estimation in first layer of separator near indenter impingement in two different samples. Maximum strain recorded is about 70% in each case. (Ball indentor on top pushing on sample down). (a) image area shown with color strip where strains are measured.; (b) strain profile of the strip from left to right.


Figure 7.
(a) Series of separator locations in depth in tested sample; 1 designates closet to indentation and (b) plotted strain in various separator layers in the sample thickness direction as shown in (a).
Figure 7.
(a) Series of separator locations in depth in tested sample; 1 designates closet to indentation and (b) plotted strain in various separator layers in the sample thickness direction as shown in (a).

Figure 8.
Larger areas or pixel zones 1, 2, 3 (top) and estimation of average strains within those zones (bottom). 1–3 also signify adjacent unit cells in the LIB with a single anode, cathode, and separator. Bottom figure shows cell by cell strain drop-off from indentor contact location in the sample thickness direction. Results reflect digital data from top figure.

Figure 9.
Maximum strain in first separator layer for different samples with different degrees of indentor displacement.
Figure 9.
Maximum strain in first separator layer for different samples with different degrees of indentor displacement.


Table 1.
Specification of small Li-ion pouch cells used for this research.
| Chemistry Separator | LiCoO2/Graphite Celgard 2325 |
|---|---|
| Nominal Voltage | 3.7 V |
| Nominal Capacity | 100 mA h |
| Thickness | 7 mm |
| Width | 17 mm |
| Length Number of cells (anode/cathode) | 24 mm 30 |
© 2020 by the authors. Licensee MDPI, Basel, Switzerland. This article is an open access article distributed under the terms and conditions of the Creative Commons Attribution (CC BY) license (http://creativecommons.org/licenses/by/4.0/).
Share and Cite
MDPI and ACS Style
Newaz, G.; Mundhe, S.; Arava, L.; Zhu, M.; Faruque, O.; Barbat, S. Direct Assessment of Separator Strain in Li-Ion Batteries at the Onset of Mechanically Induced Short Circuit. Energies 2020, 13, 669. https://doi.org/10.3390/en13030669
AMA Style
Newaz G, Mundhe S, Arava L, Zhu M, Faruque O, Barbat S. Direct Assessment of Separator Strain in Li-Ion Batteries at the Onset of Mechanically Induced Short Circuit. Energies. 2020; 13(3):669. https://doi.org/10.3390/en13030669
Chicago/Turabian StyleNewaz, Golam, Sanket Mundhe, Leela Arava, Min Zhu, Omar Faruque, and Saeed Barbat. 2020. "Direct Assessment of Separator Strain in Li-Ion Batteries at the Onset of Mechanically Induced Short Circuit" Energies 13, no. 3: 669. https://doi.org/10.3390/en13030669
Note that from the first issue of 2016, this journal uses article numbers instead of page numbers. See further details here.