The Relation of Microstructure, Materials Properties and Impedance of SOFC Electrodes: A Case Study of Ni/GDC Anodes
by
 ,
,
Andreas Nenning
1,2,* ,
,
Cornelia Bischof
2,3,
Jürgen Fleig
1,
Martin Bram
2,3 and
Alexander K. Opitz
1,2 1
Institute of Chemical Technologies and Analytics, Research Group for Electrochemical Energy Conversion, TU Wien, 1010 Vienna, Austria
2
Christian Doppler Laboratory for Interfaces in Metal-supported Electrochemical Energy Converters, 1010 Vienna, Austria
3
Institute of Energy and Climate Research, Materials Synthesis and Processing (IEK-1), Forschungszentrum Jülich GmbH, 52428 Jülich, Germany
*
Author to whom correspondence should be addressed.
Energies 2020, 13(4), 987; https://doi.org/10.3390/en13040987
Submission received: 13 December 2019
/
Revised: 5 February 2020
/
Accepted: 18 February 2020
/
Published: 22 February 2020
(This article belongs to the Special Issue Exploration of Electrochemical Processes in Fuel Cells)
Abstract
:Detailed insight into electrochemical reaction mechanisms and rate limiting steps is crucial for targeted optimization of solid oxide fuel cell (SOFC) electrodes, especially for new materials and processing techniques, such as Ni/Gd-doped ceria (GDC) cermet anodes in metal-supported cells. Here, we present a comprehensive model that describes the impedance of porous cermet electrodes according to a transmission line circuit. We exemplify the validity of the model on electrolyte-supported symmetrical model cells with two equal Ni/Ce0.9Gd0.1O1.95-δ anodes. These anodes exhibit a remarkably low polarization resistance of less than 0.1 Ωcm2 at 750 °C and OCV, and metal-supported cells with equally prepared anodes achieve excellent power density of >2 W/cm2 at 700 °C. With the transmission line impedance model, it is possible to separate and quantify the individual contributions to the polarization resistance, such as oxygen ion transport across the YSZ-GDC interface, ionic conductivity within the porous anode, oxygen exchange at the GDC surface and gas phase diffusion. Furthermore, we show that the fitted parameters consistently scale with variation of electrode geometry, temperature and atmosphere. Since the fitted parameters are representative for materials properties, we can also relate our results to model studies on the ion conductivity, oxygen stoichiometry and surface catalytic properties of Gd-doped ceria and obtain very good quantitative agreement. With this detailed insight into reaction mechanisms, we can explain the excellent performance of the anode as a combination of materials properties of GDC and the unusual microstructure that is a consequence of the reductive sintering procedure, which is required for anodes in metal-supported cells.
1. Introduction
Metal-supported solid oxide fuel cells (MSCs) offer a variety of advantages over anode, or electrolyte supported cells, such as lower material costs, easier stacking (e.g., by welding) [1,2], mechanical robustness and fast heating rates. These properties, together with the potential for high power densities (>2 A/cm2) proven on cell level tests [3,4], render this cell type most suited for mobile applications [3,5,6,7,8,9]. The operating temperature of MSCs should be not more than 700 °C to prevent excessive oxidation of the metallic substrate [10], which requires the use of thoroughly optimized electrodes to achieve the power density desired for a successful application in the automotive sector. Recently, power densities above 2 W/cm2 [11] at 700 °C were demonstrated for metal-supported fuel cells with Ni/Ce0.9Gd0.1O1.95-δ (Ni/GDC, or gadolinium-doped ceria) cermet anodes prepared equally to those used in this study. For these cells, electrolyte and cathode processing also had to be thoroughly optimized [3,4,7,11,12]. Additionally, MSCs with PrOx cathode and Ni/Sm-doped ceria anode catalysts infiltrated into porous zirconia backbone exhibited reasonably high performance [13].
Ceria-based anodes are a key component with remarkably low polarization resistance, which enables high power density at intermediate temperatures of 600–700 °C. This low area-specific polarization resistance (ASR) is likely caused by the high ionic conductivity and mixed ion/electron conduction of acceptor doped ceria, which was already broadly investigated in literature [14,15,16] and the high activity of ceria for catalyzing redox reactions [17,18]. For further optimization, detailed insight into the reaction mechanisms on such electrodes is of technological and scientific interest. For this task, electrical testing on full cells gives usually rather limited insight into the individual contributions of anode and cathode. Therefore, this study focuses on the electrochemical impedance spectroscopy (EIS) measurements on symmetrical cells with two identical Ni/Ce0.9Gd0.1O1.95-δ cermet anodes. In such model cells, the materials, processing conditions and microstructure are equal to electrodes used in high-performing MSCs, so all fitted kinetic parameters are representative also for metal-supported cells in real operations. The processing steps required to successfully integrate these electrodes in functional cells are elaborated in references [11,12].
Although we only present experimental results for Ni/GDC anodes, the presented equivalent circuit model is applicable to other porous cermet and single-phase mixed ion and electric conductor (MIEC) electrodes. In literature, the most common model to fit impedance spectra is a series connection of resistor|constant phase elements that matches the number of observed arcs. While this method is simple and can describe the shape of almost any impedance spectrum, the impedance model is, in most cases, not justified by the laws of physics but rather acts as a pragmatic way of parametrization.
Physically motivated equivalent circuit models for dense mixed ion and electron conductors (MIECs) were derived numerous times in literature, e.g., by Jamnik and Maier [19], or in a less general but more comprehensive way, by Lai and Haile [20]. In porous electrodes, electrochemical reaction kinetics within the porous structure must also be considered, for which a mathematical model was derived by Adler et al. [21], also known as the Adler-Lane-Steele model. This model has so far mostly been applied to describe the kinetics of mixed conducting cathodes [22,23], although we can show that it can also be valid for SOFC anodes [24].
The impedance model presented in this paper is therefore not conceptually new. In the way we derive the equivalent circuit, all fundamental parameters describing conduction and reaction are expressed as easily measurable electrical quantities. Additionally, the relation of these circuit parameters to the electrode microstructure and materials properties is elaborated in detail, in order to aid knowledge-based improvements of electrode kinetics. In this paper, we compare model predictions to real impedance measurements and find very good quantitative agreement, with which we can explain the very low polarization resistance of the investigated electrodes. Moreover, we deliver a simple method to quantify the gas phase diffusion resistance and experimental strategies to minimize this phenomenon, which is especially critical for high-performance anodes with polarization resistance of less than 0.1 Ωcm2.
2. Impedance Model for Porous SOFC Electrodes
2.1. Porous Electrode Impedance Models in Literature
Although impedance measurements are experimentally simple, the mechanistic interpretation of impedance spectra is a demanding task that requires good insight into the electrochemical reaction mechanisms in the investigated system. Mathematical modeling predicts that especially systems in which electron and ion mobility coexist are usually best described with circuit models consisting of a ladder network of infinitesimal resistors and capacitors, so-called transmission line circuits [19,20]. Nevertheless, impedance spectra of very different samples ranging from polycrystalline ion conductors to symmetrical model cells to full SOFCs are often fitted with an equivalent circuit containing a series connection of several discrete resistor|capacitor or resistor|constant phase element (CPE) blocks. If such models are used for fitting porous electrodes, they are, in most cases, not based on physical or electrochemical equations but rather chosen intuitively to reproduce the shape of the spectrum. Due to the lack of mathematical justification, such models therefore rather represent a phenomenological parametrization of the impedance spectrum. The mechanistic interpretation of such circuit models should thus be performed with care and is prone to conceptual errors. Another widely employed analysis technique of impedance analysis is the distribution of relaxation times (DRT) [25,26,27]. This mathematically demanding analysis method does not imply a circuit model but is an advanced method data representation in which resistive magnitude is plotted versus time constant. For systems that are well-described by a series connection of resistor|capacitor or resistor|constant phase element blocks (e.g., the brick-layer model for polycrystalline materials), the DRT plot will show a number of peaks corresponding to the number of processes in the system, with peak area corresponding to their resistive magnitude. DRT is therefore a valuable way of plotting and comparing impedance spectra. For impedance functions that are expected for porous electrodes, such as the Gerischer impedance, the DRT result depends strongly on the used algorithm [25], and often, two or more peaks appear in the computed DRT, although the Gerischer impedance has only one time constant.
Impedance models for porous electrodes [21,23,28,29] or mixed ion/electron conductors [19,20] are conceptually different to a series connection of discrete resistor|capacitor (or resistor|CPE) blocks. In these cases, either transmission line circuits [19,20,29,30] or differential equations without any equivalent circuits [21,23] are used to describe porous SOFC electrodes.
The impedance model that we present in this paper is conceptually similar to the Adler-Lane-Steele (ALS) model [21], and the mathematical similarities are elaborated in Appendix C. This model is widely accepted and successfully employed to investigate SOFC cathodes, e.g., consisting of La1-xSrxCo1-yFeyO3-δ (LSCF) [21,31], LSCF-GDC composites [32], La1-xSrxMnO3-δ (LSM)-YSZ composites [33] or LaNiO4 [22]. The underlying concept that can be modeled with a transmission line circuit was also shown to be applicable to the impedance of Ni-YSZ anodes [24,30,34]. The main difference of the model presented here to the ALS model, however, lies in the mathematical and graphical presentation. The ALS model is mathematically expressed in very abstract quantities, such as the oxygen vacancy thermodynamic factor, as well as diffusion and reaction coefficients. In contrast, the model presented here is based on electrical quantities, such as ionic and electronic conductivity. This simplifies the equations describing charge transport and electrochemical reactions and allows a more intuitive representation in the form of an equivalent circuit model. Notably, the equivalent circuit model is mathematically equivalent to that by Bisquert et al. [28], which was developed for porous electrodes immersed in a liquid electrolyte. The decisive new contribution here is a mathematically rigorous and comprehensive proof that a transmission line-type circuit is the mathematically correct impedance model of any porous electrode in which ions and electrons are mobile. Importantly, we also explain how the values gained from impedance fitting are linked to defect chemistry, conductivity and catalytic properties, as well as the microstructure of the used materials.
2.2. Electronion Conduction and Electrochemical Reactions in a Porous Electrode
For better readability, the meanings of all symbols used in this section are summarized in Appendix B, Table A1.
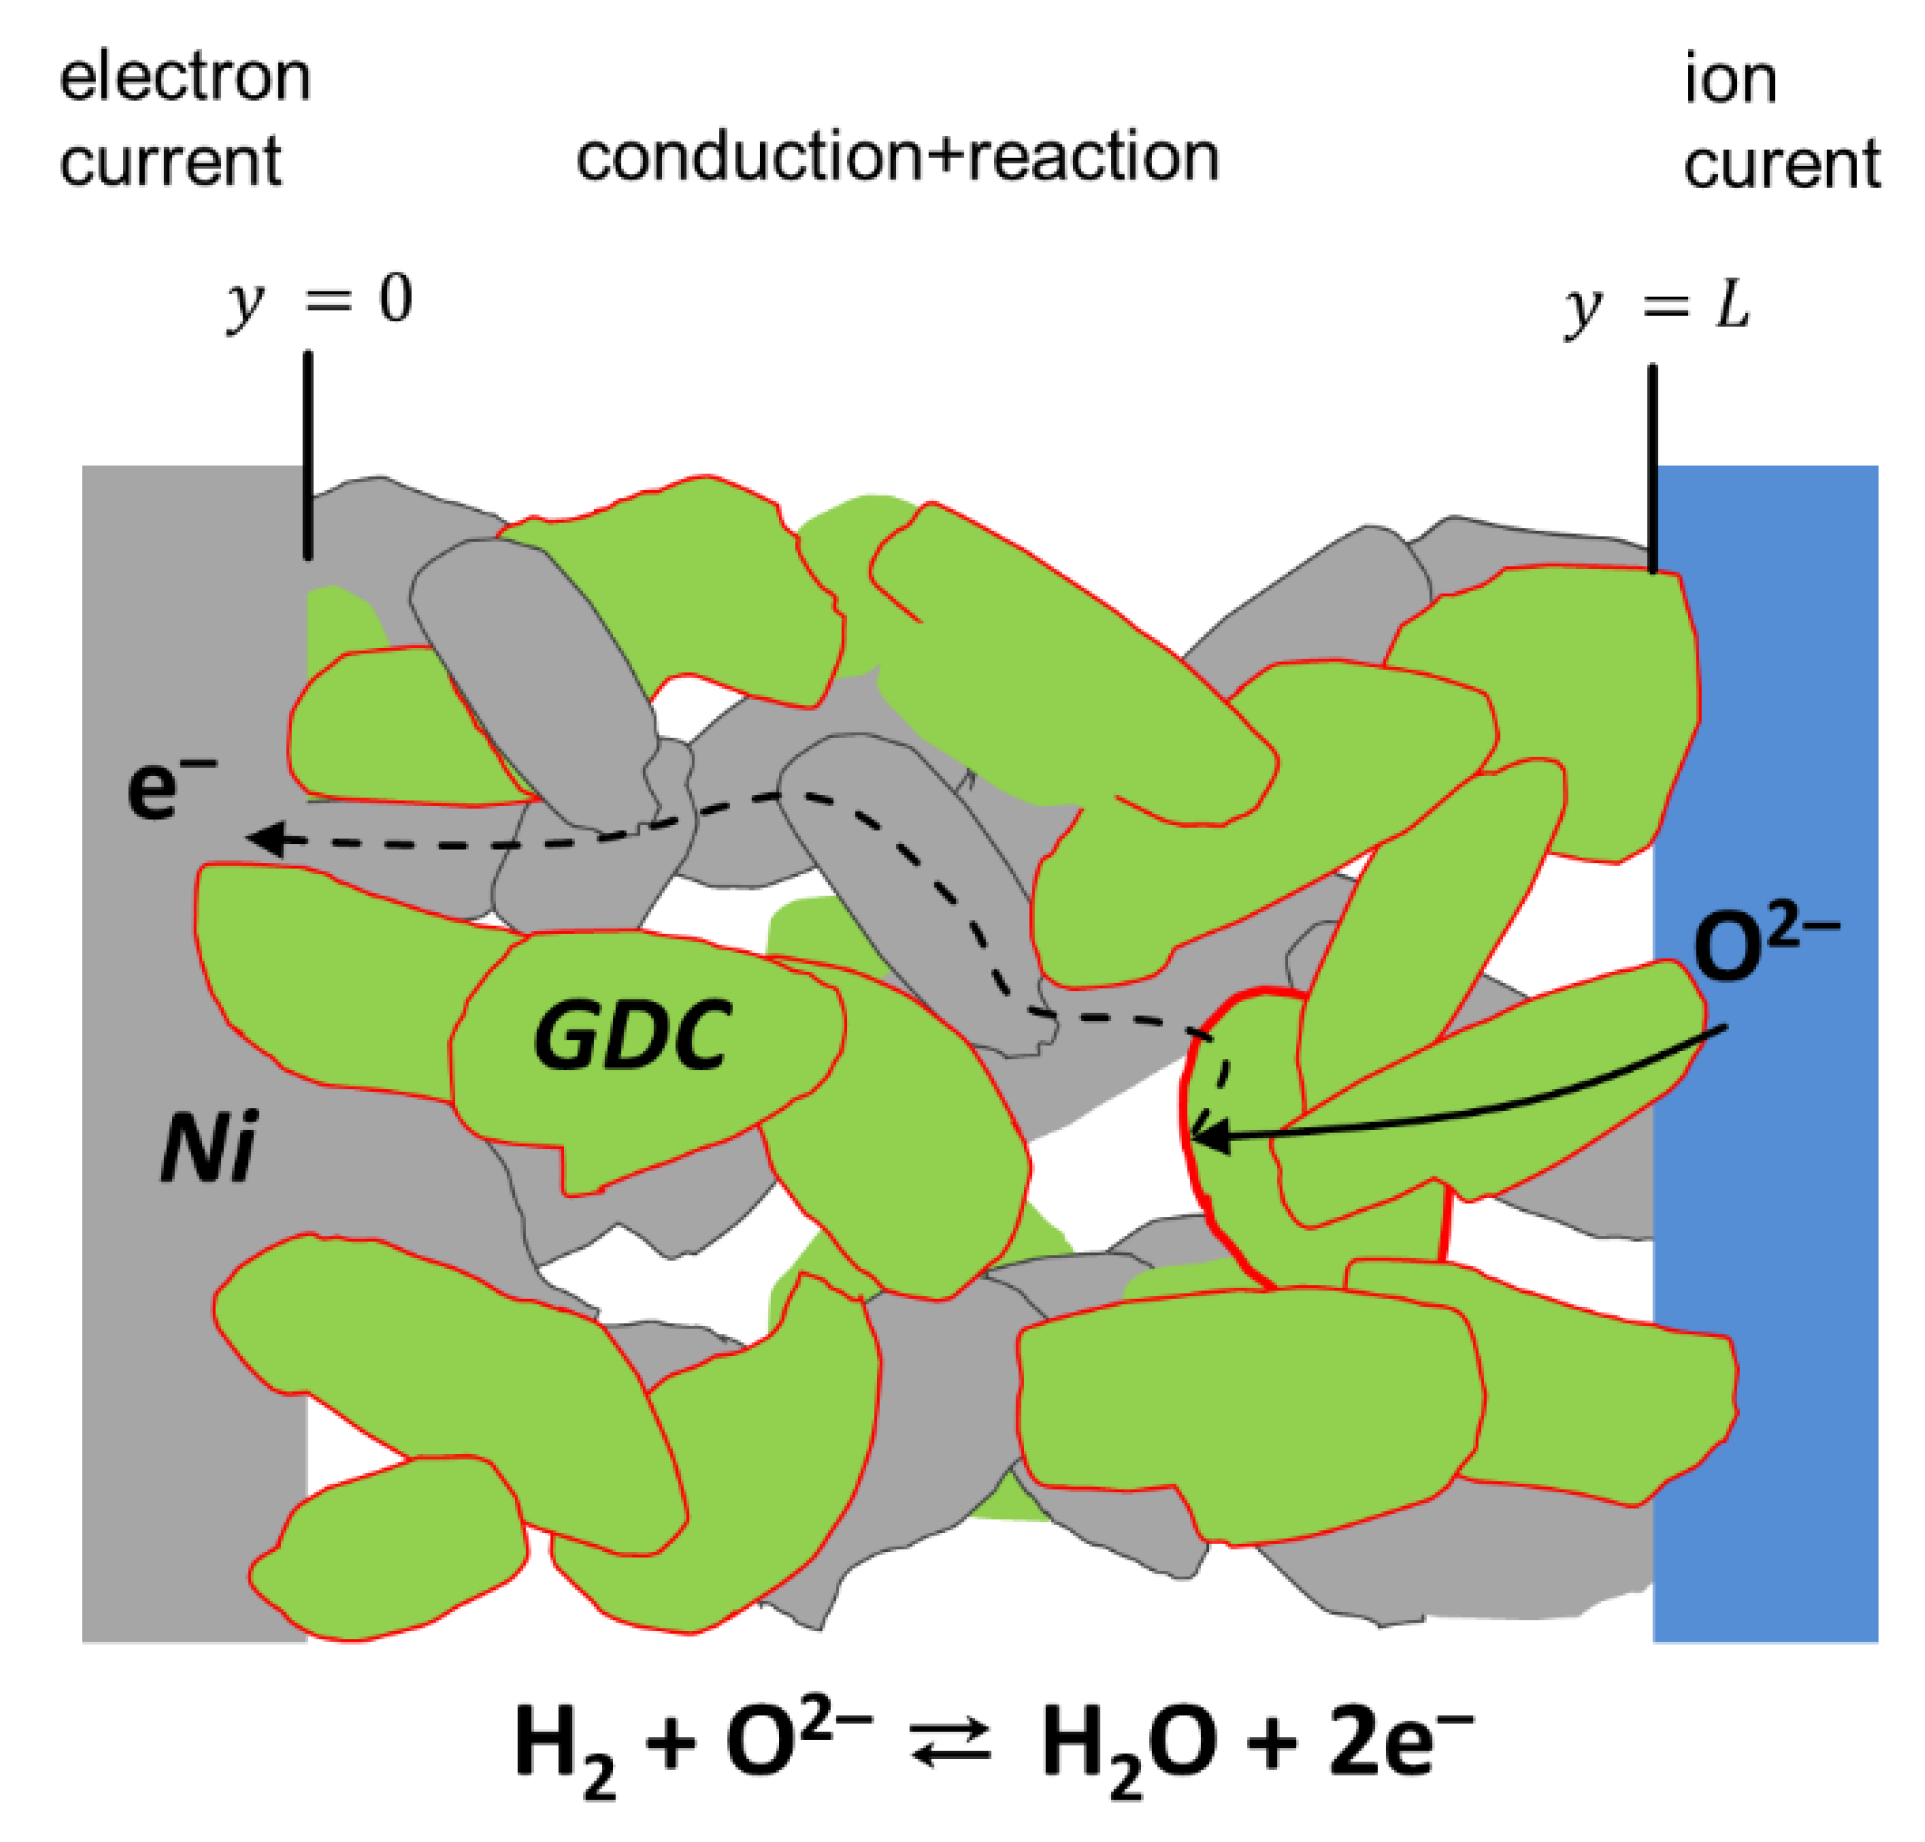
Porous SOFC electrodes either consist of a single-phase mixed ionic and electronic conductor (MIEC) or composites of a mainly electronic conducing and a mainly ion conducting phase, and a vast amount of possible electrode materials is found in the literature [35,36,37]. Although this paper focuses on experimental data of Ni/Ce0.9Gd0.1O1.95-δ anodes, the equivalent circuit model derived here is based on the general conduction and reaction processes that happen in any effective mixed ion and electron-conducting material with small-grained microstructure. The term ”effective mixed conductor” means that the electrode material may be either a single-phase mixed conductor (e.g., LSCF), a mixture of MIEC and ion conductor (e.g., LSCF/GDC composite for cathodes) or a mixture of mixed conductor and electron conductor (e.g., Ni/GDC composite for anodes), as well be a mixture of electron and ionic-conducting phases, such as in Ni/YSZ or LSM/YSZ. For treating the electrode as an effective MIEC, the average particle size must be much smaller than the electrode thickness. In this case, the electrode can be approximated as a continuous phase with effective microstructural properties, such as average porosity, effective ion/electron conductivity or specific surface area, and triple-phase-boundary length. Without restriction of generality, we now focus on porous Ni-GDC cermet electrodes. Due to the mixed conductivity of GDC in reducing conditions, the entire surface of the GDC particles is electrochemically active, and we can neglect the resistance short-range electron transport from the reaction site (GDC surface) to a neighboring Ni particle, sketched in Figure 1.
The general processes that happen in a porous Ni-GDC electrode are sketched in Figure 1. Oxygen anions move from the electrolyte into the GDC phase. Electrochemical hydrogen oxidation happens at the entire GDC particle surface [18]. Without implying a specific electrode material or reaction mechanism, the fuel side oxygen reduction reaction is given by
The rate of electrochemical hydrogen oxidation is proportional to the oxide ion current density that is converted into an electronic current. With impedance spectroscopy, we apply a small AC signal (typ. 10–20 mV) to the cell. In this case, the electrical oxide ion current density originating at the electrode surface (jsurf) is in good approximation proportional to the voltage (linear regime). The driving force for the hydrogen oxidation reaction ΔRGox depends on the electrochemical potentials of the reactant species (Reaction 1) by
Therein, and are the electrochemical potentials of oxygen anions and electrons, respectively. Although atomic oxygen is neither present in the gas phase nor in the oxide, its chemical potential (μO) can be formally calculated, either from electron and oxygen ion electrochemical potentials or from the gas phase species. This mathematical step simplifies the equations describing electrochemical reactions. For the sake of simplicity, we will assume fast gas phase diffusion, which means that atmospheric composition and, therefore, remains constant, and the oxygen exchange driving force can be expressed by deviations from the equilibrium in the form of
Delta symbols refer to the difference from a grounded electrode, which is in equilibrium with the gas phase (i.e., no net oxygen exchange proceeds). When voltage is applied to a porous electrode, the driving force for hydrogen oxidation is not constant throughout the electrode but depends on the distance from the electrolyte (y-coordinate, as indicated in Figure 1), due to the overpotentials from electron and ion conduction. On a macroscopic scale, the effective conductivity of a species x is related to bulk conductivity and microstructure by [38,39,40,41]
where τ and ε are tortuosity and volume fraction of phase x, respectively. These parameters may be gained from tomographic techniques [38,40,41,42,43]. When both electrical fields and chemical driving forces are present, the electric current density of a species can be linked to a gradient in its electrochemical potential by
With the definition of the y-axis sketched in Figure 1, the electrical current within the electrode is positive for anodic bias. In order to simplify the equations that describe the impedance, it is useful to introduce a pseudoelectrical potential ϕµ, which is proportional to the electrochemical potential and the unit of volts, which simplifies transport equations.
This step simplifies the drift-diffusion equation to a simple conduction equation in the form of
Oxygen ions and electrons can have different pseudoelectrical potentials at the same location when the electrode is not in equilibrium with the gas phase. This becomes evident when we express the hydrogen oxidation driving force in terms of
For treatment in an impedance model, it is also useful to express the chemical driving force for hydrogen oxidation by a local overpotential η, which has a unit of volts and varies with distance from the electrolyte. The oxide ion current density that is reacting at the GDC surface (jsurf) is proportional to the net rate of the surface oxygen exchange reaction (here, H2 oxidation), which is in turn proportional to the overpotential
where ASRsurf is the GDC area-specific resistance normalized to the surface area of GDC. Its value can be measured by impedance spectroscopic studies of dense thin film model electrodes [18,44,45]. When oxygen anions are released into the gas phase in the form of H2O (Equation (1)), the ionic current is converted to electron current. Moreover, the oxygen nonstoichiometry in the oxide phase may vary with the local overpotential.
These electrochemical reactions are the reason why ion and electron current density depend on the distance from the electrolyte. As charge neutrality must remain preserved, the sum of electron and ion current density (jel) does not depend on the y coordinate, expressed by
Although the oxygen anion current density varies with distance from the electrolyte, the number of oxygen atoms and electrons in total is conserved. Hence, divergence (dependence on y-coordinate) in the oxygen anion current is either related to the hydrogen oxidation reaction (Equation (1)) (gas phase oxygen has no charge and does not contribute to the current) or a change in the oxygen anion concentration within the GDC phase, which is written as
The reaction current density jreact is positive for the hydrogen oxidation reaction and is proportional to jsurf times the GDC surface area per unit volume Aspec, which is expressed as
Note that the unit of jreact is A/cm3, although the reaction actually takes place on the surface of the GDC phase. However, we treat the electrode as an effective medium with an effective specific surface area Aspec. This quantity can, for example, be measured by tomographic methods [38,39] or Brunauer-Emmett-Teller (BET) measurements.
When an AC signal is applied, the (volumetric) concentration of oxygen anions within the GDC phase (cion) also varies with time, so the second term in Equation (11) becomes important and leads to a capacitive current density jcap expressed by
This current is proportional to the change of the overpotential with time, which is characteristic for a capacitive current. Hence, we can introduce the chemical capacitance, which is a measure for how much the oxygen anion concentration in the GDC phase depends on the overpotential, and can be expressed by [46,47,48]
Using the chemical capacitance, we can write the capacitive current density in the form of
Although capacitive currents are irrelevant in DC operating conditions, the chemical capacitance is a key parameter for describing the defect chemistry of mixed conductors, which is a measure of the oxygen nonstoichiometry of a mixed conducting material. The formal oxygen partial pressure in the GDC phase and overpotential are linked by Nernst’s equation, which can be written in differential form as . The oxygen nonstoichiometry δ in the stoichiometric formula Gd0.1Ce0.9O1.95-δ is connected to the volumetric anion concentration cion and the molar volume Vm by
This term is proportional to the slope in an oxygen nonstoichiometry isotherm. Such measurements are in large quantity and good reliability available for pure and acceptor-doped ceria [49,50,51], as well as for common mixed conductors used in SOFC cathodes, such as LSC and LSCF [52]. In cases where defect interactions are weak or known, the chemical capacitance is also a measure for electronic and ionic point defect densities [47], which are also in detail described for doped ceria [16,46].
So far, we have derived equations that describe how conduction and reaction currents depend on spatial and temporal variations of the electrode overpotential. In order to derive impedance functions, we need boundary conditions for both electronic and ionic currents at the electrode-electrolyte and electrode-current collector interfaces.
At the electrolyte interface (y = 0), the entire current is carried by oxygen anions, expressed by the equation
At the top of the electrode (current collector interface, (y=L)) the entire current is carried by electrons expressed by an open circuit in the r.h.s. end of the ionic rail or the equation
For calculation of the electrode impedance, we can assume a fast-conducting electrolyte with a reversible, grounded counter electrode, which means that the pseudoelectrical potential of oxygen anions is constant at the electrolyte interface
At the electronic current collector, the AC signal of the impedance analyzer is applied:
and the impedance of the electrode is then the current divided by the voltage:
The analytic solution of a mathematically isomorphic set of differential equations to derive Z was already done in the literature, e.g., by Bisquert et al. [28,53], who applied a very similar model to electrodes immersed in a liquid electrolyte. Here, we will therefore not focus on more complicated mathematics but rather explain how these equations are translated into a more intuitively understandable equivalent circuit model. Additionally, we will elaborate how the parameters depend on materials properties and microstructure.
2.3. Equivalent Circuit Representation of Reactions in Porous Electrodes
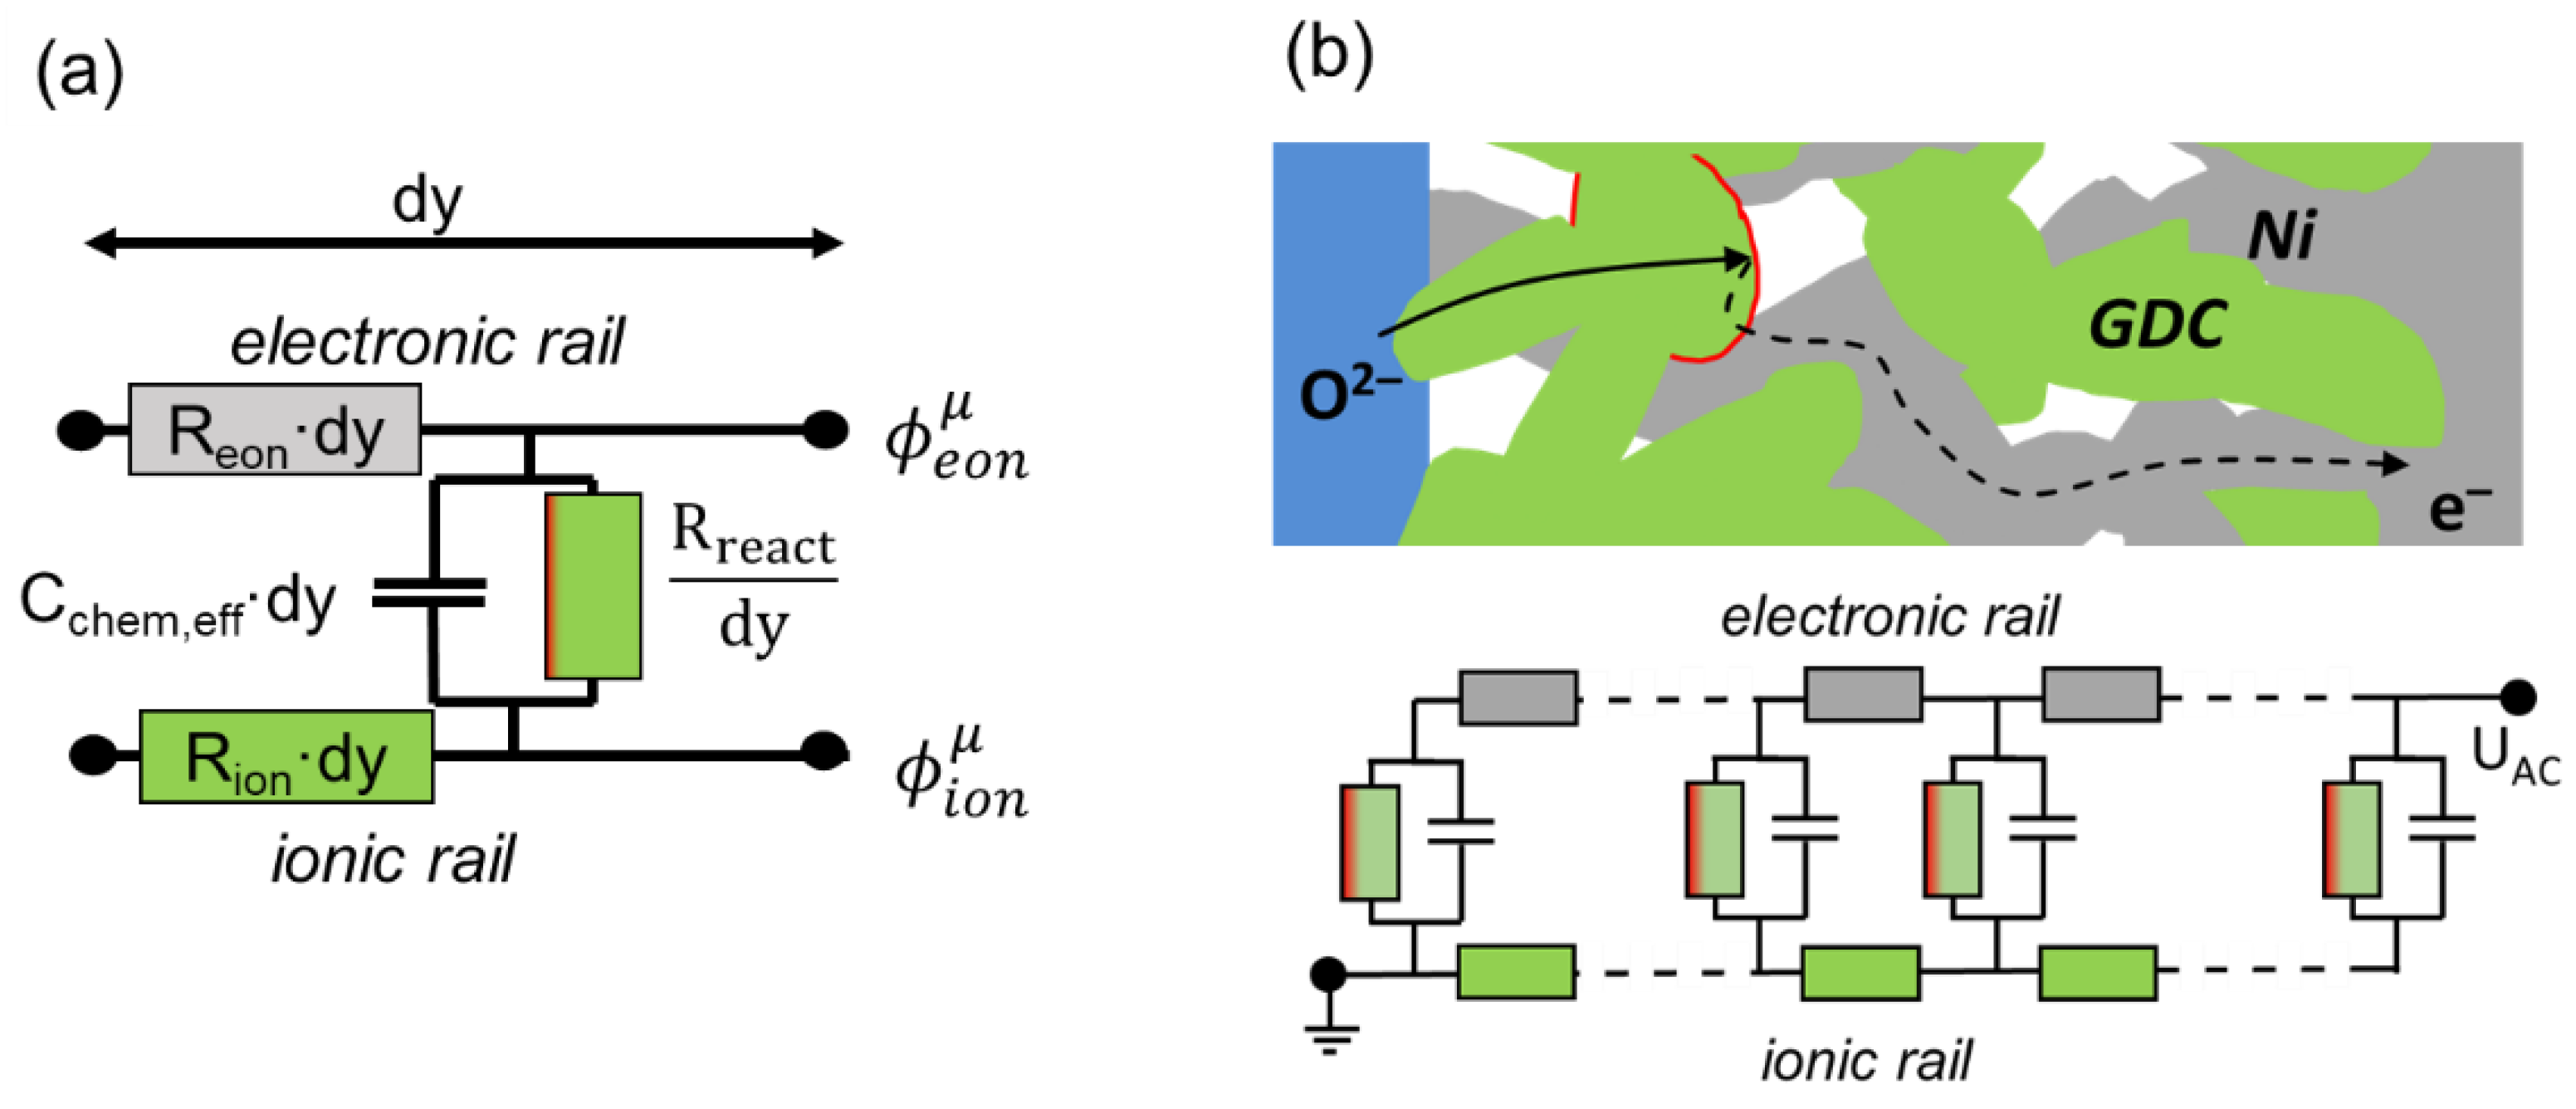
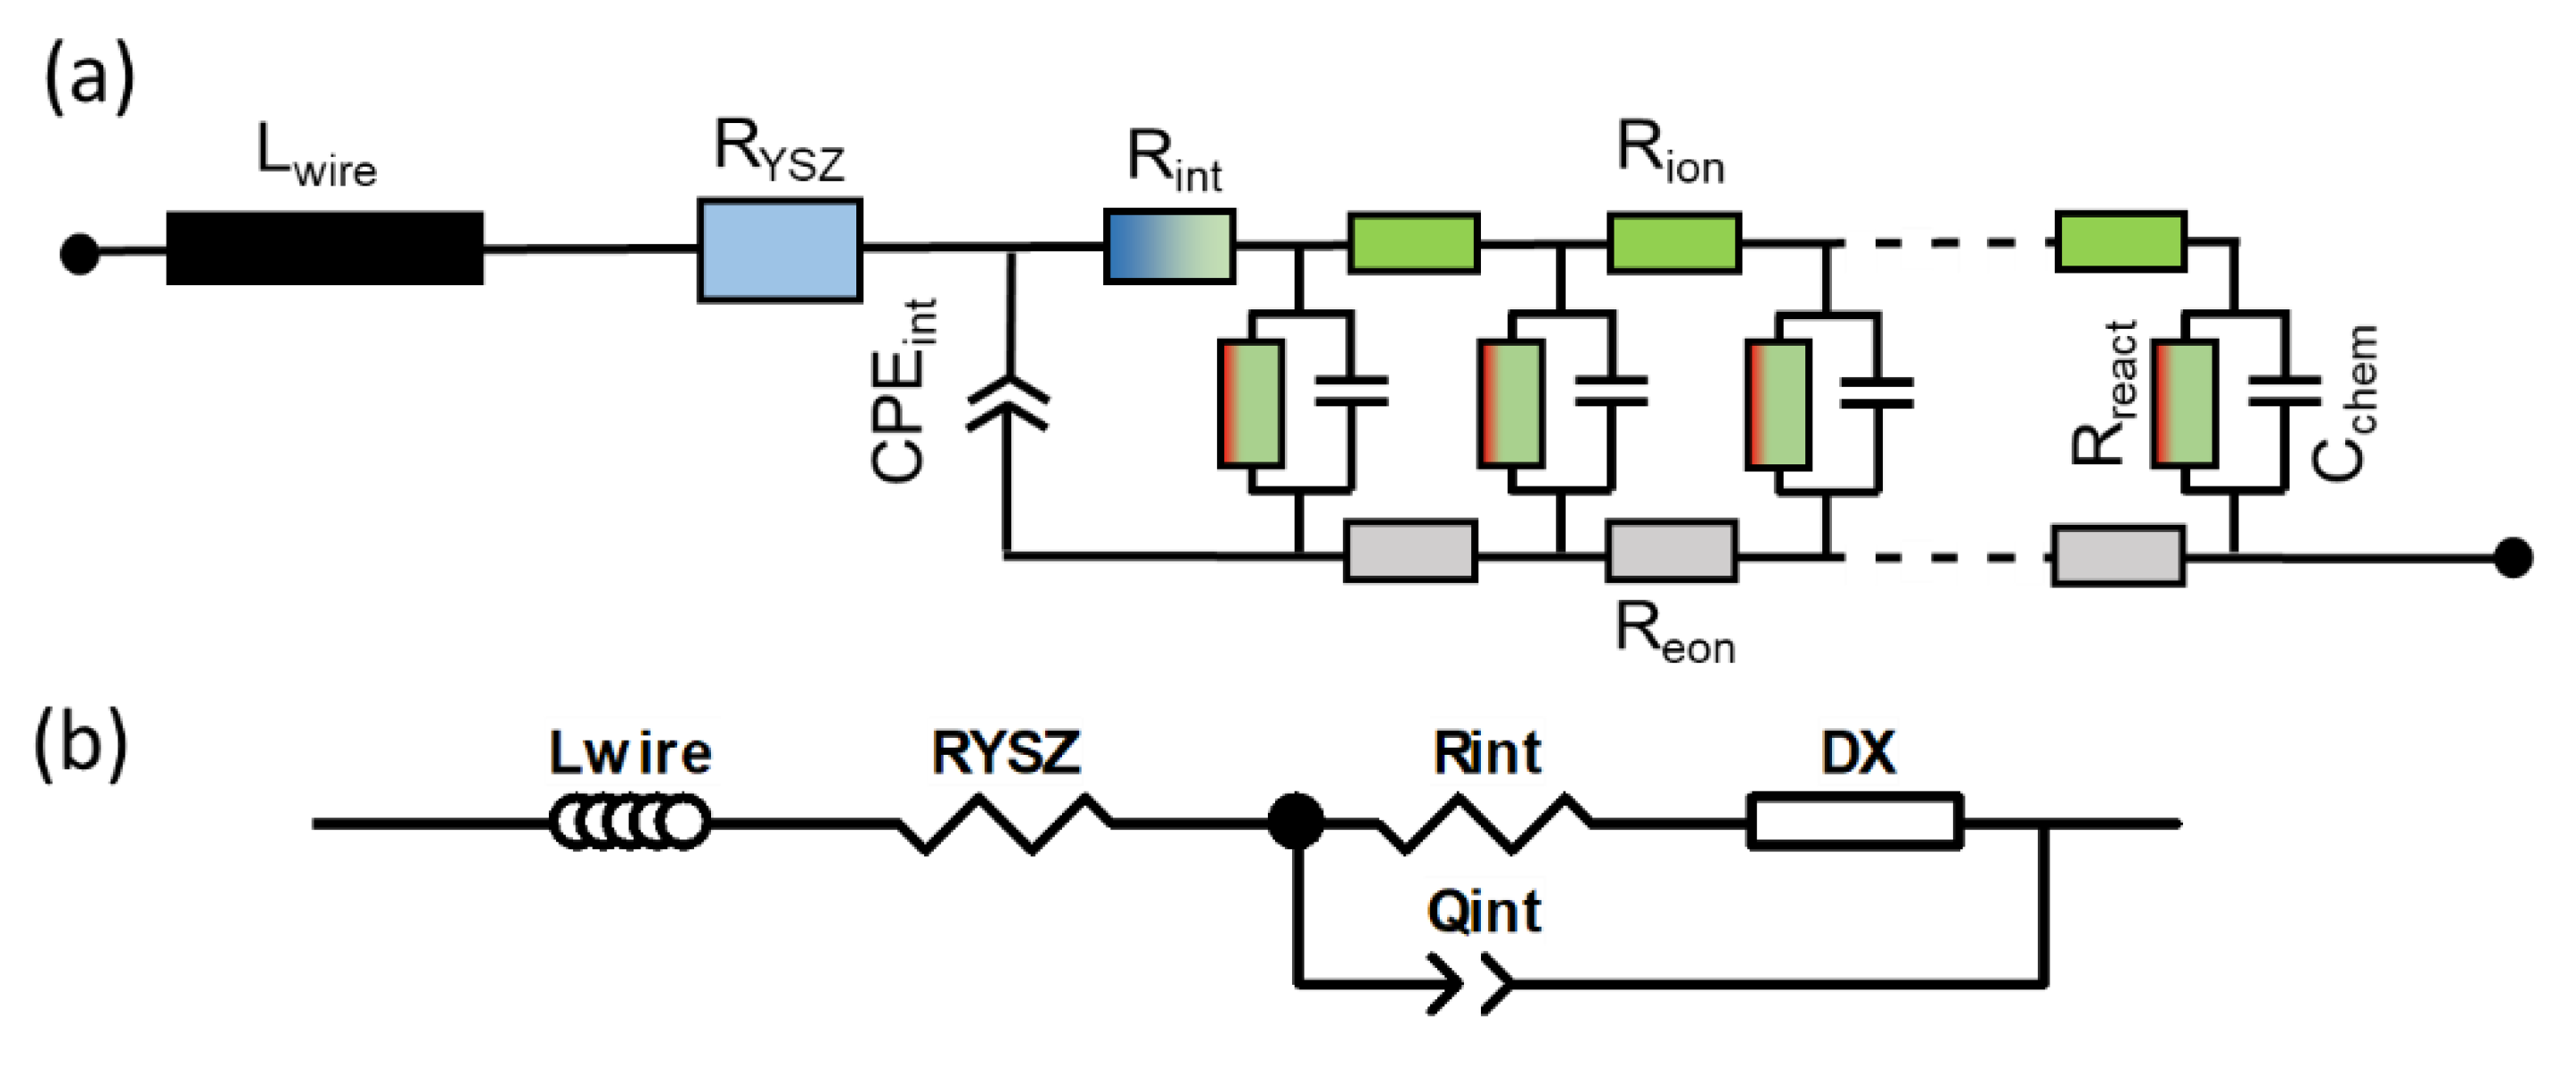
Although the differential equations presented above are sufficient to describe the impedance of a porous electrode, as shown, e.g., by Adler et al. [21,23], the representation of these equations in the form of an equivalent circuit describing the impedance per unit area is more intuitive. This equivalent circuit model is a connection of differentially thin slices of the electrode in a transmission-line-type circuit. First, we look at an infinitesimally thin slice of thickness dy, as sketched in Figure 2a.
The circuit model consists of two rails expressing ion and electron conduction. The voltage at each rail represents the pseudoelectrical potentials of ions and electrons, which vary with distance from the electrolyte (y-coordinate). The voltage between ionic and electronic rail equals the local overpotential η, according to Equation (8), which is the driving force for the oxygen exchange reaction. The coupling between ion and electron currents through electrochemical reactions is represented by the vertical resistor and capacitor elements Rreact and Cchem,eff. The local “voltage” between the electronic and ionic rails is the overpotential η. The values of Rion, Reon, Rreact and Cchem,eff depend on the conduction and reaction laws, as follows:
The ion conduction resistance Rion is proportional to the gradient in the ion quasielectrical potential, expressed by
By combining Equations (22) and (5), we obtain
where σi,GDC is the ionic conductivity of bulk GDC. If the electrode contains percolating nickel particles, electron conduction happens primarily through the Ni phase. The very short (<1 μm) electron transport distance from the reaction at the GDC surface is negligible. In this case, the resistance of electron conduction can be analogously defined as
The resistance of surface oxygen exchange is given by dividing the local overpotential through the local reaction current, which can be expressed by Equation (12):
where Aslice is the GDC surface area of the thin slice. The effective chemical capacitance Cchem,eff is proportional to the capacitive current density divided by the change of overpotential with time and can be expressed using Equation (15):
The equivalent circuit representing a full electrode is a serial connection of the infinitesimal elements, sketched in Figure 2b. The boundary conditions given in Equations (17)–(20) are realized by the terminals. On the left-hand side, the current enters in the ionic rail because the electrolyte only conducts ions, and the ion overpotential is zero. On the r.h.s (interface to the current collector), all currents are electronic, and the electron overpotential equals the applied AC voltage.
The impedance of the transmission line circuit was already derived mathematically in literature by Bisquert et al. [28], with the rather bulky equation
where
In many electrodes, the effective electronic conductivity is quite high (>> 1 S/cm) (such as in Ni-GDC), and electron transport in the y-direction therefore contributes far less than 1 mΩcm2. In this case, the impedance can be approximated by setting Reon to zero, leaving the much easier impedance function
Fitting measured impedance spectra with this impedance function delivers effective parameters for Rion, Reon, Rreact and Cchem,eff. These fitting parameters depend on microstructural and material specific properties, as given by Equations (23)–(26). Consequently, when microstructural parameters are known, the EIS fit delivers information on materials-specific parameters, and when material-specific parameters are known, impedance fitting can provide microstructural information, e.g., for the tortuosity factor, as elaborated in Section 4.4.
2.4. The Need for Parameter Constraints in “Thick” Electrodes
Especially electrodes with high kinetics used in real fuel cells have sufficient electronic conductivity to be described by Equation 29. Additionally, they are usually significantly thicker than the electrochemically active thickness (). Under these conditions, one can approximate coth(x > 2) ≈ 1. With this approximation, Equation (29) can be simplified. The resulting impedance function is isomorphic to the Adler-Lane-Steele model (see Appendix C for details) [21] and Gerischer’s impedance [54], reading
with
This expression for the impedance is, however, over-parametrized, because Gerischer’s impedance function has only two parameters, whereas three parameters are used in the mechanistically motivated equivalent circuit. Consequently, the microscopic parameters Rion, Rreact and Cchem,eff in “thick” electrodes are only accessible by an equivalent circuit fit when one of them is known from a complementary measurement method.
The chemical capacitance, expressed by Equation (14), can be calculated quite reliably from oxygen nonstoichiometry isotherms from thermogravimetric analysis (TGA), which is available in the literature for GDC [50,51]. Additionally, when the ALS model [21] is applied to porous electrodes, a quantity that is related to the chemical capacitance (therein called the thermodynamic factor of oxygen ions) needs to be known from complementary TGA measurements.
The effective oxygen anion conductivity and oxygen exchange reaction resistance are, on the other hand, more difficult to predict, because they depend on microstructural parameters, such as specific surface area and tortuosity, which are hard to measure, especially for small grain sizes. Furthermore, impurities at surfaces and grain boundaries can have a strong effect on the Rreact and Rion.
2.5. Treatment of Interfacial Resistances and Wiring
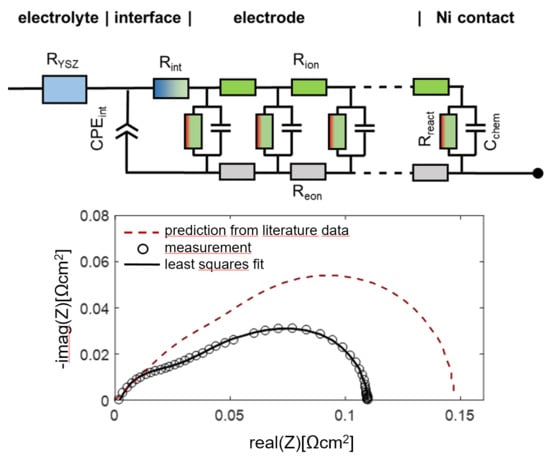
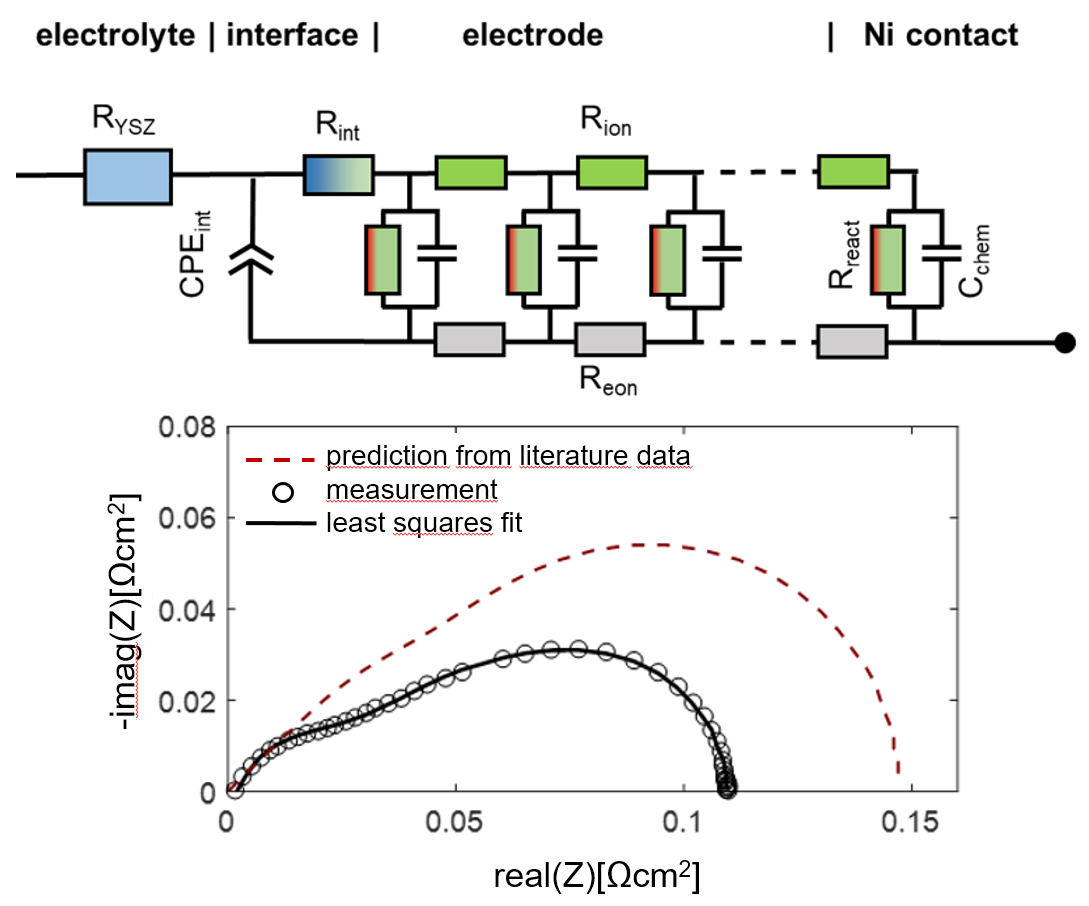
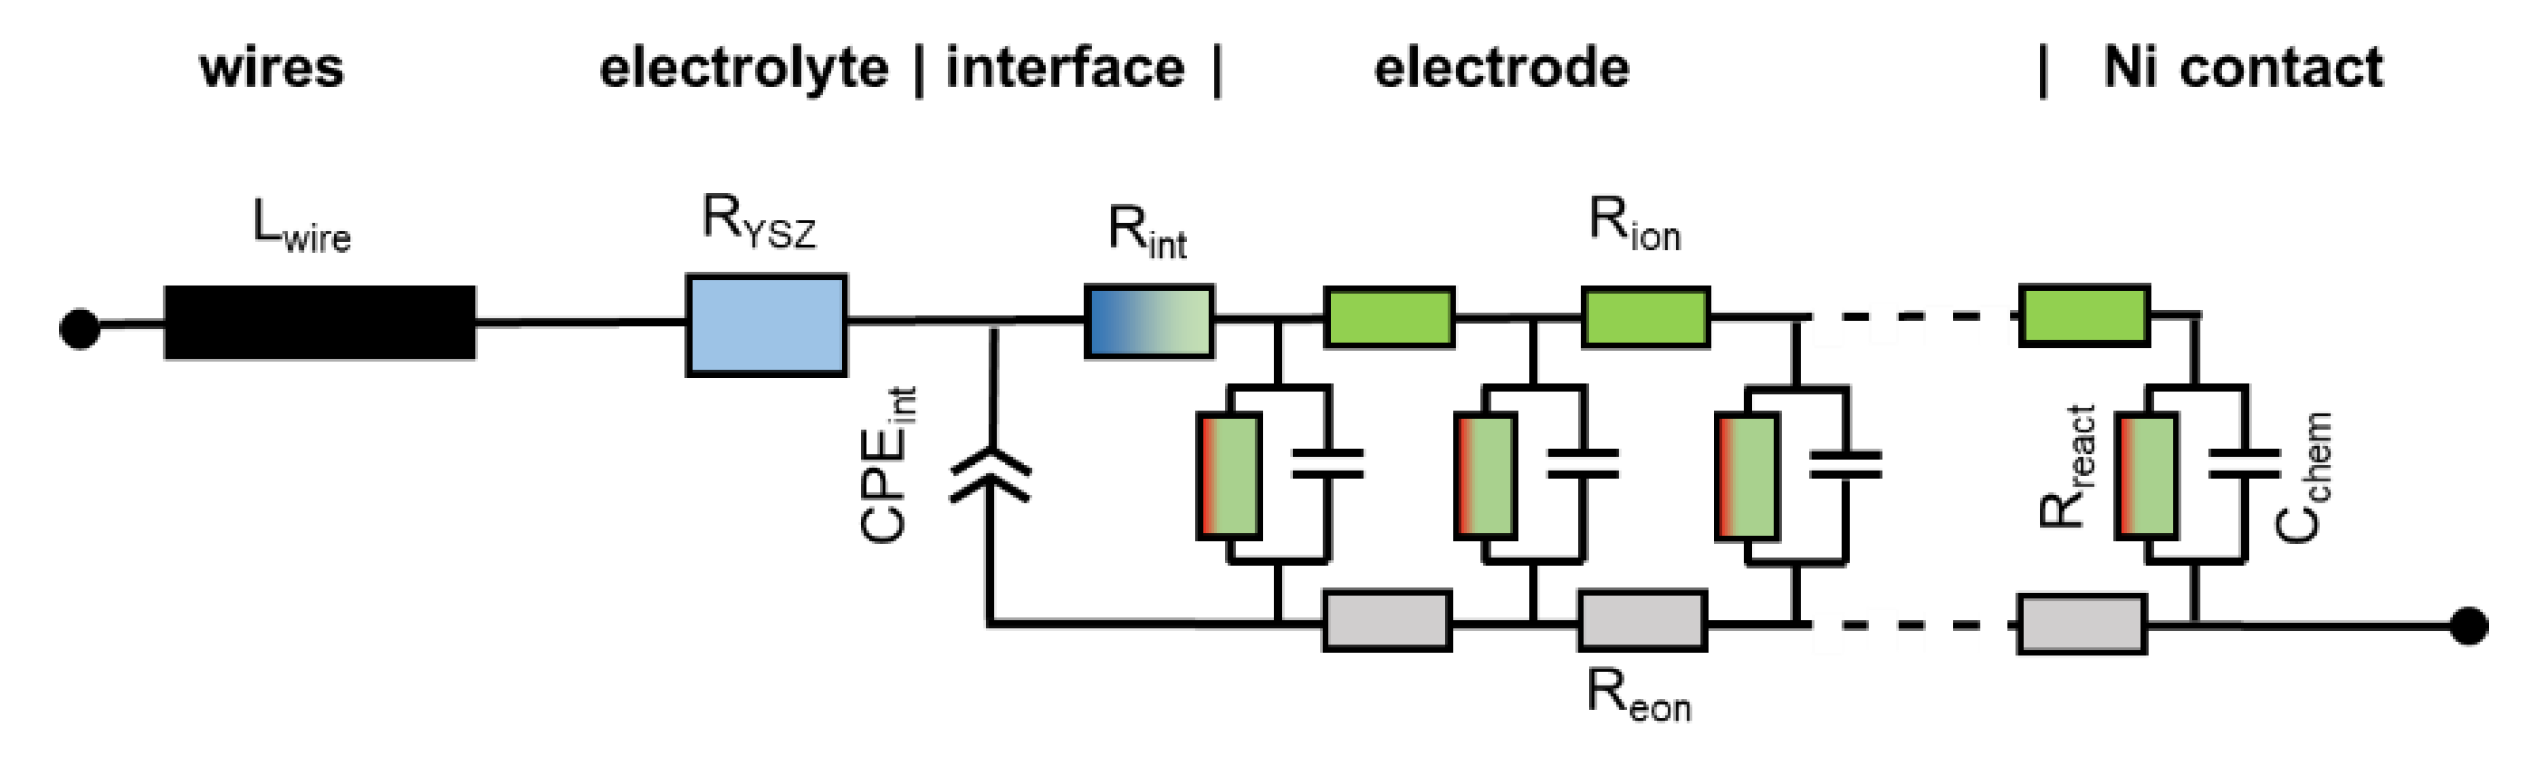
When electrodes are screen printed and sintered on an electrolyte substrate, interdiffusion of cations and/or weak sintering necks of the ion conducting phase towards the electrolyte can cause additional interfacial resistive and capacitive effects to the electrode impedance. For proper fitting of experimental impedance spectra, interfacial resistances and capacitances must thus be added to the equivalent circuit in Figure 2b, as well as additional circuit elements for the resistance of ion conduction in the electrolyte and wiring inductance; the resulting circuit for fitting data is shown in Figure 3. In addition to the electrode transmission line, this circuit model also includes the element Lwire, representing the wire inductance, RYSZ for the electrolyte resistance, CPEint as a constant phase element for interfacial capacitance and Rint for the interfacial resistance. The interfacial resistances and capacitances depend on the cell preparation procedure; they are likely different for symmetrical model cells, in which the electrodes are sintered on a dense electrolyte, and full SOFCs, in which the electrolyte is sputter-deposited on top of the already sintered anodes (Plansee MSC concept [3,4,7,55,56]) or co-sintered with the anodes (in typical anode supported cells). However, when the ion conducting phase in the electrode is the same as the electrolyte, e.g., Ni/YSZ [24,30,34,57] anodes or for LSM/YSZ cathodes [33], the interfacial resistance is often negligible.
The impedance function of this circuit is given in Appendix A, Equations (A1) and (A2). For the technologically relevant case of an electrode with reasonably good effective electron conductivity, 1 S/cm is actually sufficient; the ASR of the electrode arc condition equals
which can be also expressed in the form of elementary parameters as
Therein, Rgas is the (so far neglected) ASR of gas diffusion, which depends strongly on the testing atmosphere, as elaborated in Section 2.8. In most technological cases, the thickness is much larger than the electrochemically active thickness, so one can approximate coth(L/λ) ≈ 1.
2.6. Simulated Impedance Spectra
The electrodes investigated in this study have a percolating Ni metal phase, so we can neglect the electronic transport resistance, and the transmission line impedance is described by Equation (29). For simulation of the spectra, the wiring inductance, gas diffusion and interfacial effects are also neglected, and typical parameters from the Experimental Results section are chosen: Rion = 200 Ωcm, Rreact = 5 × 10⁻⁵ Ωcm3 and Cchem = 3000 F/cm3, which results in an electrochemically active thickness of 5 μm. Corresponding impedance spectra for 2.5-μm and 15-μm-thick electrodes are plotted in Figure 4a, and the ASR of the electrode arc as a,function of thickness is plotted in Figure 4b. Only for thin electrodes with L ≤ 2λ, the ASR decreases with an increase of the electrode thickness and approaches a constant value if the thickness is further increased. More simulated impedance spectra, for which other parameters are also varied, are available in Reference [57]. Please note that the electrochemically active thickness in Reference [57] for simulated Ni/GDC cermets is much thicker, because different microstructural parameters were used.
2.7. Distribution of the Local Overpotential η and Electrochemically Active Thickness λ
When the electrode becomes thicker, more surface area and triple-phase boundary (TPB) length are available for electrochemical reactions, which lowers the ASR. However, the local overpotential η, which acts as the driving force for the electrochemical surface reaction (Equation (8)), is a function of the distance from the electrolyte and electrode thickness. It decreases with distance from the electrolyte. For thin electrodes, the overpotential is almost constant, whereas it comes close to zero at the surface of thick electrodes. By solving the differential equations above, we get the position dependent overpotential (as derived in Reference [58]):
where y is the position (0 = top of electrode and L = electrolyte interface), and U0 is the total overpotential over the electrode.
The calculated DC distribution of overpotential for U0 = 10 mV is plotted in Figure 5 for 2.5 and 15-μm-thick electrodes. Rion and Rreact are equal to the simulation used in Figure 5. With increasing distance from the electrolyte, the overpotential decreases. This effect is much more pronounced for thick electrodes, where the ASR becomes independent of electrode thickness. A very thick electrode might have a larger ASR, due to increasing gas diffusion resistance, which is elaborated in the following.
2.8. Prediction and Minimization of Gas Diffusion Resistances
Especially in SOFC anodes, gas phase diffusion may very easily cause an additional arc or increase the resistance of the electrode arc. Gas diffusion requires more attention in anode impedance testing, because two gas phase species (H2 and H2O) need to diffuse to and from the reaction site. This causes a concentration polarization, which increases the overall ASR of the electrode. Gas concentration gradients occur in both anode active and anode support layers of SOFCs. Since the active layer is typically much thinner than the anode supporting layer (10–20 µm versus 0.5–2 mm), the gas diffusion ASR in the support structure with rather large pores (>1 µm) dominates, except for electrodes with almost fully dense or very thick functional layers [30]. The impact of gas diffusion on the anode impedance is elaborated, e.g., in Reference [30,59]. For mixed conducting electrodes with rather slow (1–50 Hz) dispersion frequencies, gas diffusion and electrode dispersion arcs overlap, whereas, for Ni/YSZ electrodes with fast dispersion frequencies (>>100 Hz), a well-separated gas diffusion arc appears [56]. Since the full treatment of gas diffusion increases the complexity and number of parameters in the circuit model so much that an analytical solution and a least-squares fit becomes virtually impossible, the optimal strategy is to minimize the effects of gas phase diffusion for impedance testing. This is achieved by optimization of electrode contacting and atmospheric conditions. For this task, diffusion overpotentials are important.
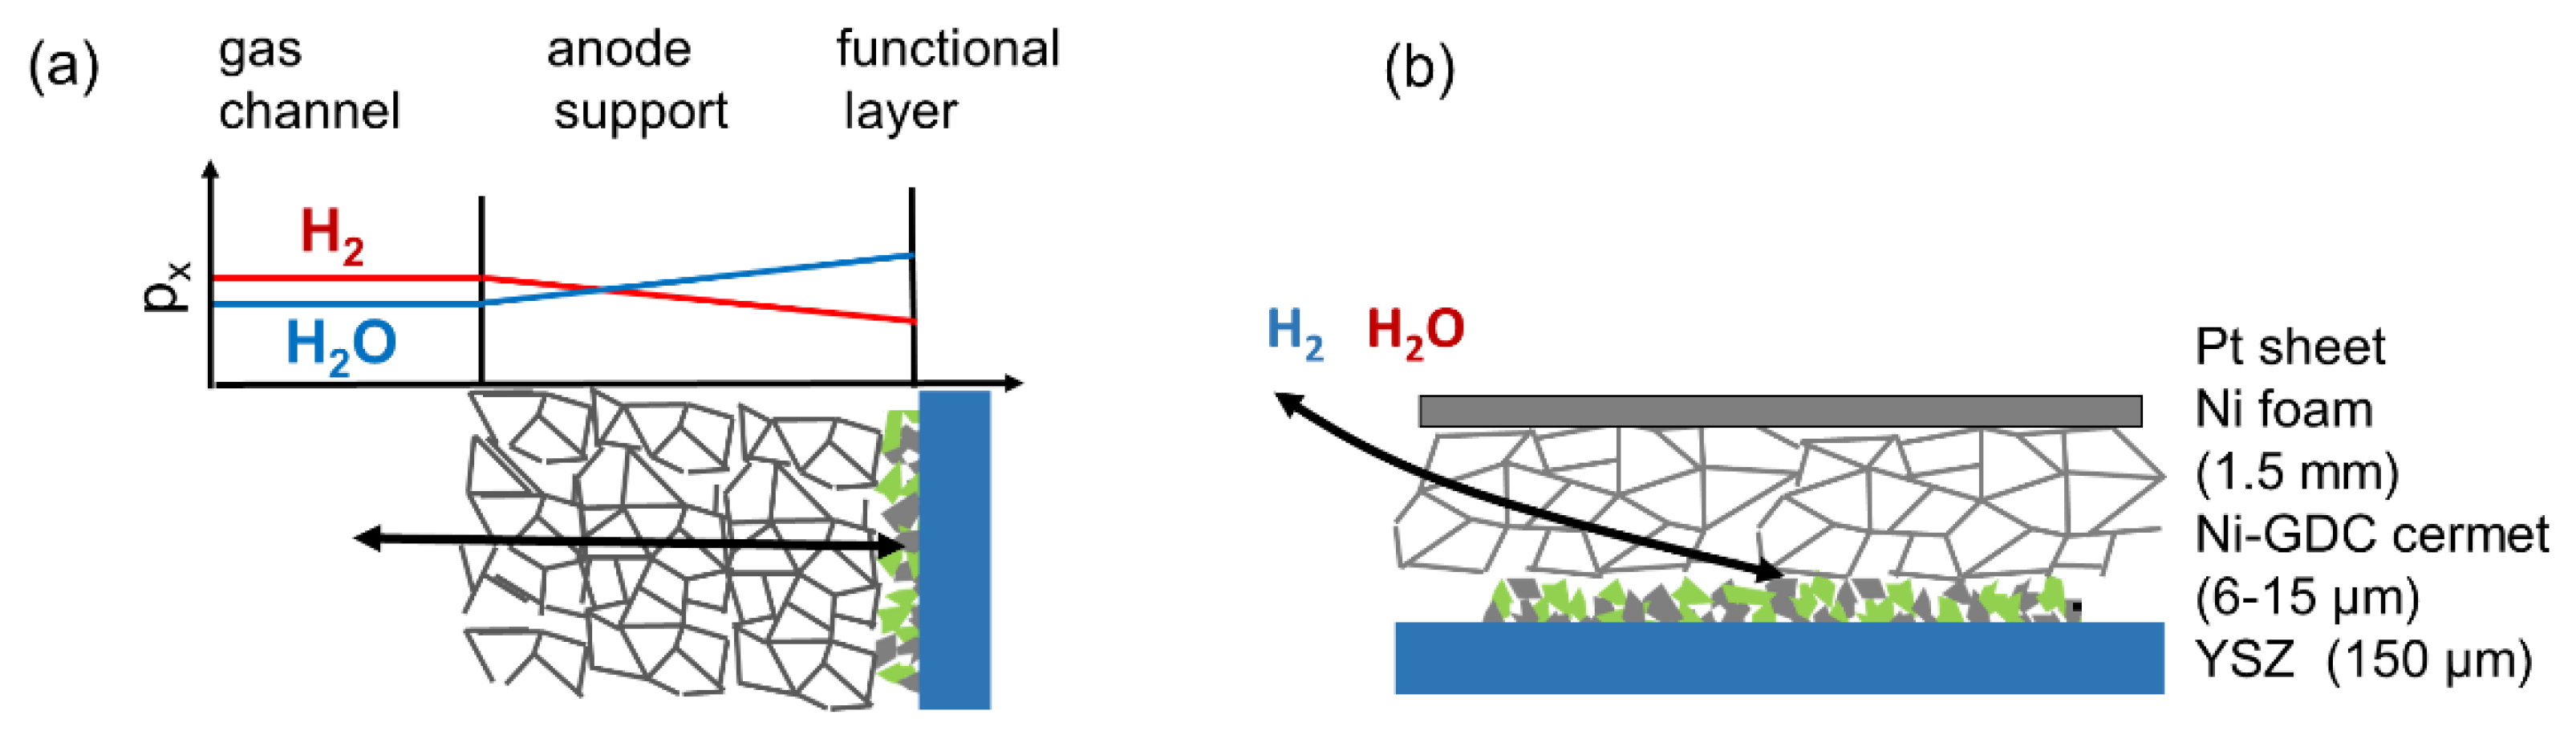
Finite gas phase diffusion kinetics cause a gradient in the gas phase oxygen partial pressure, which is expressed as a varying H2 : H2O mixing ratio in the anode, as sketched in Figure 6. For typical configurations with a comparatively thick support structure and thin active layer, the major partial pressure gradient is located in the support structure. For the sake of simplicity, we thus assume no pressure gradients in the electrode active layer and restrict the gas diffusion only to DC conditions, where the gas diffusion resistance acts like a serial resistor to the transmission line of the electrode. The molar flux of a gas species x through a porous medium of length l can be expressed as
where jmolar,x is the molar flux density of gas species x, Dx is the diffusion coefficient, Δpx the partial pressure difference between both ends of the porous structure and l the diffusion distance.
In DC conditions, the molar flux of a reacting gas species is coupled to the current density through the electrochemical cell (jel) by
where ze is the number of electrons in the reaction, and υx the stoichiometric coefficient of H2 or H2O in the hydrogen oxidation reaction (Equation (1)). For this reaction, ze = +2, υH2O = +1 and υH2 = −1. In the case of the O2 release reaction, ze = +4 and υO2 = +1. Accordingly, anodic bias causes a positive molar flux of H2 (to the anode) and negative molar flux of H2O (away from the anode). The pressure gradient of each reacting gas species at the cell operation causes a change in the p(O2) at the electrode active layer. This p(O2) change can be expressed as a gas phase overpotential ηgas given by Nernst’s equation (with px0 being the equilibrium partial pressure):
For recording impedance spectra, the AC voltage is ~10mV, which is sufficiently small to linearize all exponential or logarithmic terms using the relation for x << 1. By this, we yield
When we divide the diffusion overpotential by the cell current, we get
Thus, the ASR of the gas phase diffusion can be analytically expressed and depends on the partial pressures of the reacting gases and their diffusion coefficients, as well as the geometry of the diffusion channels in the electrode supporting structure.
For anode gases, the diffusion overpotentials of hydrogen and water add up, meaning that their diffusion ASR values also need to be added for calculating the effective H2-H2O diffusion ASR. The linear approximation of the diffusion ASR is only valid for a small concentration overpotential in the gas phase.
In the case of high current densities, a gas phase diffusion limiting the current density can be calculated by Equations (33) and (34) and, assuming that the pressure at the electrode active layer approaches zero, yields
Hence, H2 diffusion determines the positive limiting current (for SOFC mode), and H2O diffusion determines the negative (SOEC mode) limiting current. For quantifying the gas diffusion kinetics of a given electrode, it is therefore possible to strongly dilute the gas phase until the gas phase diffusion limitation is observed.
2.9. Gas Diffusion ASR for Typical Testing Conditions
In the anode support structure with pores > 1 µm, the prevalent diffusion mechanism is binary gas phase diffusion, where the diffusion is dominated by a collision of gas molecules. Binary diffusion coefficients can be found tabulated in the literature, e.g., [60,61]. Often, SOFC anodes are supported on a porous substrate consisting of coarse Ni-YSZ cermet or high-temperature resistance metals. Typical geometrical parameters of such substrates are 40% porosity, 1mm thickness, a tortuosity factor of the pores of ca. 2 and operation at 750 °C [30,39,62]. For this geometry, binary diffusion coefficients and gas phase diffusion ASR values are calculated for common anode gas compositions (either used for lab tests or SOFC operation) and summarized in Table 1. (for comparison, diffusion coefficients for oxygen are also shown).
A very good anode has a polarization resistance below 0.1 Ωcm2 at OCV, so the gas phase diffusion ASR should be below 0.01 Ωcm2. In laboratories, safety regulations sometimes prohibit the use of pure hydrogen, and rather, dilute H2 in an inert gas (e.g., forming gas) is used. Furthermore, the humidification in many impedance-testing stations is limited to about 25 mbar, which is the saturation vapor pressure of H2O at room temperature. For such testing conditions with very dilute H2 and H2O gases, we expect a large diffusion ASR of ~0.27 Ωcm2. Working at high vapor pressures of both H2 and H2O minimizes the gas diffusion ASR. If this is not possible, due to H2O condensation on cold gas lines and flanges, another effective approach is to decrease the total pressure to ~50–200 mbar while keeping the H2 : H2O ratio close to unity. At low pressure, the binary diffusion coefficient is strongly enhanced, which can also produce a gas diffusion ASR of < 0.01 Ωcm2 (see Table 1; 45 mbar H2 + 25 mbar H2O).
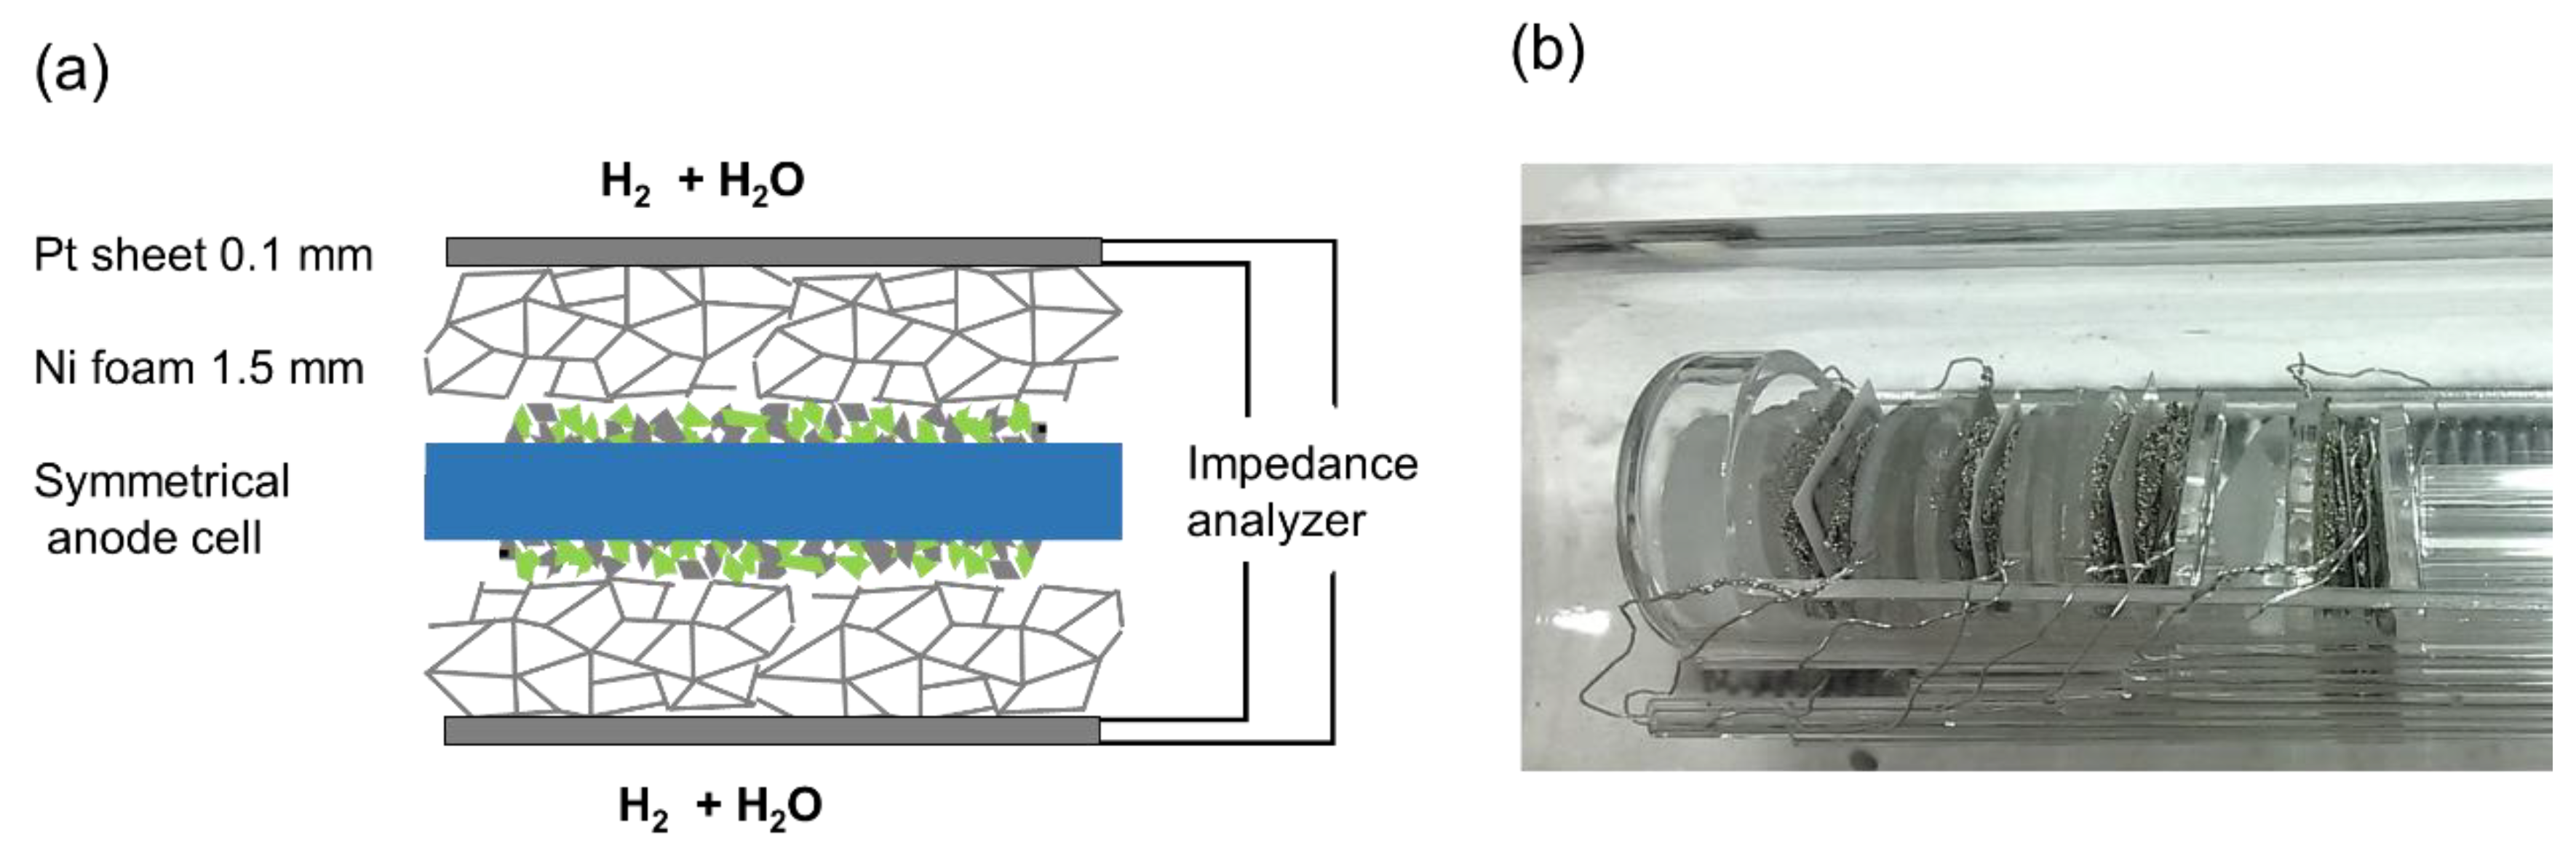
The diffusion geometry of a symmetrical cell-testing setup used in this (and most other) studies differs from a porous substrate. The model cells here were contacted between two layers of 2-mm-thick Ni foam (90% porosity) (see Figure 7). These different geometries are plotted in Figure 6b. Although the in-plane diffusion resistance in our testing setup is larger than in a typical anode support structure, the very high porosity of the Ni foam leads to a measured diffusion ASR that is very similar to the prediction for H2+H2O in the order of ~0.3 Ωcm2; see Results and Discussion.
3. Materials and Methods
3.1. Symmetric Cell Fabrication
For screen printing of electrodes, a paste was prepared from GDC10 powder (10 mol% Gd; manufacturer: Treibacher AG, Althofen, Austria) with a d50 of 270 nm and Ni powder, d50 = 1.73 µm. Both were mixed in a weight ratio of 40% GDC10 and 60% Ni with an ink vehicle based on terpineol with dissolved ethyl cellulose (45 cps, 4 to 8 wt%) as a binder. As a dispersing agent, 0.2–0.4 wt% Nuosperse FA196 (Elementis Specialities, Milwaukee, Wisconsin, USA) was added. For fabrication of symmetrical electrolyte-supported model cells, this Ni/GDC10 paste was screen printed on a 9x9 mm2 large area on both sides of 8YSZ-electrolyte sheets (thickness ≈ 150 µm, Kerafol GmbH, Eschenbach in der Oberpfalz, Germany). Subsequently the samples were sintered at 1100°C for 3 h in H2. The same paste and sintering conditions were also used for fabrication of high-performance metal-supported SOFCs [6,7,55].
For some of the symmetrical model cells, an additional GDC10 layer was deposited on the 8YSZ substrates by pulsed laser deposition (PLD) before electrode screen printing, in order to improve the quality of the interface and to increase the adherence of electrode and substrate. Deposition conditions were: 600 °C substrate temperature, laser energy 100 mJ (on the target), substrate target distance 9 cm, 10 Hz laser frequency and 10 min deposition time. The resulting layers were about 150-nm-thick and dense.
3.2. Impedance Spectroscopic Characterization and EIS Fitting
Impedance tests were carried out in a single-chamber impedance measurement setup, which allows simultaneous characterization of four symmetrical model cells by using a multiplexing device. This setup was homogeneously heated in a foldable tube furnace (Carbolite-Gero, Neuhausen, Germany). The chamber and cell holders consist entirely of fused silica, Pt wires and Ni foam for electrode contacting, as shown in Figure 7. In order to minimize the gas phase diffusion impedance, several optimizations were made in the testing setup. Firstly, a highly porous Ni foam (95% porosity, 1.5-2-mm-thickness) was used for the contacting of electrodes. This soft foam additionally ensures very good electrical contacting, in order to avoid any possible electronic sheet resistance effects. The feed gas line was kept at room temperature, which limits the humidification level to 25–30 mbar. In order to increase the diffusion coefficient of H2 and H2O molecules, typical electrochemical tests were carried out at a reduced pressure of ca. 70 mbar (25–30 mbar H2O and 40–45 mbar H2). The pressure was regulated by continuous pumping of the chamber, leading to a continuous flow rate of 20 sccm. For H2S poisoning tests, 30 mbar of Ar containing 200 ppm H2S were additionally fed into the test chamber, causing a total H2S partial pressure of 6μbar. Before the impedance testing, a blank heating cycle to 1000 °C for 12 h was performed, in order to evaporate possible contaminant species.
Impedance spectra were measured in 4-wire mode with a phase sensitive multimeter 1753 with IAI interface (both: Newton's Fourth Ltd., UK) in a frequency range of 105–0.1 Hz and with an AC voltage of 20 mV (root mean square). The experimental temperature range was 590–810 °C.
The spectra were fitted with the circuit model shown in Figure 3. By using the software Zview, as elaborated in Appendix A.
3.3. SEM Analysis of Screen-Printed Electrodes
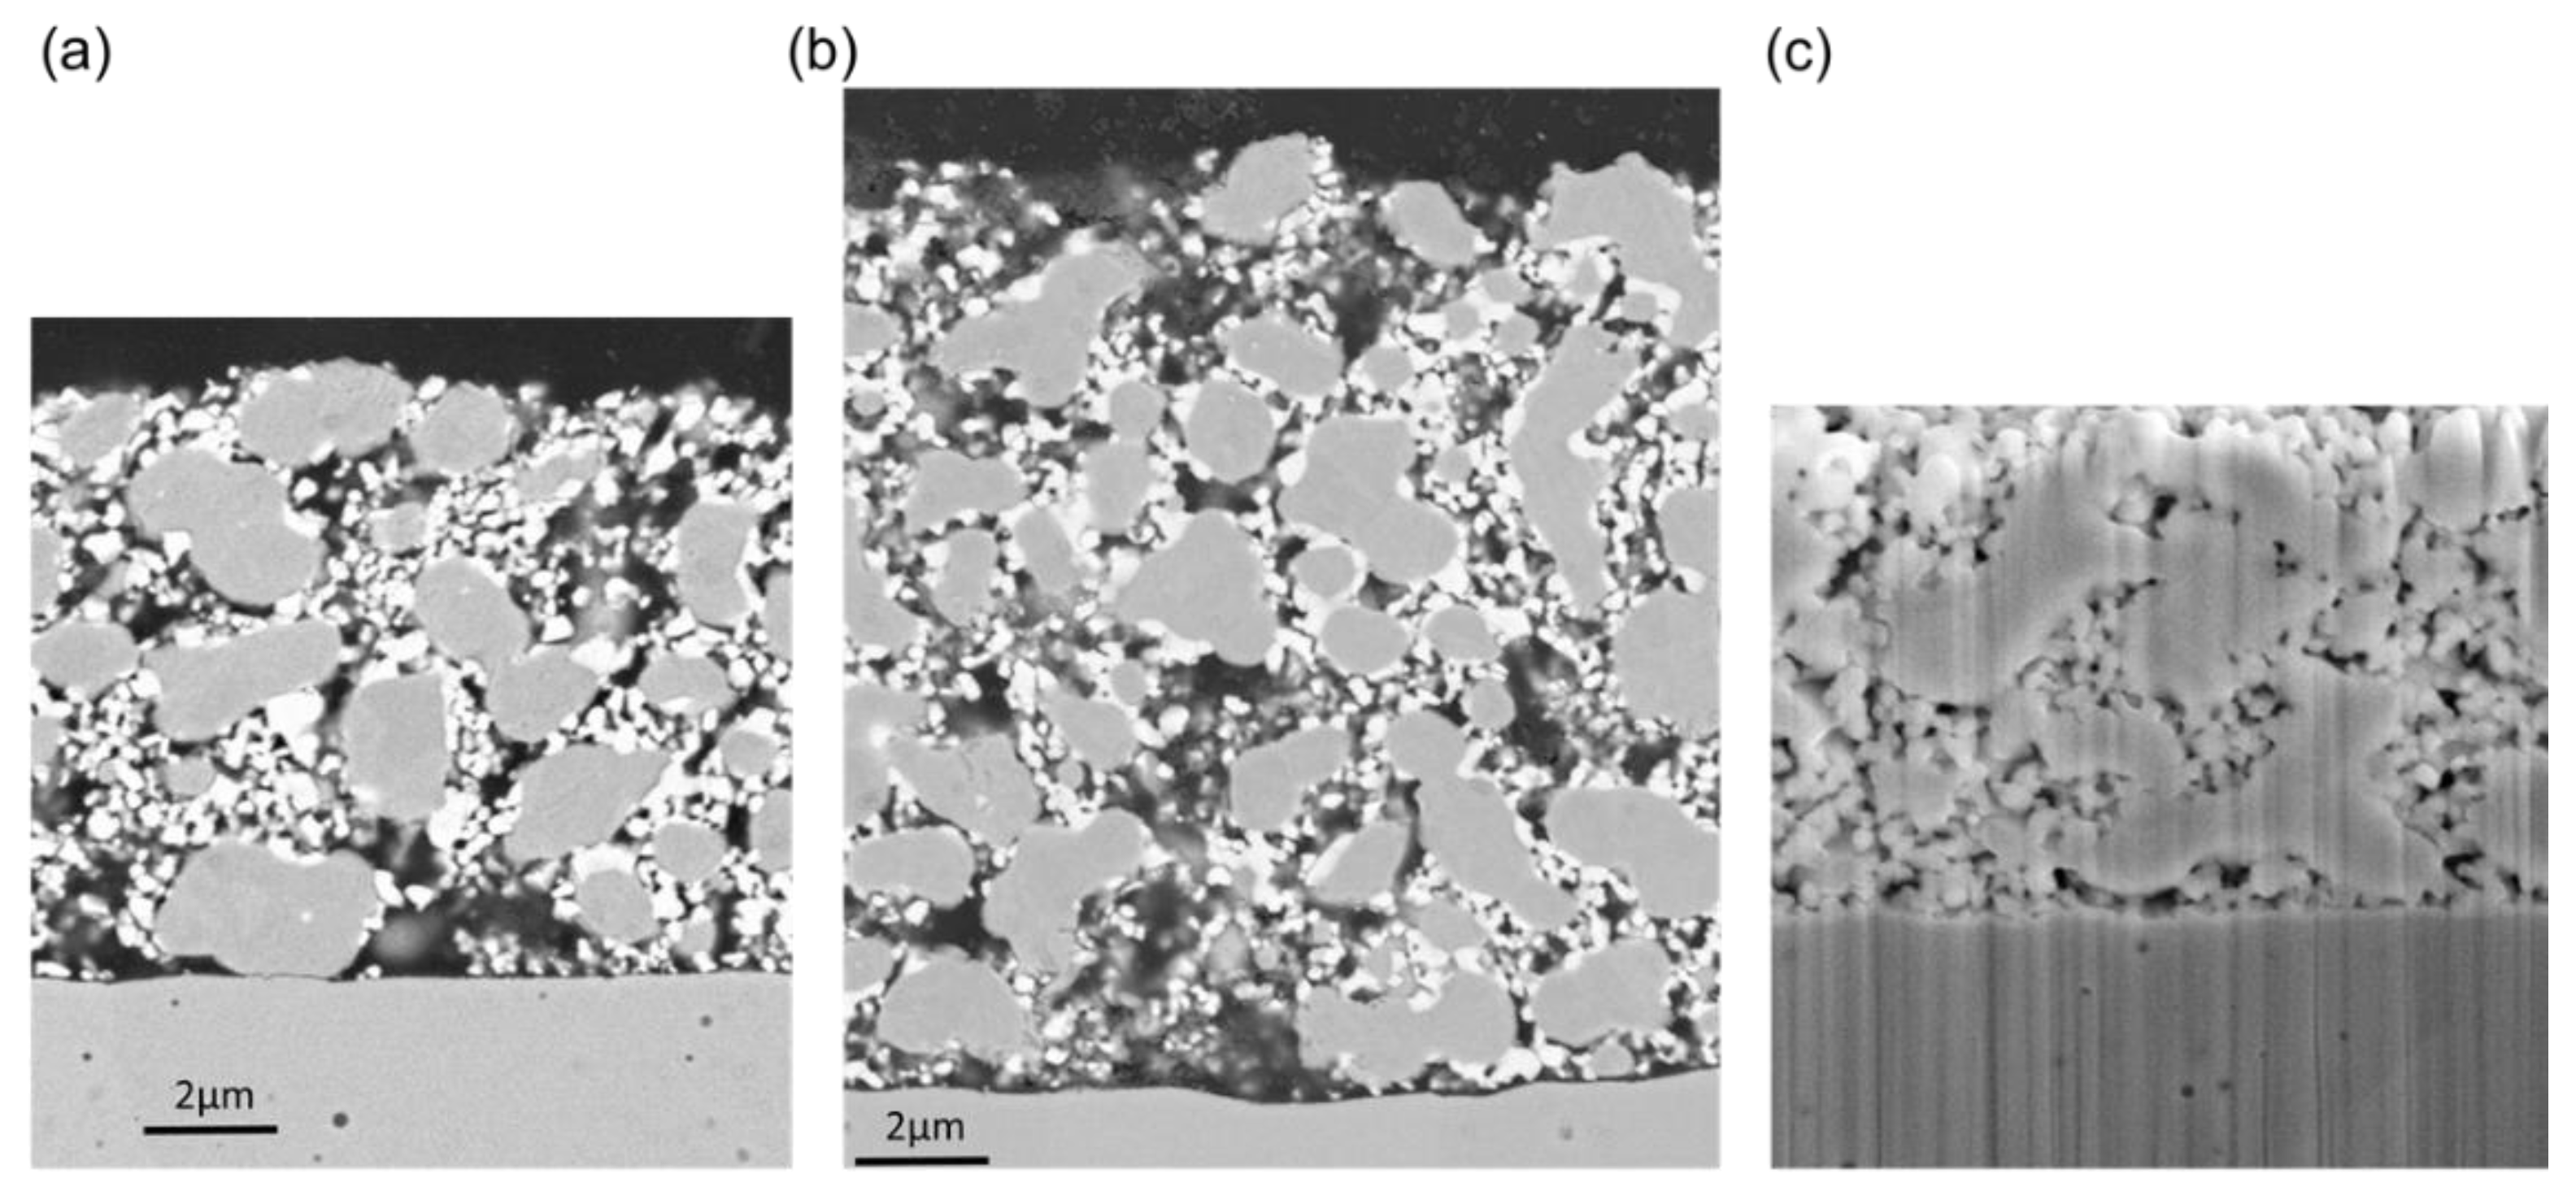
Microstructural analysis was performed after electrochemical characterization on a Zeiss Ultra 55 SEM in backscattered electron detection. Samples were embedded in epoxy resin, and sections were polished with diamond suspensions to obtain smooth cross-sectional surfaces. The sample with the GDC layer (Figure 8c) was prepared by focused ion beam (FIB) milling on a dual-beam FIB/SEM microscope (Nanolab 600i; FEI company, Hillsboro, Oregon, USA). As visible in Figure 8, the average microstructure does not depend on the thickness of the anode. Due to the reductive sintering at the relatively low temperature of 1100 °C for 3 h in H2 atmosphere, Ni and GDC particles did not grow substantially when compared to the particle size in the powders. The microstructure of these Ni/GDCs are thus significantly different than those of classical Ni/YSZ anodes, for which oxide and metal particle sizes are similar. The implications of such a microstructure on electrochemical performance is discussed in Results, Section 4.6.
4. Results and Discussion
4.1. Gas Diffusion Impedance
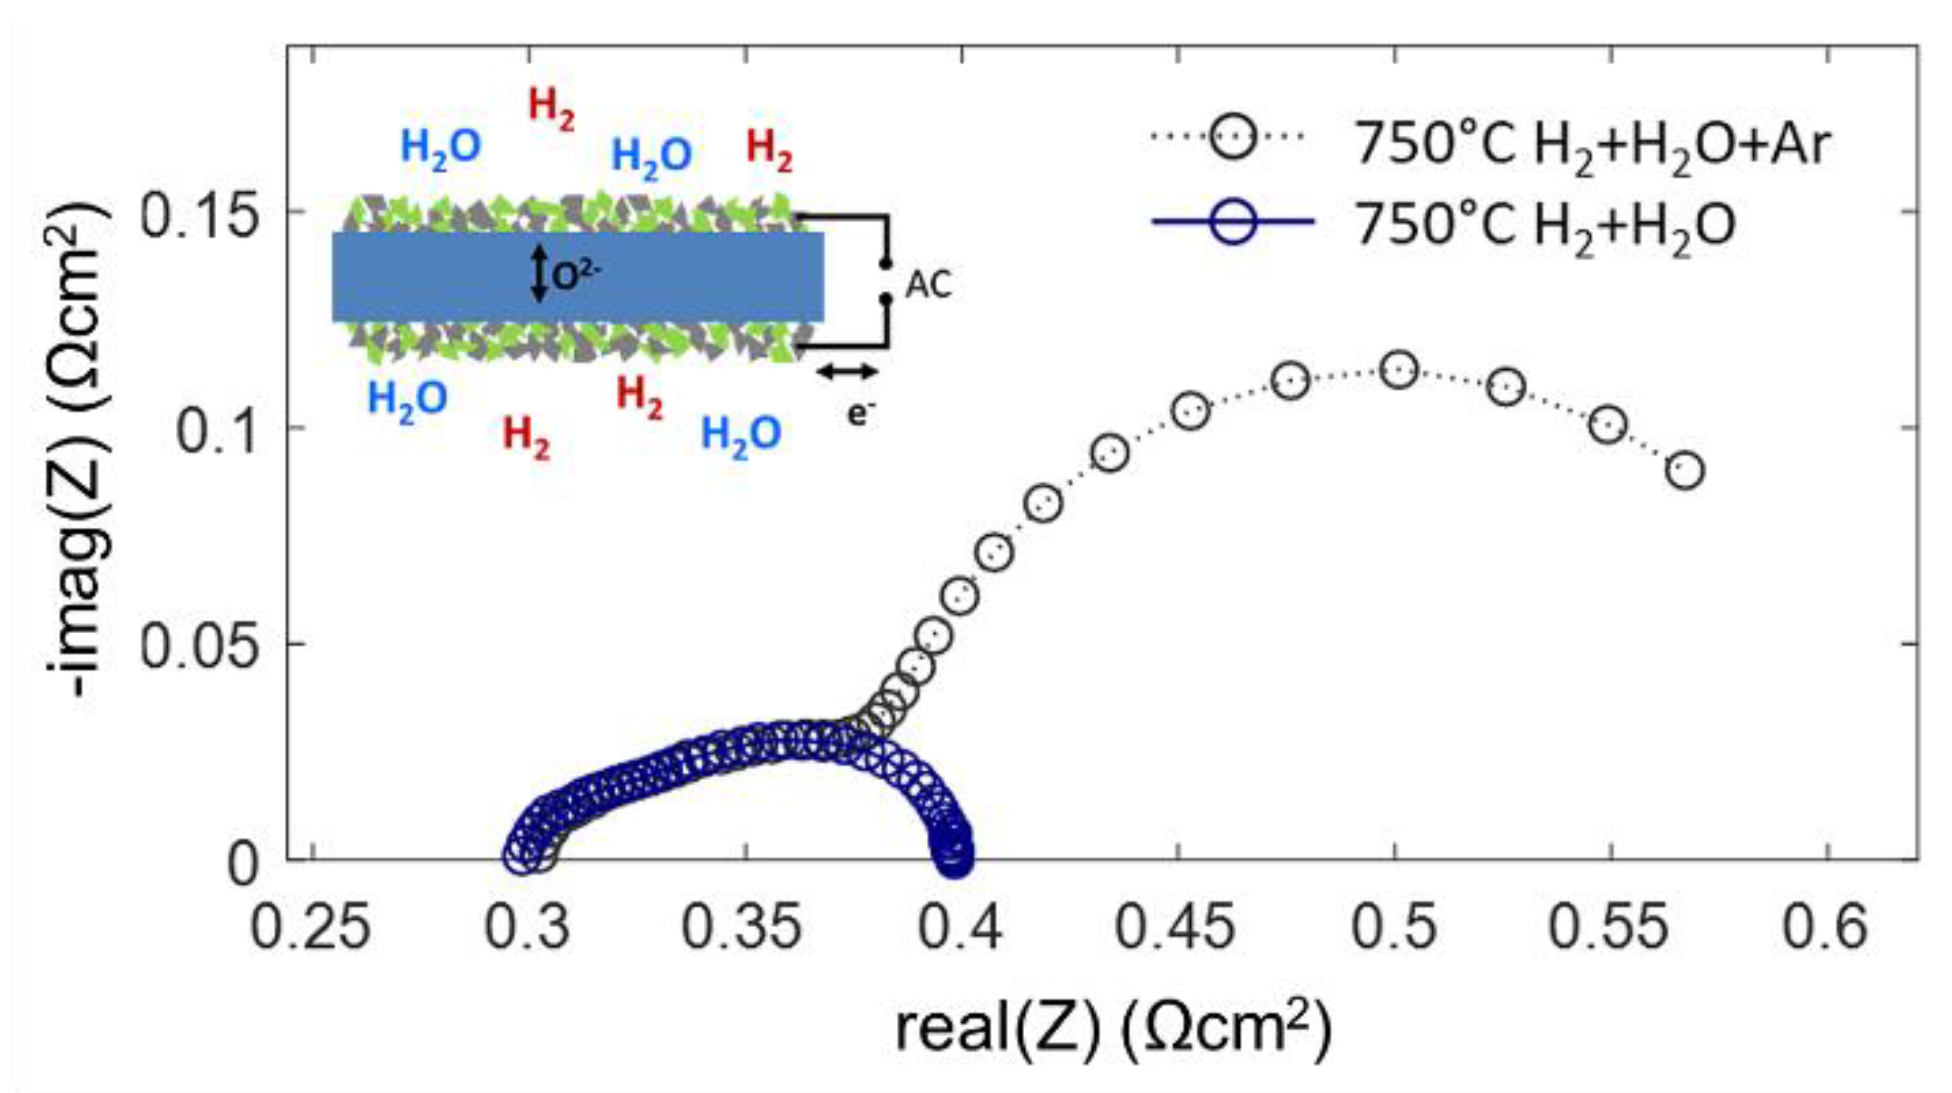
Impedance measurements on symmetrical cells were carried out in two different atmospheres: 25 mbar H2 + 25 mbar H2O in Ar balance and 45 mbar H2 + 25 mbar H2O without Ar balance at reduced total pressure. Both atmospheres streamed through the testing chamber at a rate of 20 sccm. Although the partial pressures of H2 and H2O gases differ only moderately, the measured impedance spectra shown in Figure 9 differ strongly. From the gas diffusion modeling, gas diffusion ASR values of ~0.27 and ~0.01 Ωcm2 are estimated for typical anode supported electrodes with and without Ar balance gas, respectively. The low-frequency arc in the spectrum for diluted H2+H2O has a diameter of ~0.25 Ωcm2 and shows relatively little temperature dependence [56]. Since this feature vanishes as soon as the Ar balance is removed from the testing atmosphere, it is clearly identified as the gas diffusion process.
Only for H2+H2O mixing ratios close to unity, the modeled gas diffusion resistance is small. The very good agreement of the measured and calculated gas diffusion ASR is rather a coincidence, because the diffusion geometry in our experiment differs from that in a porous electrode support (see Figure 7). The overlap of the spectra in the high-frequency regime is well in line with the impedance model: with a high-frequency AC signal, most of the measured current is due to charging and discharging of the chemical capacitance in the oxide, which does not include gas phase species, so the gas diffusion rate is irrelevant. In DC-like conditions the gas phase diffusion resistance is measured in addition to the electrochemical electrode reactions (Equation (33)). In the case of the Ni/GDC anodes, the characteristic frequency of the gas phase diffusion feature overlaps with the electrode dispersion, which are both in the range of few Hz. This overlap of dispersion frequencies is characteristic for mixed conducting electrodes due to their large chemical capacitance and slow relaxation frequencies. In contrast, Ni/YSZ cermet anodes have a much faster electrochemical dispersion frequency due to their negligible chemical capacitance. In this case, the gas diffusion ASR appears as a well-separated low-frequency arc [30,34,56,59].
4.2. Chemical Capacitance
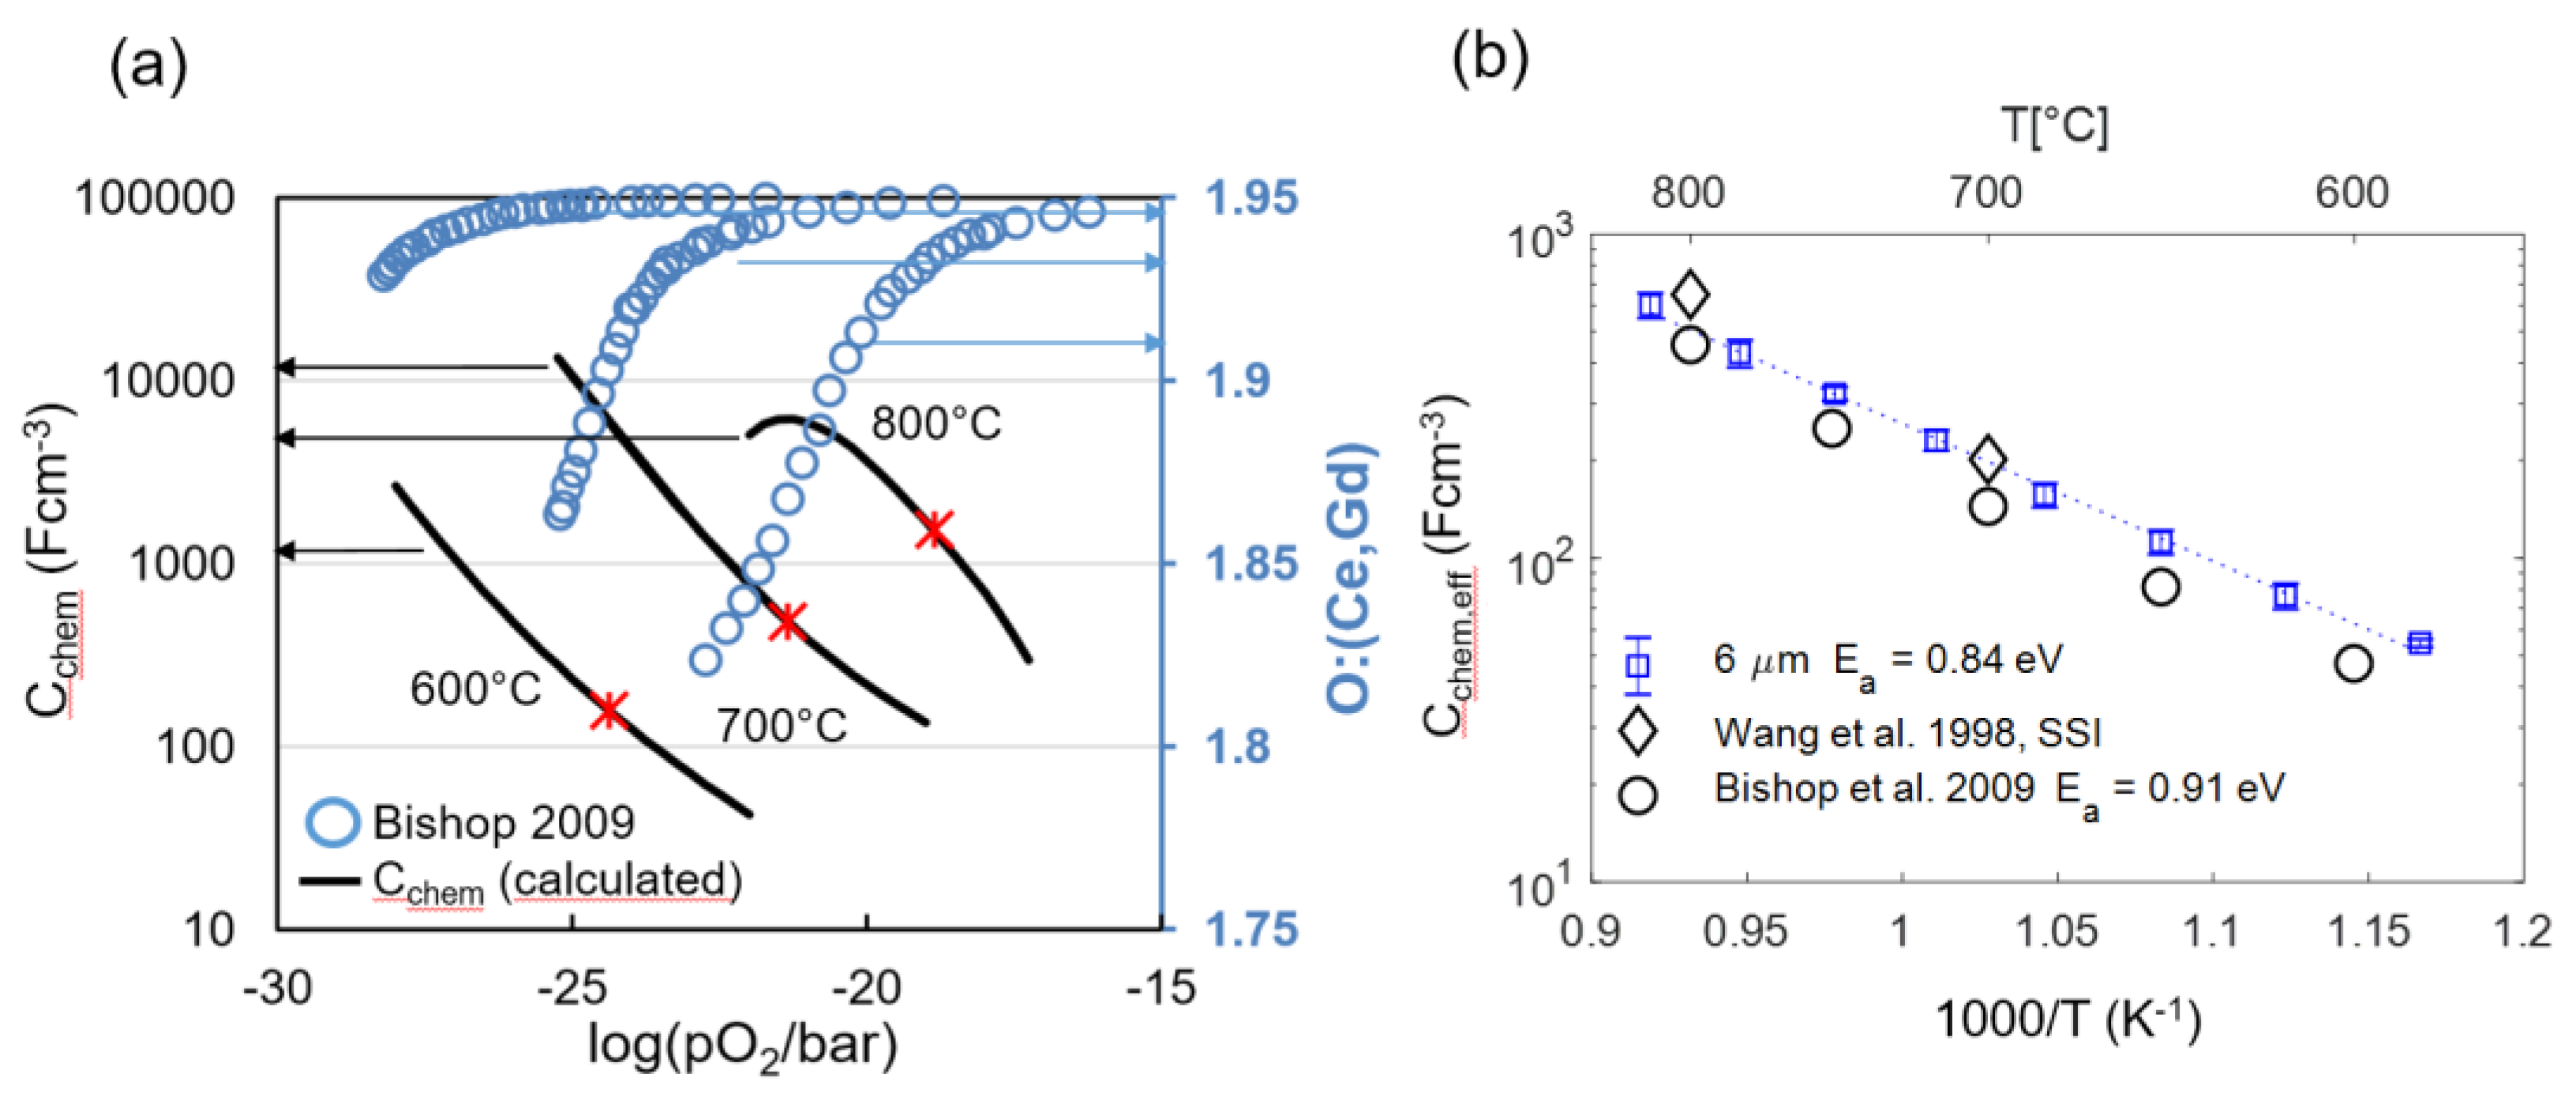
The chemical capacitance of an oxide is a measure for how much the oxygen nonstoichiometry δ depends on the oxygen partial pressure (or overpotential), which is quantified by Equation 16. For GDC, nonstoichiometry data is available from many well-agreeing sources in the literature, e.g., [15,49,50,51,63]. Therefore, the expected chemical capacitance can be reliably predicted from literature data, as shown in Figure 10a. Moreover, for low-point defect concentrations where defect interactions are weak, the capacitance value can serve as a fingerprint for the concentration of oxygen vacancies and electronic defects [46,47,48,64], and reported values are largely reproduced within the literature.
From impedance fitting of 6-μm-thick electrodes, we obtain an effective value for the chemical capacitance (Cchem,eff), which is the GDC-specific capacitance multiplied by the GDC volume fraction of 0.3 (Equation (26)). Consequently, a physically meaningful impedance fit result should give a chemical capacitance value that is close to the prediction from nonstoichiometry data. This was tested for four samples with 6-μm-thick electrodes by using the equivalent circuit shown in Figure 3 for fitting. Good agreement of predicted and fitted chemical capacitances and small variance between individual samples values are visible for the 6-µm-thick electrode, as plotted in Figure 10b. The fact that the fitted capacitance is slightly higher than the literature prediction at low temperatures is most likely due to increased oxygen nonstoichiometry on the surface of the GDC particles, which causes an additional weakly pO2 and temperature-dependent surface chemical capacitance [49,65].
The fact that the fitted chemical capacitance is very reproducible and in-line with the literature predictions from complementary measurements is key for fitting the impedance of electrodes with thickness L ≥ 2λ, for which the impedance function in Equation (29) becomes overparametrized. As elaborated in Section 2.4, the EIS fit for thick electrodes requires prior knowledge of the chemical capacitance in order to fit the transmission-line impedance. The measured Cchem values shown in Figure 10b serve as ideal references for the impedance fitting of thicker electrodes.
4.3. Effect of Electrode Thickness
According to the impedance model of porous electrodes derived in Section 2, the area-specific resistance is expected to reach a plateau value when the electrode thickness is increased significantly above the electrochemically active thickness λ, as shown in Figure 4b.
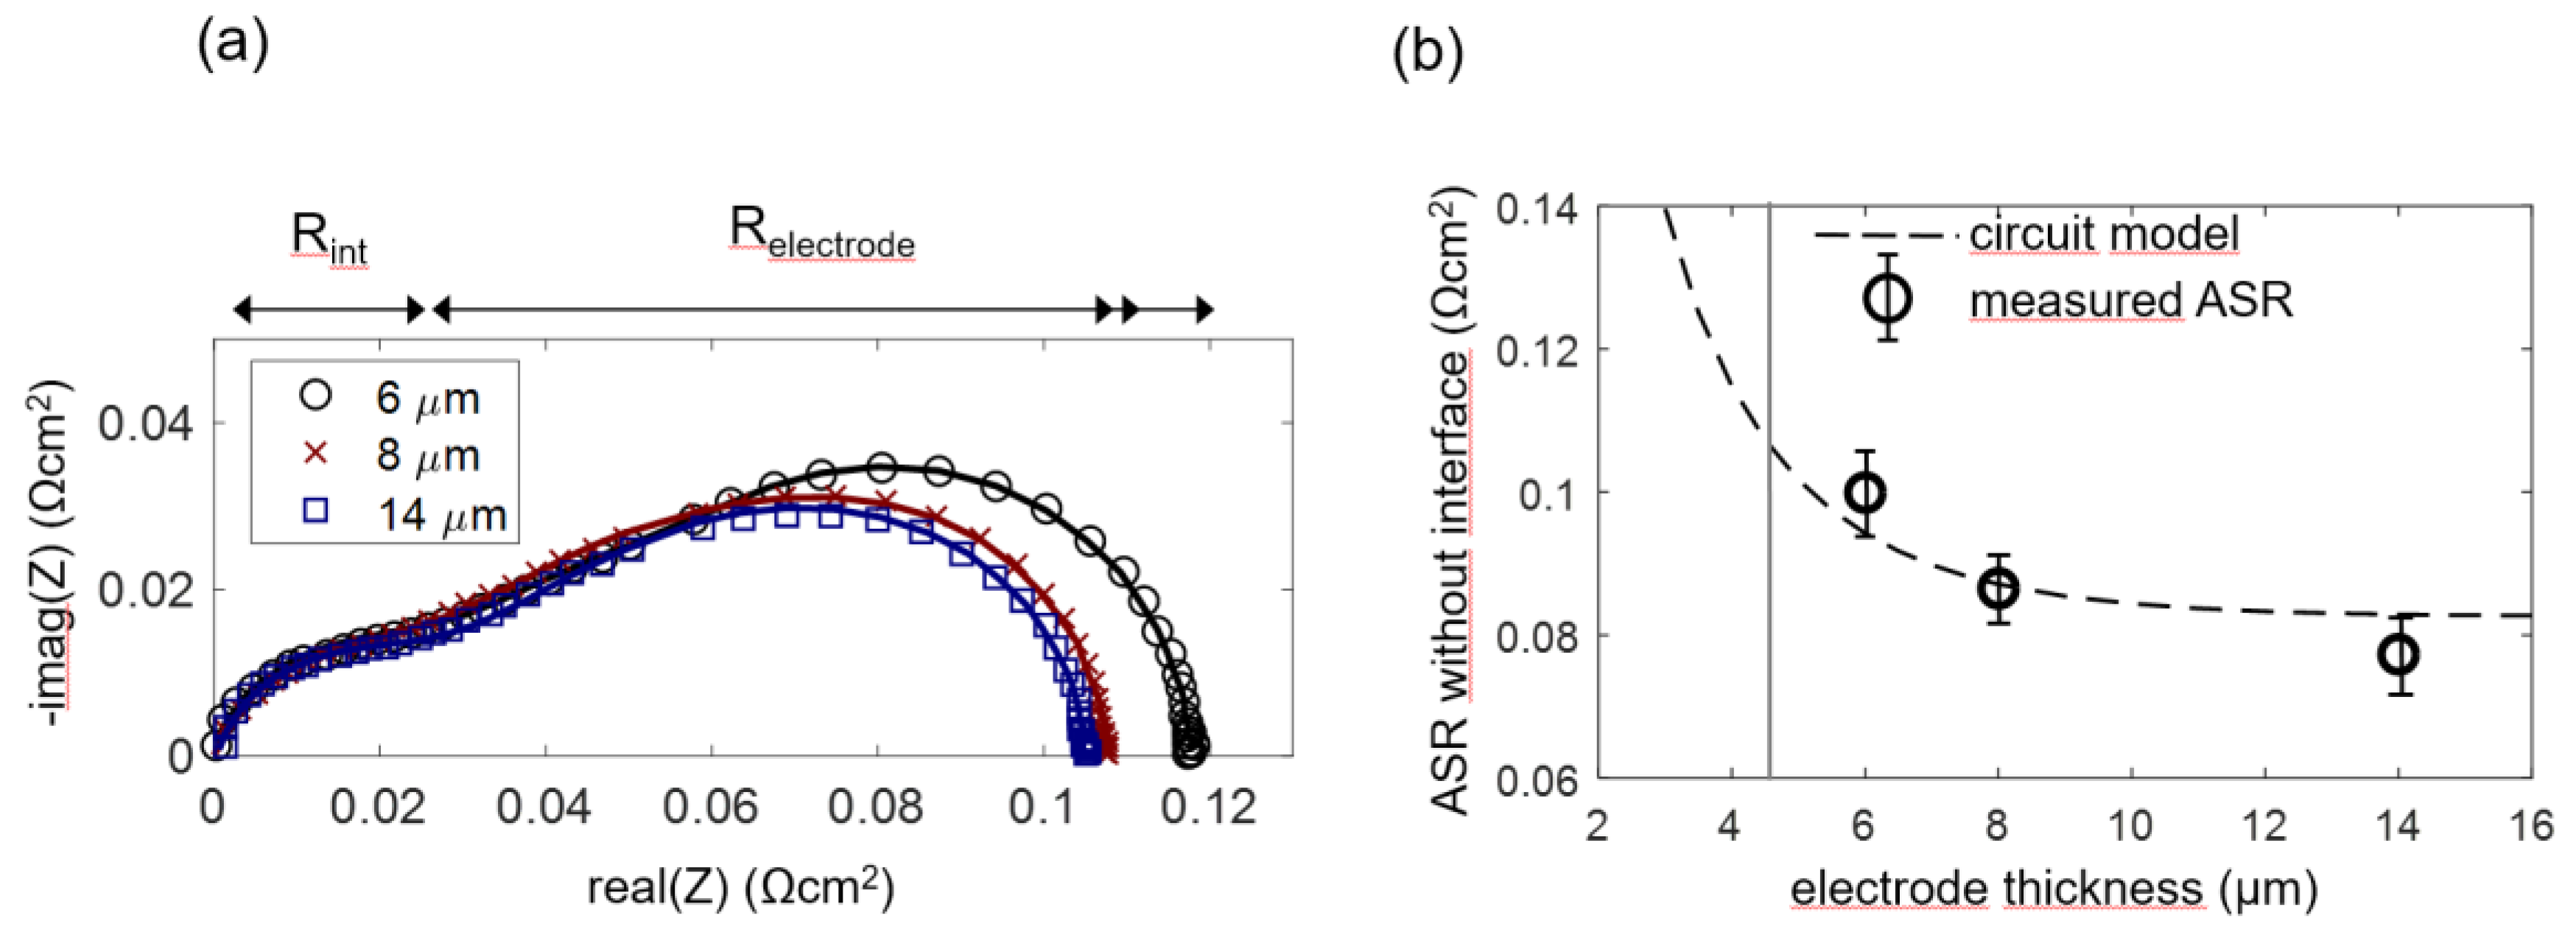
In order to experimentally prove this model and determine the optimal anode functional layer thickness, anode cells with a functional layer thickness L of 6, 8 and 14 µm were prepared, and four cells for each thickness were measured. As elaborated in Section 2.4 and Section 4.2, for the 8 and 14-µm-thick anodes (which have an overparametrized impedance function with L ≥ 2λ), the chemical capacitance was constrained to the average fitted value for 6-µm-thick electrodes in order to obtain a unique fitting result. Impedance spectra and equivalent circuit fitting results are shown in Figure 11a. A weakly separated high-frequency arc is labeled as Rint. This feature is not considered in the simulated spectra shown in Figure 4a. It is caused by ion migration through the weakly ion-conducting interface region between YSZ and GDC, as elaborated by measurements in Section 4.5. This interfacial impedance is most likely a combined effect of the current constriction, because only a fraction of the electrolyte surface area is actually covered by GDC particle sintering necks and the interdiffusion of GDC and YSZ, which causes a lower conductive interfacial region [66].
Fitting values of each of the electrode thicknesses were averaged to obtain the circles symbols in Figure 11b (error bars correspond to the standard deviation of the results). The dashed curve in Figure 11b was calculated by the circuit model, with parameters for Rion and Rreact averaged over all measured samples. In accordance with the model, the measured ASR decreases only slightly for electrode thickness >> λ.
When the thickness of the electrode is varied while keeping composition and sintering conditions equal, the effective microstructure (size of Ni and GDC particles, porosity and tortuosity) remains constant (see SEM images in Figure 8). Therefore, values for effective ion conductivity and surface reaction kinetics should be independent of the electrode thickness. Moreover, they should be in agreement with results from complementary electrochemical and thermogravimetric techniques. This is elaborated in the following section.
4.4. Temperature Dependence and Comparison with Model Studies
From fitting the impedance data, we gain effective parameters for ion conductivity, reaction kinetics and chemical capacitance. The impedance model derived in Section 2 enables a straightforward prediction of these effective parameters when the materials properties, such as ionic conductivity, oxygen nonstoichiometry and area-specific resistance of the hydrogen oxidation reaction, as well as the microstructural properties, are known. The electrochemical materials properties can be found in the literature, and microstructural parameters were estimated based on cross-sectional SEM images. These relations are summarized in Equations (22)–(26). These equations are already sufficient to simulate impedance spectra and predict fitting parameters. Predicted values and impedance fitting results at 650 and 750 °C are given in Table 2.
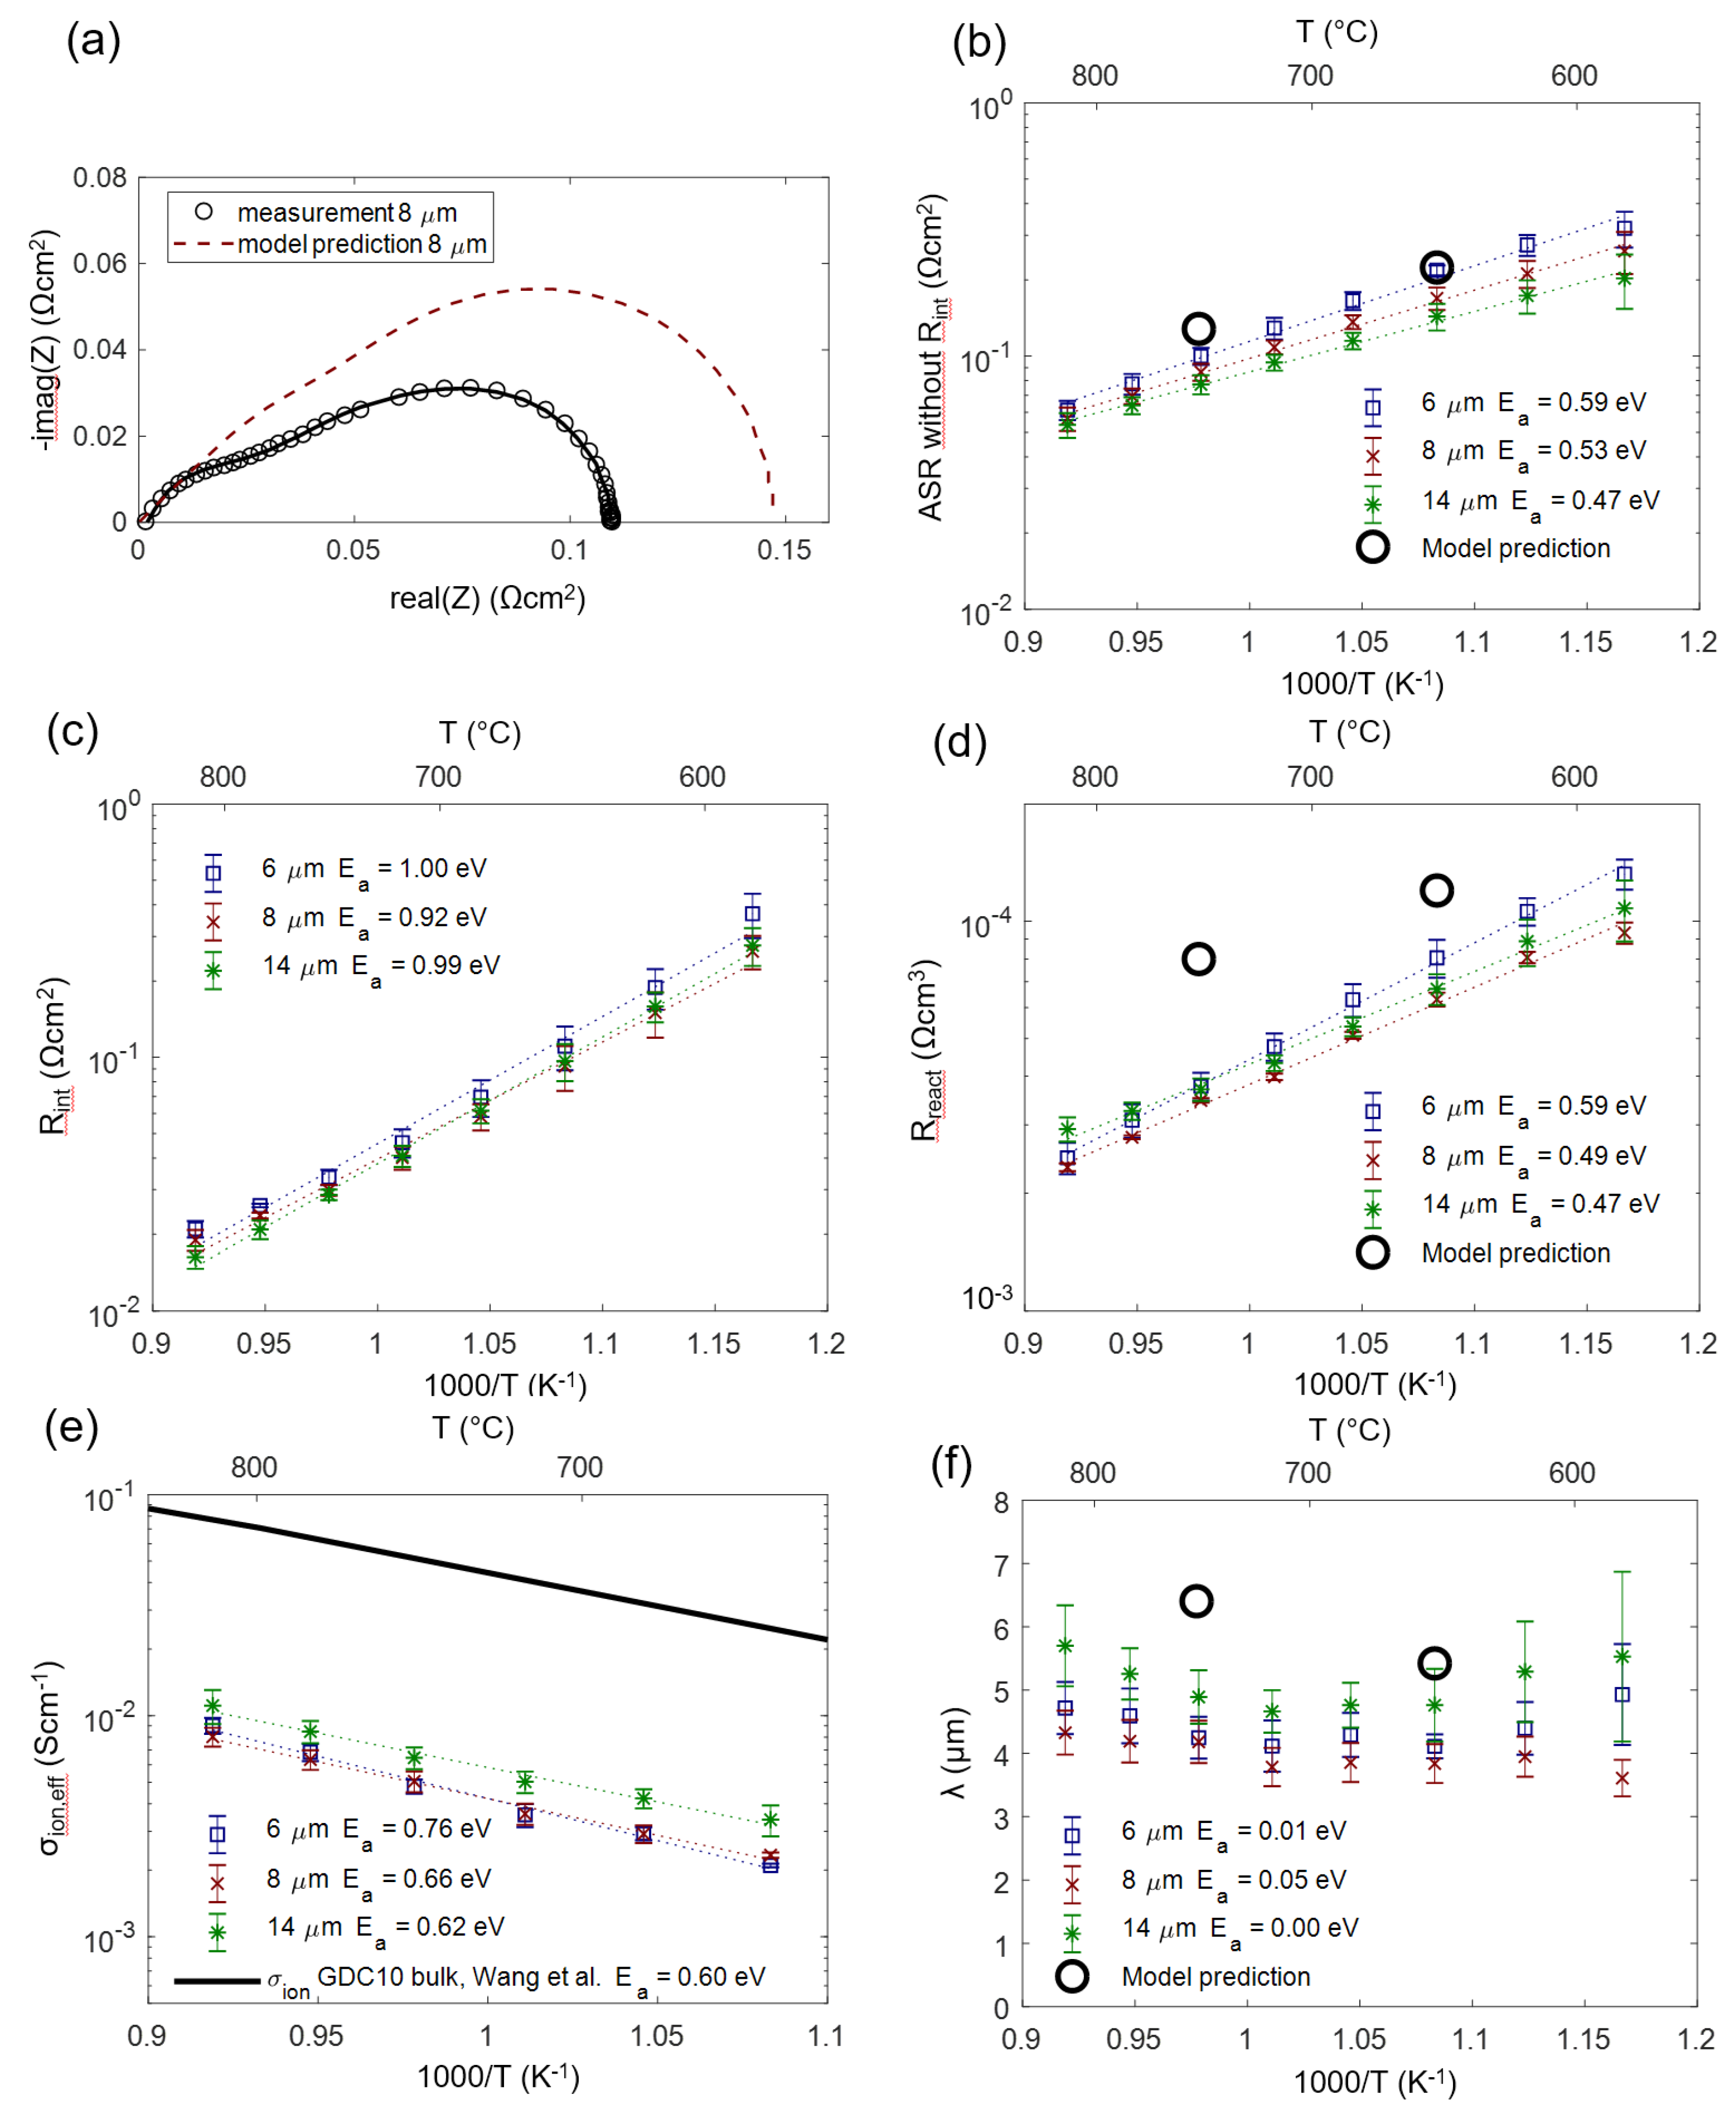
We can now check how the modeling assumptions relate to the actually measured and fitted values. For this, the impedance of porous Ni/GDC anodes was measured in 25 mbar H2O + 45 mbar H2 atmosphere in a temperature range of 590–810 °C. As an example, the measured and fitted spectrum measured on an 8-µm-thick anode at 750 °C is depicted in Figure 12a (black symbols and solid curve). The model prediction (red dashed curve) was simulated with the predicted parameters for Rion, Rreact and Cchem,eff given in Table 2. The elementary parameters obtained by the impedance fitting for three different electrode thicknesses are summarized in Figure 12 (panels b–f). Black circles symbols mark the values that were predicted from the literature research and microstructural estimations based on cross-sectional SEM images. As expected from the circuit model, error bars for different thicknesses overlap, so we observe no significant influence of electrode thickness on the electrochemical parameters.
The measured ASR of the electrodes (diameter of the electrode arc) plotted in Figure 12b exhibits constant activation energy throughout the temperature range, confirming that the relatively temperature-independent contribution of gas diffusion is only a minor part of the total ASR.
For the electrode-electrolyte interface ASR plotted in Figure 12c, no literature reference is available, as this value is extremely sensitive to the processing route (see Section 4.5).
In comparison with the literature, the effective reaction resistance Rreact plotted in Figure 12d shows that fitted values are 2–3 times smaller than the corresponding prediction. There exist two plausible explanations for this behavior. Firstly, thin film electrodes are very prone to impurity-based ASR degradation, even on the time-scale of a few hours, which is reported in the GDC literature [44,45], and so, even the initially measured thin film ASR may already be a slightly degraded value. Secondly, we did not consider catalytic triple-phase boundary (TPB) activity in our circuit model, which is suggested by model studies of thin films with patterned nickel thin film current collectors [16,18,44]. However, systematic variations of Ni-GDC TPB density (ratio of TPB length to oxide surface area) on thin films in the literature, Reference [18], was only varied between 150 and 2000 cm/cm2, and the TPB density in porous electrodes is likely higher, so additional TPB activity cannot be excluded. Lastly, the uncertainty of the specific surface area estimation from SEM cross-sections also complicates a quantitative comparison.
As expected, the effective ion conductivity σion,eff shown in Figure 12e has an activation energy that is close to that of a GDC polycrystal (black line). This already indicates that the grain boundary contribution to the ion conduction, which has activation energies of 0.8–1 eV [70,71,72], is relatively low. A low-grain boundary resistance of GDC is expected in reducing conditions [73]. In absolute numbers, the conductivity of a dense GDC pellet is 9 ± 1 times larger than the effective conductivity of the cermet. Together with the volume fraction (ε = 0.3), we can therefore experimentally determine a GDC tortuosity factor of 2.7 ± 0.4 using the relation σbulk = σeff·τ/ε. We believe that this impedance-based tortuosity determination is more accurate than a corresponding 3D reconstruction due to the very small size of the GDC particles, which is at the resolution limit of typical FIB/SEM systems [43].
A remaining open question lies in the role of triple-phase boundaries, which may enable an additional reaction path, lowering Rreact. This was observed for very high TPB densities, e.g., achieved by Ni or Pt nanoparticle depositions on columnar GDC films [74,75]. However, from our data available so far, we cannot draw definitive conclusions on TPB effects here.
4.5. Enhancing Electrolyte-Electrode Interface Adhesion and Ionic Transfer Resistance by a Thin Film GDC Layer
The high frequency feature in the impedance spectra is due to an ionic transfer resistance at the electrode-electrolyte interface. By modifying this interface with an additional GDC thin film, prepared by pulsed laser deposition, this interfacial resistance can be minimized, and the mechanical adhesion of the anode is strongly improved. Impedance spectra for electrodes with and without dense GDC interlayers are plotted in Figure 13. Clearly visible, the high-frequency feature is only present for the electrode without a dense GDC interlayer (spectrum B). The spectra were recorded in a more reducing atmosphere (275 mbar H2 + 25 mbar H2O). In these conditions, the interface arc is more separated from the electrode impedance due to a larger difference in characteristic frequencies. Apart from decreasing the total anode ASR from 0.13 to 0.09 Ωcm2, this interfacial modification strongly supports the validity of our interpretation of the high-frequency arc as an electrode-electrolyte interface feature.
On a mechanistic level, the better ion transfer is likely a combination of two effects: The sintering necks of GDC particles on a GDC surface are much stronger than those between GDC and YSZ, which is evident by the much better mechanical stability observed by scratch testing. Moreover, an interdiffusion zone between YSZ and GDC forms during sintering, and the ion conductivity in this layer is lowered [66]. When the weakly conductive YSZ-GDC interface covers the entire electrolyte surface, this interfacial resistance is strongly reduced compared to having the ion transfer only at the sintering necks between the GDC electrode and YSZ substrate, which only cover a fraction of the area.
When Ni-GDC electrodes are employed in metal supported cells, the electrolyte is sputtered on top of the sintered anode [7,56]. This preparation procedure creates a relatively large GDC-YSZ interfacial area with very little interdiffusion due to the low processing temperature, so the interface ASR in the full metal-supported SOFC is most likely much lower than in our model cells.
4.6. Why Ceria-Based Anodes are Optimal for Metal-Supported Cells
The Ni-GDC anodes that were investigated here exhibit quite low polarization resistance compared to studies available in the literature, especially when considering that low p(H2) and p(H2O) values were used during EIS testing in order to optimize gas diffusion coefficients. When equally prepared anodes are employed in metal-supported SOFCs with a thin sputtered electrolyte and La0.58Sr0.4CoO3-δ cathode, a record-breaking power density of 2.4 W/cm2 at 700 °C is achieved [11].
With the help of detailed impedance modeling and model verification, we can identify several factors that lead to the low polarization resistance and high cell performance, which are specifically.
The microstructure of the anodes differs from the classical Ni/YSZ cermet. This is due to the reducing sintering conditions in which Ni stays metallic and the relatively low sintering temperature of 1100°C. With such processing conditions, the microstructure exhibits large Ni grains (~1.5 µm) and small GDC grains (~250 nm) (see Figure 8). Such a microstructure has a rather large GDC surface area, high porosity and moderate TPB density. The moderate TPB density is suboptimal for Ni-YSZ anodes, as shown in a previous publication [56]. However, GDC is a mixed-conducting, surface-active electrode material, so the very high GDC surface area and sufficient porosity are decisive for the electrode kinetics. Moreover, this microstructure was proven to be mechanically very stable during redox cycling [3].
GDC is known to be a very good catalyst for redox reactions, such as electrochemical H2 oxidation [18,44,76].
According to the ASReff predicted from the impedance model, (Equation (33)), a high ionic conductivity is as important as fast surface kinetics and a high surface area. GDC is known to be a two to three times better ion conductor than YSZ at 700–800 °C. Moreover, the tortuosity factor of the GDC phase, which is difficult to measure from 3D reconstructions due to the small particle size, could be determined by the EIS measurements to a value of 2.7 ± 0.4. Tortuosity values found in the literature for Ni-YSZ cermet (which were prepared by NiO/YSZ sintering in the air) are typically in the order of 10 [38,39,62]. The higher specific conductivity and relatively low tortuosity, compared to Ni/YSZ cermet, substantially increases the electrochemically active thickness and decreases the ASR.
For fabrication of a metal-supported cell, the electrolyte is sputtered on the sintered Ni/GDC anode. This creates a large interfacial area, while interdiffusion of GDC and YSZ is negligible due to the relatively low temperatures required for sputter deposition of a dense electrolyte. This processing minimizes the interfacial ion transfer resistance (Rint in Equation 33). For electrolyte-supported cells, which were used in this study, coating the electrolyte with a dense, thin GDC layer minimizes the interfacial resistance and increases adhesion.
Finally, the gas diffusion in the anode active layer is quite good, due to the reasonably high porosity [11,12]. Furthermore, a metallic anode support can be fabricated much thinner than a Ni-YSZ support for anode-supported cells, due to the better mechanical properties. This leads to low gas diffusion overpotential in real cell applications.
5. Conclusions
The impedance of symmetrical Ni/Gd0.1Ce0.9O1.95-δ (Ni/GDC) model anode cells was thoroughly investigated to show how the low polarization resistance of <0.1 Ωcm2 at 750 °C is related to the microstructure and materials properties. For the mechanistic interpretation of the impedance, a transmission line-equivalent circuit similar to the Adler-Lane-Steele model was mathematically derived. The main advantage of the presented model is that it is expressed in a way that allows straightforward interpretation of the impedance fitting results in terms of the electrochemical parameters, such as the ionic conductivity, oxygen exchange activity and chemical capacitance or oxygen nonstoichiometry as well as microstructural properties.
From impedance fitting, effective parameters for oxygen exchange kinetics, ion conductivity and capacitance were determined. These effective parameters depend on materials properties such as conductivity or surface-specific ASR and microstructural parameters like volume fractions, tortuosity and a specific surface area. In order to confirm that the fit values are reasonable, the microstructural parameters of the electrodes were estimated based on SEM cross-sectional imaging, and material-specific parameters were taken from model studies of GDC bulk ionic conductivity, oxygen nonstoichiometry and electrochemical surface reaction rates available in the literature. The effective parameters that were predicted by this method are in good agreement with the impedance fitting results.
From our impedance analysis of the Ni/GDC anodes, we can conclude that the low polarization resistance is due to a combination of material-specific and microstructural properties. Thanks to the mixed ion and electron conduction in GDC, the electrochemical hydrogen oxidation reaction is not limited to the triple-phase boundary but also occurs at the entire GDC surface area. This area is quite large due to the small GDC particles. Additionally, the high ionic conductivity and low tortuosity of the GDC phase improves electrode kinetics by increasing the electrochemically active thickness.
Therefore, we provide solid experimental and theoretical proof that a circuit model similar to the Adler-Lane-Steele model is very helpful to understand the electrochemical properties and reaction rates of SOFC anodes and gives valuable guidelines for knowledge-based optimization of SOFC electrodes.
Author Contributions
Conceptualization and mathematical modeling: A.N., A.O. and J.F.; sample fabrication: C.B., M.B. and A.N.; acquisition and evaluation of experimental data: A.N.; writing: A.N., A.O. and J.F.; supervision, funding acquisition and project administration: A.O. and M.B. All authors have read and agreed to the published version of the manuscript.
Funding
The authors gratefully acknowledge funding by the Austrian Federal Ministry for Digital and Economic Affairs (BMDW) and the Austrian Science Fund (FWF) through grants F4509-N16 (SFB FOXSI).
Acknowledgments
The authors thankfully acknowledge Tobias Huber (TU Wien), Mark Kappertz and Doris Sebold (Forschungszentrum Jülich) for SEM imaging and preparation of sample cross-sections and Chie URYU (International Research Center for Hydrogen Energy) for FIB-SEM analysis.
Conflicts of Interest
The authors declare no conflicts of interest.
Appendix A. Equivalent Circuit Fitting in Zview
Here, we present the EIS fitting routine in detail, so that readers will be able to apply the same model to their data. Before fitting, measured impedance spectra were normalized to the electrode area (0.81 cm2) and divided by 2 to account for the two electrodes measured in the series. The impedance function of the full circuit depicted in Figure A1a (Reon = 0) is then
with
Impedance fitting was carried out with the commercial software Zview. In this software, the impedance model shown in Figure A1b (screenshot from Zview) is mathematically identical to the circuit model that was derived in the main text. In Table A1, the circuit parameter names in Zview and corresponding impedance values are summarized.
Figure A1.
(a) Equivalent circuit representing conduction and reaction laws of a mixed conductor. (b) Mathematically identical circuit model employed in Zview.
Figure A1.
(a) Equivalent circuit representing conduction and reaction laws of a mixed conductor. (b) Mathematically identical circuit model employed in Zview.


Table A1.
Relation of Zview fitting parameters to the impedance function in Equation (S1).
| Parameter Name in Zview | Parameter Name in Equation (A1) | Fixed/Free Parameter | Unit |
|---|---|---|---|
| DX | None | fixed (11) | None; selector for circuit model “Bisquert 2” |
| DX-R | None | fixed (0) | Ωcm |
| DX-T | None | fixed (0) | F/cm |
| DX-P | None | fixed (1) | 1 |
| DX-U | Rion | free | Ωcm |
| DX-A | None | fixed (0) | F/cm |
| DX-B | None | fixed (1) | 1 |
| DX-C | Rreact | free | Ωcm3 |
| DX-D | Cchem,eff | free * | F/cm3 |
| DX-E | None | fixed (1) | 1 |
| DX-F | L | fixed (thickness measurement) | cm |
| Qint-P | pint | may be free or fixed to a value 0.8–1 | 1 |
| Qint-T | Qint | free | Fractional capacitance |
* The chemical capacitance may be constrained by the value determined from thermogravimetric analysis (TGA) isotherms for relatively thick electrodes in order to avoid overparametrization.
Particle Packing Model
For calculation of the effective free surface area, two models were used. From SEM cross-sections, a mean GDC particle size of 270 nm can be determined. Assuming spherical particles with 60% of their surface atmosphere are exposed and 40% sintered on other GDC or Ni grains and 30 vol% GDC, such a microstructure has ~30 GDC particles per μm3 and a free GDC surface of 4 μm2/ μm3. The second surface area estimate relies on the BET surface of the GDC powder (8.1 m2/g, according to the manufacturer) before sintering. When we estimate that the atmosphere exposed surface area decreases by 65% during sintering due to particle growth and sintering necks, this amounts to an average GDC surface area of 6 μm2/ μm3. For the prediction of Rreact from model studies, we used the average of both methods: 5 μm2/ μm3.
Appendix B. List of Used Variables
Due to the many different variables, their meanings are given in Table A2.
Table A2.
List of used symbols.
| Symbol | Meaning | Unit |
|---|---|---|
| Gibbs free energy of H2 oxidation | J/mol | |
| δ | oxygen deficiency, e.g., in Ce0.9Gd0.1O1.95-δ | 1 |
| μx | chemical potential, species x | J/mol |
| electrochemical potential, species x | J/mol | |
| τx | tortuosity, phase x | 1 |
| εx | volume fraction, phase x | 1 |
| Aspec | specific surface area (of the GDC phase) per electrode volume | cm2/cm3 |
| ASRsurf | ASR of the oxygen exchange (H2 oxidation) reaction normalized to the GDC surface area | Ωcm2 |
| ASRtot | measurable ASR of a porous electrode normalized to the geometric area | Ωcm2 |
| jx | (effective) electrical current density per electrode area, carried by species x | A/cm2 |
| jsurf | electrical current density of released oxygen ions on the GDC surface | A/cm2 |
| jreact | (effective) density of reaction current per electrode volume | A/cm3 |
| σeff | effective ionic/electronic conductivity | S/cm |
| z | charge number | 1 |
| F | Faraday’s constant | C/mol |
| Δ(x) | perturbation of quantity x relative to the equilibrium with the gas phase and grounded electrical potential | Unit of x |
| pseudoelectrical potential, species x | V | |
| η | local overpotential in the porous electrode | V |
| ηgas | concentration overpotential of the gas phase | V |
| Cchem | chemical capacitance of the GDC phase | F/cm3 |
| Cchem,eff | effective chemical capacitance of the porous electrode | F/cm3 |
| Rion,Reon | effective ion/electron conduction resistance inverse of effective conductivity | Ωcm |
| Rint | ionic electrode/electrolyte interface resistance | Ωcm2 |
| D | diffusion coefficient | cm2/s |
Appendix C. Mathematical Isomorphisms and Differences to the Adler-Lane-Steele Model
The circuit model presented here is mathematically very similar to the Adler-Lane-Steele (ALS) model, which was explicitly developed for SOFC cathodes in 1996 [21,23]. This similarity is not surprising, as the fundamentals of conduction and reaction, as well as their boundary conditions, do not differ between cathodes and anodes.
The main advance of the presented model is the inclusion of electrode-electrolyte interface contributions; the possibility to include finite electron conductivity (e.g., for pure ceria or pure perovskite anodes) and a clear representation of the relation of fitted parameters to the electrode microstructure, ion conductivity of the GDC phase and surface specific electro-catalytic activity.
For comparison with the ALS model, we just consider the technologically most relevant case of high electronic conductivity (Reon~0) and an electrode that is at least three times thicker than the electrochemically active thickness, with negligible electrode-electrolyte interfacial resistance. In this case, the impedance function is simplified to a Gerischer impedance (isomorphic to the ALS model) as
Therein, is the DC polarization resistance, and τchem is the time constant of the electrode dispersion arc, given by
and
Therein, cv is the concentration of the oxygen vacancies and Dv the vacancy diffusion coefficient. W is the thermodynamic factor of the oxygen vacancies: The term r0(αf + αb) is proportional to the dependence of overpotential on the net oxygen exchange rate at the MIEC surface or, in other words, inversely proportional to the ASRsurf.
References
- Leah, R.T.; Bone, A.; Lankin, M.; Selcuk, A.; Rahman, M.; Clare, A.; Rees, L.; Phillip, S.; Mukerjee, S.; Selby, M. Ceres power steel cell technology: Rapid progress towards a truly commercially viable SOFC. ECS Trans. 2015, 68, 95–107. [Google Scholar] [CrossRef]
- Leah, R.T.; Bone, A.; Hammer, E.; Selcuk, A.; Rahman, M.; Clare, A.; Mukerjee, S.; Selby, M. Development progress on the ceres power steel cell technology platform: Further progress towards commercialization. ECS Trans. 2017, 78, 87–95. [Google Scholar] [CrossRef]
- Thaler, F.; Udomsilp, D.; Schafbauer, W.; Bischof, C.; Fukuyama, Y.; Miura, Y.; Kawabuchi, M.; Taniguchi, S.; Takemiya, S.; Nenning, A.; et al. Redox stability of metal-supported fuel cells with nickel/gadolinium-doped ceria anode. J. Power Sources 2019, 434, 226751. [Google Scholar] [CrossRef]
- Thaler, F.; Nenning, A.; Bischof, C.; Udomsilp, D.; de Haart, L.G.J.; Opitz, A.K.; Bram, M. Optimized cell processing as the key of high electrochemical performance of metal-supported solid oxide fuel cells. ECS Trans. 2019, 91, 887–900. [Google Scholar] [CrossRef]
- Nielsen, J.; Persson, A.H.; Muhl, T.T.; Brodersen, K. Towards high power density metal supported solid oxide fuel cell for mobile applications. ECS Trans. 2017, 78, 2029–2037. [Google Scholar] [CrossRef] [Green Version]
- Rojek, V.; Roehrens, D.; Brandner, M.; Menzler, N.H.; Guillon, O.; Opitz, A.K.; Bram, M. Development of high performance anodes for metal-supported fuel cells. Ion. Mix. Conduct. Ceram. 2015, 68, 1297–1307. [Google Scholar] [CrossRef]
- Udomsilp, D.; Roehrens, D.; Menzler, N.H.; Bischof, C.; de Haart, L.G.J.; Opitz, A.K.; Guillon, O.; Bram, M. High-performance metal-supported solid oxide fuel cells by advanced cathode processing. J. Electrochem. Soc. 2017, 164, F1375–F1384. [Google Scholar] [CrossRef] [Green Version]
- Tucker, M.C. Progress in metal-supported solid oxide fuel cells: A review. J. Power Sources 2010, 195, 4570–4582. [Google Scholar] [CrossRef]
- Krishnan, V.V. Recent developments in metal-supported solid oxide fuel cells. Wiley Interdiscip. Rev. Energy Environ. 2017, 6, e246. [Google Scholar] [CrossRef]
- Yang, Z.; Weil, K.S.; Paxton, D.M.; Stevenson, J.W. Selection and evaluation of heat-resistant alloys for SOFC interconnect applications. J. Electrochem. Soc. 2003, 150, A1188–A1201. [Google Scholar] [CrossRef]
- Udomsilp, D.; Rechberger, J.; Neubauer, R.; Bischof, C.; Thaler, F.; Schafbauer, W.; Menzler, N.H.; de Haart, L.G.J.; Nenning, A.; Opitz, A.K.; et al. High performing metal-supported solid oxide fuel cells for novel range extender systems in battery electric vehicles. Rev. 2020. [Google Scholar]
- Bischof, C.; Nenning, A.; Malleier, A.; Martetschläger, L.; Gladbach, A.; Schafbauer, W.; Opitz, A.K.; Bram, M. Microstructure optimization of nickel/gadolinium-doped ceria anodes as key to significantly increasing power density of metal-supported solid oxide fuel cells. Int. J. Hydrog. Energy 2019, 44, 31475–31487. [Google Scholar] [CrossRef]
- Dogdibegovic, E.; Wang, R.; Lau, G.Y.; Tucker, M.C. High performance metal-supported solid oxide fuel cells with infiltrated electrodes. J. Power Sources 2019, 410–411, 91–98. [Google Scholar] [CrossRef] [Green Version]
- Coduri, M.; Checchia, S.; Longhi, M.; Ceresoli, D.; Scavini, M. Rare earth doped ceria: The complex connection between structure and properties. Front. Chem. 2018, 6. [Google Scholar] [CrossRef] [PubMed]
- Schmitt, R.; Nenning, A.; Kraynis, O.; Korobko, R.; Frenkel, A.I.; Lubomirsky, I.; Haile, S.M.; Rupp, J.L.M. A review of defect structure and chemistry in ceria and its solid solutions. Chem. Soc. Rev. 2020, 49, 554–592. [Google Scholar] [CrossRef] [PubMed] [Green Version]
- Chueh, W.C.; Lai, W.; Haile, S.M. Electrochemical behavior of ceria with selected metal electrodes. Solid State Ion. 2008, 179, 1036–1041. [Google Scholar] [CrossRef]
- Trovarelli, A. Catalytic properties of ceria and CeO2-containing materials. Catal. Rev. 1996, 38, 439–520. [Google Scholar] [CrossRef]
- Chueh, W.C.; Hao, Y.; Jung, W.; Haile, S.M. High electrochemical activity of the oxide phase in model ceria-Pt and ceria-Ni composite anodes. Nat. Mater. 2012, 11, 155–161. [Google Scholar] [CrossRef] [Green Version]
- Jamnik, J.; Maier, J. Generalised equivalent circuits for mass and charge transport: Chemical capacitance and its implications. Phys. Chem. Chem. Phys. 2001, 3, 1668–1678. [Google Scholar] [CrossRef]
- Lai, W.; Haile, S.M. Impedance spectroscopy as a tool for chemical and electrochemical analysis of mixed conductors: A case study of ceria. J. Am. Ceram. Soc. 2005, 88, 2979–2997. [Google Scholar] [CrossRef] [Green Version]
- Adler, S.B.; Lane, J.A.; Steele, B.C.H. Electrode kinetics of porous mixed-conducting oxygen electrodes. J. Electrochem. Soc. 1996, 143, 3554–3564. [Google Scholar] [CrossRef]
- Flura, A.; Nicollet, C.; Vibhu, V.; Zeimetz, B.; Rougier, A.; Bassat, J.-M.; Grenier, J.-C. Application of the adler-lane-steele model to porous La2NiO4+δ SOFC cathode: Influence of interfaces with gadolinia doped ceria. J. Electrochem. Soc. 2016, 163, F523–F532. [Google Scholar] [CrossRef]
- Adler, S.B. Mechanism and kinetics of oxygen reduction on porous La1–xSrxCoO3–δ electrodes. Solid State Ion. 1998, 111, 125–134. [Google Scholar] [CrossRef]
- Boukamp, B.A.; Verbraeken, M.; Blank, D.H.A.; Holtappels, P. SOFC-anodes, proof for a finite-length type Gerischer impedance? Solid State Ion. 2006, 177, 2539–2541. [Google Scholar] [CrossRef]
- Boukamp, B.A.; Rolle, A. Analysis and application of distribution of relaxation times in solid state ionics. Solid State Ion. 2017, 302, 12–18. [Google Scholar] [CrossRef]
- Ivers-Tiffée, E.; Weber, A. Evaluation of electrochemical impedance spectra by the distribution of relaxation times. J. Ceram. Soc. Jpn. 2017, 125, 193–201. [Google Scholar] [CrossRef] [Green Version]
- Zhang, Y.; Chen, Y.; Yan, M.; Chen, F. Reconstruction of relaxation time distribution from linear electrochemical impedance spectroscopy. J. Power Sources 2015, 283, 464–477. [Google Scholar] [CrossRef]
- Bisquert, J.; Garcia-Belmonte, G.; Fabregat-Santiago, F.; Compte, A. Anomalous transport effects in the impedance of porous film electrodes. Electrochem. Commun. 1999, 1, 429–435. [Google Scholar] [CrossRef]
- Bisquert, J. Theory of the impedance of electron diffusion and recombination in a thin layer. J. Phys. Chem. B 2002, 106, 325–333. [Google Scholar] [CrossRef]
- Dierickx, S.; Mundloch, T.; Weber, A.; Ivers-Tiffée, E. Advanced impedance model for double-layered solid oxide fuel cell cermet anodes. J. Power Sources 2019, 415, 69–82. [Google Scholar] [CrossRef]
- Adler, S.B. Limitations of charge-transfer models for mixed-conducting oxygen electrodes. Solid State Ion. 2000, 135, 603–612. [Google Scholar] [CrossRef]
- Nielsen, J.; Jacobsen, T.; Wandel, M. Impedance of porous IT-SOFC LSCF:CGO composite cathodes. Electrochim. Acta 2011, 56, 7963–7974. [Google Scholar] [CrossRef]
- Nielsen, J.; Hjelm, J. Impedance of SOFC electrodes: A review and a comprehensive case study on the impedance of LSM:YSZ cathodes. Electrochim. Acta 2014, 115, 31–45. [Google Scholar] [CrossRef] [Green Version]
- Nenning, A.; Gerstl, M.; Bram, M.; Opitz, A.K. Mechanistic insight into porous electrode impedance: An example of Ni + YSZ cermet anodes. ECS Trans. 2019, 91, 479–490. [Google Scholar] [CrossRef]
- Cowin, P.I.; Petit, C.T.; Lan, R.; Irvine, J.T.; Tao, S. Recent progress in the development of anode materials for solid oxide fuel cells. Adv. Energy Mater. 2011, 1, 314–332. [Google Scholar] [CrossRef]
- Mahato, N.; Banerjee, A.; Gupta, A.; Omar, S.; Balani, K. Progress in material selection for solid oxide fuel cell technology: A review. Prog. Mater. Sci. 2015, 72, 141–337. [Google Scholar] [CrossRef]
- Su, C.; Wang, W.; Liu, M.; Tadé, M.O.; Shao, Z. Progress and prospects in symmetrical solid oxide fuel cells with two identical electrodes. Adv. Energy Mater. 2015, 5, 1500188. [Google Scholar] [CrossRef]
- Izzo, J.R.; Joshi, A.S.; Grew, K.N.; Chiu, W.K.S.; Tkachuk, A.; Wang, S.H.; Yun, W. Nondestructive reconstruction and analysis of SOFC anodes using X-ray computed tomography at sub-50 nm resolution. J. Electrochem. Soc. 2008, 155, B504–B508. [Google Scholar] [CrossRef] [Green Version]
- Kanno, D.; Shikazono, N.; Takagi, N.; Matsuzaki, K.; Kasagi, N. Evaluation of SOFC anode polarization simulation using three-dimensional microstructures reconstructed by FIB tomography. Electrochim. Acta 2011, 56, 4015–4021. [Google Scholar] [CrossRef]
- Masashi, K.; Marina, L.; Enrique, R.-T.; Nigel, B. Numerical modeling of nickel-infiltrated gadolinium-doped ceria electrodes reconstructed with focused ion beam tomography. Electrochim. Acta 2016, 190, 178–185. [Google Scholar]
- Shearing, P.R.; Golbert, J.; Chater, R.J.; Brandon, N.P. 3D reconstruction of SOFC anodes using a focused ion beam lift-out technique. Chem. Eng. Sci. 2009, 64, 3928–3933. [Google Scholar] [CrossRef]
- Tjaden, B.; Brett, D.J.L.; Shearing, P.R. Tortuosity in electrochemical devices: A review of calculation approaches. Int. Mater. Rev. 2018, 63, 47–67. [Google Scholar] [CrossRef] [Green Version]
- Zhang, D.; Bertei, A.; Tariq, F.; Brandon, N.; Cai, Q. Progress in 3D electrode microstructure modelling for fuel cells and batteries: Transport and electrochemical performance. Prog. Energy 2019, 1, 012003. [Google Scholar] [CrossRef]
- Gerstl, M.; Hutterer, A.; Fleig, J.; Bram, M.; Opitz, A.K. Model composite microelectrodes as a pathfinder for fully oxidic SOFC anodes. Solid State Ion. 2016, 298, 1–8. [Google Scholar] [CrossRef] [Green Version]
- Gerstl, M.; Nenning, A.; Iskandar, R.; Rojek-Woeckner, V.; Bram, M.; Hutter, H.; Opitz, A.K. The sulphur poisoning behaviour of gadolinia doped ceria model systems in reducing atmospheres. Materials 2016, 9, 649. [Google Scholar] [CrossRef] [Green Version]
- Chueh, W.C.; Haile, S.M. Electrochemical studies of capacitance in cerium oxide thin films and its relationship to anionic and electronic defect densities. Phys. Chem. Chem. Phys. 2009, 11, 8144–8148. [Google Scholar] [CrossRef]
- Schmid, A.; Rupp, G.M.; Slouka, C.; Navickas, E.; Andrejs, L.; Hutter, H.; Volgger, L.; Nenning, A.; Fleig, J. The chemical capacitance as a fingerprint of defect chemistry in mixed conducting oxides. Acta Chim. Slov. 2016, 63, 509–518. [Google Scholar]
- Schmid, A.; Rupp, G.M.; Fleig, J. Voltage and partial pressure dependent defect chemistry in (La,Sr)FeO 3−δ thin films investigated by chemical capacitance measurements. Phys. Chem. Chem. Phys. 2018, 20, 12016–12026. [Google Scholar] [CrossRef] [Green Version]
- Bishop, S.R.; Duncan, K.L.; Wachsman, E.D. Defect equilibria and chemical expansion in non-stoichiometric undoped and gadolinium-doped cerium oxide. Electrochim. Acta 2009, 54, 1436–1443. [Google Scholar] [CrossRef]
- Wang, S.; Inaba, H.; Tagawa, H.; Dokiya, M.; Hashimoto, T. Nonstoichiometry of Ce0.9Gd0.1O1.95−x. Solid State Ion. 1998, 107, 73–79. [Google Scholar] [CrossRef]
- Bishop, S.R.; Duncan, K.L.; Wachsman, E.D. Surface and bulk oxygen non-stoichiometry and bulk chemical expansion in gadolinium-doped cerium oxide. Acta Mater. 2009, 57, 3596–3605. [Google Scholar] [CrossRef]
- Kuhn, M.; Fukuda, Y.; Hashimoto, S.; Sato, K.; Yashiro, K.; Mizusaki, J. Oxygen nonstoichiometry and thermo-chemical stability of perovskite-type La0. 6Sr0. 4Co1-yFeyO3-δ (y = 0, 0.2, 0.4, 0.5, 0.6, 0.8, 1) Materials. J. Electrochem. Soc. 2013, 160, F34–F42. [Google Scholar] [CrossRef]
- Bisquert, J. Influence of the boundaries in the impedance of porous film electrodes. Phys. Chem. Chem. Phys. 2000, 2, 4185–4192. [Google Scholar] [CrossRef]
- Boukamp, B.A.; Bouwmeester, H.J.M. Interpretation of the Gerischer impedance in solid state ionics. Solid State Ion. 2003, 157, 29–33. [Google Scholar] [CrossRef]
- Haydn, M.; Bischof, C.; Udomsilp, D.; Opitz, A.K.; Bimashofer, G.; Schafbauer, W.; Brandner, M.; Bram, M. Metal supported SOFCs: Electrochemical performance under various testing conditions. ECS Trans. 2017, 78, 1993–2003. [Google Scholar] [CrossRef]
- Rojek-Wöckner, V.A.; Opitz, A.K.; Brandner, M.; Mathé, J.; Bram, M. A novel Ni/ceria-based anode for metal-supported solid oxide fuel cells. J. Power Sources 2016, 328, 65–74. [Google Scholar] [CrossRef]
- Opitz, A.; Gerstl, M.; Bram, M. Model-system supported impedance simulation of composite electrodes. Fuel Cells 2019, 19, 417–428. [Google Scholar] [CrossRef] [Green Version]
- Nenning, A.; Opitz, A.K.; Huber, T.M.; Fleig, J. A novel approach for analyzing electrochemical properties of mixed conducting solid oxide fuel cell anode materials by impedance spectroscopy. Phys. Chem. Chem. Phys. 2014, 16, 22321–22336. [Google Scholar] [CrossRef]
- Primdahl, S.; Mogensen, M. Gas diffusion impedance in characterization of solid oxide fuel cell anodes. J. Electrochem. Soc. 1999, 146, 2827–2833. [Google Scholar] [CrossRef]
- Bird, R.B.; Stewart, W.E.; Lightfoot, E.N. Transport Phenomena; John Wiley & Sons: Hoboken, NJ, USA, 2007; ISBN 978-0-470-11539-8. [Google Scholar]
- Suwanwarangkul, R.; Croiset, E.; Fowler, M.W.; Douglas, P.L.; Entchev, E.; Douglas, M.A. Performance comparison of Fick’s, dusty-gas and Stefan–Maxwell models to predict the concentration overpotential of a SOFC anode. J. Power Sources 2003, 122, 9–18. [Google Scholar] [CrossRef]
- Iwai, H.; Shikazono, N.; Matsui, T.; Teshima, H.; Kishimoto, M.; Kishida, R.; Hayashi, D.; Matsuzaki, K.; Kanno, D.; Saito, M.; et al. Quantification of SOFC anode microstructure based on dual beam FIB-SEM technique. J. Power Sources 2010, 195, 955–961. [Google Scholar] [CrossRef]
- Kim, S.; Merkle, R.; Maier, J. Oxygen nonstoichiometry of nanosized ceria powder. Surf. Sci. 2004, 549, 196–202. [Google Scholar] [CrossRef]
- Nenning, A.; Volgger, L.; Miller, E.; Mogni, L.V.; Barnett, S.; Fleig, J. The electrochemical properties of Sr (Ti, Fe) O3-δ for anodes in solid oxide fuel cells. J. Electrochem. Soc. 2017, 164, F364–F371. [Google Scholar] [CrossRef] [Green Version]
- Gopal, C.B.; Gabaly, F.E.; McDaniel, A.H.; Chueh, W.C. Origin and tunability of unusually large surface capacitance in doped cerium oxide studied by ambient-pressure X-Ray photoelectron spectroscopy. Adv. Mater. 2016, 28, 4692–4697. [Google Scholar] [CrossRef]
- Tsoga, A.; Gupta, A.; Naoumidis, A.; Nikolopoulos, P. Gadolinia-doped ceria and yttria stabilized zirconia interfaces: Regarding their application for SOFC technology. Acta Mater. 2000, 48, 4709–4714. [Google Scholar] [CrossRef]
- Wang, S.R.; Kobayashi, T.; Dokiya, M.; Hashimoto, T. Electrical and ionic conductivity of Gd-doped ceria. J. Electrochem. Soc. 2000, 147, 3606–3609. [Google Scholar] [CrossRef]
- Joos, J.; Carraro, T.; Weber, A.; Ivers-Tiffée, E. Reconstruction of porous electrodes by FIB/SEM for detailed microstructure modeling. J. Power Sources 2011, 196, 7302–7307. [Google Scholar] [CrossRef]
- Carniglia, S.C. Construction of the tortuosity factor from porosimetry. J. Catal. 1986, 102, 401–418. [Google Scholar] [CrossRef]
- Avila-Paredes, H.J.; Choi, K.; Chen, C.-T.; Kim, S. Dopant-concentration dependence of grain-boundary conductivity in ceria: A space-charge analysis. J. Mater. Chem. 2009, 19, 4837–4842. [Google Scholar] [CrossRef]
- Zhang, T.S.; Ma, J.; Cheng, H.; Chan, S.H. Ionic conductivity of high-purity Gd-doped ceria solid solutions. Mater. Res. Bull. 2006, 41, 563–568. [Google Scholar] [CrossRef]
- Guo, X.; Waser, R. Electrical properties of the grain boundaries of oxygen ion conductors: Acceptor-doped zirconia and ceria. Prog. Mater. Sci. 2006, 51, 151–210. [Google Scholar] [CrossRef]
- Nenning, A.; Opitz, A. Low oxygen partial pressure increases grain boundary ion conductivity in Gd-doped ceria thin films. J. Phys. Energy 2019, 2, 014002. [Google Scholar] [CrossRef]
- Jung, W.; Gu, K.L.; Choi, Y.; Haile, S.M. Robust nanostructures with exceptionally high electrochemical reaction activity for high temperature fuel cell electrodes. Energy Environ. Sci. 2014, 7, 1685–1692. [Google Scholar] [CrossRef] [Green Version]
- Lee, S.; Seo, J.; Jung, W. Sintering-resistant Pt@CeO2 nanoparticles for high-Temperature oxidation catalysis. Nanoscale 2016, 8, 10219–10228. [Google Scholar] [CrossRef] [Green Version]
- Jung, W.; Dereux, J.O.; Chueh, W.C.; Hao, Y.; Haile, S.M. High electrode activity of nanostructured, columnar ceria films for solid oxide fuel cells. Energy Environ. Sci. 2012, 5, 8682–8689. [Google Scholar] [CrossRef] [Green Version]
Figure 1.
Sketch of conduction and surface reaction in a porous Ni/GDC (gadolinium-doped ceria) electrode, including ion and electron conduction, as well as electrochemical fuel oxidation on the GDC surface.
Figure 1.
Sketch of conduction and surface reaction in a porous Ni/GDC (gadolinium-doped ceria) electrode, including ion and electron conduction, as well as electrochemical fuel oxidation on the GDC surface.

Figure 2.
(a) Equivalent circuit model of an infinitesimally thin slice of the electrode (thickness dy) and (b) transmission-line-type equivalent circuit representing the differential equations for charge transport and electrochemical reactions in porous electrodes.
Figure 2.
(a) Equivalent circuit model of an infinitesimally thin slice of the electrode (thickness dy) and (b) transmission-line-type equivalent circuit representing the differential equations for charge transport and electrochemical reactions in porous electrodes.

Figure 3.
Circuit model used for fitting the impedance spectra, which includes elements that model the electrolyte ohmic resistance, wiring inductance and ion conduction through the electrode-electrolyte interface.
Figure 3.
Circuit model used for fitting the impedance spectra, which includes elements that model the electrolyte ohmic resistance, wiring inductance and ion conduction through the electrode-electrolyte interface.

Figure 4.
(a) Simulated impedance spectra for different electrode thicknesses (15 and 2.5 μm), with parameter values typical for Ni/GDC at 750 °C. (b) Effect of electrode thickness on the polarization resistance ASReff, according to Equation (32).
Figure 4.
(a) Simulated impedance spectra for different electrode thicknesses (15 and 2.5 μm), with parameter values typical for Ni/GDC at 750 °C. (b) Effect of electrode thickness on the polarization resistance ASReff, according to Equation (32).
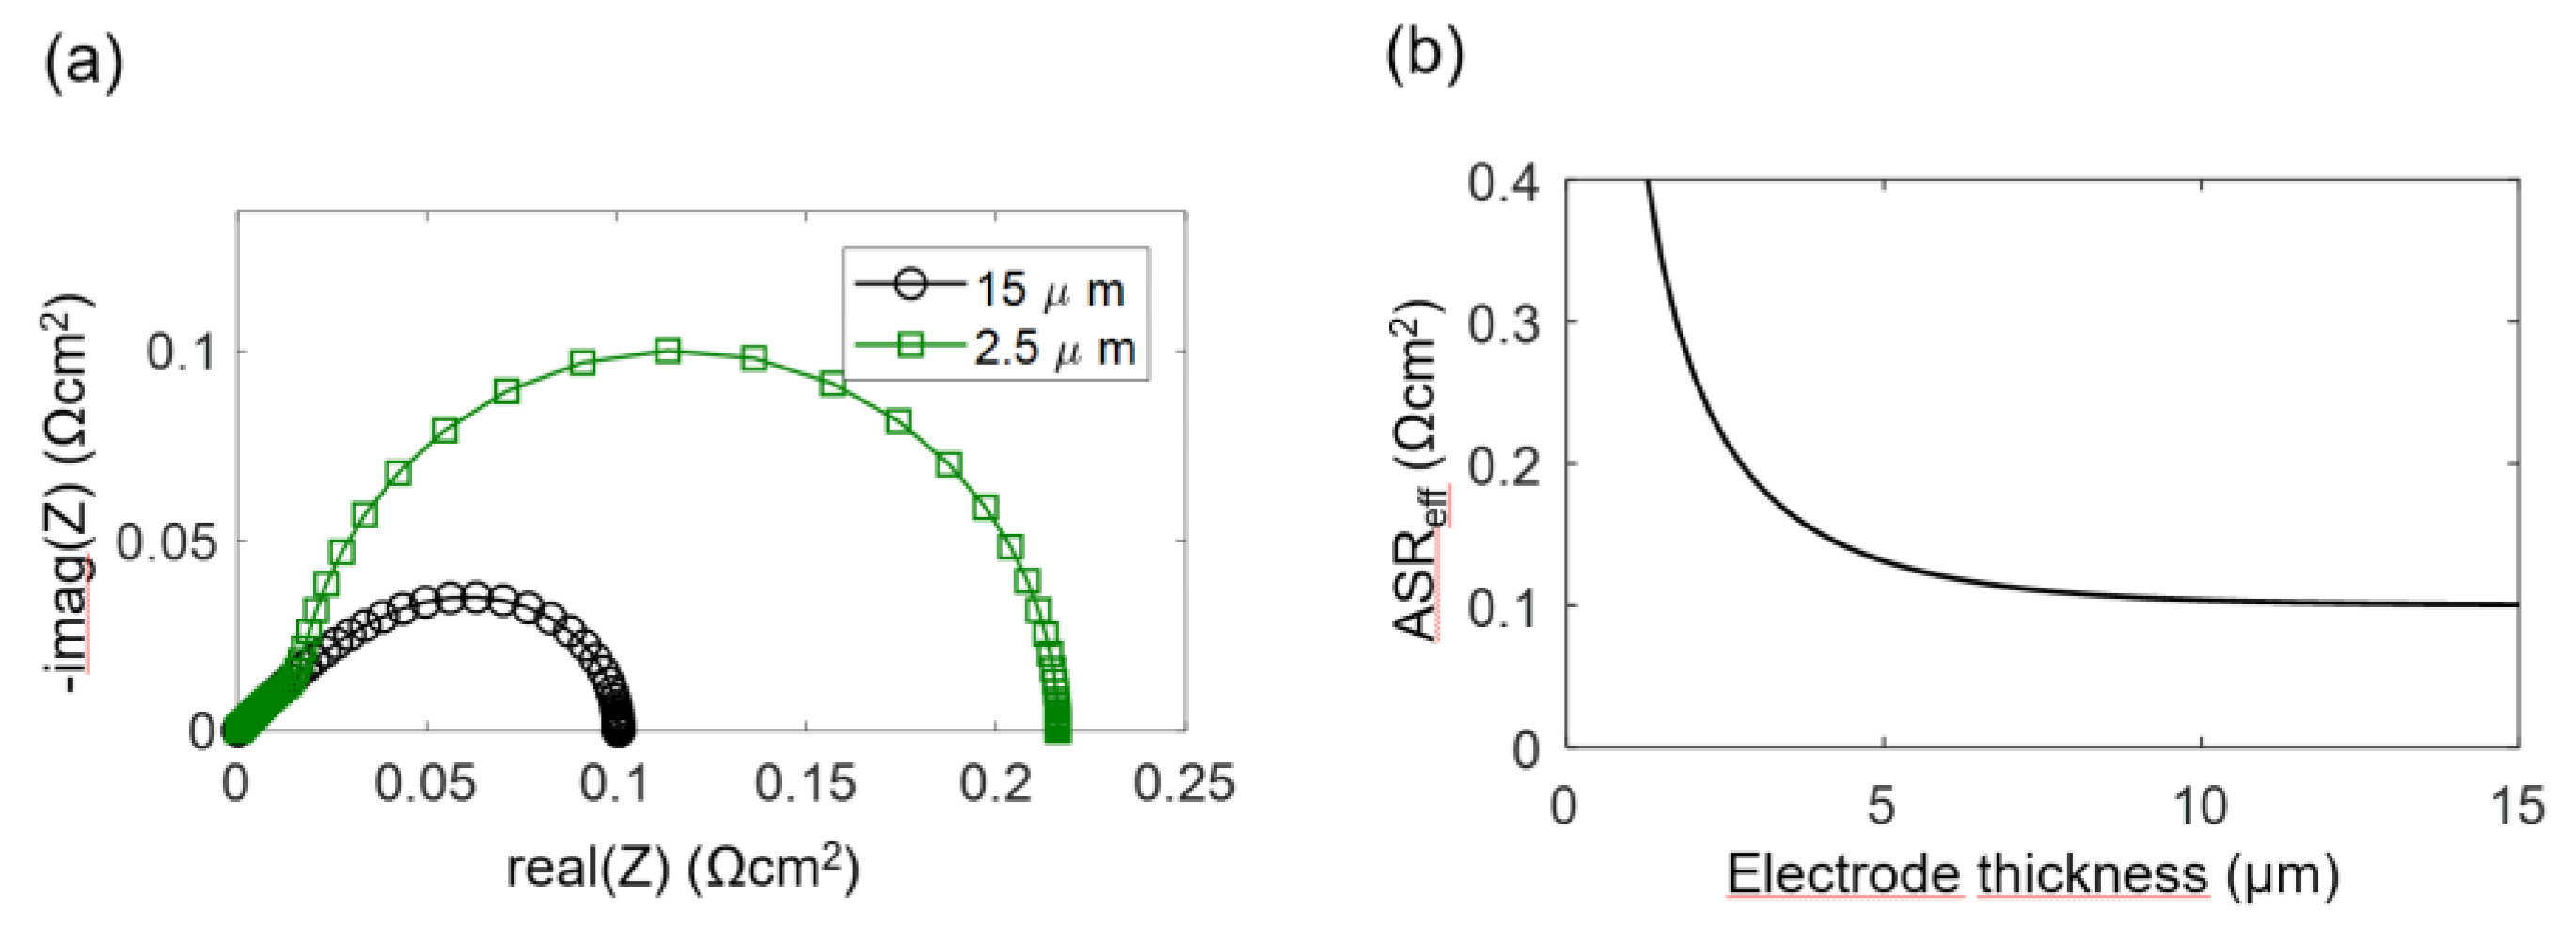
Figure 5.
Plots of the local overpotential η and electronic/ionic current densities as a function of the distance from electrolyte for a (a) 2.5 and (b) 15-μm-thick electrode. Electrode surface: y = 0, and electrolyte interface: y = 2.5 μm (a) or 15 μm (b). Corresponding impedance spectra are plotted in Figure 4.
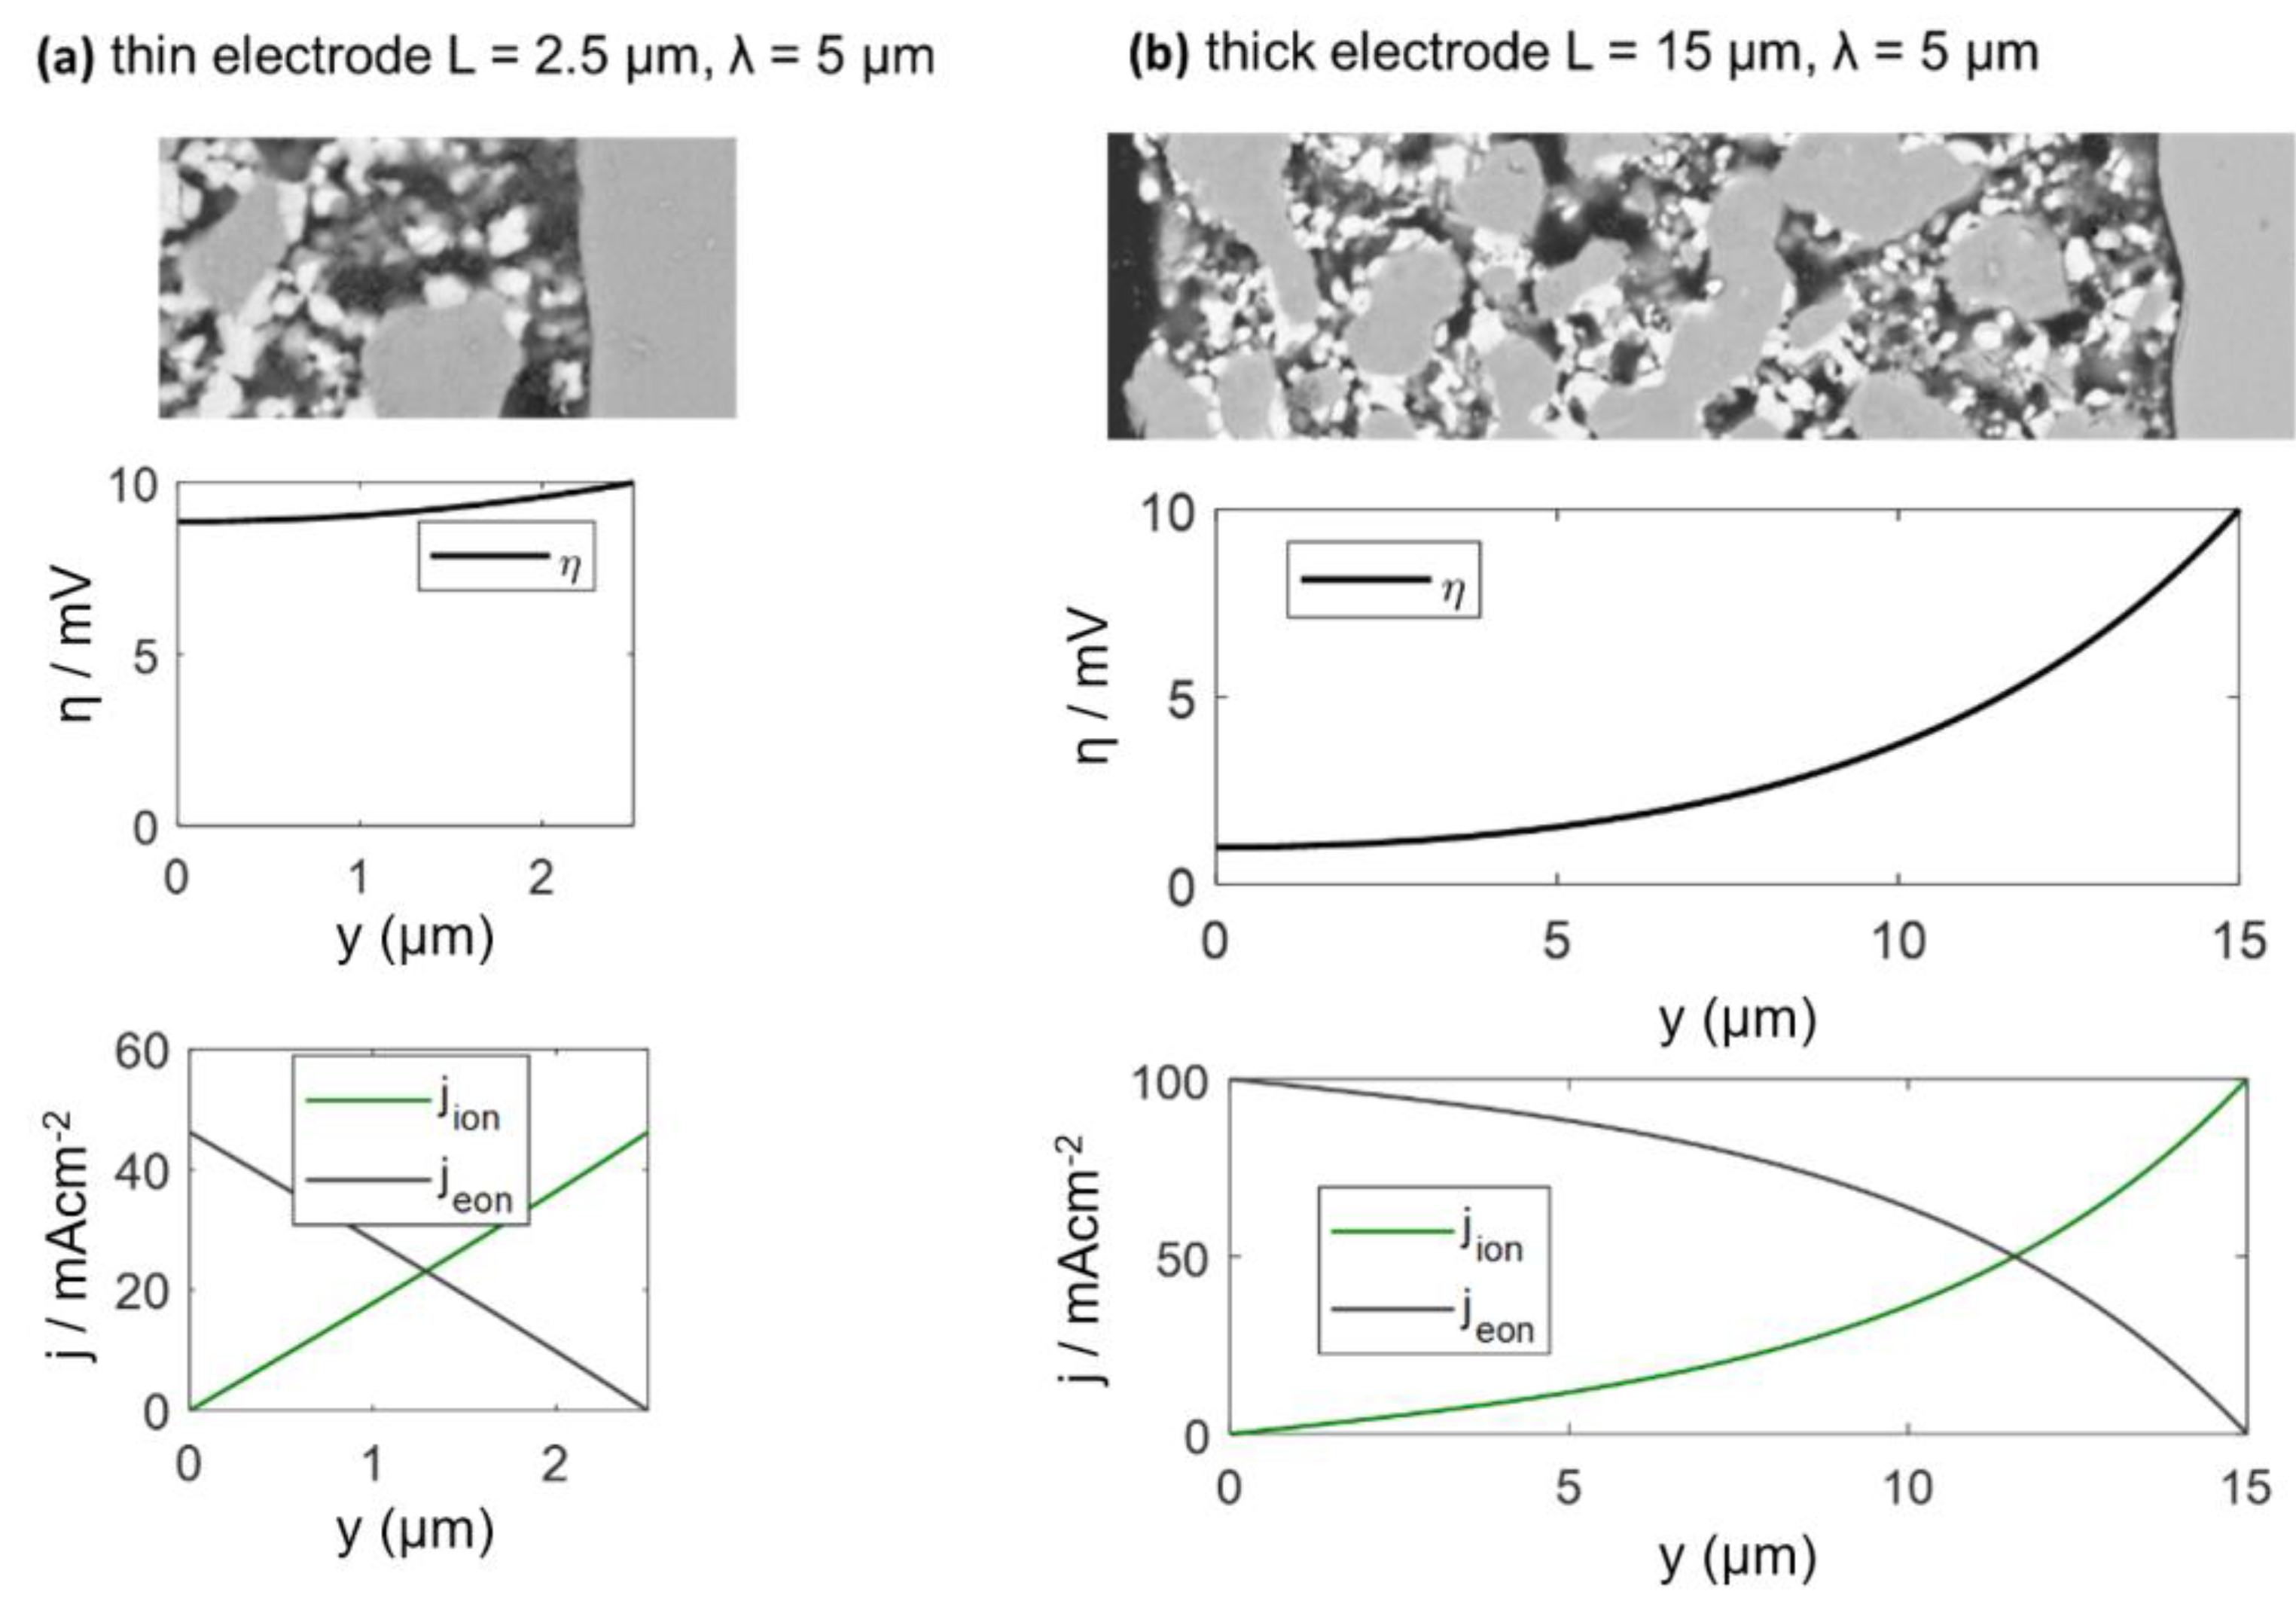
Figure 6.
(a) Sketch of gas diffusion concentration gradients in a porous electrode support structure, with primary diffusion direction perpendicular to the electrode. (b) Gas diffusion in the used symmetrical anode testing setup, with primary diffusion direction in-plane of the electrode.
Figure 6.
(a) Sketch of gas diffusion concentration gradients in a porous electrode support structure, with primary diffusion direction perpendicular to the electrode. (b) Gas diffusion in the used symmetrical anode testing setup, with primary diffusion direction in-plane of the electrode.

Figure 7.
(a) Sketch of mounting and contacting of a symmetrical Ni/GDC anode cell. (b) Photograph of the cell measurement assembly. Four symmetrical cells are mounted in the single-chamber impedance test rig and measured in one run by a multiplexed measurement.
Figure 7.
(a) Sketch of mounting and contacting of a symmetrical Ni/GDC anode cell. (b) Photograph of the cell measurement assembly. Four symmetrical cells are mounted in the single-chamber impedance test rig and measured in one run by a multiplexed measurement.

Figure 8.
SEM images of the anode cells after electrochemical characterization with (a) 8-µm and (b) 14-µm-thickness and (c) with a GDC thin film deposited before electrode screen printing. Due to the used backscatter electron detection in the figure parts a and b, chemical contrast allows differentiation between GDC (bright) and Ni (grey) particles.

Figure 9.
Impedance spectra of Ni-GDC anode cells (blue circles) in a pure H2+H2O atmosphere, and (grey circles) diluted H2+H2O in Ar balance. Both spectra overlap in the high-frequency regime and have the same electrolyte offset resistance.
Figure 9.
Impedance spectra of Ni-GDC anode cells (blue circles) in a pure H2+H2O atmosphere, and (grey circles) diluted H2+H2O in Ar balance. Both spectra overlap in the high-frequency regime and have the same electrolyte offset resistance.

Figure 10.
(a) Literature values for oxygen nonstoichiometry of GDC10 at 600, 700 and 800 °C (blue circles; right y-axis) by Bishop et al. [51] and chemical capacitance, calculated from the first derivative of the nonstoichiometry isotherms by Equation (16) (black lines; left y-axis). Red stars symbols represent the oxygen partial pressures corresponding to the EIS testing conditions in the present work. (b) Fitted effective chemical capacitance of the electrodes as a function of temperature in comparison with calculated chemical capacitance derived from literature nonstoichiometry data by Bishop [51] and Wang [50] and a GDC volume fraction of 0.3.

Figure 11.
(a) Measured (symbols) and fitted (lines) impedance spectra of Ni/GDC anodes (6, 8 and 14-µm-thick) at 750 °C in 45 mbar H2 + 25 mbar H2O without balance gas. For comparability, the electrolyte resistance was subtracted. (b) Plot of measured ASR after subtracting the interfacial resistance compared to the circuit model. The grey vertical line represents the averaged electrochemically active thickness λ, and the dashed line represents ASR as a function of the thickness, according to the circuit model with averaged fitting parameters.

Figure 12.
(a) Measured impedance of an 8-µm-thick anode at 750 °C (circles) with a least squares fit (black line) compared to the model prediction with parameters from Table 2. (b) ASR of the electrode after subtracting the interfacial resistance Rint compared to the model prediction summarized in Table 2. (c) ASR for the ion transfer at the YSZ-GDC interface. (d) Effective (volumetric) reaction resistance. (e) Effective ionic conductivity compared to the literature value of dense GDC10 [67]. (f) Electrochemically active thickness. Calculated activation energies (Ea) are given in the legends.

Figure 13.
comparison of impedance spectra of 7.5 µm thick Ni/GDC electrodes with (A) and without (B) a dense GDC10 buffer layer between electrode and electrolyte, measured in 275 mbar H2 + 25 mbar H2O at 750 °C.
Figure 13.
comparison of impedance spectra of 7.5 µm thick Ni/GDC electrodes with (A) and without (B) a dense GDC10 buffer layer between electrode and electrolyte, measured in 275 mbar H2 + 25 mbar H2O at 750 °C.
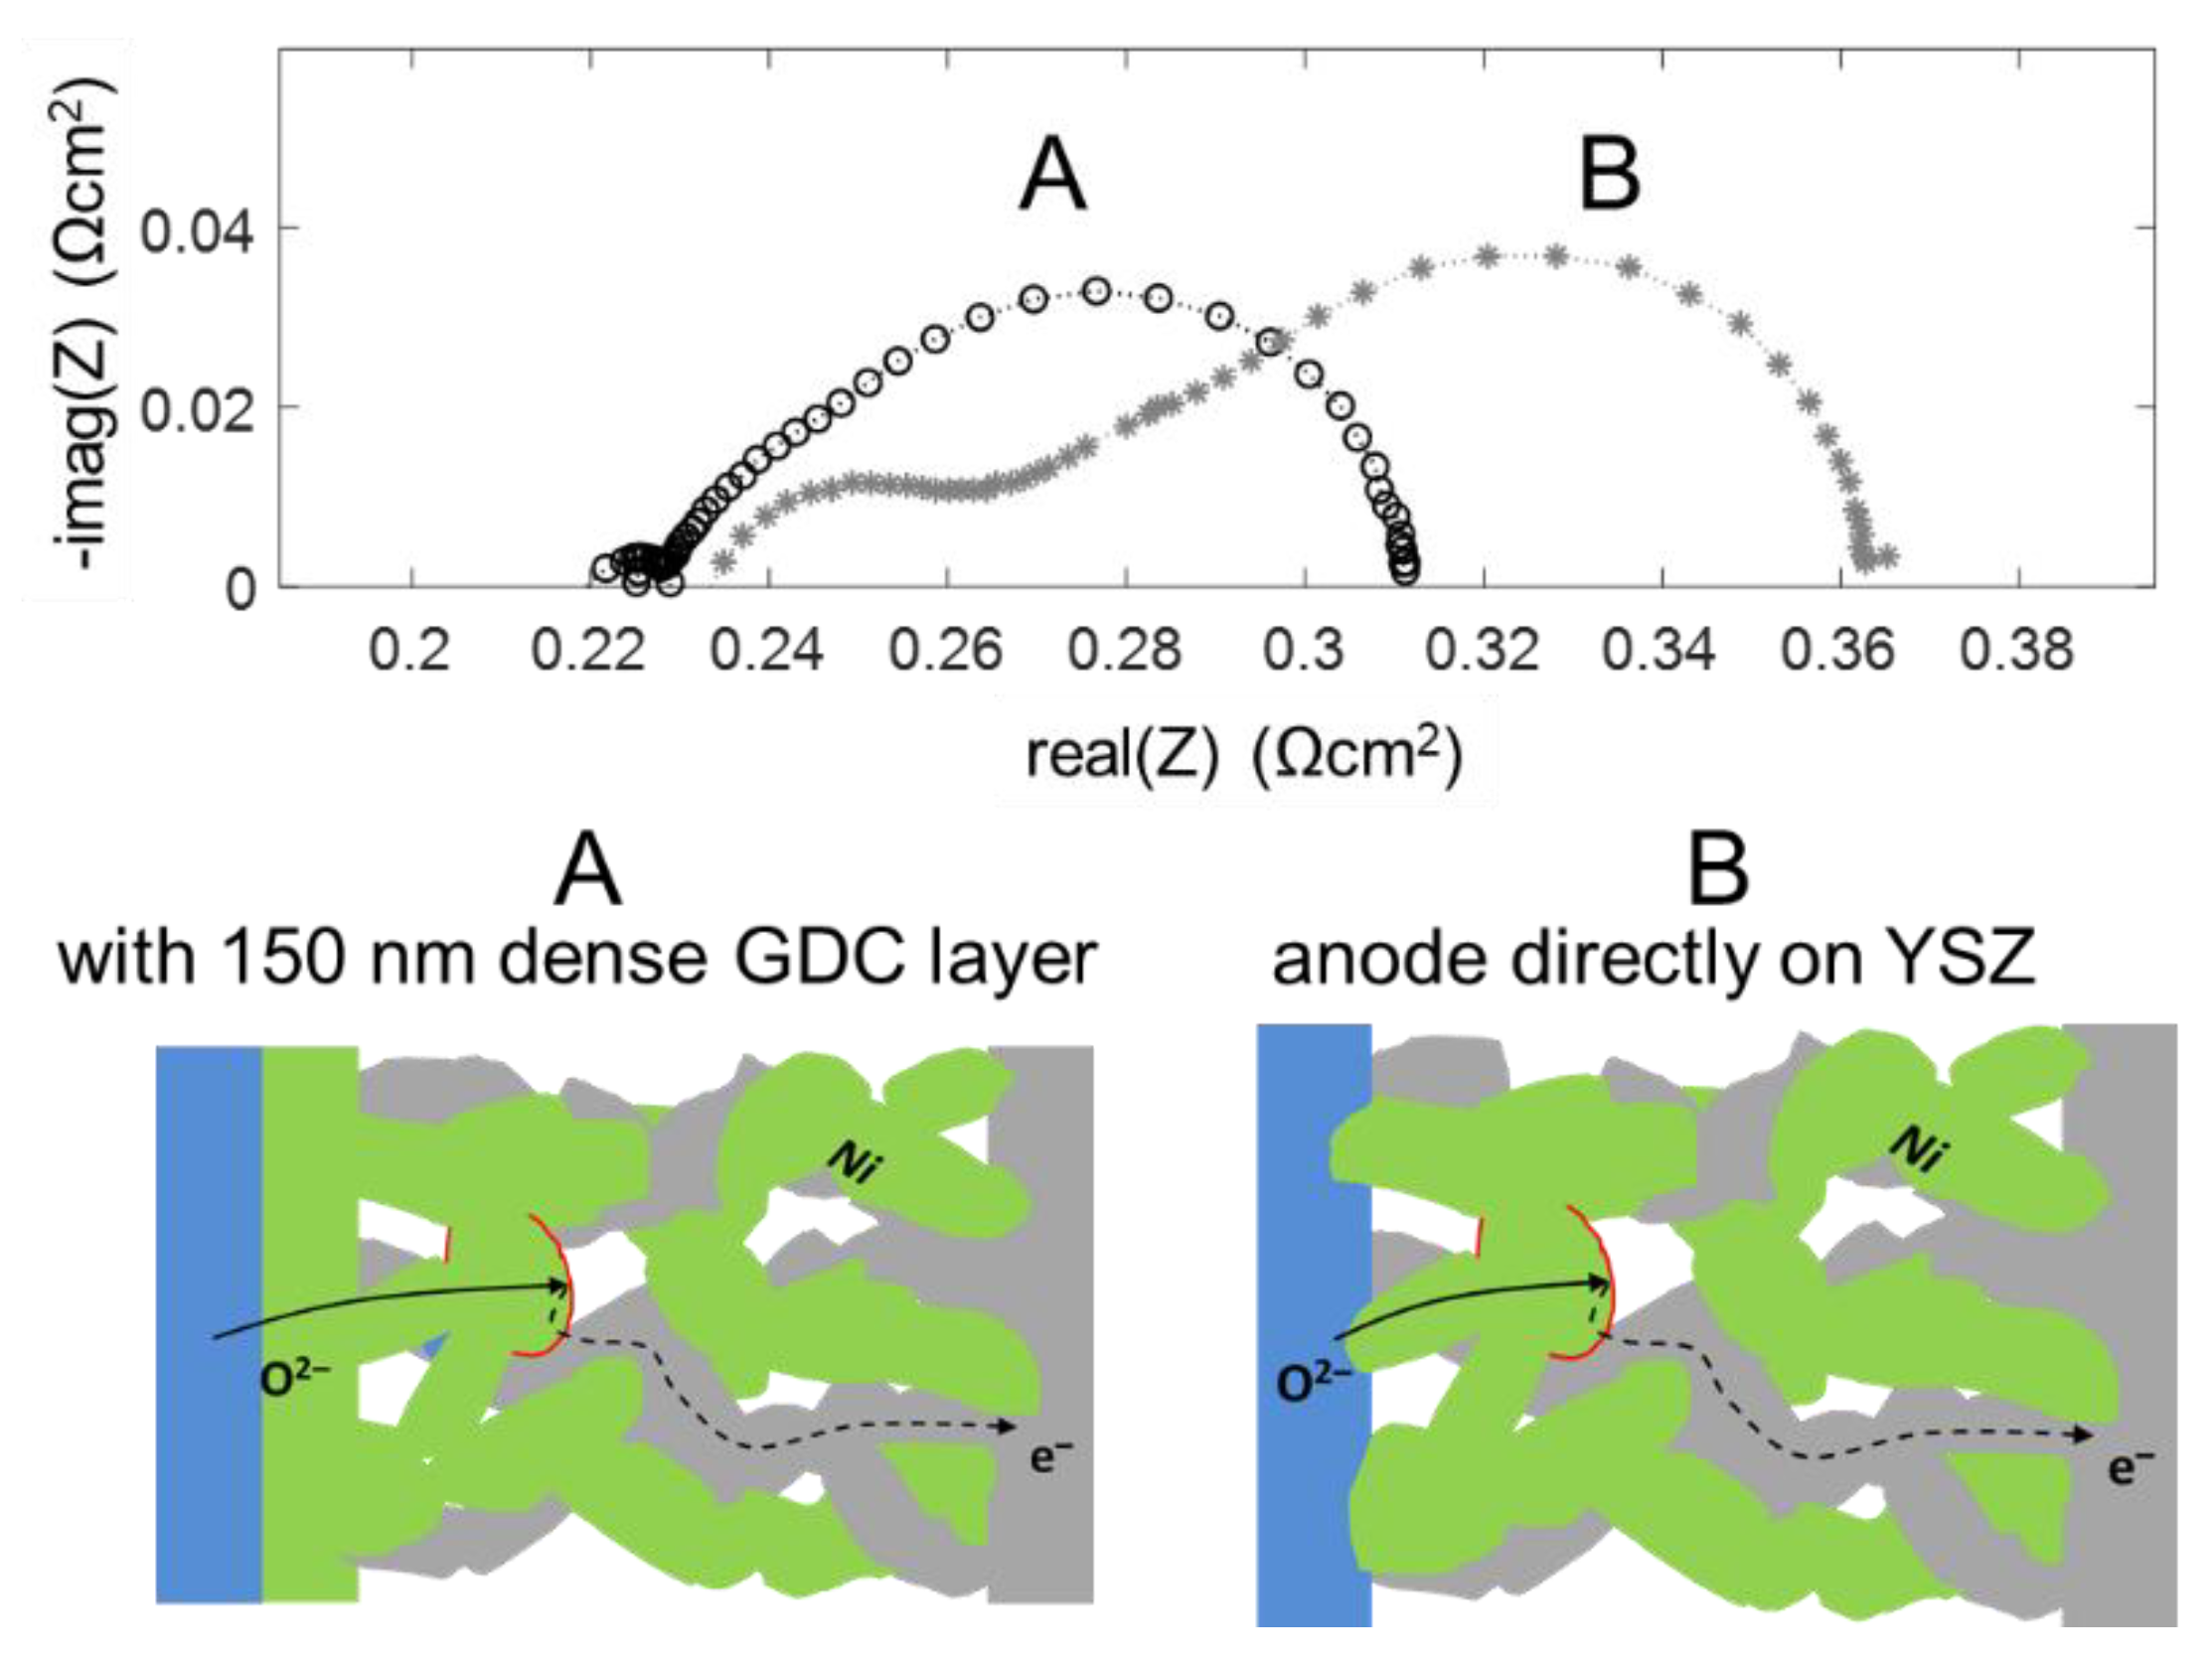
Table 1.
Binary diffusion coefficients and diffusion ASR for 1-mm porous support with 40% porosity and tortuosity factor 2 at 750 °C.
Table 1.
Binary diffusion coefficients and diffusion ASR for 1-mm porous support with 40% porosity and tortuosity factor 2 at 750 °C.
| Gas Phase Pressures (mbar) | Dbinary (cm2/s) [60] | ASRdiff (Ωcm2) | Jlimit (Acm−2) |
|---|---|---|---|
| 25 H2 + 25 H2O + 950 Ar | 6.3 (H2-Ar); 2 (H2O-Ar) | 0.27 | 0.75 |
| 500 H2 + 500 H2O | 7.2 (H2-H2O) | 0.005 | 16 |
| 990 H2 + 10 H2O | 7.2 (H2-H2O) | 0.14 | 32 |
| 45 H2 + 25 H2O | 110 (H2-H2O) | 0.006 | 21 |
| 150 O2 + 850 N2 | 1.7 (O2-N2) | 0.01 | 2.3 |
| 10 O2 + 990 N2 | 0.15 (O2-N2) | 0.15 | 0.16 |
Table 2.
Microstructural and electrochemical electrode parameters used for impedance prediction, and average results from equivalent circuit fitting.
Table 2.
Microstructural and electrochemical electrode parameters used for impedance prediction, and average results from equivalent circuit fitting.
| Parameter | Value (Prediction) | Value (Fit, Mean) | Reference |
|---|---|---|---|
| GDC phase ion conductivity | 25 mS/cm (650 °C) 60 mS/cm (750 °C) | - | GDC10 polycrystal [67] |
| GDC phase volume fraction | 0.3 | - | Porosity estimate from SEM cross-sections |
| GDC phase tortuosity | 3 | 2.7 ± 0.4 | Estimate from SEM cross-sections [40,62,68,69] |
| Effective ion conductivity | 2.5 mS/cm (650 °C) 6 mS/cm (750 °C) | 2.5 ± 0.15 mS/cm (650 °C) 5.3 ± 0.5 mS/cm (750 °C) | |
| Effective chemical capacitance | 90 F/cm3 (650 °C) 260 F/cm3 (750 °C) | 112 ± 4 F/cm3 (650 °C) 321 ± 6 F/cm3 (750 °C) | Thermogravimetry [50,51], Equation (14) |
| GDC surface ASR | 6 Ωcm2 (650 °C) 4 Ωcm2 (750 °C) | - | Thin film electrodes (initial performance) 650 °C: [18]; 750 °C: [44] |
| Specific GDC surface area | 5 μm2/ μm3 | - | Particle packing model, Appendix A |
| Electrochemical reaction resistance (Rreact) | 120 µΩcm3(650 °C) 80 µΩcm3 (750 °C) | 70 ± 10µΩcm3 (650 °C) 36 ± 5 µΩcm3 (750 °C) | |
| Electrode ASR (6-μm-thickness) | 0.23 Ωcm2 (650 °C) 0.13 Ωcm2 (750 °C) | 0.17 ± 0.02 Ωcm2 (650 °C) 0.08 ± 0.01 Ωcm2 (750 °C) | Equation (29) |
| Electrochemically active thickness | 5.4 µm (650 °C) 6.4 µm (750 °C) | 4.4 ± 0.4 µm (650 °C) 4.2 ± 0.4 µm (750 °C) |
© 2020 by the authors. Licensee MDPI, Basel, Switzerland. This article is an open access article distributed under the terms and conditions of the Creative Commons Attribution (CC BY) license (http://creativecommons.org/licenses/by/4.0/).
Share and Cite
MDPI and ACS Style
Nenning, A.; Bischof, C.; Fleig, J.; Bram, M.; Opitz, A.K. The Relation of Microstructure, Materials Properties and Impedance of SOFC Electrodes: A Case Study of Ni/GDC Anodes. Energies 2020, 13, 987. https://doi.org/10.3390/en13040987
AMA Style
Nenning A, Bischof C, Fleig J, Bram M, Opitz AK. The Relation of Microstructure, Materials Properties and Impedance of SOFC Electrodes: A Case Study of Ni/GDC Anodes. Energies. 2020; 13(4):987. https://doi.org/10.3390/en13040987
Chicago/Turabian StyleNenning, Andreas, Cornelia Bischof, Jürgen Fleig, Martin Bram, and Alexander K. Opitz. 2020. "The Relation of Microstructure, Materials Properties and Impedance of SOFC Electrodes: A Case Study of Ni/GDC Anodes" Energies 13, no. 4: 987. https://doi.org/10.3390/en13040987
Note that from the first issue of 2016, this journal uses article numbers instead of page numbers. See further details here.