Abstract
The durability and performance of electrochemical energy converters, such as fuel cells and electrolysers, are not only dependent on the properties and the quality of the used materials. They strongly depend on the operational conditions. Variations in external parameters, such as flow, pressure, temperature and, obviously, load, can lead to significant local changes in current density, even local transients. Segmented cell technology was developed with the purpose to gain insight into the local operational conditions in electrochemical cells during operation. The operando measurement of the local current density and temperature distribution allows effective improvement of operation conditions, mitigation of potentially critical events and assessment of the performance of new materials. The segmented cell, which can replace a regular bipolar plate in the current state of the technology, can be used as a monitoring tool and for targeted developments. This article gives an overview of the development and applications of this technology, such as for water management or fault recognition. Recent advancements towards locally resolved monitoring of humidity and to current distributions in electrolysers are outlined.
1. Introduction
Electrochemical converters are considered to take a key role in humanity’s challenge for the following decades—to avert a climate catastrophe. Following the Accord de Paris of 2015, the Special Report on Global Warming of 1.5 °C of 2018 formulated even more drastic goals for the reduction of carbon dioxide emissions [1]. Hydrogen energy technologies play an important role in a decarbonised economy. Hydrogen fuel cells are highly efficient energy converters providing electric energy directly [2], and in particular proton exchange membrane fuel cells (PEMFC) have recently attracted growing public attention as power sources in cars [3,4]. The reverse technology, electrolysis of water, is producing hydrogen. As the electricity market has a growing share of renewables, like wind and solar energy, there are more and more fluctuations, and thus an increasing number of hours of cheap or even negatively prized electricity. This makes electrolysis in general more and more a competitor against cracking of natural gas, when considering the costs only [5,6,7]. Moreover, electrolysers can act as grid stabilising electrical loads, consuming excess electricity peaks, in particular in small scales in sub grids [8]. The local aspect of a local hydrogen supply adds another building block to a hydrogen economy by locally supplying hydrogen refuelling stations, which are required for hydrogen-based electromobility [9,10].
Both fuel cells and electrolysers have undergone significant developments over the last decades and, as they are relatively modern compared to combustion engines, their lifetime under realistic operational conditions suffers from mechanical, chemical and physical degradation processes [11,12,13]. To be able to compete with combustion technologies in cost-driven economies, with their head-start of many years, modern tools for a thorough understanding and a targeted development are required. The advances in numerical modelling have reached such an advanced level that development based on predictive simulation appears realistic; however, without experimental validation from experimental data, in particular internal, locally resolved operational data, such a strategy is futile [14]. Segmented cell technology, which was developed in parallel, provides such an experimental fundament, adding commonly used external operational data, such as cell voltage and current control, monitoring of temperature, reactant flow and purity, as well as electrochemical impedance spectroscopy.
2. Development of Segmented Cell Technology
The first concepts in the monitoring of currents generated in a PEM fuel cell with a spatially resolved aspect were pursued by the end of the 1980s. An overview of the development timeline is given in Table 1. The principle and the need for locally resolved data were demonstrated by Rieke et al. in a photolithographically structured array of microelectrodes in a fuel cell with embedded counter electrodes [15]. Similarly, in electrolysis, the principle was shown by the means of microelectrodes in the electrolysis of potassium ferricyanide [16] and with linear PCB (printed circuit board) electrodes in the electrolysis of copper sulphate [17]. The concept of a segmented MEA with microelectrodes in the fuel cells was extended by using a PCB current collector and used to evaluate the homogeneity of the reactant supply [18]. An overview over other approaches for PEM fuel cells was given by Stumper et al.; for example, the use of partially catalyst-covered or partially masked MEAs, the manipulation of the MEA and flow-field plate to isolate individual spots from each other, and the introduction of an array of graphitic resistor elements with individual sensing wires, utilising the voltage drop as signal [19]. This PCB technology was successfully applied without segmentation of the MEA, using individual electrical loads for each segment along a single flow channel [20]. The utilisation of the Hall effect led to a two-dimensional approach with stack integration capability. One directly observable result was the strong dependency of the current homogeneity on an evenly distributed clamping pressure of the electrochemical converter [21]. The measurement principle was pursued by Reshetenko et al., for systematic studies on a variety of operational parameters [22,23,24] and component properties [25,26,27]. A setup with individual current collectors, integrated in an endplate, was demonstrated by Noponen et al., in a free-breathing PEM fuel cell [28]. The effect of water management on the current homogeneity was demonstrated by Büchi et al., with an early setup of a semi-segmented endplate for a fuel cell stack with 200 cm2 of active area. It showed that in the technical dimensions, severe heterogeneities can already exist at a constant current operation and moderately low air stoichiometries or a moderately low air dew point [29]. Variations of the segmented endplate were carried out by Yoon et al., with a an array of graphite blocks in a bakelite frame [30], by Liu et al., with copper bolts, individually insulated in a copper frame [31,32], and by Hwang et al., with an array of Ti-coated stainless-steel segments embedded in a polyoxymethylene frame [33]. Both technologies allowed to mill-in flow channels for a directed distribution of reactant gases and fluids. Similar setups with segmented endplates were used by Liang et al., for studies on reactant starvation [34,35]. In another design with segmented endplates and graphitic current collectors for a larger area and with individual electrical loads, electrochemical impedance spectroscopy (EIS) was combined with the method to investigate the effect of low humidity in fuel cells [36]. The present patented segmented cell technology for fuel cells [37,38] consists of a printed circuit board with a segmentation that is carried out in the form of current collectors placed on the top of the epoxy glass resin matrix. The measurement is based on the voltage drop along the internal resistor shunts connecting the front and backside of the PCB. The wiring is integrated in the PCB circuitry, thus minimising the profile of the board. Channels can be milled into the board according to the desired flow-field structure. The low profile allows the integration into single cells and stacks [39].

Table 1.
Timeline of the development of segmented cell technology.
3. Single Cell Applications for Fuel Cell Development
Single cells at the laboratory scale is the usual way to investigate individual phenomena, e.g., in degradation or in operation conditions, and to study material and design developments. Some of these topics are, for obvious reasons, depending on the size of the active areas and thus not directly scalable. In such cases, experiments with stack hardware of large areas, but with only one single cell, are often a good compromise. The integration of a segmented measurement board will always require a design specifically fit for the stack hardware, but usually requires less effort than also tuning the sealing of the stack. For other topics, small test cells are more suitable, for example, when providing a new material for a large area cell would require additional effort. A typical laboratory scale single cell segmented bipolar plate and the measurement principle are shown in Figure 1.
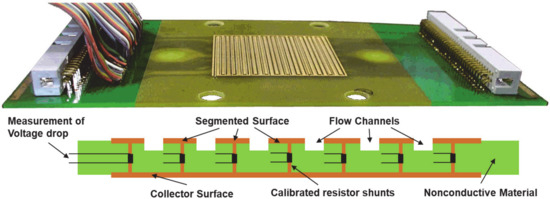
Figure 1.
Laboratory-scale segmented board (25 cm2) for operando measurement of locally resolvent current density in fuel cells. The machined gas flow channel is visible (top image). The measurement principle is depicted in the lower panel: The voltage drop along the calibrated low-ohmic resistors along the current direction is monitored. The design allows milling in any desired flow-field structure. Lower panel reproduced from R. Lin et al., Investigation of Locally Resolved Current Density Distribution of Segmented PEM Fuel Cells to Detect Malfunctions, ECS Trans., 26 (1), 229-236 (2010), published 05.12.2010. © The Electrochemical Society. Reproduced by permission of IOP publishing. All rights reserved.
3.1. Water Management
A very straightforward application of a device that visualises the local activity of a fuel cell is to monitor local condensation of water [44,45,46,47,48], which can reduce the local activity to merely zero by blocking gas supply through the porous media or covering the catalytic sites with liquid and thus inhibiting the transport of reactant gases to these sites. As the mechanism is also closely correlated to the gas flow channel layout in the fuel cell, the local deactivation can be expected to follow their geometry [49]. Moreover, gravitational effects on water management are also accessible by using segmented cell technology [50]. In addition to the topology of the flow fields and their orientation, principal investigations on the width of the lands between channels were carried out [51], and non-uniform channel widths were found beneficial [52]. Computational fluid design approaches are used to optimise in particular the pressure drop along the flow channel before taking a flow-channel plate to the workbench [53]. Finite difference method (FDM) models were used to simulate flow-field behaviour on the channel scale, utilising neutron imaging data and locally resolved current densities [54]. There are also biomimetic approaches that follow the principles of the fractal distributions structures of lungs [55] and leaves [56]. Other groups performed detailed studies on the effect of the freezing of product water during a cold start on local performance and the evaluation of current density distribution [57,58,59].
In Figure 2, a series of false colour plots representing the monitored local current density is displayed. Each measurement signal corresponds to one segment (compare Figure 1) of the measurement board, and as such of the fuel cell area (23-channel serpentine flow field with a total area of 140 cm2). The data are interpolated between the segments, resulting in intuitively comprehensible landscape style graphs. This experiment, ran at 88 °C with an overall current density of 0.45 A/cm2, showed the evolution of the local current densities during operation under high humidity—as it is generally beneficial for the ionic conductivity of fuel cell membranes—and the upcoming local deactivation.
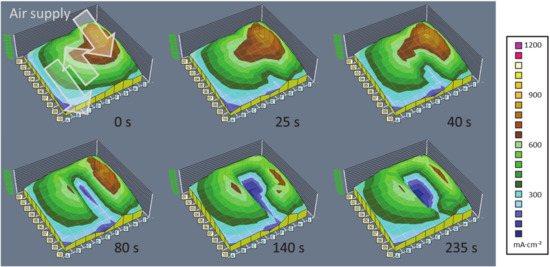
Figure 2.
Series of current density mappings in a PEM fuel cell showing the local deactivation due to condensation of liquid water. (MEA: CCM by IonPower, 0.6 mgPt/cm2, GDL: SGL Sigracet 25BC, 88 °C, 1.5 bar, 100% rH, stoichiometry: H2: 1.5, air 2.0, constant voltage 680 mV).
The first glance shows that the overall current density is not homogeneously distributed over the cell. The gas inlet region (in columns G, H and I) exhibits a higher current density than the other regions—there is a continuous gradient towards the outlet region opposite of the inlet. This can be easily explained with the gradually reduced concentration along the flow channels, as reactants are consumed by the fuel cell. Beginning at the time stamp of + 25 s, however, a valley in the current density landscape appears in column F and then expands to the region F-G/2-6, after the first turn of the air flow. The condensation of water in this region is a result of the already present water in the pre-humidified inlet gas and the occurrence of product water out of the fuel cell reaction. In this region, the added water concentration in the gas phase reaches the condensation limit and deactivates the electrodes by flooding the porous layers, leading to air starvation. It is noted that the other regions are still active, and the load is lightly shifted towards the outlet region. Naturally, the partial deactivation of a fuel cell is undesirable, and by recognising the pattern of the evolving deactivation, as of the state of the third image of the series, a counter measure like purging the fuel cell with dry gases allows operating at a generally enhanced humidification without risking constant local deactivation and the resulting degradation problems. The use of operando monitoring of the locally resolved current densities enables the user to adapt an operation strategy in order to mitigate such undesired effects.
A more obvious phenomenon, observable without the use of a segmented measurement board, occurred during operation of a fuel cell with low humidification of the cathode gas and full humidification to oversaturation of the anode gases. These specific experiments focussed on the study of the special conditions of asymmetrical humidity, which leads to extreme behaviour. The impact of a high anode relative humidity (rH) to compensate for a dry cathode is studied. Under these conditions, the fuel cell performance started to oscillate, with the amplitude depending on the ratio of the asymmetric humidification and on the gas flow configuration (“co-flow” or “counter-flow”) [60]. In the very drastic example shown in Figure 3, the overall current density oscillates between 0.6 A/cm2 and below 0.1 A/cm2 (cell voltage: 500 mV, H2: 180 mL/min, rH 152%, air: 560 mL/min, rH 0%, p: 1.5 bar, co-flow configuration). The mechanisms underlying this phenomenon were interpreted using a laboratory-scale segmented measurement board.
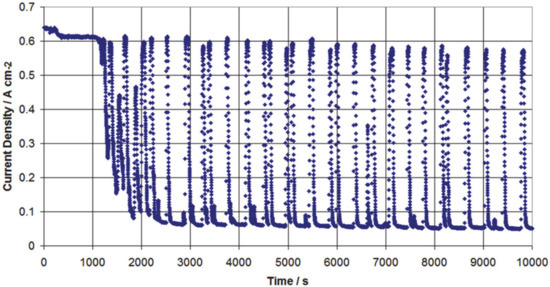
Figure 3.
Oscillating behaviour of a fuel cell under dry cathode operation. Reproduced from D. G. Sanchez et al., ECS Trans., 35 (32), 41-54 (2011), published 11.10.2011. [60] © The Electrochemical Society. Reproduced by permission of IOP publishing. All rights reserved.
The fuel cell deactivates regionally during the oscillations, and the difference between the higher oscillation amplitudes in co-flow configuration and the lower amplitudes in counter-flow configuration go together with a difference in direction of deactivation/reactivation. In Figure 4, the current density patterns during the transients are shown for both configurations. As shown in the upper panel A (co-flow), the fuel cell deactivates to almost overall zero current density (image A3), starting from the inlet (as indicated in image A1). The following incline (images A3–A5) is also following this direction. The transients are driven by the flow direction. In the counter-flow configuration (lower panel B, flow directions indicated in image B1) the decline follows the direction of the cathode gas inlet (images B1–B3) and the incline follows the anode gas inlet direction (images B3–B5). The activation is governed by the humidified anode side air flow, while the deactivation is governed by the hydrogen flow on the cathode. The locally resolved dynamics of the fuel cell activity could show that the high anode rH is able to punctually reactivate dry, deactivated areas. Accompanying electrochemical impedance measurements (EIS) indicated a fluctuation in the ionic resistance of the fuel cell, so the phenomenon is interpreted as oscillation in the humidification of the membrane and the corresponding conductivity [60]. The dynamics of the process were studied with numerical methods in a separate work [46].
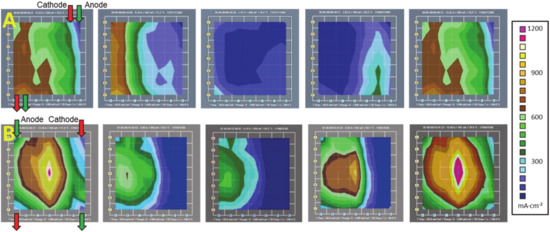
Figure 4.
Evolution of current density during the transient from the high to the low current state (compare Figure 3) in the co-flow (panel (A)) and counter-flow (panel (B)) configuration. The regional deactivation of the oscillating fuel cell is revealed by the locally resolved current density.
This phenomenon emphasizes the need to understand and control the water management of a fuel cell for a well-performing and stable operation. Although other methods for the investigation of water management in fuel cells are employed and provide complementary information [44,45,46,48,49,50,60], operando measurement with the segmented cell technology provide a relatively quick operando access to several aspects of this topic.
3.2. Material Development
The very direct access to water management phenomena also makes segmented cell technology a valuable tool for addressing material development topics by assessing and monitoring fuel cell local performance behaviour at various operating conditions. The gas diffusion layer (GDL), which is the binding piece between the catalyst layer and the bipolar plate, is crucial to maintain proper water management of the cell. While it is electrically connecting these two components and levelling out some distance variations, it also has the role of both transporting gases to the electrodes—which is best done when completely dry. Moreover, the GDL is also responsible for transporting excess water away from the electrodes to the flow channels of the bipolar plate. These opposite properties are typically unified in a hydrophobically treated carbon felt or carbon paper backing and the attached microporous layer (MPL), typically composed of a mixture of carbon and polytetrafluoroethylene (PTFE) powder. The combination creates a system with a pore size step towards the electrode and is usually adjusted by the hydrophobicity agent (PTFE) to a relatively high degree of hydrophobicity. This system can expel condensed water droplets with the force of the capillary pressure and its poor wettability towards the bipolar/end plate and the attached flow channels, where the water is eventually carried out of the fuel cell [61].
The behaviour of the GDL when under high gas humidification, which is generally beneficial for the membrane conductivity, and under high load, where the water production rate is also high, can limit the performance of the fuel cell, when the water transport capabilities are at the limit. As one of the most interesting applications of the low temperature PEM fuel cell is the fuel cell powered electrical vehicle, the typical load would not be constant, and the GDL has to be quite flexible in terms of handling the different gas flows, water content and heat levels. The GDL has become a focus of modifications of various of its properties [62,63], such as porosity and pore size [64], thickness, microstructures, electrical and thermal conductivity [65], and—obviously—the hydrophobicity [66,67]. In an approach to modify GDLs towards an inhomogeneous hydrophobicity and altered local responses of the fuel cell, laser treatment in the form of lines of 3 mm spacing was applied [68]. Similar approaches have been made with laser perforation [69,70] and ion beam modification [71]. The common idea is to create confined regions of reduced hydrophobicity that attract water, create preferred pathways and enhance the removal of water across the cell area. It was observed that the individual combination of electrodes and GDL plays an important role, and that some material combinations, while positively affected by the treatment, did not respond in any way regarding the output performance; other combinations responded with an increase in power density up to 20% at high loads.
In Figure 5, the current density patterns of a laboratory-scale fuel cell of 25 cm2 (overall current density 1.6 A/cm2, humidification: 50%rH, co-flow configuration) are displayed. The left pattern shows the current density distribution using pristine GDLs, and the right pattern using a laser-modified GDL on the cathode side. Even though the power is not affected by the laser patterning, the current density distribution is more uniform. The extreme values of current density are different by a factor of about 1.5 with patterning, compared to about 2 without [68].
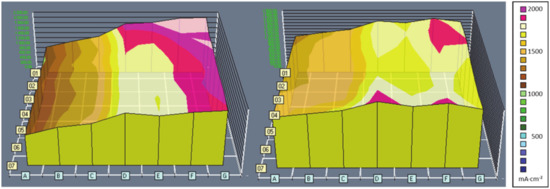
Figure 5.
Current density distributions at an average of 1.6 A/cm2 within a lab single cell, as recorded with segmented cell technology: The distribution with a laser-patterned GDL is more homogeneous (right) than without (left) (JM MEA02476, SGL Carbon 24BC, 80 °C, 50% rH, 1.5 bar, stoichiometry H2: 1.5, air: 2, single serpentine flow field, co-flow configuration, gas inlet at upper right corner G1).
The data for a set of experiments with two humidity settings (50% rH, 90% rH) and three operating points each (0.4 A/cm2, 1.0 A/cm2, and 1.6 A/cm2) were statistically analysed and are summarised in Figure 6 in the form of box-whisker plots for the distribution of the local current density values. The box plots represent the inner 50% of the measured values and the whiskers each represent the upper or lower 25% of the values. The data show that for any of the settings the patterning of the GDL leads to a more confined data range with less extremes in both the 100% data range and the 50% percentiles. At a high humidification and high load, again, the difference effect is smaller, indicating that the system is coming close to a limit. A more uniform distribution helps to avoid local hot spots, and thus directly adds to enhancing the long-term durability of fuel cells.
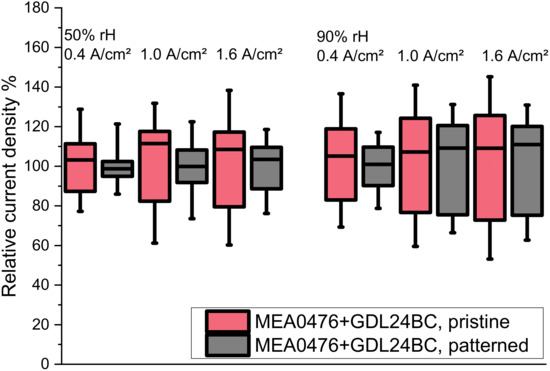
Figure 6.
The box-whisker plots of the locally resolved current densities shows that the laser patterning of the GDL leads to more homogeneous cell activity in a wide range of conditions. Both the 50% and the 100% percentiles in the plots are more narrow (for the experimental conditions, see Figure 5).
Another application in material development is in the investigation of the homogeneity of a material itself. The segmented cell technology was used to characterise ultra-low loaded electrodes prepared by electrospraying [72], where a jet of catalyst dispersion is sprayed onto a membrane substrate under the influence of an electric field, leading to a dendritic structure of high porosity, and thus an enhanced permeability and increased electrochemically active surface [73].
3.3. Defects and Degradation
A third, wide topic of applications for segmented cells is in the monitoring of degradation of fuel cells [48,74]. As the design of fuel cell stacks with directed supply of reactant gases by flow channels leads to intrinsically non-uniform properties—there are clear differences in reactant concentration and humidity between gas inlet and outlet regions—it is obvious that several degradation mechanisms are also not to be expected as uniformly distributed over the entire cell area. The poisoning of the catalysts—the irreversible deactivation of catalytic sites, e.g., with sulfuric compounds—is naturally related to the flow of contaminated gases. The local differences in humidity in a fuel cell, which are also a consequence of the general design principle, can lead to local differences of two other degradation mechanisms, the agglomeration of catalyst material [75] and the decomposition of the ionomer [12] and hydrophobicity agent [47,48]. The agglomeration of platinum is taking place via dissolution and redeposition at other particles and is thus enhanced by an overabundance of water, which increases the mobility of the Pt ions. This growth of particles at the expense of other particles reduces—as the surface to volume ratio decreases—the overall available catalytically active surface, and the performance of the fuel cell deteriorates [75]. The decomposition of the ionomer material is due to the radical attack of intermediate products of the fuel cell reaction on the fluorohydrocarbon backbone of the ionomer. The mechanism leads to the loss of the sulphonated functional groups and thus the decrease in ionic conductivity. Ionomer membranes can also be considerably thinned out [76] and form weak structural spots that are more easily prone to mechanical failure. It is generally suppressed at high humidity. Under high humidity conditions, the same mechanism can also lead to decomposition of the hydrophobic agent in gas diffusion media, even the more distant layer, the GDL backing [48]. A requirement is the transport of the intermediate radicals to the GDL, which is enhanced by the presence of water. Of course, every mechanism leading to local hot spots will drive local degradation.
Detailed studies allow for the separation between the catalyst layer or gas diffusion layer and between reversible and irreversible degradation phenomena [77,78,79]. As a rule of thumb, several issues are reversible after a shutdown-restart event, or after a period of dynamic operation. High levels of irreversible degradation, as shown in Figure 7, are very likely not homogeneously distributed [80,81]. The irreversible parts of degradation rates after ~500 h of dynamic operation (coloured dots, low degradation rate) and of constant operation (grey dots, high degradation rate) are depicted, and corresponding current density patterns before (BoT) and at the end (EoT) of the 500 h are correlated at the example of a 0.1 A/cm2 constant load test (upper pair of current density distribution images) and a dynamic operation test (lower pair). Both EoT patterns show a reduced homogeneity of their current density. A distinct difference is still visible: After dynamic operation the slope of the gradient along the fuel cell area from maximum to minimum activity is quite flat, only coarsely one third of the area is significantly lower in activity, and the minimum activity, in the corners, is about 50% of the maximum activity. The EoT pattern after constant operation at 0.1 A/cm2, in contrast, has a very sharp gradient, cutting of almost 50% of the cell area, where the activity is dramatically reduced. During load cycling, local degradation conditions, which show up periodically, can be continuously recovered, while under long periods of constant operation the same local/regional degradation are impregnated into the fuel cell.
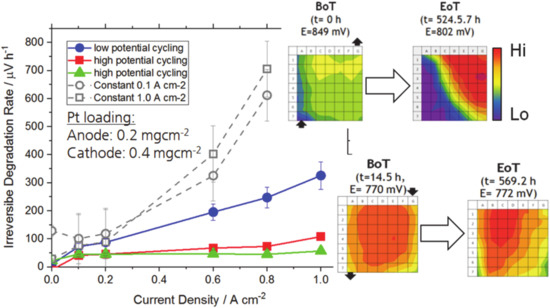
Figure 7.
Irreversible degradation of a fuel cell after ~500 h tests at different operational conditions (cycling or constant load) and correlating current density patterns recorded at BoT and EoT (upper: constant 0.1 A/cm2; lower: high potential cycling). Reproduced from P. Gazdzicki et al., ECS Trans., 92 (8), 261-276 (2019), published 03.07.2019. [80] © The Electrochemical Society. Reproduced by permission of IOP publishing. All rights reserved.
A very special case of a local degradation leading to hydrogen crossover is the pinhole or crack in the membrane, which can be due to a mechanical impact on the membrane or the membrane thinning mechanism described before or by a carbon fibre from the GDL penetrating the membrane. A pinhole is a very local defect in the structure of the membrane, where hydrogen can cross over from the anode to the cathode, and oxygen vice versa. This leads to the direct reaction of the two reactants under heat generation at the catalytic sites, parallel to the electrochemical reaction. Ex situ, the heat dissipation due to the pin-hole formation can be easily observed by an IR camera [82]. The effect of mixed potentials, however, can by monitored in situ by a segmented cell [20,83]. The resulting mixed potential are underlying the different reaction rates, and the diffusion rates of the more mobile hydrogen are significantly higher, and as a result, the reaction is inversed at the site of the pinhole. The local current density that is recorded by a segmented measurement board is negative at this position. Figure 8 shows the current density mapping of a fuel cell with a leakage at an overall current density of 100 mA·cm−2. The deviating coloured spot, indicating the inverse current density, clearly marks the presence and the location.
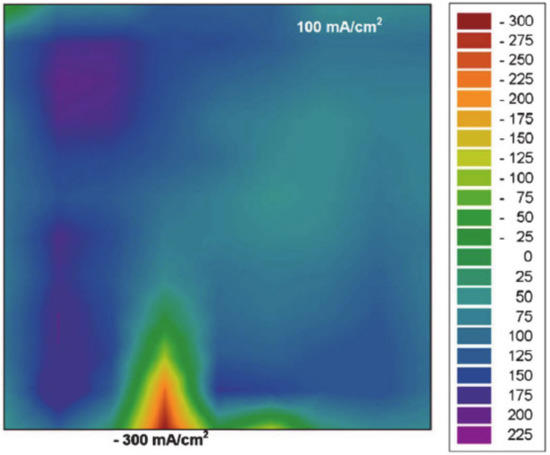
Figure 8.
The effect of leakage in a fuel cell, a locally inverted current density, is directly visible in the false colour plot, monitored with segmented cell technology. Reproduced from R. Lin et al., J. Electrochem. Soc., 158 (1), B11 (2011), published 09.11.2010. [83] © The Electrochemical Society. Reproduced by permission of IOP publishing. All rights reserved.
For obvious reasons, the additional local heat production can further deteriorate the membrane structure an eventually lead to a severe failure or even a catastrophic uncontrolled reaction. Operando monitoring of the fuel cell performance can help to detect such harmful events, even if extremely rare, and enhance the safety. Moreover, a segmented cell can be used not only to detect critical failures as pinholes, but also to investigate local hydrogen crossover through the membrane in general [83,84].
4. Locally Resolved Current Density in Fuel Cell Stacks
Continuous monitoring is the general task for a segmented cell in applications outside the laboratory. Nonetheless, the technology is not limited to monitoring purposes of single cells. As fuel cell stacks are more than the sum of a large number of single cells, even if the cell area and shape are identical, for end positions that have a different thermal ambience, coupling effects between the individual cells can induce additional gradients along the stack, and material inhomogeneity can have an impact on the reactant distribution between the individual cells. The observation that there are not only gradients within the plane of each cell, but also along the repeating units in the stack, indicates that for a fundamental understanding of fuel cell stacks, the application of the segmented cell technology has to be in several cell positions inside a stack. The technical challenges are the aforementioned sealing, the spatial requirements for each measurement board in the more confined space of the stack and, of course, the almost linearly rising effort in data acquisition, handling and evaluation. The advantageous use of this monitoring technology for cathodic fault monitoring was demonstrated in a stationary fuel cell stack of ten cells, equipped with three segmented cells, which were placed at both ends and in the centre of the stack, as indicated in Figure 9. The stack was accompanied by an electrochemical impedance spectroscopy (EIS) setup, with the purpose to correlate the findings from both techniques [85]. While EIS data are typically strongly depending on the underlying model used for interpretation and thus not always clearly readable, the correlation supports the interpretation of both methods. An image of this 480 W stack with an active area of 96 cm2 is given in Figure 9. The three cells do obviously not show the same or even similar current density patterns at the applied critical operation condition (0.5 A/cm2, 1.5 bar, λH2: 1.5, 30% rH, λair: 1.5, 100% rH). The reduced air stoichiometry in the experiment results in clearly visible starvation phenomena in particular the cells with a high index, close to the air inlet. The highest gradient in current density distribution is observed in cell #10, where the current density drops from ~550 mA/cm2 (red) at the air inlet to ~350 mA/cm2 at the air outlet (purple) due to depletion of oxygen along the flow field.
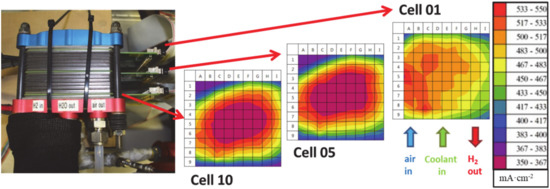
Figure 9.
Stationary fuel cell stack (ten cells) with three integrated measurement boards for locally resolved current density measurements at the ends and in the centre. The highest difference between 350 mA/cm2 (purple) and 550 mA/cm2 (red) is observed in cell #10, while the other observed parts of the stack are more homogeneous.
The locally reduced activity in parts of the stack under this air starvation conditions could be observed with the segmented cell technology, where simultaneous electrochemical impedance measurements (EIS) showed an increased diffusion resistance [80]. Other parameters investigated by the combination of the two methods are the impact of the electric load level and of the humidification level. It could be shown that both methods combined improved the identification and isolation of the occurring cathodic faults, such as cathode flooding, air starvation and cell dry out.
5. Locally Resolved Humidity Measurement
Beside the current density, another very interesting property to be understood on a local basis is the humidity in fuel cells [48]. As discussed earlier, humidity plays a major role in the overall performance with strong variance at the local scale. An array of capacitor-based humidity sensors was integrated and combined with a segmented cell for current density measurements into a laboratory-scale single cell of 74.4 cm2. An oblong rectangular shape with a parallelized flow field leads to long individual channels. The intention was first to test to validate the experimental setup; therefore, a design was chosen to force long pathways, where gradients may be better resolved than with typical shapes. Thus, this specific design, which is described in detail separately [43], was made for the targeted investigation of the humidity-related effects in fuel cells, instead of the goal of a good performance. It was operated in a test bench, at 80 °C, and with varying humidification of the feed gases. As an example, for the correlation of the monitored local properties, Figure 10 shows the local current density (A), local humidity (B) and local temperature (C) in the cell at an overall humidification level of 0% at the inlet. The gas flow direction is depicted in panel D. The obvious correlation of the local profiles between these three properties shows the validity of the sensor signals and their local resolution. The locally lower temperature in the regions D–F was introduced by heterogeneous external heating of the test cell in order to enhance the effects to the changed local RH. This leads to the internal local temperature drop. The humidity mapping shows that the humidity, which is generated as product water of the fuel cell reaction, is sticking to the “cold spot” areas in the D/E vertical line.
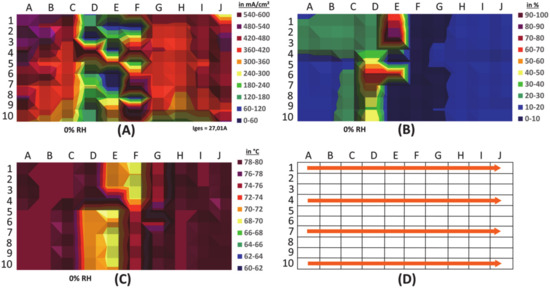
Figure 10.
Locally resolved current density (A), humidity (B) and temperature (C), recorded simultaneously in a laboratory single fuel cell: Inhomogeneity of the external heating leads to an internal local temperature drop and resulting local performance deficits and humidity accumulation. Panel (D) describes the direction of the reactant flow in this setup.
The correlation of the local mappings is obviously given. Note that the signals are not totally congruent because the humidity sensors are placed in a separate board with a total distance to the flow field of 8.5 mm. For a technical application, a further miniaturization would be required. The main application of this test cell is in the development and validation of numerical models for fuel cells.
6. Application of Cell Segmentation beyond Fuel Cells
6.1. Electrolysis in Laboratory Cells
The applicability of segmented cell technology has been also demonstrated for water electrolysis, which is the electrochemical converter complementary to the fuel cells. The principle of the measurement technology in electrolysis is the same as in fuel cells, however various challenges need to be considered:
- High current densities. The measurement devices have to be able to endure this load and shunt resistors adapted to the higher currents.
- High water and gas pressure. The gaskets have to maintain tightness also with the measurement board.
- Cell voltages above 2.0 V. The electrochemical stress to the materials of the measurement board is very pronounced.
- Corrosive environment. Depending on electrolyser technology, namely alkaline or acidic, the segmented cell is in contact with water with a high or low pH, respectively, with high concentrations of dissolved O2 and H2.
Few attempts have been made to employ locally resolved measurements of the current density in electrolysers. A one-dimensional stripe cell for PEM electrolysis was demonstrated by Dedigama et al., showing that within one flow channel, the local current density can increase along the channel at high loads. The reason was found in the flow dynamics of gas bubbles rising in liquid, where the transition from small discrete bubble to slug flow facilitates the removal of smaller bubbles attached to the electrode [40]. Another approach in PEM water electrolysis has been made with a device by S++ Simulation Services, who commercialises the segmented cell technology under license by the German Aerospace Centre (DLR). The influence of clamping pressure on the homogeneity of the current distribution was investigated [41]. The applications of segmented cell technology in laboratory-scale cells are manifold. In addition to the direct visualisation of inhomogeneous clamping pressure, the evaluation of performance mechanisms is possible with deep insight. As in fuel cells, the segmented cell can be used to study the phenomenon of water starvation in a PEM electrolyser. Water starvation is a condition that rarely occurs in commercial electrolysers due to pump failure. The main reason of failure in PEM electrolysis is water contamination [86]. However, the experiment can be used to simulate a condition where there are different water supply rates over the area of the MEA due to high gas production. This is a situation that could be critical in particular for very large area stacks like those used in Hydrogenics [87] or Siemens [88] electrolysers. In this case, the produced gas could limit the water supply over the MEA uniformly because of mass transport limitations at high current densities, inadequate flow fields or a small pore size of the GDL.
In order to simulate the situation in which water supply is limited over the cell area, the electrical pump was shut off while the load was still applied. Constant current densities of 0.8 A/cm2 (Figure 11, red curve and frames) and of 2.0 A/cm2 (yellow curve and frames) were applied to a 25 cm2 laboratory test cell, and the water supply was interrupted. The voltage was followed parallel to the locally resolved current density. In normal operation, the current distribution was quite homogeneous at both current levels (Images 1a and 1b of Figure 11) While the cell voltage showed a mere increase in the beginning of the starvation after ~5 min or 15 min, respectively, the operando recording of the locally resolved current densities reveals the pending malfunction (Image 2a and 2b) and the following sharp voltage rise at a very early stage (3a and 3b). The patterns with sharp gradients of current density (corresponding colour scales in the insert below) allow the recognition of the starvation at a point where counter measures or a controlled shutdown may be employed. High gradients of the current density arise, e.g., due to accumulation of large amounts of gas. The entire set of experiments with the laboratory cell and the variety of applications is described elsewhere [42].
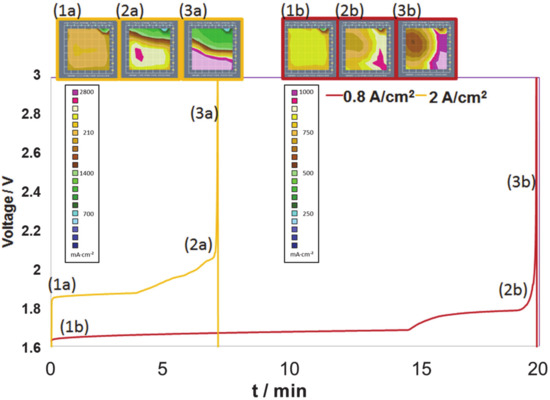
Figure 11.
Voltage curves with total currents of 0.8 A/cm2 (a, yellow curves) and 2.0 A/cm2 (b, red curves) and the corresponding current density distributions, as measured in a laboratory electrolyser single cell with a segmented cell at characteristic times (a–c) during artificial water starvation: The voltage rise is accompanied by inhomogeneous current distributions. (cell size: 25 cm2, 80 °C, 1 bar).
6.2. Electrolysis in Industrial Systems
The developments in segmented cell technology have gone beyond laboratory test cells. For a real monitoring application, which is required to prevent or to predict possible faults, the locally resolved measurement of current densities has to be established in industrial electrolysers. This involves usually large active cell areas and other technical restraints, such as the positions of clamping bolts, while additional space requirements of a measurement board due to circuitry and cabling have to fit into the system. Water electrolysis is currently used for hydrogen generation in industrial niche applications but is undergoing a development to meet the requirements of a technology for sector coupling in an integrated energy system dominated by renewable energies [8]. With the new requirements and the surge of new developments in materials, components and designs, reliable and quantitative accelerated stress tests are very important [89]. The monitoring of locally resolved operational data from the interior of the electrolysers is particular important to validate new designs and components and to understand the acceleration of different ageing mechanisms.
A PEM water electrolyser short stack (IRD Fuel Cells AS/GreenHydrogen.dk ApS) was used as industrial specimen for the design and integration of a current density distribution board (see Figure 12). The device was adapted to the internal water distribution structure, which has been described and numerically evaluated by Olesen et al [90]. It is embedded into a modified graphite-composite bipolar plate and replaces a regular bipolar plate in this setup.
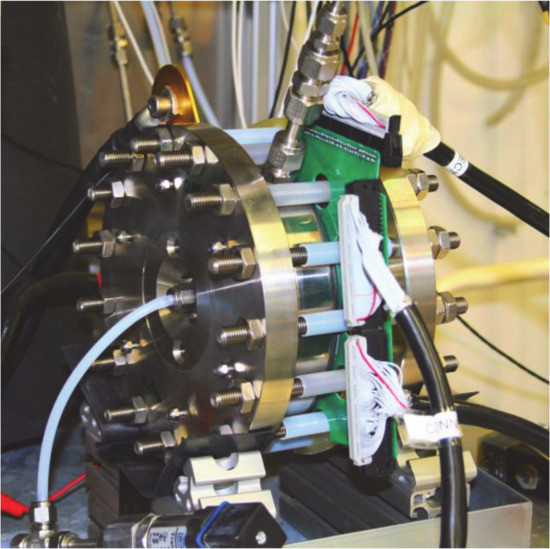
Figure 12.
Segmented BPP for local current density measurements, integrated in PEM water electrolysis stack hardware.
The proof of functionality was carried out under water starvation conditions similar to the experiments in the laboratory test cells described above. The segmented bipolar plate in the presented experiment was placed between cell #1 and #2 in a 3-cell stack. The stack was operated with regular water supply before the start-up procedure. Subsequently, the water pump was shut off, generating some very sharp local activity gradients in the stack. Figure 13 shows a series of current density distribution mappings at the selected characteristic points in time. The shape of the images coarsely resembles the circular shape of the active area. While in the first image (5 s) the stack is completely inactive before the start-up procedure, during the following minute, up to image #4, the overall and local currents rise as the stack takes up operation. Merely 10 s later (t = 72 s an t = 77 s), already the growth of a hot spot in the centre of the lower half of the electrolyser is observable. The water is starting to run short in the other regions of the stack area. At 87 s, the current density pattern drastically shows that the upper part of the stack has turned inactive and the entire current is forced into the highlighted region in the lower centre, which was already established before. The last image shows the situation after 117 s, recorded already during the safety shutdown, where the hot spot is significantly confined.
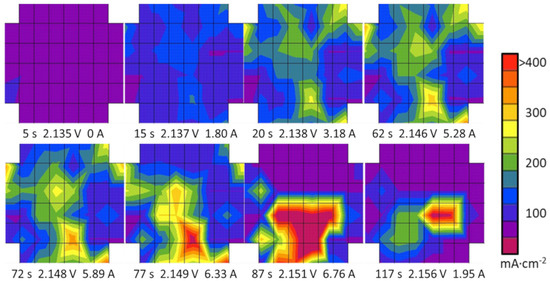
Figure 13.
Series of current density mappings in a PEM water electrolyser during water starvation that occurred briefly after start-up: The resulting hot spots in the lower areas are immediately indicating faulty operation (45 °C, 2 bar).
The displayed scenario of water blockage could—similar to the laboratory cell experiment described in Figure 11—not easily be recognised by the voltage rise only, which varies by 20 mV in total in the scenario in Figure 13, until the concentration of the entire current on one hot spot was already established. At this late stage, the electrochemical components have already been suffering a local overload and, as the result, a local overheating—a typical mechanism for accelerated aging [91]. The current density pattern is homogeneous during the start-up phase until 20 s. The regionally lower signals, e.g., close to the right edge of the displayed images, cannot be clearly attributed to either the intrinsic properties of the stack or to the influence of the experimental setup. After a period of steady operation, the pattern changes, beginning with the image at 72 s, and a hot spot evolves. In the later images, the hot spot (red) in the centre region and below is completely evolved (87 s) and about to vanish later, as the system switched into a safety shutdown (117 s), while the upper region is inactive (purple). The gradients between active and inactive cell regions are very sharp, and the false colour plot shows the interpolated data between the red (highly active) and purple (inactive) forms of the full colour range. The sharpness of this gradient clearly demonstrates the capability of the measurement technology to resolve the current density locally. Merely no signal cross talk is visible between the directly neighbouring segments in the centre of the pattern (e.g., 87 s), as almost the full displayed data range is covered from one to the next step, the segment borders being indicated by the grid.
For the use in an industrial anion exchange membrane (AEM) electrolyser (Enapter S.r.l.), a comparably novel technology [92], a similar segmented board was designed and constructed, see Figure 14. With its different chemical environment of a mild alkaline electrolyte, in contrast to the pure water in the PEM technology, it requires some material adaptation to the measurement board. The utilisation of this device is mainly in the targeted development of the industrial AEM electrolysis technology.
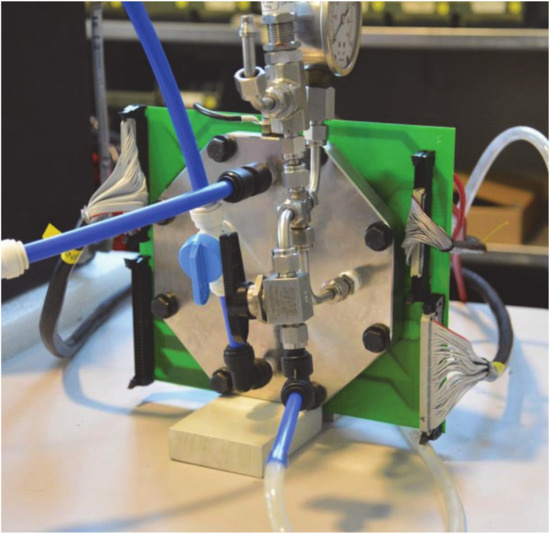
Figure 14.
Segmented BPP for local current density measurement, integrated in industry AEM water electrolysis hardware.
While PEM and AEM electrolysis are emerging, classic alkaline electrolysis is still the dominant technology in the market. The approach to locally resolved measurement of current density measurements in heavy alkaline electrolysis had to go along with a general redesign of the segmented cell concept. The chemical ambience—20% KOH lye with a pH of 14—requires measures to avoid any possible contact between the circuitry and lye. In particular, any copper components quickly corrode when exposed to KOH lye. In addition, the typical alkaline electrolyser cell diameter is often more than 1 m in diameter, which makes the design of a single printed circuit board extremely challenging.
A novel concept with individual measurement modules was developed within the frame of the European project INSIDE. The modules are embedded in chemically stable polymer frame of polyether ether ketone (PEEK) and connected by very simple printed circuitry. This circuitry, manufactured in conventional PCB technology, is covered with a large nickel plate, and each module is individually sealed. The side opposite to the circuitry is carried out in plain nickel segments, as visible in Figure 15. The polymer frame is acting as the passive regions of a bipolar plate and is touching the regular gaskets between individual electrolyser cells. With this design, the interior of the connected electrolyser cell is in contact with the polymer frame and the plain nickel areas only, and the interior measurement modules of the segmented bipolar cell are protected against the KOH lye.
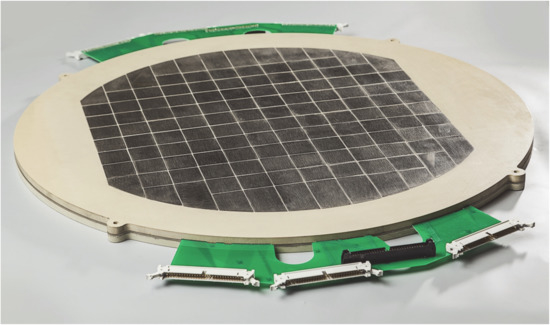
Figure 15.
Segmented bipolar plate prototype for application in alkaline electrolysis of water, based on the scalable modular design concept (diameter: 620 m).
The novel modular design principle of the large area segmented cell for alkaline electrolysers received a special recognition in the f-cell awards 2018 [93] It allows an easy upscaling by simply adapting the polymer frame and the simple connection circuitry to the electrolyser geometry. The measurement modules then are embedded into the frame and bonded to the circuitry. The use of identical measurement modules, which could be produced in large numbers, can eventually lead to a beneficial scale effect for production costs. Both large numbers of segments and variable sizes of segments can be equipped with mass produced modules. Large electrolyser areas are accessible, and the modular design principle has its potential for use in other electrolyser technologies as well.
7. Conclusions
An overview was given of the developments that were made in locally resolved operando measurements of electrochemical converters—PEM fuel cells, PEM/AEM water and alkaline electrolysers. Since the first steps of a laboratory setup with bulky endplates in single cells, the patented concept of shunt resistors in segmented bipolar plates has evolved to a functional and widely applicable tool.
Applications of this development cover the evaluation of design concepts and of material development. Degradation can be investigated also on a local level, and better mitigation strategies can be developed. It could be shown that a poor control of the humidity level in a PEM fuel cell operation can lead to localised deactivation of the cell, even oscillating local deactivation, and an instable water supply to a PEM electrolyser similarly leads to an inhomogeneous current density distribution—accelerating local degradation and thus reducing the lifetime of the entire component. Accordingly, the positive effect of targeted modification of a fuel cell GDL on the homogeneity of the current density is demonstrated. Other applications for a more resourceful operation lie in the operando monitoring. Real time data of intuitively comprehensible patterns, many of which are characteristic for specific conditions, can be obtained from running systems. The localised nature of the degradation phenomena of the fuel cells is made visible, as well as the very local defects.
The most recent developments are simultaneous operando monitoring of current densities at several positions in a fuel cell stack, the transfer of the segmented cell technology to industrial PEMWE, AEMWE and AWE electrolysis, as well as the development of a PEMFC setup for parallel operando monitoring of local current density, humidity and temperature. Electrochemical impedance (EIS) data were correlated with localised and time-resolved data in a fuel cell stack, for both current density and temperature, and the gap between experimenting with and simulation of fuel cellsߣ operation could be bridged on an unprecedented local scale. The extended variety of applications demonstrates further potential application.
8. Patents
The technology described is patented under patents DE10316117 B3 (2004) and EP1618395 A1, (2006) [37,38]. It is used under license by other companies.
Author Contributions
Conceptualization, K.A.F.; investigation, I.B., J.M., D.G.S., M.S., P.G., and B.K.; writing—Original draft preparation, I.B., and J.M.; writing—Review and editing, P.G., J.M., A.S.G., D.G.S., M.S., and K.A.F.; visualization, I.B., J.M., P.G., M.S. and B.K.; project administration, J.M.; I.B.; M.S. and P.G.; funding acquisition, J.M.; I.B.; M.S. and P.G. All authors have read and agreed to the published version of the manuscript.
Funding
The research leading to these results has received funding from the European Union’s Seventh Framework Programme (FP7/2007-2013) for Fuel Cell and Hydrogen Joint Technology Initiative under Grant s No. 303446 (IMPALA), No. 621237 (INSIDE), and No. 779565 (ID-FAST). Parts of these works were realized in the framework of the Polish-German Sustainability Research Call (STAIR II), funded by the National Center for Research and Development (NCBR, Poland) and the Federal Ministry of Education and Research (BMBF, Germany) under grants No.: STAIR/6/2016 and 01LX1601 (COALA). Financial support by BMBF (HYPOS) is acknowledged under grant No. 03ZZ0742A (Elykon).
Acknowledgments
We are grateful to Heinz Sander for the preceding works and the conceptualisation of the present technology, to Olivier Garrot for the programming of software on an updated platform and to Siegfried Graf and Stefan Anderle for many test bench modifications. Fruitful discussions and accompanying works by Renate Hiesgen †, Tobias Morawietz, Stefan Helmly, Beatriz Rebelo Pedroso, and Christina Schmitt are acknowledged.
Conflicts of Interest
The authors declare no conflict of interest.
References
- Masson-Delmotte, V.; Zhai, P.; Pörtner, H.O.; Roberts, D.; Skea, J.; Shukla, P.R.; Pirani, A.; Moufouma-Okia, W.; Péan, C.; Pidcock, R. (Eds.) IPCC 2018: Global Warming of 1.5 °C; An IPCC Special Report on the Impacts of Global Warming of 1.5°C above Pre-Industrial Levels and Related Global Greenhouse Gas Emission Pathways, in the Context of Strengthening the Global Response to the Threat of Climate Change, Sustainable Development, and Efforts to Eradicate Poverty; IPCC: Geneva, Switzerland, 2018; in press. [Google Scholar]
- Staffell, I.; Scamman, D.; Velazquez Abad, A.; Balcombe, P.; Dodds, P.E.; Ekins, P.; Shah, N.; Ward, K.R. The role of hydrogen and fuel cells in the global energy system. Energy Environ. Sci. 2019, 12, 463–491. [Google Scholar] [CrossRef]
- Mathias, M.F.; Makharia, R.; Gasteiger, H.A.; Conley, J.J.; Fuller, T.J.; Gittleman, C.J.; Kocha, S.S.; Miller, D.P.; Mittelsteadt, C.K.; Xie, T.; et al. Two Fuel Cell Cars in Every Garage? Electrochem. Soc. Interface 2005, 14, 24. [Google Scholar]
- Gröger, O.; Gasteiger, H.A.; Suchsland, J.-P. Review-Electromobility: Batteries or Fuel Cells? J. Electrochem. Soc. 2015, 162, 2605–2622. [Google Scholar] [CrossRef]
- Kreuter, W.; Hofmann, H. Electrolysis The important energy transformer in a worldof sustainable energy. Int. J. Hydrogen Energy 1998, 23, 661–666. [Google Scholar] [CrossRef]
- Turner, J.A. Sustainable Hydrogen Production. Science 2004, 305, 972–974. [Google Scholar] [CrossRef] [PubMed]
- Mallouk, T.E. Divide and conquer. Nat. Chem. 2013, 5, 362–363. [Google Scholar] [CrossRef]
- Buttler, A.; Spliethoff, H. Current status of water electrolysis for energy storage, grid balancing and sector coupling via power-to-gas and power-to-liquids: A review. Renew. Sustain. Energy Rev. 2018, 82, 2440–2454. [Google Scholar] [CrossRef]
- Ehret, O.; Bonhoff, K. Hydrogen as a fuel and energy storage: Success factors for the German Energiewende. Int. J. Hydrogen Energy 2015, 40, 5526–5533. [Google Scholar] [CrossRef]
- Brey, J.; Brey, R.; Carazo, A.F. Eliciting preferences on the design of hydrogen refueling infrastructure. Int. J. Hydrogen Energy 2017, 42, 13382–13388. [Google Scholar] [CrossRef]
- Borup, R.; Meyers, J.; Pivovar, B.; Kin, Y.S.; Mukundan, R.; Garland, N.; Myers, D.; Wilson, M.; Garzon, F.; Wood, D.; et al. Scientific aspects of polymer electrolyte fuel cell durability and degradation. Chem. Rev. 2007, 107, 3904–3951. [Google Scholar] [CrossRef]
- De Bruijn, F.A.; Dam, V.A.T.; Janssen, G.J.M. PEM fuel cell materials: Costs, Performance, and Durability. Fuel Cells 2008, 8, 3–22. [Google Scholar] [CrossRef]
- Siracusano, S.; Van Dijk, N.; Backhouse, R.; Merlo, L.; Baglio, V.; Aricò, A. Degradation issues of PEM electrolysis MEAs. Renew. Energy 2018, 123, 52–57. [Google Scholar] [CrossRef]
- Chavan, S.L.; Talange, D.B. Modeling and performance evaluation of PEM fuel cell by controlling its input parameters. Energy 2017, 138, 437–445. [Google Scholar] [CrossRef]
- Rieke, P.C.; Vanderborgh, N.E. Thin Film Electrode Arrays for Mapping the Current-Voltage Distributions in Proton-Exchange-Membrane Fuel Cells. J. Electrochem. Soc. 1987, 134, 1099. [Google Scholar] [CrossRef]
- Storck, A.; Coeuret, F. Mass and momentum transfer at a wall in the presence of turbulence promoters. Electrochim. Acta 1977, 22, 1155–1160. [Google Scholar] [CrossRef]
- Brown, C.J.; Pletcher, D.; Walsh, F.C.; Hammond, J.K.; Robinson, D. Local mass transport effects in the FM01 laboratory electrolyser. J. Appl. Electrochem. 1992, 22, 613–619. [Google Scholar] [CrossRef]
- Cleghorn, S.J.C.; DeRouin, C.R.; Wilson, M.S.; Gottesfeld, S. A printed circuit board approach to measuring current distribution in a fuel cell. J. Appl. Electrochem. 1998, 28, 663–672. [Google Scholar] [CrossRef]
- Stumper, J.; Campbell, S.A.; Wilkinson, D.P.; Johnson, M.C.; Davis, M. In-situ methods for the determination of current distributions in PEM fuel cells. Electrochim. Acta 1998, 43, 3773–3783. [Google Scholar] [CrossRef]
- Brett, D.; Atkins, S.; Brandon, N.P.; Vesovic, V.; Vasileiadis, N.; Kucernak, A.R. Measurement of the current distribution along a single flow channel of a solid polymer fuel cell. Electrochem. Commun. 2001, 3, 628–632. [Google Scholar] [CrossRef]
- Wieser, C.; Helmbold, A.; Gülzow, E. A new technique for two-dimensional current distribution measurements in electrochemical cells. J. Appl. Electrochem. 2000, 30, 803–807. [Google Scholar] [CrossRef]
- Reshetenko, T.V.; Bender, G.; Bethune, K.; Rocheleau, R. Systematic studyof back pressure and anode stoichiometry effects on spatial PEMFC performace distribution. Electrochim. Acta 2011, 56, 8700–8710. [Google Scholar] [CrossRef]
- Reshetenko, T.; Bender, G.; Bethune, K.; Rocheleau, R. Systematic studies of the gas humidification effects on spatial PEMFC performance distributions. Electrochim. Acta 2012, 69, 220–229. [Google Scholar] [CrossRef]
- Reshetenko, T.V.; St-Pierre, J. Study of acetylene poisoning of Pt cathode on proton exchange membrane fuel cell spatial performance using a segmented cell system. J. Power Sources 2015, 287, 401–415. [Google Scholar] [CrossRef]
- Reshetenko, T.; Bender, G.; Bethune, K.; Rocheleau, R. Effects of local variations of the gas diffusion layer properties on PEMFC performance using a segmented cell system. Electrochim. Acta 2012, 80, 368–376. [Google Scholar] [CrossRef]
- Reshetenko, T.V.; St-Pierre, J.; Rocheleau, R. Effects of local gas diffusion layer gas permeability variations on spatial proton exchange membrance fuel cells performance. J. Power Sources 2013, 241, 597–607. [Google Scholar] [CrossRef]
- Reshetenko, T.; Bender, G.; Bethune, K.; Rocheleau, R. Application of a segmented cell setup to detect pinhole and catalyst loading defects in proton exchange membrane fuel cells. Electrochim. Acta 2012, 76, 16–25. [Google Scholar] [CrossRef]
- Noponen, M.; Mennola, T.; Mikkola, M.; Hottinen, T.; Lund, P.D. Measurement of current distribution in a free-breathing PEMFC. J. Power Sources 2002, 106, 304–312. [Google Scholar] [CrossRef]
- Büchi, F.N.; Geiger, A.B.; Neto, R.P.D.C. Dependence of current distribution on water management in PEFC of technical size. J. Power Sources 2005, 145, 62–67. [Google Scholar] [CrossRef]
- Yoon, Y.-G.; Lee, W.-Y.; Yang, T.-H.; Park, G.-G.; Kim, C.-S. Current distribution in a single cell of PEMFC. J. Power Sources 2003, 118, 193–199. [Google Scholar] [CrossRef]
- Liu, Z.; Mao, Z.; Wu, B.; Wang, L.; Schmidt, V.M. Current density distribution in PEFC. J. Power Sources 2005, 141, 205–210. [Google Scholar] [CrossRef]
- Liu, Z.; Yang, L.; Mao, Z.; Zhuge, W.; Zhang, Y.; Wang, L. Behavior of PEMFC in starvation. J. Power Sources 2006, 157, 166–176. [Google Scholar] [CrossRef]
- Hwnag, J.; Chang, W.; Peng, R.; Chen, P.; Su, A. Experimental and numerical studies of local current mapping on a PEM fuel cell. Int. J. Hydrogen Energy 2008, 33, 5718–5727. [Google Scholar] [CrossRef]
- Liang, N.; Shen, Q.; Hou, M.; Shao, Z.-G.; Yi, B. Study of the cell reversal process of large area proton exchange membrane fuel cells under fuel starvation. J. Power Sources 2009, 194, 847–853. [Google Scholar] [CrossRef]
- Dou, M.; Hou, M.; Liang, N.; Shen, Q.; Zhang, H.; Lu, W.; Shao, Z.-G.; Yi, B. Behaviors of proton exchange membrane fuel cells under oxidant starvation. J. Power Sources 2011, 196, 2759–2762. [Google Scholar] [CrossRef]
- Weng, F.-B.; Jou, B.-S.; Li, C.-W.; Su, A.; Chan, S.-H. The effect of low humidity on the uniformity and stability of segmented PEM fuel cells. J. Power Sources 2008, 181, 251–258. [Google Scholar] [CrossRef]
- Kaz, T.; Sander, H. Device for Measuring Local Current/Heat Distribution on Electrochemical Electrode Has Current Flow Direction to Resistance Element Transverse to Current Flow Direction to Current Conducting Element. Patent DE10316117 B3, 14 October 2004. [Google Scholar]
- Kaz, T.; Sander, H. Measurement of the Current Distribution/Heat Distribution of an Electrochemical Electrode. Patent EP1618395 A1, 25 January 2006. [Google Scholar]
- Schulze, M.; Gülzow, E.; Schönbauer, S.; Knöri, T.; Reissner, R. Segmented cells as a tool for development of fuel cells and error prevention/prediagnostic in fuel cell stacks. J. Power Sources 2007, 173, 19–27. [Google Scholar] [CrossRef]
- Dedigama, I.; Angeli, P.; Van Dijk, N.; Millichamp, J.; Tsaoulidis, D.; Shearing, P.R.; Brett, D.J.L. Current density mapping and optical flow visualisation of a polymer electrolyte membrane water electrolyser. J. Power Sources 2014, 265, 97–103. [Google Scholar] [CrossRef]
- Verdin, B.; Fouda-Onana, F.; Germe, S.; Serre, G.; Jacques, P.; Millet, P. Operando current mapping on PEM water electrolysis cells. Influence of mechanical stress. Int. J. Hydrogen Energy 2017, 42, 25848–25859. [Google Scholar] [CrossRef]
- Gago, A.S.; Sanchez, D.G.; Morawietz, T.; Schulze, M.; Biswas, I.; Friedrich, K.A. In-situ Diagnostics and Current distribution in Proton Exchange Membrane Electrolyzers with Segmented Bipolar Plate. in preparation.
- Sanchez, D.G.; Kimmel, B.; Gazdzicki, P.; Friedrich, K.A. A Method for the investigation of the locally resolved humidity in PEM fuel cells and the correlation to local current density and temperature. in preparation.
- Sanchez, D.G.; Ruiu, T.; Biswas, I.; Friedrich, K.A.; Sanchez Monreal, J.; Vera, M. Effect of the inlet gas humidification on PEMFC Behavior and Current Density Distribution. ECS Trans. 2014, 64, 603–617. [Google Scholar] [CrossRef]
- Sanchez, D.G.; Ruiu, T.; Friedrich, K.A.; Sanchez Monreal, J.; Vera, M. Analysis of the Influence of Temperature and Gas Humidity on the Performance Stability of Polymer Electrolyte Membrane Fuel Cells. J. Electrochem. Soc. 2016, 163, F150–F159. [Google Scholar] [CrossRef]
- Salaberri, P.A.G.; Sánchez, D.; Boillat, P.; Vera, M.; Friedrich, K.A. Hydration and dehydration cycles in polymer electrolyte fuel cells operated with wet anode and dry cathode feed: A neutron imaging and modeling study. J. Power Sources 2017, 359, 634–655. [Google Scholar] [CrossRef]
- Schulze, M.; Wagner, N.; Kaz, T.; Friedrich, K.A. Combined electrochemical and surface analysis investigation of degradation processes in polymer electrolyte membrane fuel cells. Electrochim. Acta 2007, 52, 2328–2336. [Google Scholar] [CrossRef]
- Sanchez, D.G.; Ruiu, T.; Biswas, I.; Schulze, M.; Helmly, S.; Friedrich, K.A. Local impact of humidification on degradation in polymer electrolyte fuel cells. J. Power Sources 2017, 352, 42–55. [Google Scholar] [CrossRef]
- Knöri, T.; Schulze, M. Spatially resolved current density measurements and real-time modelling as a tool for the determination of local operating conditions in polymer electrolyte fuel cells. J. Power Sources 2009, 193, 308–314. [Google Scholar] [CrossRef]
- Friedrich, K.; Sanchez, D.G.; Ortiz, A. Oscillation of PEFC Under Low Cathode Humidification: Effect of Gravitation and Bipolar Plate Design. ECS Meet. Abstr. 2013, 160, 636–644. [Google Scholar]
- Zhang, X.; Higier, A.; Zhang, X.; Liu, H. Experimental Studies of Effect of Land Width in PEM Fuel Cells with Serpentine Flow Field and Carbon Cloth. Energies 2019, 12, 471. [Google Scholar] [CrossRef]
- Ramin, F.; Sadeghifar, H.; Torkavannejad, A. Flow field plates with trap-shape channels to enhance power density of polymer electrolyte membrane fuel cells. Int. J. Heat Mass Transf. 2019, 129, 1151–1160. [Google Scholar] [CrossRef]
- Wilberforce, T.; El-Hassan, Z.; Khatib, F.; Al Makky, A.; Mooney, J.; Barouaji, A.; Carton, J.G.; Olabi, A. Development of Bi-polar plate design of PEM fuel cell using CFD techniques. Int. J. Hydrogen Energy 2017, 42, 25663–25685. [Google Scholar] [CrossRef]
- Culubret, S.; Rubio, M.; Sanchez, D.; Urquia, A. Dynamic modeling of the effect of water management on polymer electrolyte fuel cells performance. Int. J. Hydrogen Energy 2020, 45, 5710–5722. [Google Scholar] [CrossRef]
- Trogadas, P.; Cho, J.; Neville, T.P.; Marquis, J.; Wu, B.; Brett, D.; Coppens, M.-O. A lung-inspired approach to scalable and robust fuel cell design. Energy Environ. Sci. 2018, 11, 136–143. [Google Scholar] [CrossRef]
- Kang, H.C.; Jum, K.M.; Sohn, Y.J. Performance of unit PEM fuel cells with a leaf-vein-simulating flow field-patterned bipolar plate. Int. J. Hydrogen Energy 2019, 44, 24036–24042. [Google Scholar] [CrossRef]
- Lin, R.; Weng, Y.; Li, Y.; Lin, X.; Xu, S.; Ma, J. Internal behavior of segmented fuel cell during cold start. Int. J. Hydrogen Energy 2014, 39, 16025–16035. [Google Scholar] [CrossRef]
- Lin, R.; Weng, Y.; Lin, X.; Xiong, F. Rapid cold start of proton exchange membrane fuel cells by the printed circuit board technology. Int. J. Hydrogen Energy 2014, 39, 18369–18378. [Google Scholar] [CrossRef]
- Lin, R.; Lin, X.; Weng, Y.; Ren, Y. Evolution of thermal drifting during and after cold start of proton exchange membrane fuel cell by segmented cell technology. Int. J. Hydrogen Energy 2015, 40, 7370–7381. [Google Scholar] [CrossRef]
- Sanchez, D.G.; Hiesgen, R.; Wehl, I.; Friedrich, K.A. Correlation of Oscillation of Polymer Electrolyte Membrane Fuel Cells at Low Cathode Humidification with Nanoscale Membrane Properties. ECS Trans. 2011, 35, 41–54. [Google Scholar]
- Jayakumar, A.; Sethu, S.P.; Ramos, M.; Robertson, J.; Al-Jumaily, A. A technical review on gas diffusion, mechanism and medium of PEM fuel cell. Ionics 2014, 21, 1–18. [Google Scholar] [CrossRef]
- Omrani, R.; Shabani, B. Gas diffusion layer modifications and treatments for improving the performance of proton exchange membrane fuel cells and electrolysers: A review. Int. J. Hydrogen Energy 2017, 42, 28515–28536. [Google Scholar] [CrossRef]
- Fadzillah, D.; Rosli, M.; Talib, M.; Kamarudin, S.; Daud, W. Review on microstructure modelling of a gas diffusion layer for proton exchange membrane fuel cells. Renew. Sustain. Energy Rev. 2017, 77, 1001–1009. [Google Scholar] [CrossRef]
- Li, T.; Wang, K.; Wang, J.; Liu, Y.; Han, Y.; Song, J.; Hu, H.; Lin, G.; Liu, Y. Preparation of hierarchical-pore gas diffusion layer for fuel cell. J. Mater. Sci. 2020, 55, 4558–4569. [Google Scholar] [CrossRef]
- Chen, T.; Liu, S.; Zhang, J.; Tang, M. Study on the characteristics of GDL with different PTFE content and its effect on the performance of PEMFC. Int. J. Heat Mass Transf. 2019, 128, 1168–1174. [Google Scholar] [CrossRef]
- Kakaee, A.; Molaeimanesh, G.; Garmaroudi, M.E. Impact of PTFE distribution across the GDL on the water droplet removal from a PEM fuel cell electrode containing binder. Int. J. Hydrogen Energy 2018, 43, 15481–15491. [Google Scholar] [CrossRef]
- Lin, R.; Diao, X.; Ma, T.; Tang, S.; Chen, L.; Liu, D. Optimized microporous layer for improving polymer exchange membrane fuel cell performance using orthogonal test design. Appl. Energy 2019, 254, 113714. [Google Scholar] [CrossRef]
- Tomas, M.; Biswas, I.S.; Gazdzicki, P.; Kullova, L.; Schulze, M. Modification of gas diffusion layers properties to improve water management. Mater. Renew. Sustain. Energy 2017, 6, 20. [Google Scholar] [CrossRef]
- Gerteisen, D.; Heilmann, T.; Ziegler, C. Enhancing liquid water transport by laser perforation of a GDL in a PEM fuel cell. J. Power Sources 2008, 177, 348–354. [Google Scholar] [CrossRef]
- Manahan, M.; Clement, J.T.; Srouji, A.K.; Brown, S.W.; Reutzel, T.; Mench, M.M. Laser Modified Fuel Cell Diffusion Media: Engineering Enhanced Performance via Localized Water Redistribution. J. Electrochem. Soc. 2014, 161, F1061–F1069. [Google Scholar] [CrossRef]
- Forner-Cuenca, A.; Biesdorf, J.; Gubler, L.; Kristiansen, P.M.; Schmidt, T.J.; Boillat, P. Engineered Water Highways in Fuel Cells: Radiation Grafting of Gas Diffusion Layers. Adv. Mater. 2015, 27, 6317–6322. [Google Scholar] [CrossRef]
- Martinez-Vazquez, B.; Sanchez, D.; Castillo, J.; Friedrich, K.A.; Garcia-Ybarra, P.; Garcia-Ybarra, P. Scaling-up and characterization of ultralow-loading MEAs made-up by electrospray. Int. J. Hydrogen Energy 2015, 40, 5384–5389. [Google Scholar] [CrossRef]
- Martin, S.; Martinez-Vazquez, B.; Garcia-Ybarra, P.L.; Castillo, J.L. Peak utilization of catalyst with ultra-low loaded PEM fuel cell electrodes prepared by the electrospray method. J. Power Sources 2013, 173, 19–27. [Google Scholar] [CrossRef]
- Chandesris, M.; Guétaz, L.; Schott, P.; Scohy, M.; Escribano, S. Investigation of Degradation Heterogeneities in PEMFC Stack Aged under Reformate Coupling In Situ Diagnosis, Post-Mortem Ex Situ Analyses and Multi-Physic Simulations. J. Electrochem. Soc. 2018, 165, F3290–F3306. [Google Scholar] [CrossRef]
- Zhang, S.; Yuan, X.-Z.; Hin, J.N.C.; Wang, H.; Friedrich, K.A.; Schulze, M. A review of platinum-based catalyst layer degradation in proton exchange membrane fuel cells. J. Power Sources 2009, 194, 588–600. [Google Scholar] [CrossRef]
- Helmly, S.; Ohnmacht, B.; Hiesgen, R.; Gülzow, E.; Friedrich, K.A. Influence of Platinum Precipitation on Properties and Degradation of Nafion Membranes. ECS Trans. 2013, 58, 969–990. [Google Scholar] [CrossRef]
- Zhang, X.; Yang, Y.; Zhang, X.; Liu, H. Identification of performance degradations in catalyst layer and gas diffusion layer in proton exchange membrane fuel cells. J. Power Sources 2020, 449, 227580. [Google Scholar] [CrossRef]
- Gazdzick, P.; Mitzel, J.; Sanchez, D.G.; Schulze, M.; Friedrich, K.A.; Gazdzicki, P. Evaluation of reversible and irreversible degradation rates of polymer electrolyte membrane fuel cells tested in automotive conditions. J. Power Sources 2016, 327, 86–95. [Google Scholar] [CrossRef]
- Gazdzicki, P.; Mitzel, J.; Dreizler, A.M.; Schulze, M.; Friedrich, K.A. Impact of Platinum Loading on Performance and Degradation of Polymer Electrolyte Fuel Cell Electrodes Studied in a Rainbow Stack. Fuel Cells 2017, 18, 270–278. [Google Scholar] [CrossRef]
- Gazdzicki, P.; Mitzel, J.; Sanchez, D.G.; Aßmann, P.; Sousa, P.; Morawietz, T.; Hiesgen, R.; Häußler, F.; Hunger, J.; Schlumberger, G.; et al. Operando and ex-situ investigation of PEMFC degradation. ECS Trans. 2019, 92, 261–276. [Google Scholar] [CrossRef]
- Garcia-Sanchez, D.; Morawietz, T.; Da Rocha, P.G.; Hiesgen, R.; Gazdzicki, P.; Friedrich, K. Local impact of load cycling on degradation in polymer electrolyte fuel cells. Appl. Energy 2020, 259, 114210. [Google Scholar] [CrossRef]
- Knorr, F.; Sanchez, D.G.; Schirmer, J.; Gazdzicki, P.; Friedrich, K.A. Methanol as antifreeze agent for cold start of automotive polymer electrolyte membrane fuel cells. Appl. Energy 2019, 238, 1–10. [Google Scholar] [CrossRef]
- Lin, R.; Gülzow, E.; Schulze, M.; Friedrich, K.A. Investigation of Membrane Pinhole Effects in Polymer Electrolyte Fuel Cells by Locally Resolved Current Density. J. Electrochem. Soc. 2011, 158, B11–B17. [Google Scholar] [CrossRef]
- Shan, J.; Gazdzicki, P.; Lin, R.; Schulze, M.; Friedrich, K.A. Local resolved investigation of hydrogen crossover in polymer electrolyte fuel cell. Energy 2017, 128, 357–365. [Google Scholar] [CrossRef]
- Mitzel, J.; Sanchez-Monreal, J.; Sanchez, D.G.; Gazdzicki, P.; Schulze, M.; Häußler, F.; Hunger, J.; Schlumberger, G.; Janicka, E.; Mielniczek, M.; et al. Fault monitoring in PEMFC Stacks by Evaluation of Local Performance and Cell Impedance Analysis. Fuel Cells 2019. submitted. [Google Scholar]
- Anderson, E.; Ayers, K.; Capuano, C. R&D Focus Areas Based on 60,000 hr Life PEM Water Electrolysis Stack Experience First International Workshop on Durability and Degradation Issues in PEM Electrolysis Cells and its Components, Freiburg, Germany 12 March 2013. Available online: https://www.sintef.no/globalassets/project/novel/pdf/1-1_proton_everett_public.pdf (accessed on 15 December 2019).
- Renewable Hydrogen: The Missing Link between the Power, Gas, Industry and Transport Sectors. Available online: https://hydrogeneurope.eu/sites/default/files/2018-06/2018-06_Hydrogenics_Company%20presentation.compressed.pdf (accessed on 15 December 2019).
- SILIYER 300-Die Nächste Dimension der PEM-Elektrolyse. Available online: https://assets.new.siemens.com/siemens/assets/api/uuid:abae9c1e48d6d239c06d88e565a25040ed2078dc/version:1524040818/ct-ree-18-047-db-silyzer-300-db-de-en-rz.pdf (accessed on 15 December 2019).
- Aßmann, P.; Gago, A.S.; Gazdzicki, P.; Friedrich, K.A.; Wark, M. Towards Developing Accelerated Stress Tests for Proton Exchange Membrane Electrolyzers. Curr. Opin. Electrochem. 2020, in press. [Google Scholar]
- Olesen, A.C.; Rømer, C.; Kær, S.K. A numerical study of the gas-liquid, two-phase maldistribution in the anode of a high presser PEM water electrolysis cell. Int. J. Hydrogen Energy 2016, 41, 52–68. [Google Scholar] [CrossRef]
- Chandesris, M.; Médeau, V.; Guillet, N.; Chelghoum, S.; Thoby, D.; Fouda-Onana, F. Membrane degradation in PEM water electrolyzer: Numerical modeling and experimental evidence of the influence of temperature and current density. Int. J. Hydrogen Energy 2015, 40, 1353–1366. [Google Scholar] [CrossRef]
- Pavel, C.; Cecconi, F.; Emiliani, C.; Santiccioli, S.; Scaffidi, A.; Catanorchi, S.; Comotti, M. Highly Efficient Platinum Group Metal Free Based Membrane-Electrode Assembly for Anion Exchange Membrane Water Electrolysis. Angew. Chem. 2014, 126, 1402–1405. [Google Scholar] [CrossRef]
- F-Cell Award. Available online: https://f-cell.de/award/ (accessed on 15 December 2019).
© 2020 by the authors. Licensee MDPI, Basel, Switzerland. This article is an open access article distributed under the terms and conditions of the Creative Commons Attribution (CC BY) license (http://creativecommons.org/licenses/by/4.0/).