Article

Alienation Coefficient and Wigner Distribution Function Based Protection Scheme for Hybrid Power System Network with Renewable Energy Penetration

1
Department of Electrical Engineering, Manipal University Jaipur, Rajasthan 303007, India
2
Department of Electrical Engineering, Arya College of Engineering and Information Technology, Jaipur 302028, India
3
Department of Electrical Engineering, Hawassa University, Awasa P.O. Box 05, Ethiopia
4
Power System Planning Division, Rajasthan Rajya Vidhyut Prasaran Nigam Ltd., Jaipur 302005, India
5
Department of Electrical Power Engineering, Faculty of Mechanical and Electrical Engineering, Tishreen University, 2230 Lattakia, Syria
6
Department of Management & Innovation Systems, University of Salerno, 84084 Fisciano (SA), Italy
*
Authors to whom correspondence should be addressed.
Energies 2020, 13(5), 1120; https://doi.org/10.3390/en13051120
Submission received: 4 February 2020 / Revised: 22 February 2020 / Accepted: 25 February 2020 / Published: 2 March 2020
(This article belongs to the Special Issue Grid-Connected PV Plants)

Abstract

:
The rapid growth of grid integrated renewable energy (RE) sources resulted in development of the hybrid grids. Variable nature of RE generation resulted in problems related to the power quality (PQ), power system reliability, and adversely affects the protection relay operation. High penetration of RE to the utility grid is achieved using multi-tapped lines for integrating the wind and solar energy and also to supply loads. This created considerable challenges for power system protection. To overcome these challenges, an algorithm is introduced in this paper for providing protection to the hybrid grid with high RE penetration level. All types of fault were identified using a fault index (FI), which is based on both the voltage and current features. This FI is computed using element to element multiplication of current-based Wigner distribution index (WD-index) and voltage-based alienation index (ALN-index). Application of the algorithm is generalized by testing the algorithm for the recognition of faults during different scenarios such as fault at different locations on hybrid grid, different fault incident angles, fault impedances, sampling frequency, hybrid line consisting of overhead (OH) line and underground (UG) cable sections, and presence of noise. The algorithm is successfully tested for discriminating the switching events from the faulty events. Faults were classified using the number of faulty phases recognized using FI. A ground fault index (GFI) computed using the zero sequence current-based WD-index is also introduced for differentiating double phase and double phase to ground faults. The algorithm is validated using IEEE-13 nodes test network modelled as hybrid grid by integrating wind and solar energy plants. Performance of algorithm is effectively established by comparing with the discrete wavelet transform (DWT) and Stockwell transform based protection schemes.

1. Introduction

Adverse environmental impacts of fossil fuel based power plants have forced the utilities to integrate clean energy with the grid in order to meet future energy demands. Fast development of renewable technologies and government incentives to reduce carbon footprints have motivated the utilities to switch from the conventional power plants to the renewable energy (RE) generation sources [1]. This is achieved by forming the hybrid grid with multi-tapped transmission and sub-transmission lines to supply the loads and integrate RE sources such as wind and solar power plants. Formation of hybrid grids using multi-tapped lines provide economic solutions for RE integration to the grid; however it creates protection challenges due to variable nature of RE generation and bidirectional flow of power in the lines. This resulted in the requirement of new protection schemes, which can be deployed in the recent structure of hybrid grids for effective protection. These techniques must be independent of direction of power flow, unbalanced nature of loads, fault current and variable generation [2]. This can be effectively achieved by the use of machine learning and signal processing techniques. Fang et al. [3], proposed an improved distance relay scheme using time delay and zero-sequence impedance for the grid to which RE sources are integrated. This scheme has high reliability compared to the conventional relays and reduced risk of malfunction. A detailed study of challenges associated with the protection of grid integrated distributed generation (DG) and adaptive protection schemes for these systems are presented in [4]. A detailed study related to the application of signal processing techniques and intelligent methods such as artificial neural network (ANN), fuzzy set theory (FST), and expert system (ES) in the field of protection of DG sources integrated power system is presented in [5]. A sensor based fault detection isolation scheme for the grid, interfaced with RE sources and electric vehicles (EV) is introduced by authors in [6]. This can effectively be deployed in eleven order multi-area smart dynamic power system interfacing RE and EV. In [7], authors introduced an algorithm based on the fast recursive discrete Fourier transform (FRDFT) for the protection of distribution system, integrated with DG. This is a novel, fast and adaptive relay technique for relay systems, which is effective for obtaining the optimal protection settings when system conditions are continuously changing. Application of the syntactic methods for identification of power system signals by measuring the parameters is reported in [8,9]. This method has the capability to provide syntactic and semantic information simultaneously. Nieto et al. [10], introduced a detailed study for improvement of quality of power in grid with integration of energy storage systems. This study helps to differentiate the power quality disturbances from the disturbances associated with the faulty events. In [11], a current-based transmission line protection scheme using Wigner distribution function and alienation coefficient is introduced. However, this scheme fails to provided protection to hybrid grids in the presence of both wind and solar energy penetration. Discrete wavelet transform was implemented for the identification of wind and solar energy penetration into the utility grid [12,13]. This method has the disadvantage of generating false tripping signals in the presence of high noise level. Stockwell transform was implemented for the identification of wind and solar energy penetration into the utility grid [14,15]. This method overcomes the demerits of discrete wavelet transform (DWT) scheme; however, it has the disadvantage of slow speed of protection scheme due to large data involved in the extraction of features from voltage and current signals. Therefore, new protection scheme is designed to provide effective protection against various faults to the hybrid grid with high RE penetration level. This protection scheme has merits, such as fast response (recognition of fault in a time duration which is less than quarter cycle) and performance is not affected by presence of high level of noise. Following are main contributions of the paper:
  • An algorithm supported by the features of both voltage and current is introduced in this paper, which is effective to provide protection for the hybrid grid with RE penetration.
  • A W-index is computed by processing the current signals using Wigner distribution function (WDF). Also an ALN-index is computed using sample-based alienation coefficients of voltage signals. Furthermore, fault index (FI) is computed from these W-index and ALN-index, which is effective for recognition of all the fault types incident on hybrid grid.
  • The performance of the algorithm is not affected by the presence of high level of noise.
  • The proposed algorithm is effective to provide high speed protection of hybrid grid. Faults were detected within a time less than ( 1 / 10 ) th cycle.
  • The algorithm is effective in discriminating switching transients from the faulty transients.
  • The fault type was recognized using the number of faulty phases and identified using FI. A GFI, based on the processing of zero sequence currents using WDF is effective in differentiating the double phase (2P) and double phase to ground (2PG) faults.
  • This algorithm works effectively and efficiently for the identification of faults on the hybrid grid during various operating scenarios such as fault location, various sampling frequencies, variations in the fault impedance, fault incidence angle and hybrid combination of the OH line and UG cable.
Nine sections are used to arrange the contents in the article. A brief introduction to carry out research on the selected topic and main contributions is included in Section 1. Section 2 describes the hybrid grid test network incorporated with RE generators. The proposed algorithm implemented for the protection of hybrid grid is described in Section 3. Section 4 demonstrates the simulation results related to fault identification in the hybrid grid. This section also includes the simulation results to highlight the requirements of protection scheme for the hybrid grid. Fault classification results are included in Section 5. Section 6 discusses the results of various case studies. Results for the discrimination of switching events from the faulty events are discussed in Section 7. A brief comment on the results and performance comparison of the proposed protection scheme with other existed schemes in the presence of RE is detailed in Section 8, followed by the conclusions (Section 9).

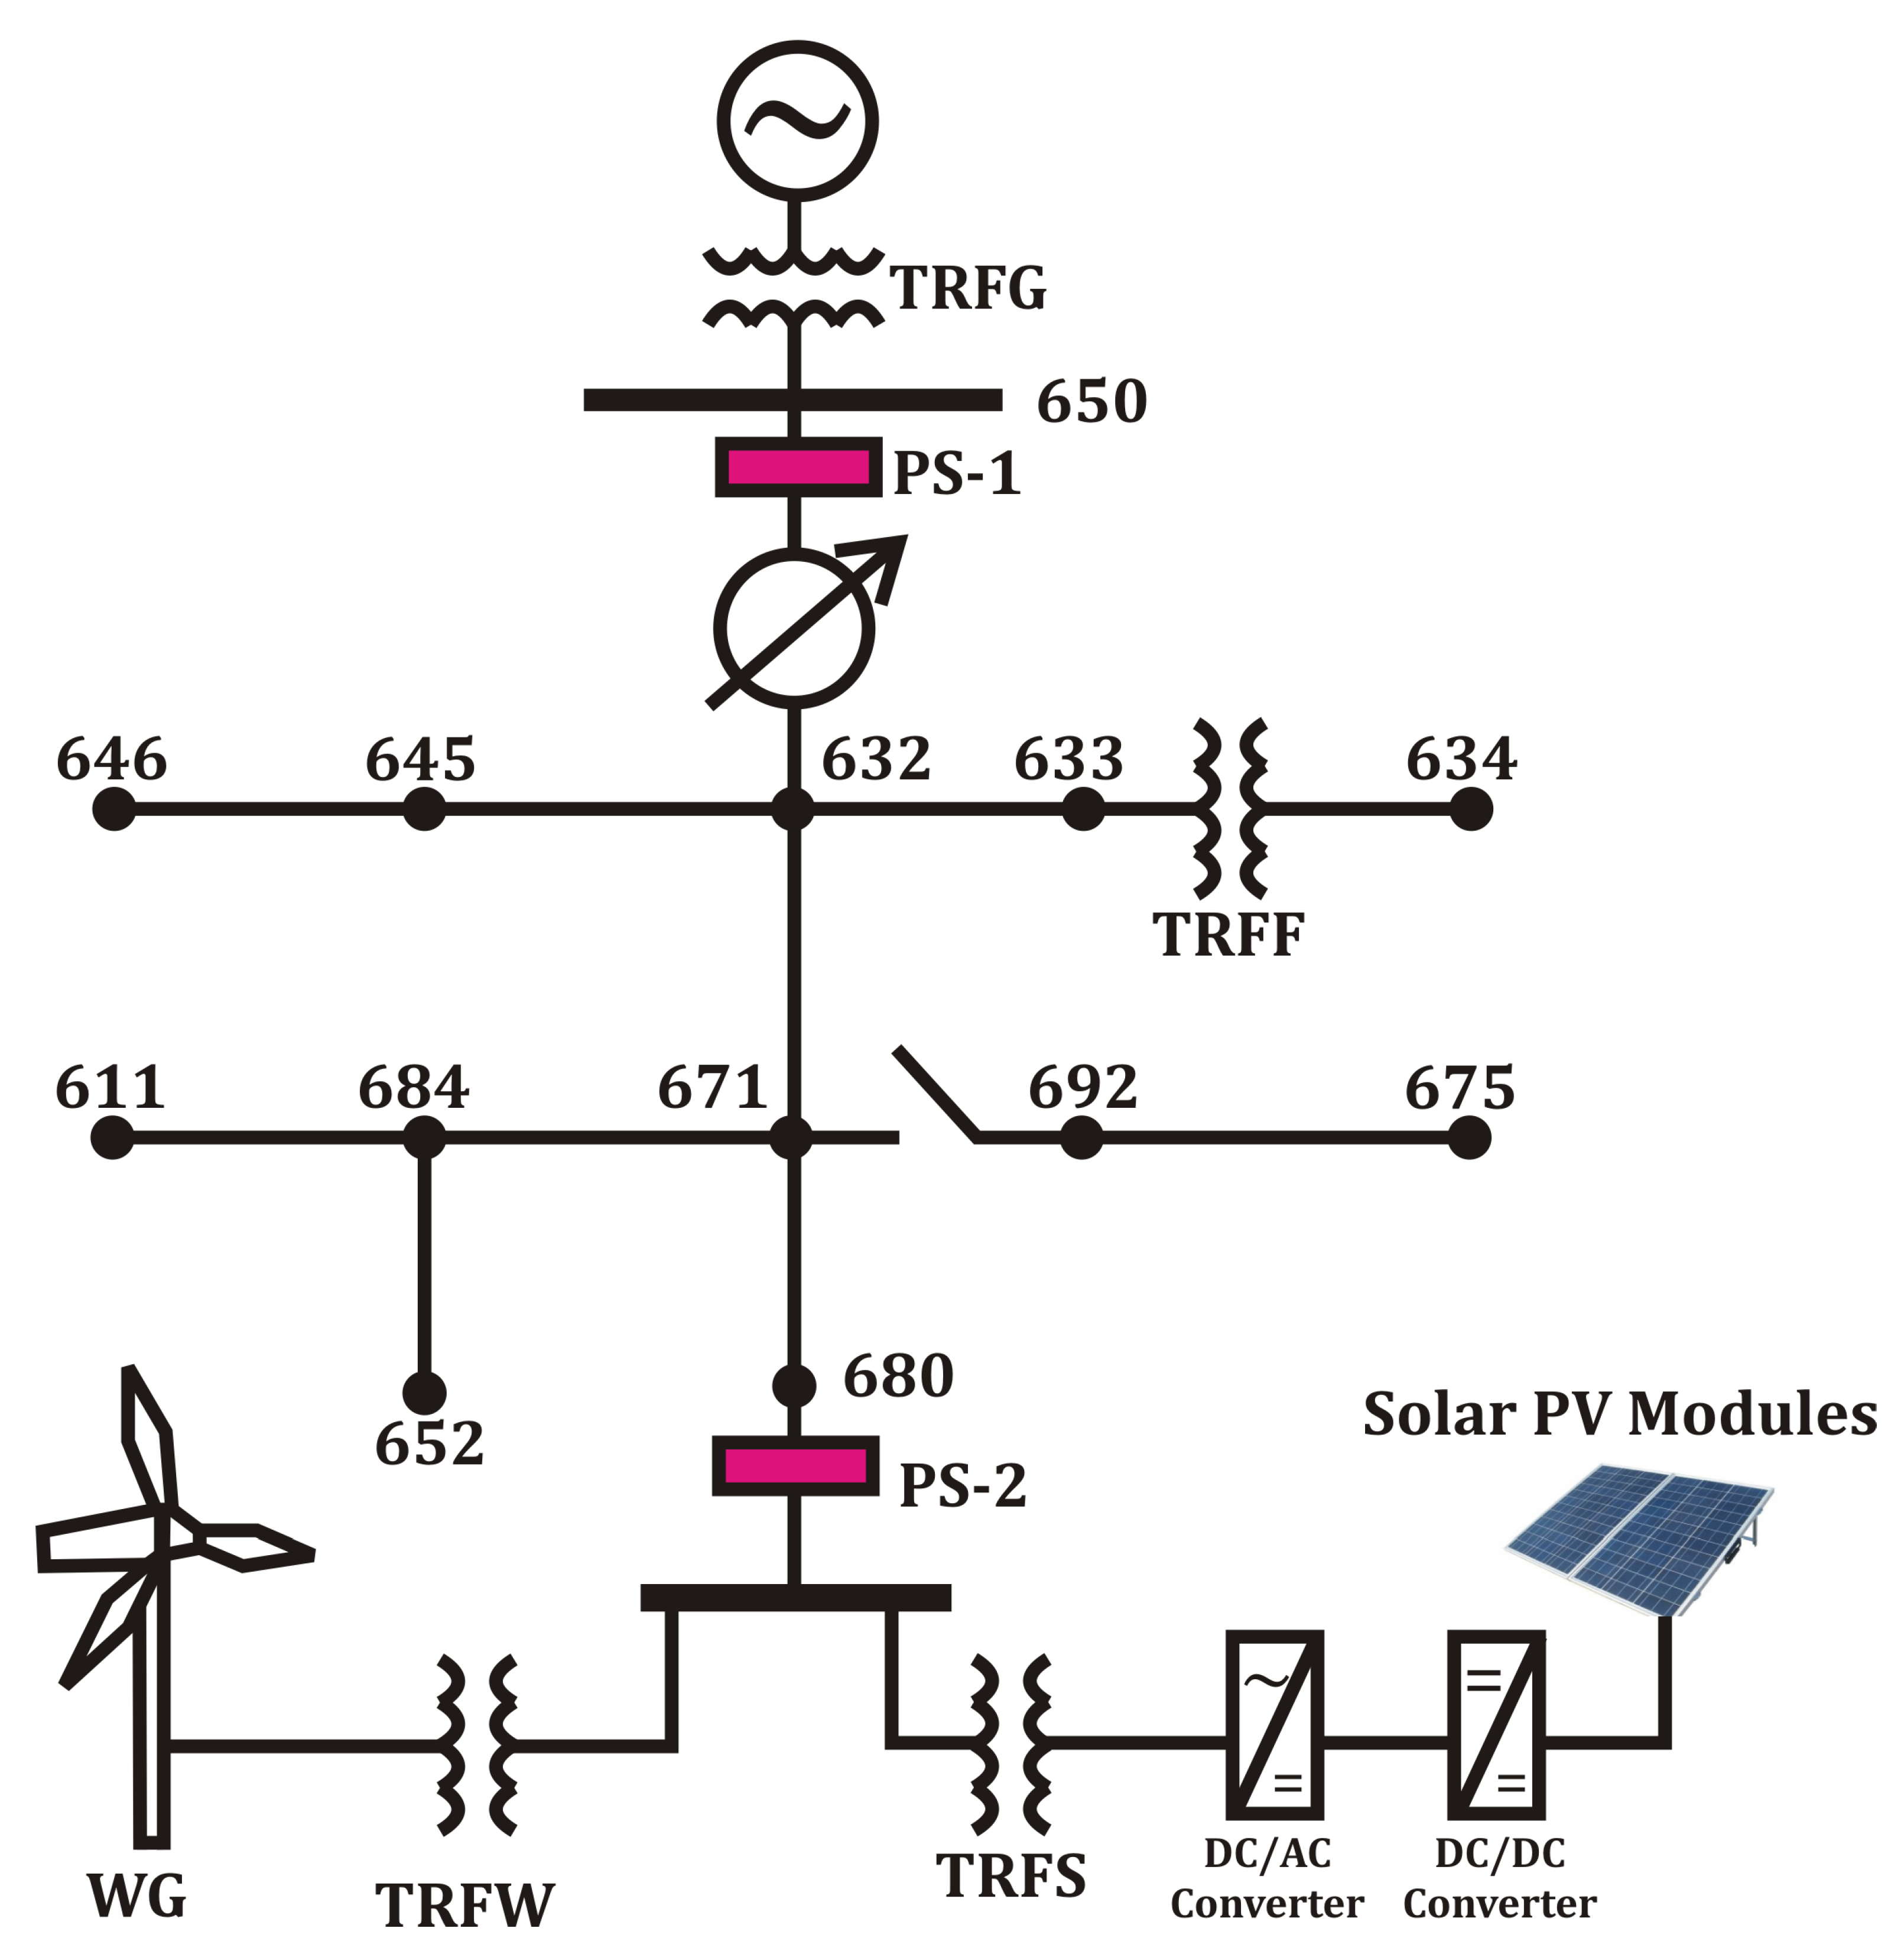
2. The Proposed Test System

IEEE-13 node test network is modelled as hybrid grid by incorporating the wind and solar photovoltaic (PV) generators. As specified by IEEE, the capacity of this network is equal to 5 M V A and operated at frequency of 60 Hz and two voltage levels of 0.48 kV and 4.16 kV [16,17]. Doubly fed induction generator-based wind plant (WG) of capacity 1.5 MW is integrated at node 680 of test system using transformer TRFW. Also, PV plant of capacity 1 MW is integrated to test network at node 680 using a transformer TRFS and an overhead line (5 km length) as described in Figure 1. Positive and zero sequence resistances of this line are 0.1153 and 0.413 Ω /km respectively. Positive and zero sequence inductances of the same line are 1.05 e 3 and 3.32 e 3 H/km respectively. Positive and zero sequence capacitances of the same line are 11.33 e 9 and 5.01 e 9 F/km respectively. Since, wind and solar PV plants are integrated at node 680, therefore this node is considered to be a point of common coupling (PCC).
The configurations of overhead (OH) lines and underground (UG) cables are considered same as that provided in the original data as illustrated in Table 1. Impedance matrix ( Z 601 ) of the OH lines (configuration 601) is provided by the Equation (1) where all the impedances are expressed in Ω /km. Impedance matrix ( Z 606 ) of UG cables (configuration 606) is provided by Equation (2) where all impedances are expressed in Ω /km. Positive and zero sequence capacitance magnitudes of 1.57199 nF/km and 1.3398 nF/km, respectively are used for OH lines. Similarly, the parameters for UG cables (configuration 606) are taken as 15.96979 μ F/km. All loads are assumed as 3 ϕ balanced as detailed in Table 2 [18,19].
Z 601 = 0.2153 + j 0.6325 0.0969 + j 0.3117 0.0982 + j 0.2632 0.0969 + j 0.3117 0.2097 + j 0.6511 0.0954 + j 0.2392 0.0982 + j 0.2632 0.0954 + j 0.2392 0.2121 + j 0.6430
Z 606 = 0.4960 + j 0.2773 0.1983 + j 0.0204 0.1770 + j 0.0089 0.1983 + j 0.0204 0.4903 + j 0.2511 0.1983 + j 0.0204 0.1770 + j 0.0089 0.1983 + j 0.0204 0.4960 + j 0.2773
Test network of the hybrid grid with RE penetration is integrated to the network of utility grid using a transformer designated as TRFG. A transformer designated as TRFF is used as interconnecting transformer (ICT) between the nodes 633 and 634 of hybrid grid. Parameters of transformers used in the hybrid grid are provided in Table 3.
Protection schemes PS-1 and PS-2 are installed at nodes 650 and 680 (PCC), respectively of the hybrid grid. These schemes will be used to disconnect the test hybrid grid and RE generators from the network of utility grid during the faulty events. Voltage and currents are continuously processed using the proposed algorithm and tripping signals are given to the respective circuit breaker (CB) if fault is detected. Protection schemes may be installed at any node of the hybrid grid by looking towards the actual requirement of protection. This algorithm will work well for all the locations of hybrid grid using a suitable weight factor for the proposed fault index. Results are discussed in detail for the protection scheme PS-1.

2.1. Wind Energy Conversion System

The wind energy conversion system (WECS) is comprised of a wind turbine, a doubly fed induction generator (DFIG) and a converter system. Kinetic energy of the wind is converted into mechanical energy of wind turbine shaft, which is converted into the electrical energy using the DFIG, coupled mechanically to the shaft of wind turbine. WECS consists of DFIG, with the capacity of 1.5 MW and operating at 60 Hz frequency with output voltage of 575 V [20]. Rated wind speed equal to 11 m/s is considered and generators have the following data: H (inertia constant)= 0.685 s, R s = 0.023 pu, L s = 0.18 pu, R r = 0.016 pu, L r = 0.016 pu, L m = 2.9 pu. Wind turbine, DFIG and their control systems were modelled using the parameters reported in [21,22].

2.2. Solar Photovoltaic System

The solar photovoltaic (PV) plant consists of components such as solar PV plates, boost converter, maximum power point tracking (MPPT) system, inverter, transformer, grid coupling inductor and capacitor. The solar panel where actual power is generated (solar to electrical energy transformation) comprises of series and parallel combinations of solar cells. Solar cell is fabricated in a thin layer of semiconductor in the form of p-n junction (p-n diode), which has the same operational characteristics as the p-n junction diode. Characteristics are dependent on the quantity of solar radiations and temperature of PV plates. A single diode equivalent model of solar PV cell with parallel and series resistances is used in this study and illustrated in Figure 2. This is simple in nature and has sufficient accuracy [23]. This solar PV system is interfaced to the test system to design a hybrid grid.
The solar PV plant of capacity 1 MW is formed using the ten units (each with capacity 100 kW) and integrated in parallel. The output voltage (V) of a solar cell (single-diode equivalent circuit) is related to the output current (I) as per following relation [24].
I = I p h I 0 e x p q ( V + I R s ) A k T 1 V + I R s R s h
where I p h : photo-current of solar PV cell, I 0 : saturation current of PV cell, A: curve fitting factor of PV cell, R s h : shunt resistance of PV cell, R s : series resistance of PV cell, q: electronic charge, and k: Boltzmann constant.
Magnitude of R s h is infinite at short circuit conditions. At this condition slope of I-V characteristics tends to zero [24]. Hence, I p h is equal to short circuit current ( I s c ) [23]. For a PV array organized in N p parallel and N s series connected solar cells, the current is expressed as below.
I = N p I s c N p I 0 e x p q ( V + I ( N s / N p ) R s ) N s A k T 1
Parameters simulated in this study for each module (at standard test condition) are as V o c = 64.2 V , I s c = 5.96 A , V m p = 54.7 V , I m p = 5.58 A , R s = 0.037998 Ω , R s h = 993.51 Ω , I 0 = 1.1753 e 8 A , diode quality factor Q d = 1.3 , and I p h = 5.9602 A [25]. The V m p and I m p are respectively the voltage and current at point of maximum power tracking.

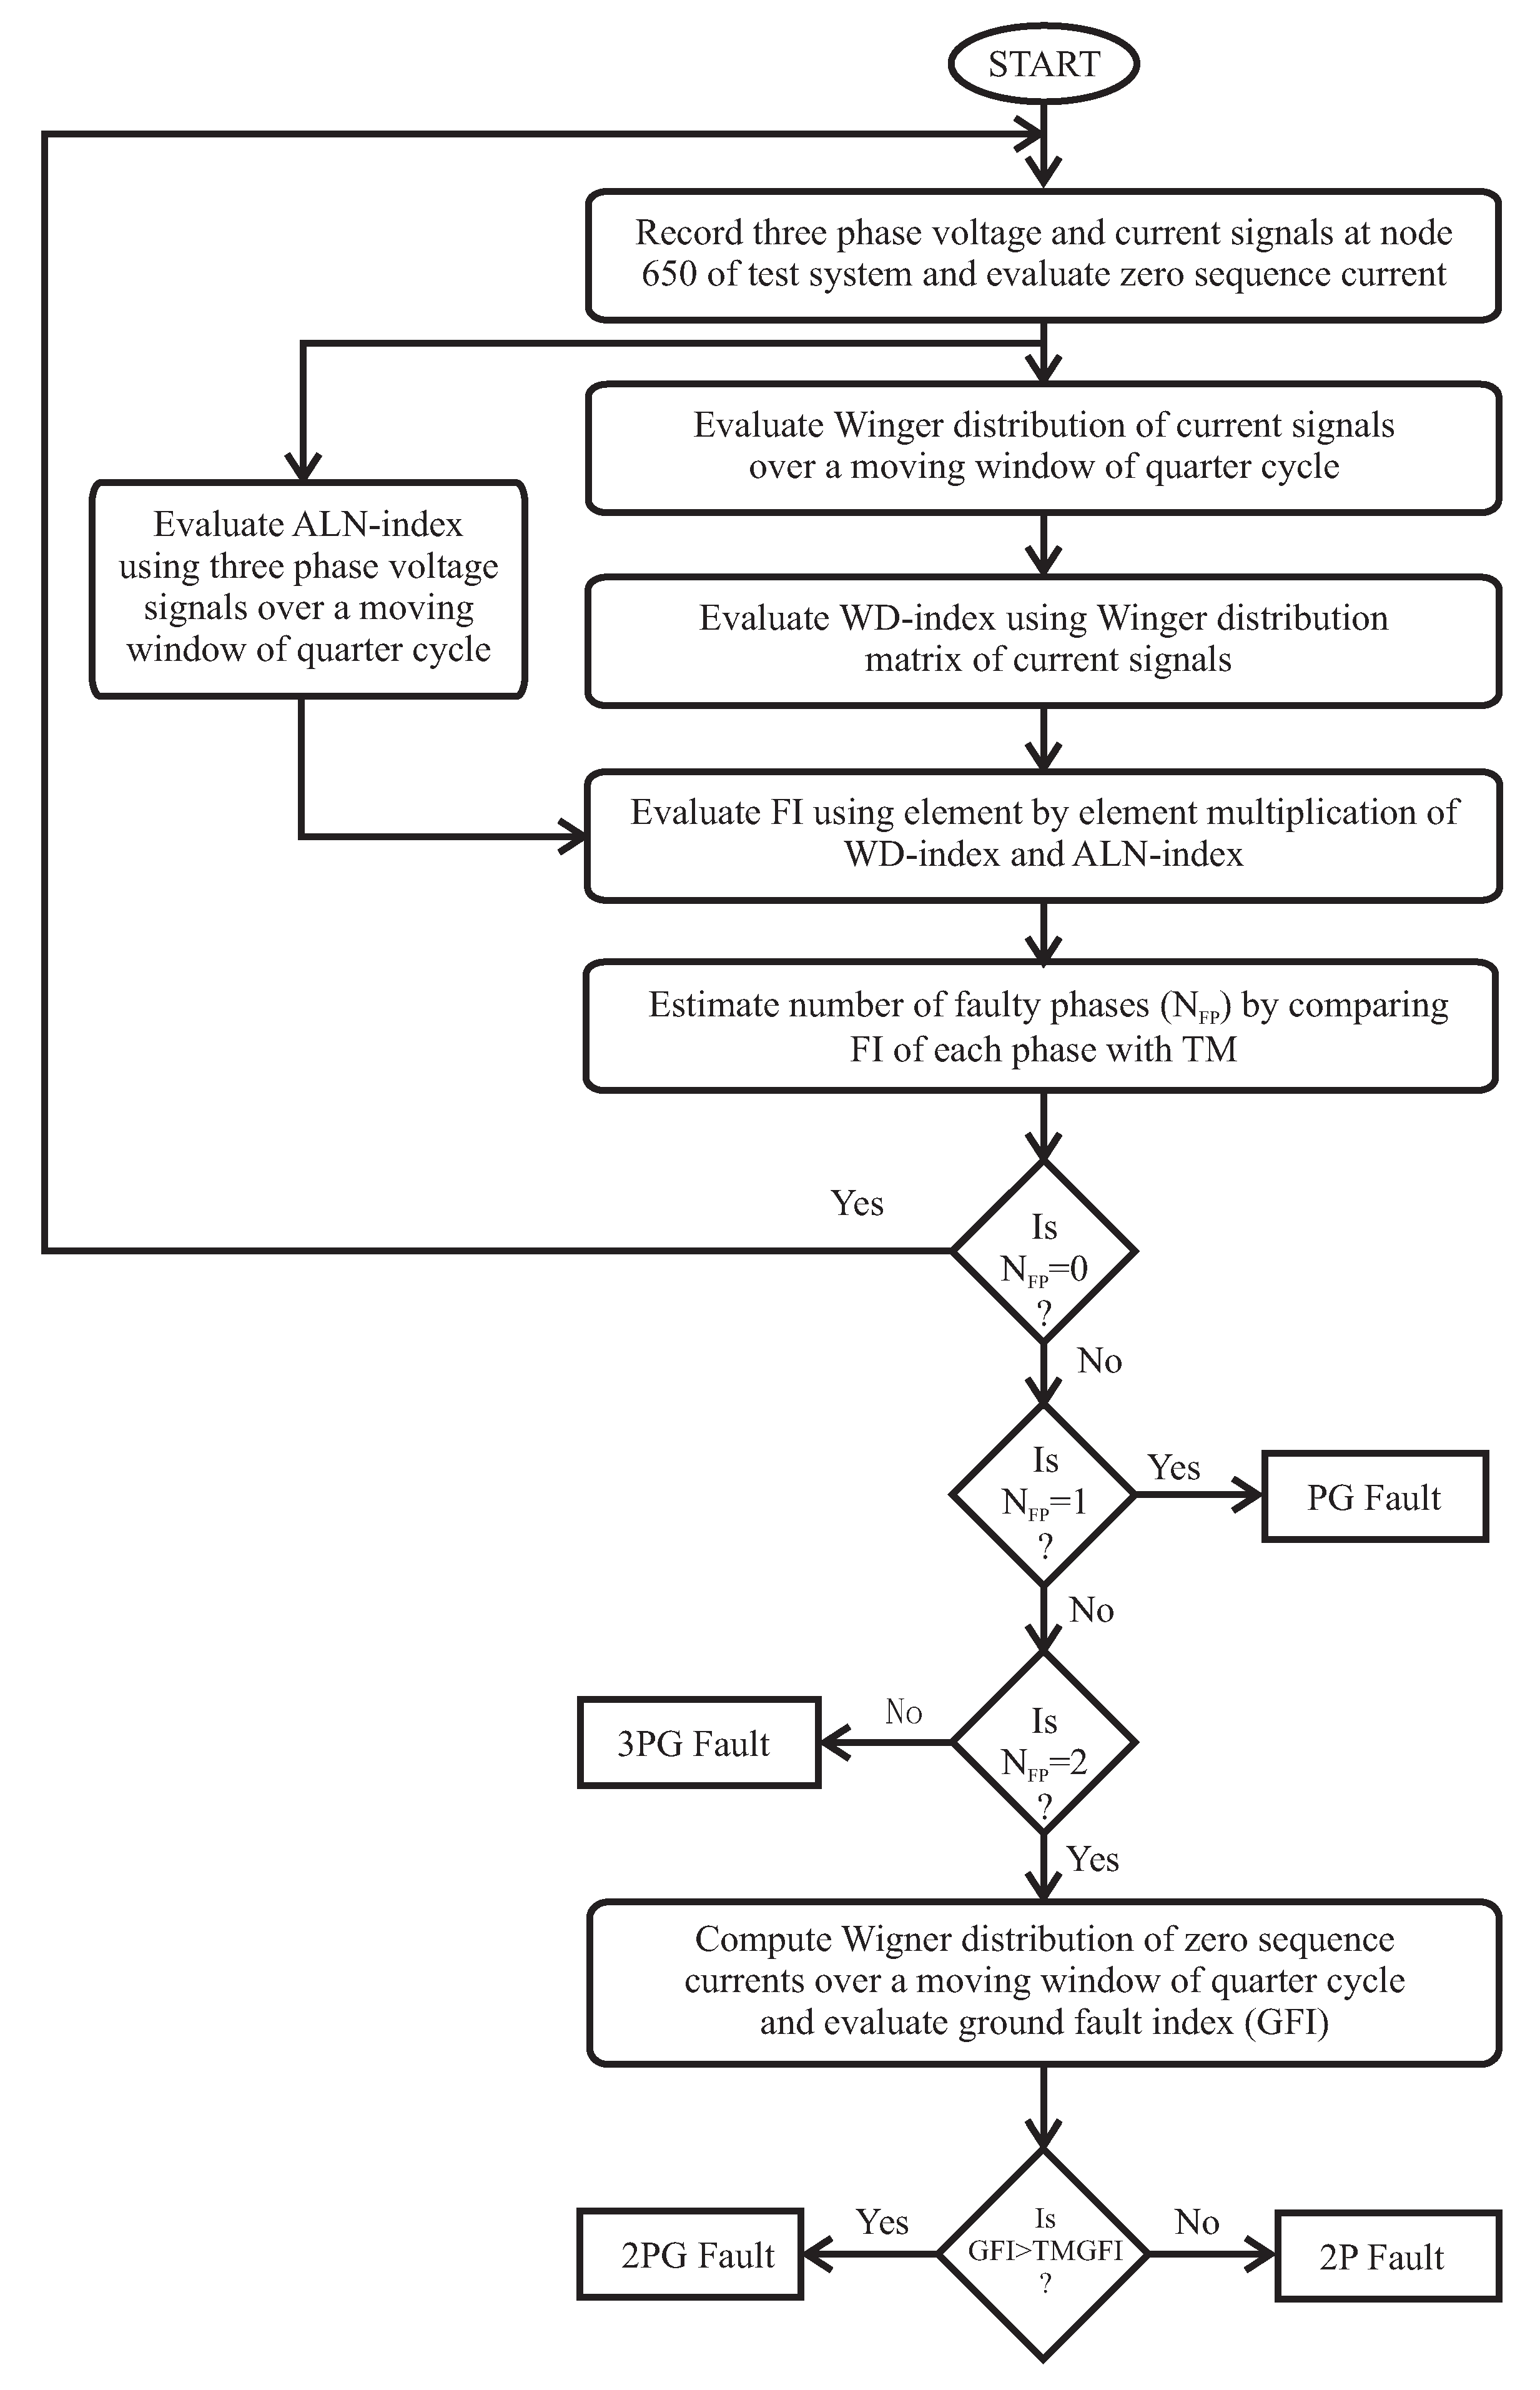
3. The Proposed Algorithm for the Protection Scheme

The algorithm for the recognition of faults in the hybrid power system, incorporated with RE sources, is based on features that are extracted from both the voltage and current signals. The proposed algorithm is implemented in two steps, where in first step faults are detected and in second step, faults are classified. Furthermore, detection of the faults is also performed in two steps, where current-based Wigner distribution index (WD-index) and voltage-based alienation index (ALN-index) are evaluated. The WD-index and ALN-index are multiplied to obtain the proposed fault index (FI), which is found to be effective for the discrimination of faulty events from healthy condition as well as faulty phase from healthy phase. The FI corresponding to the faulty phase will have a higher magnitude compared to the set threshold magnitude (TM) and it has a lower value than TM corresponding to the healthy phase during all conditions. The algorithm was tested on 30 sets of data for each fault type to set a threshold value of 5000. The data set is obtained by changing the parameters including fault impedance, incidence angle of fault, location of faults at various nodes of hybrid grid, presence of noise on both voltage and current signals etc. Classification of the faults is achieved by estimating the number of faulty phases. However, a ground fault index (GFI) using Wigner distribution function based decomposition of negative sequence current signals is introduced for discriminating double phase fault, with and without the involvement of ground. Deviations in the patterns of current and voltage waveforms during faulty events were used for the identification of faults using proposed algorithm; therefore there is no requirement for parameter normalization. The performance of the algorithm will be affected by the power network configuration and penetration level of the RE. However, the algorithm can be used in the different network configurations and RE penetration levels by changing the threshold magnitude. All steps of algorithm are described with the help of flow chart as illustrated in Figure 3. FI, GFI, current-based WD-index and voltage-based ALN-index are described below. The study is performed in MATLAB/Simulink 2017a software environment on a laptop computer which has a 64 bit operating system, RAM of 4 GB, and Intel (I) Core(TM) i5-3230M [email protected] GHz processor.

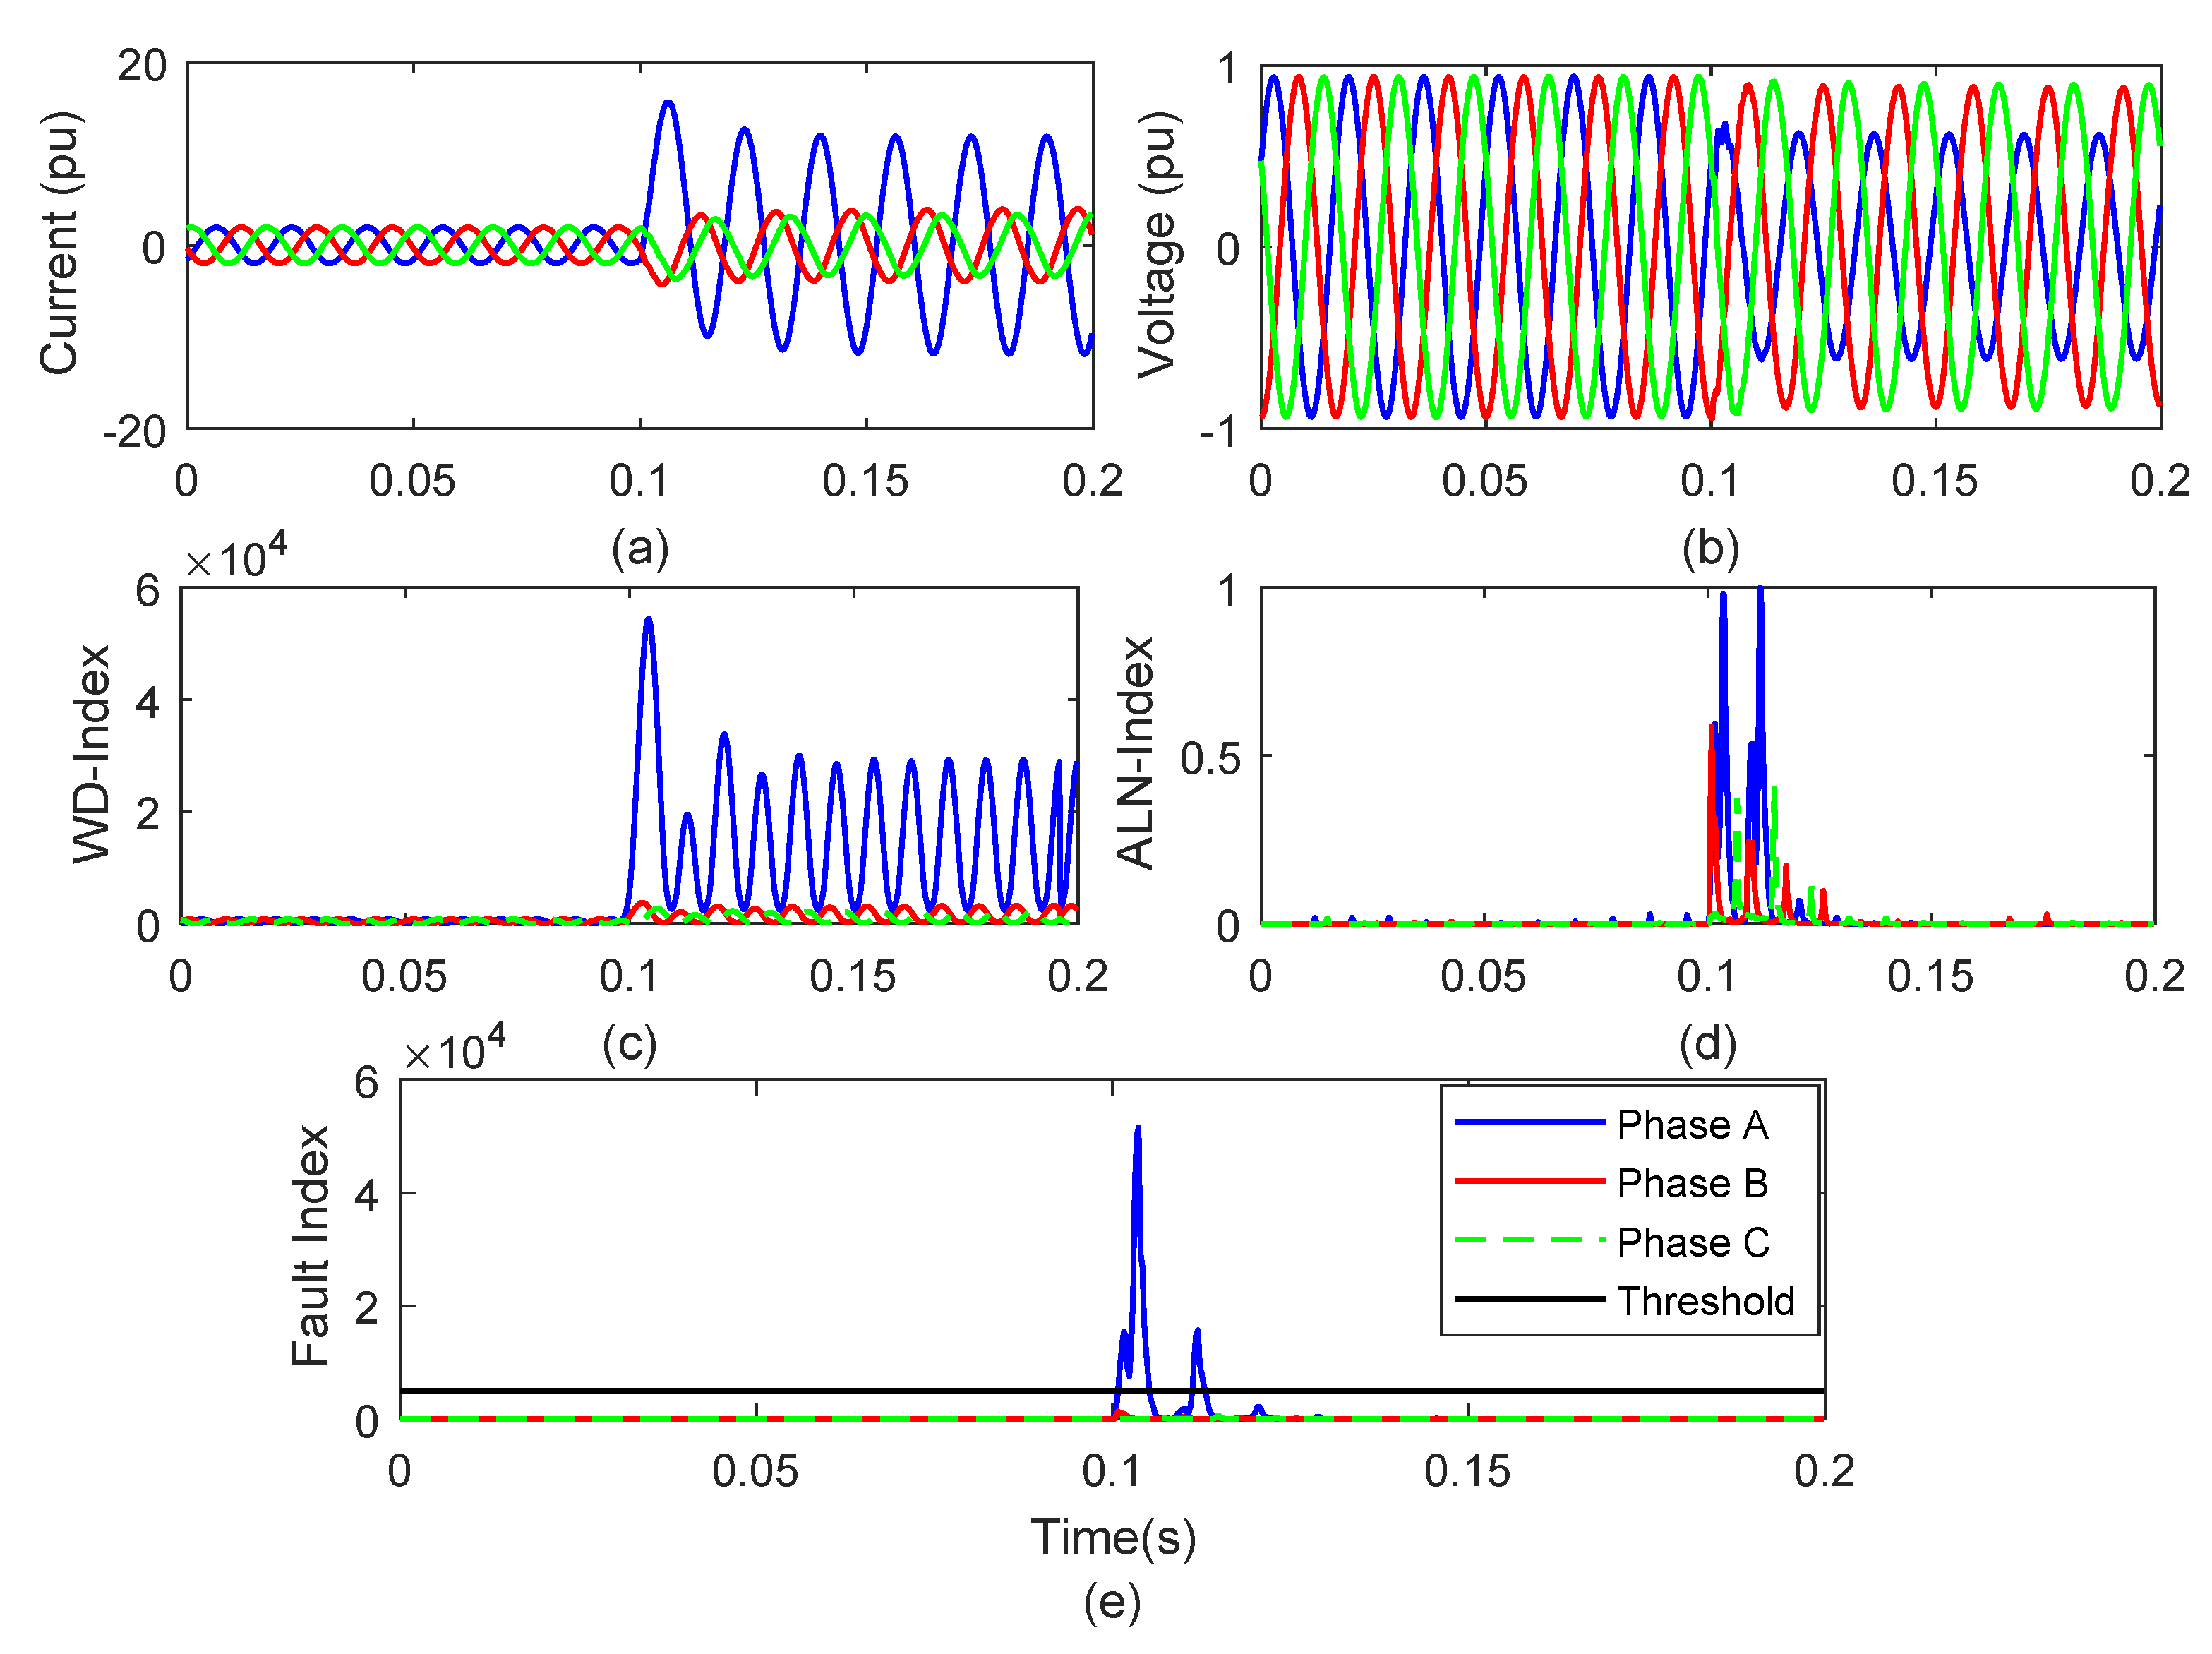
3.1. Current Based Wigner Distribution Index

Wigner distribution function (WDF) is a phase space distribution function. This is effective in description of signal in a space and frequency at the same time. This can be considered to be a local frequency spectrum of the signal. This can be used for processing of both deterministic and stochastic signals. The WDF is effective in providing local frequency spectrum of the signal. Hence, it is most suitable for analysis of the faulty transients to identify the faulty events. The current signals captured at node 650 are processed using Wigner distribution function over a quarter cycle with a sampling frequency (SF) of 3.84 kHz. Window moving by one sample step is used for the continuous computation of Wigner distribution. Absolute magnitude of the output is evaluated and designated as WD-index. Energy density of current signal is used by the WD-index for estimation of the faults. This is achieved by Bilinear analysis of current signal I ( t ) (in time domain ) twice. The WD-index has the advantage of high concentration of energy as well as high resolution of time-frequency [26]. Following relation effectively illustrates the evaluation of WD-index by processing the current signal ( I ( t ) ) [27].
W D i n d e x = I ( t + τ 2 ) I * ( t + τ 2 ) e j ω τ d τ
here representations of symbols are as follows t: time (sliding variable); ω : signal angular frequency; τ : time domain based signal function.

3.2. Voltage Based Alienation Index

Alienation index is computed using sample-based alienation coefficients of voltage signals at a SF of 3.84 kHz and designated as ALN-index. This index is evaluated using the correlation coefficient (r) between voltage magnitudes at two different time instants as detailed below.
A L N i n d e x = 1 r 2
Here, r is the correlation coefficient between voltage variables x and y and can be expressed as detailed below.
r = N s x y ( x ) ( y ) [ N s x 2 ( x ) 2 ] [ N s y 2 ( y ) 2 ]
here N s is the numbers considered in a cycle (in this study N s = 64 is considered), x is the voltage samples measured at time t 0 , y is the voltage samples measured at T + t 0 time where T is time period of voltage signal [28,29]. The ALN-index is evaluated with the help of moving window technique for the samples of quarter cycle. Implementation of this index is based on the comparison of data of quarter cycle considered with the data of previous quarter cycle using a moving window (one sample step). This index is effective in reducing the fault detection time because it has the merit of sharp change at the time of fault incidence. This makes the protection scheme fast.

3.3. Fault Index Based on Voltage and Current Features

A fault index (FI), based on the features of both voltage and current is introduced for recognition of faults in the hybrid power system with RE penetration. This index is computed using element to element multiplication of ALN-index and WD-index as detailed in the following relation.
F I = ( A L N i n d e x ) × ( W D i n d e x )
The proposed FI effectively identifies the different nature of faults in the hybrid power network with RE penetration by good accuracy and minimum time. This is achieved by comparing the magnitude of FI with pre-set threshold magnitude (TM). Individual application of ALN-index will not detect any type of fault due to its same value for all phases for all the events. However, application of WD-index individually will recognize the faults but time of fault identification will be low, which will reduce the protection speed. Hence, FI combines the merits of both ALN-index and WD-index.

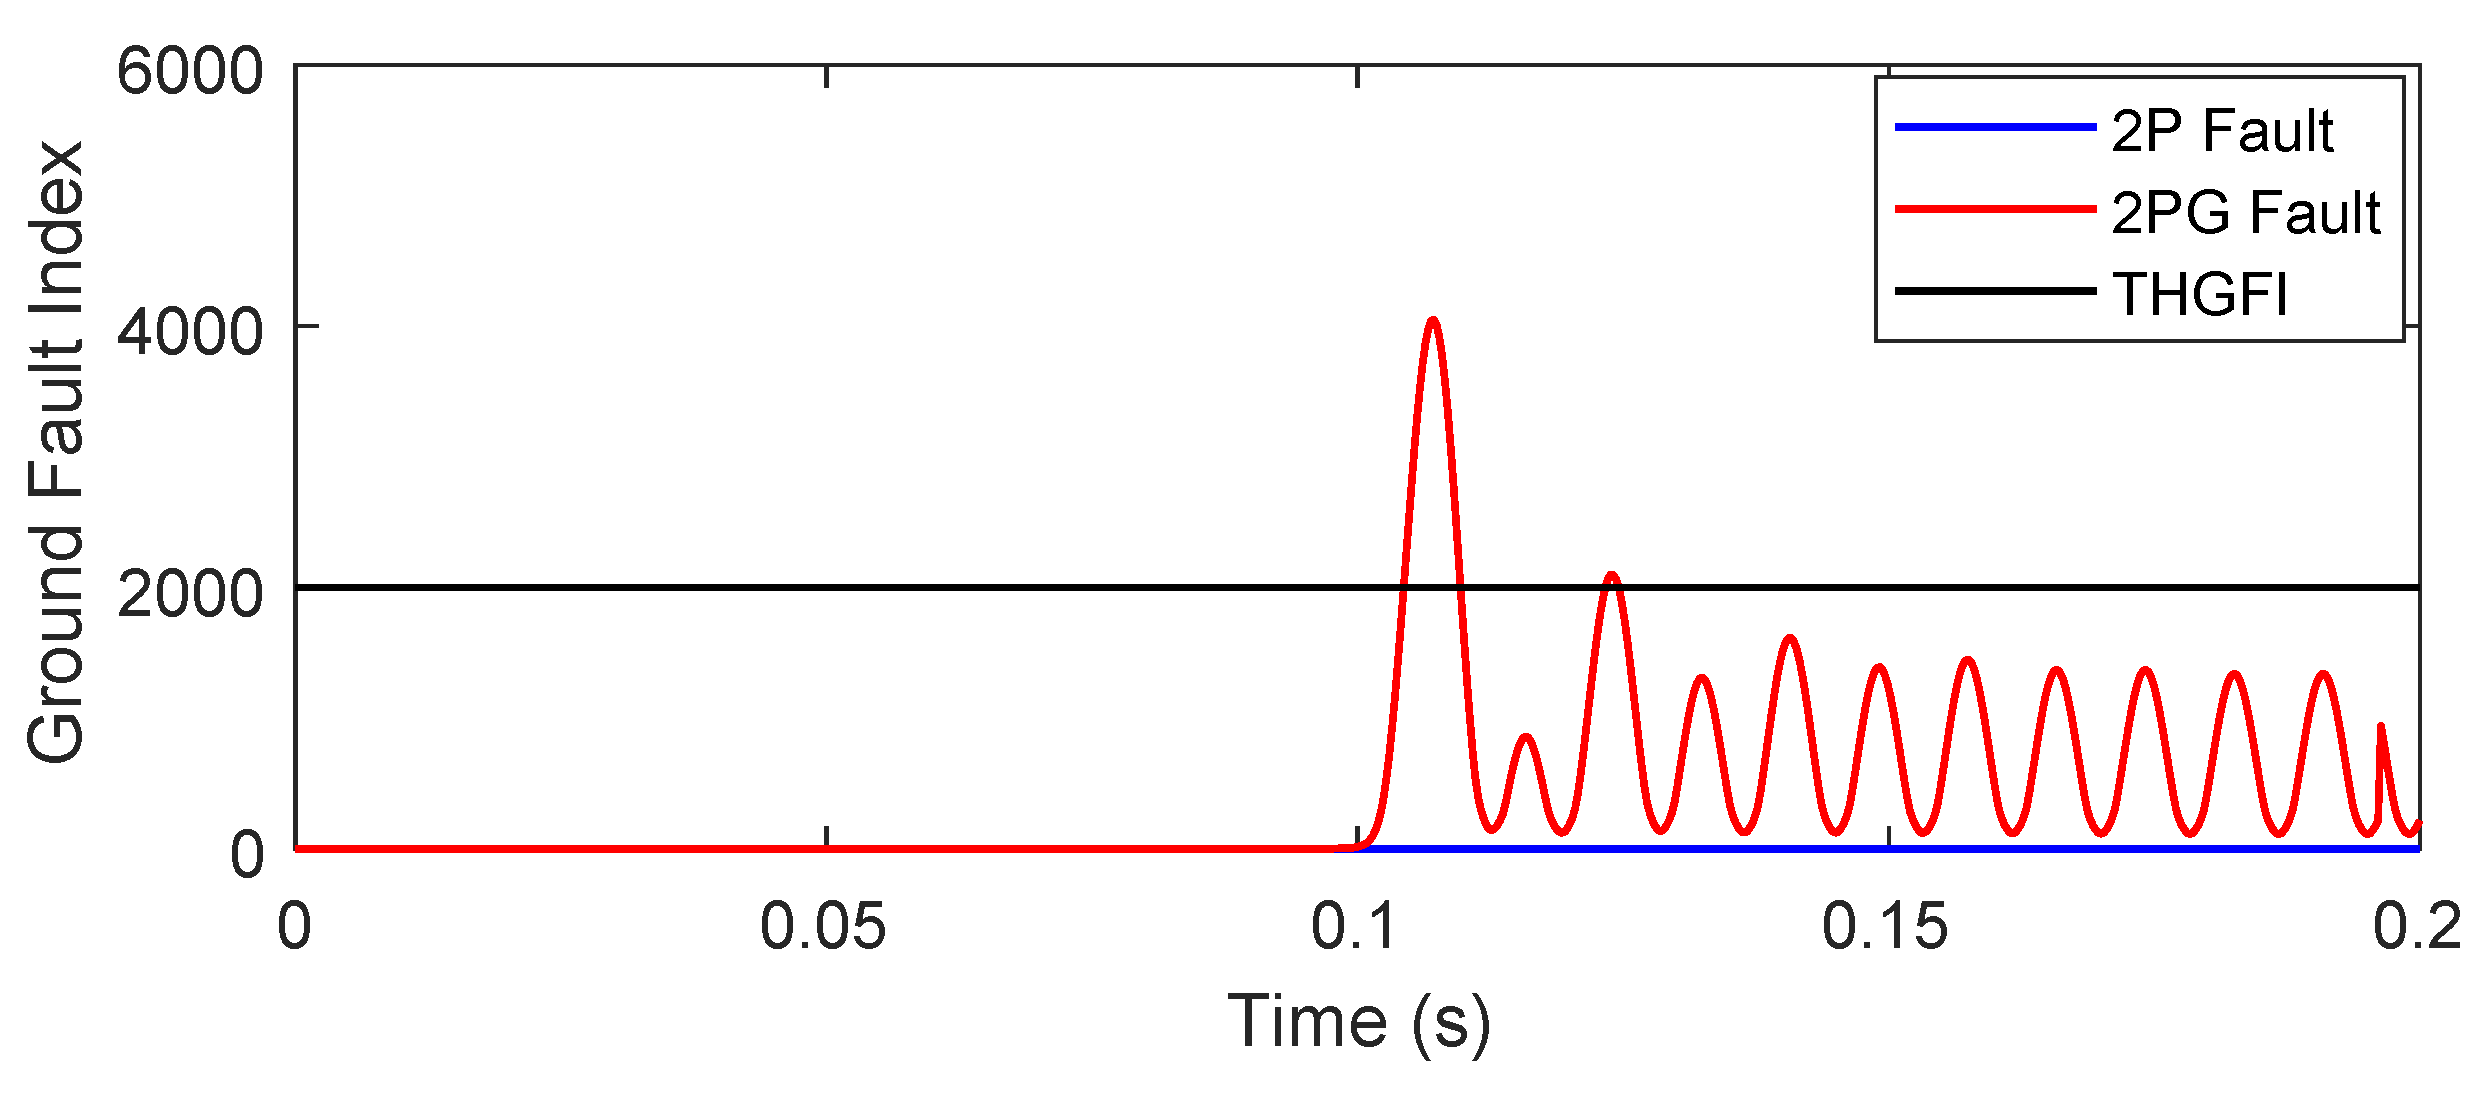
3.4. Ground Fault Index

Faults 2P and 2PG cannot be differentiated from each other based on the number of faulty phases. This is achieved by introducing the ground fault index (GFI), which is obtained by processing the zero sequence component of the current signal sampled at the frequency of 3.84 kHz using Wigner distribution function as illustrated in Equation (5). A threshold magnitude for ground fault index (TMGFI) is set equal to 2000 for differentiating the 2P and 2PG faults. Magnitude of GFI greater than TMGFI will indicate the involvement of ground in the faulty event. Hence, values of GFI greater than TMGFI detects the 2PG fault. However, values low compared to the TMGFI detects the 2P fault.

4. Faulty Event Recognition: Simulation Results

This section firstly elaborates the impacts of faulty events on performance of the hybrid grid and requirement of protection schemes. Results of recognition of the faults with a different nature and incidents in the hybrid power network with RE penetration are described and discussed in this section Faults of different types are simulated at node 646 of test system. The current and voltage are recorded at the location of protection scheme (PS-1) at node 650.

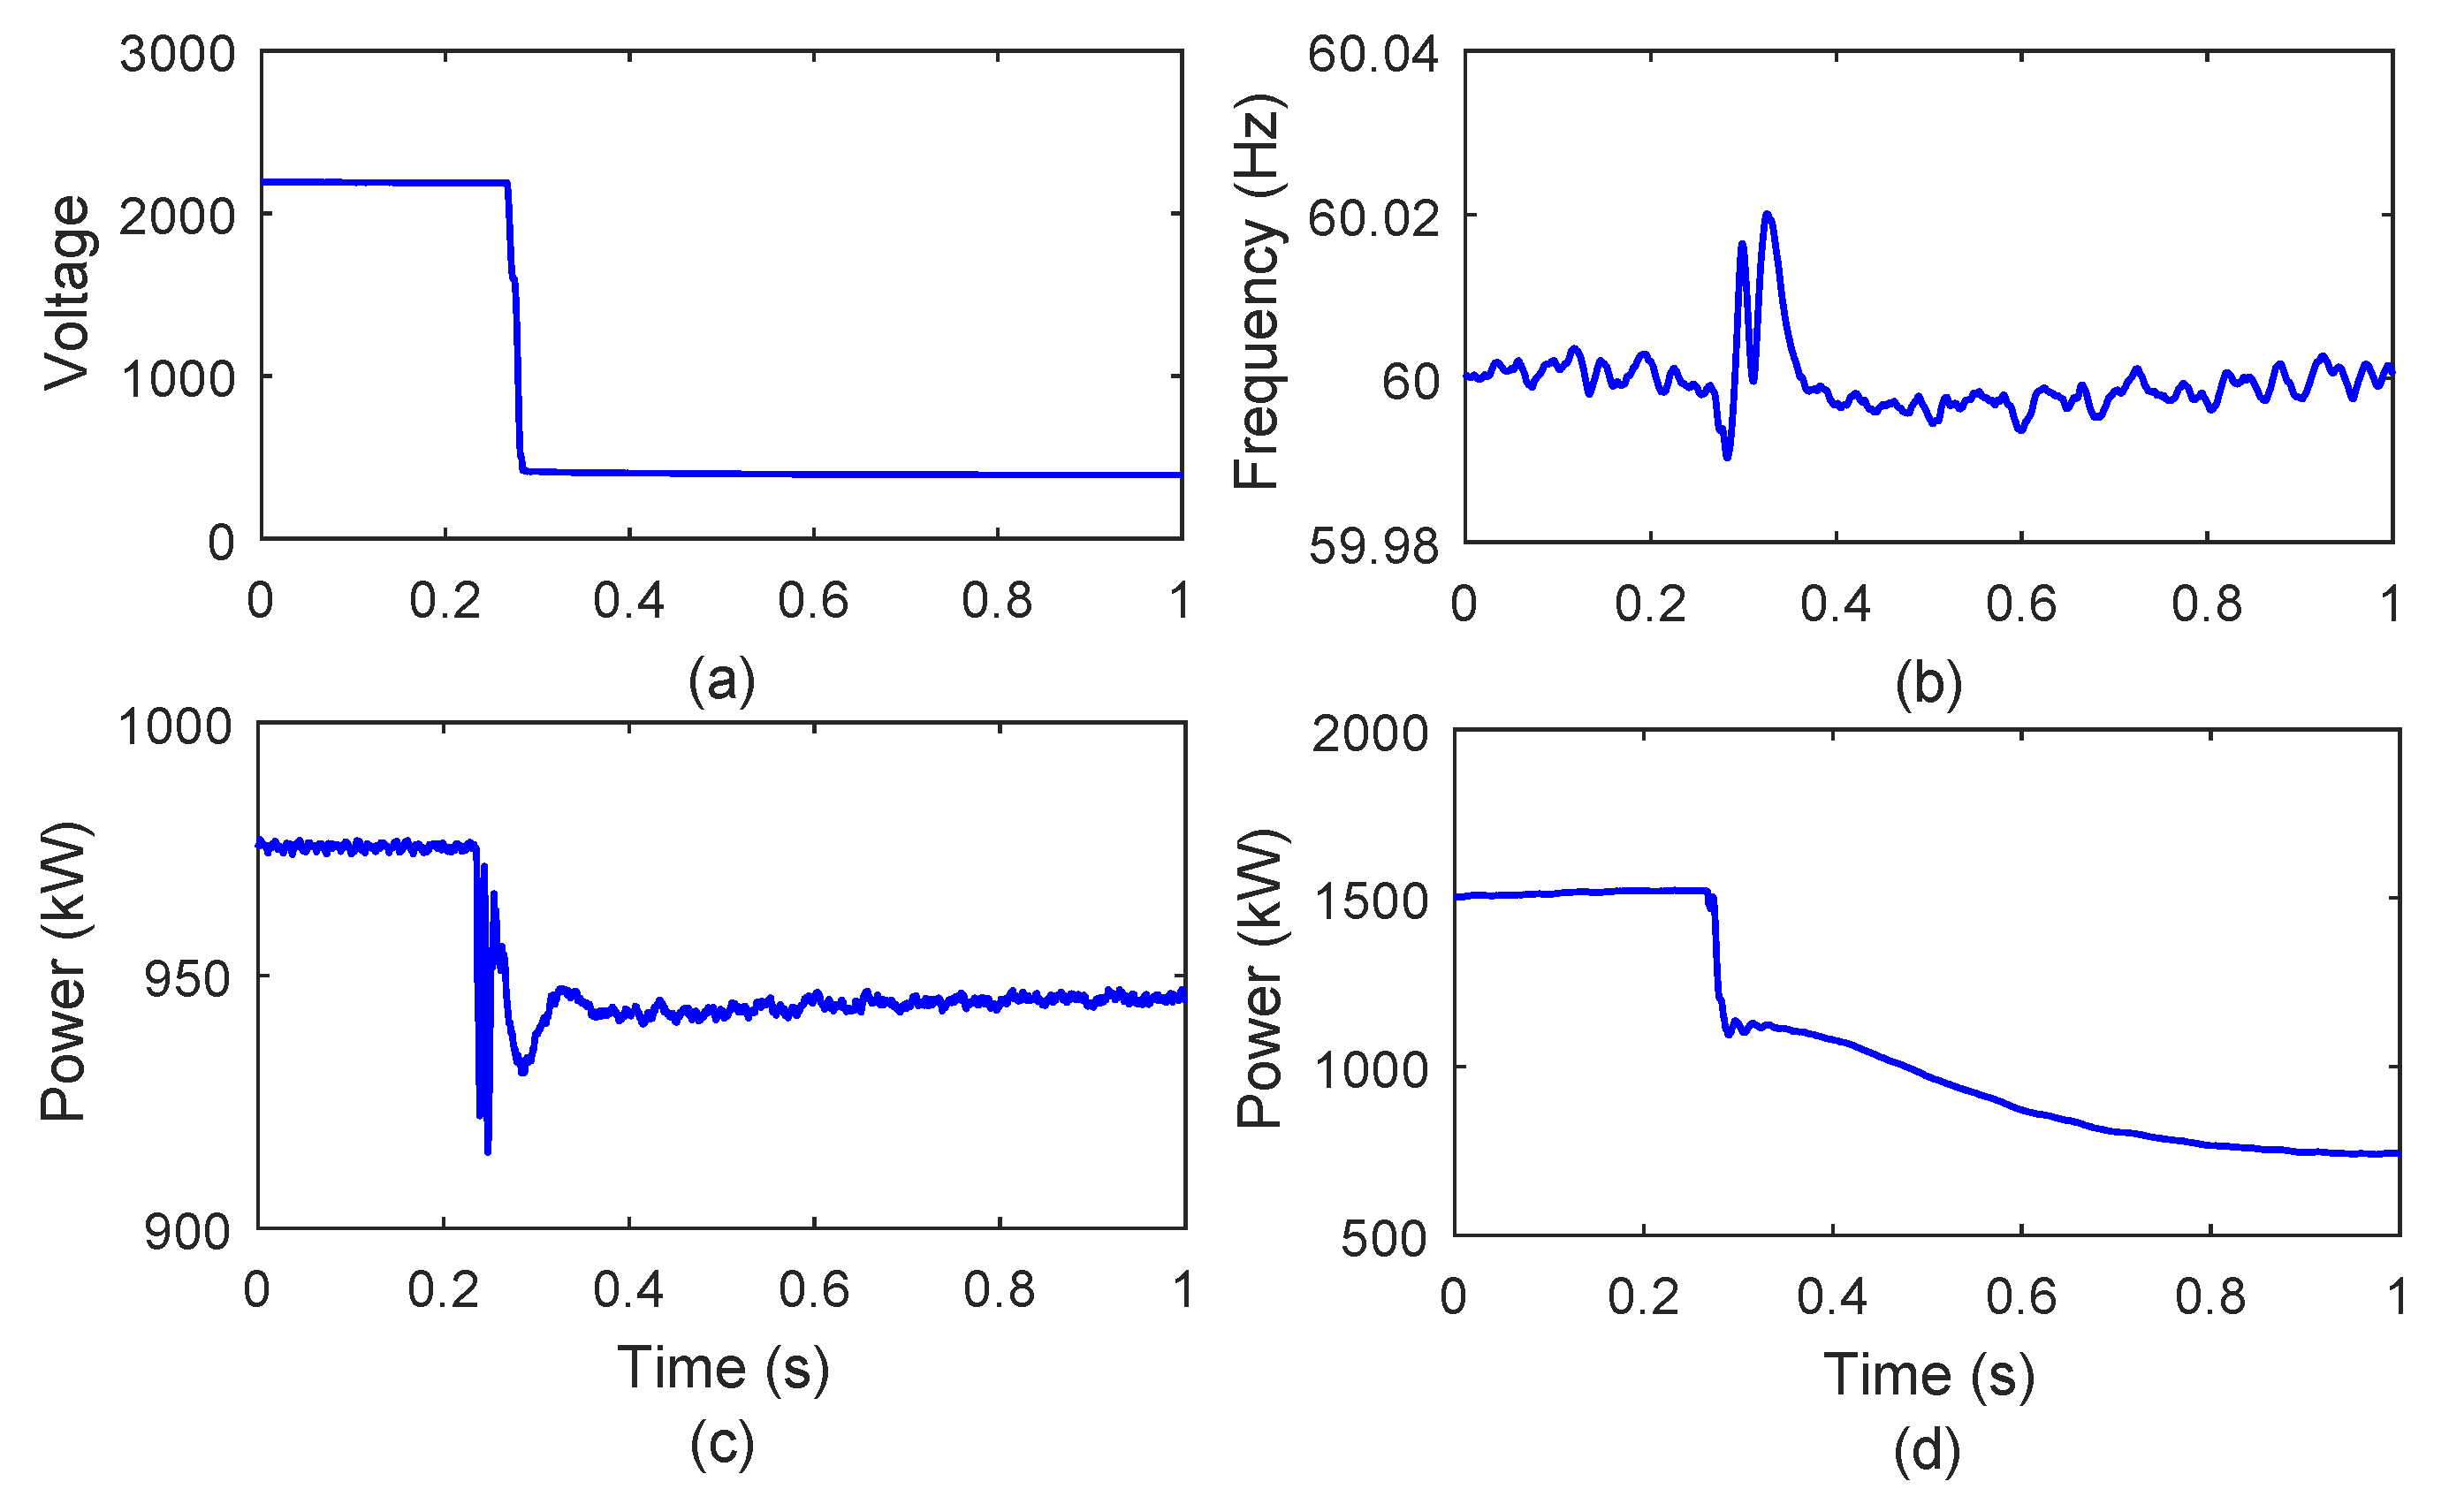
4.1. Impacts of Faulty Events on the Performance of Hybrid Grid and Requirement of Protection Schemes

To investigate the impacts of faulty events on the performance of hybrid grid, root mean square (RMS) voltage at the node 650, frequency, power injected by solar PV system and wind power plant into the hybrid grid during the event of PG (phase A) fault at node 646 at 6th cycle are illustrated in Figure 4a–d, respectively. It is observed from Figure 4a that RMS voltage decreases during faulty event whereas small deviations are observed in the frequency for short duration at the time of fault incidence as depicted in Figure 4b. Power supplied by the solar PV and wind generators reduced as depicted in Figure 4c,d, respectively. Hence, performance of the hybrid grid will be affected adversely, if faulty events persist. Therefore, suitable protection scheme needs to be investigated and designed to isolate the faulty section of the hybrid grid.

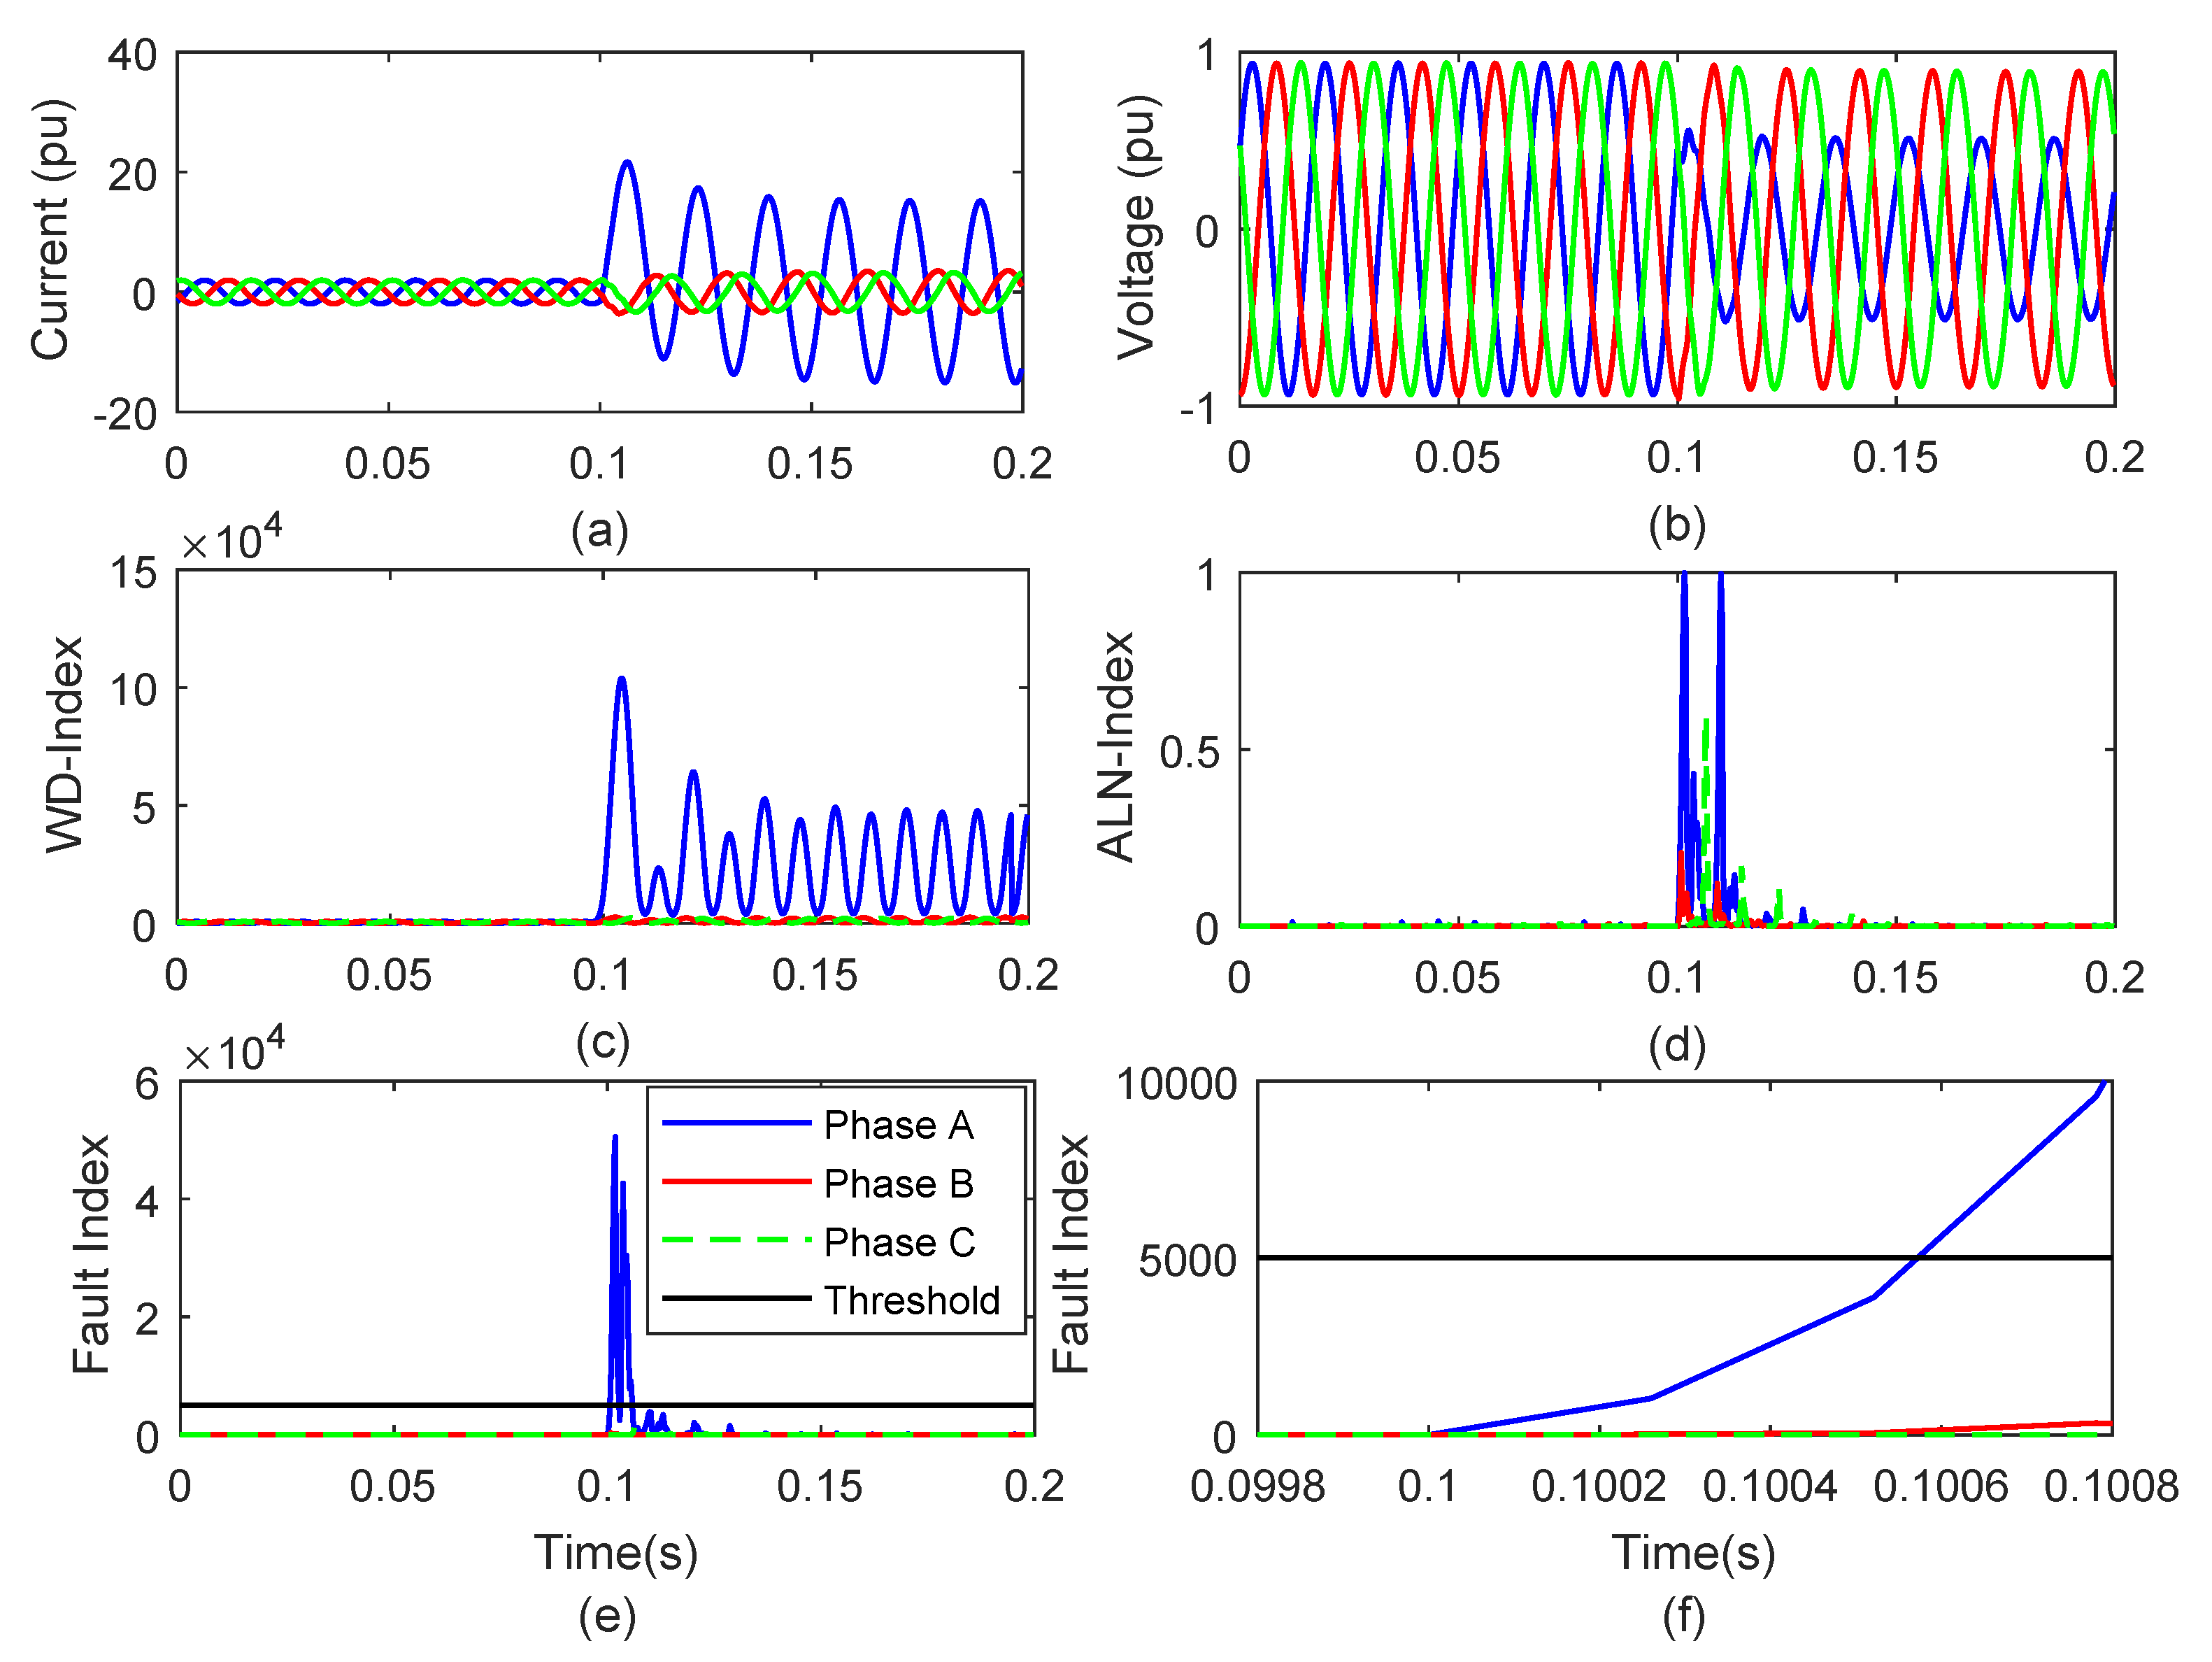
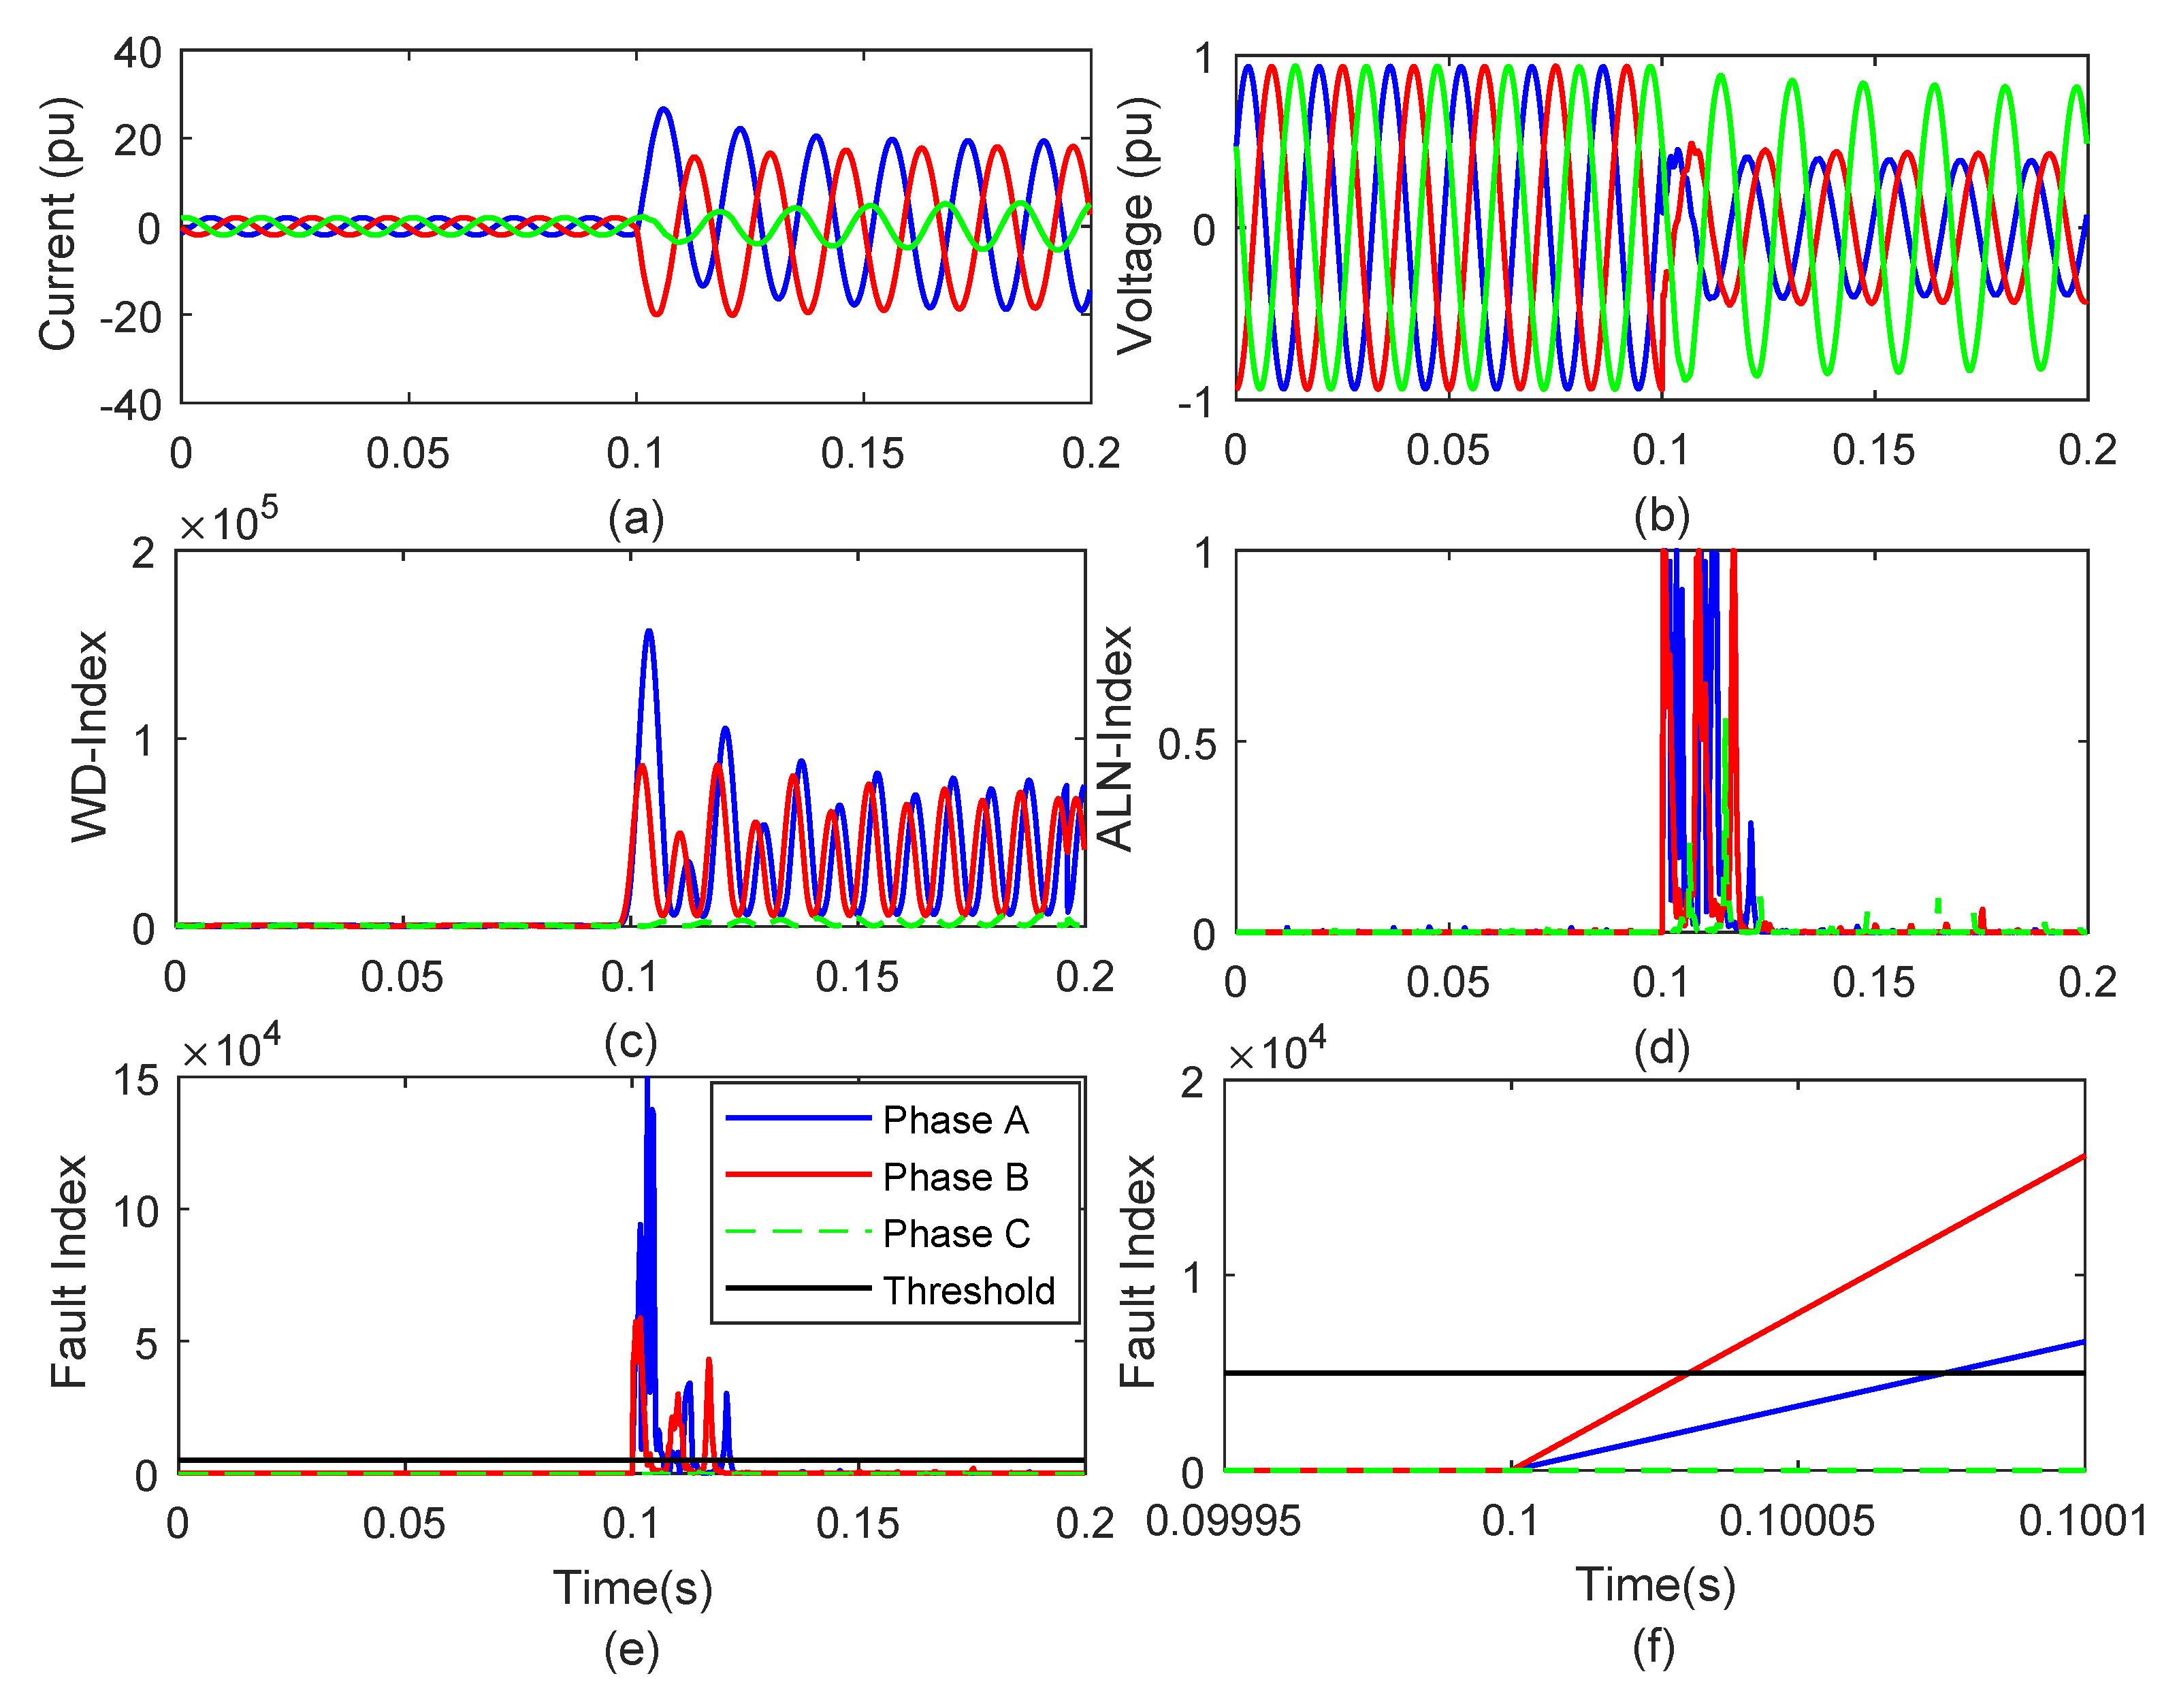
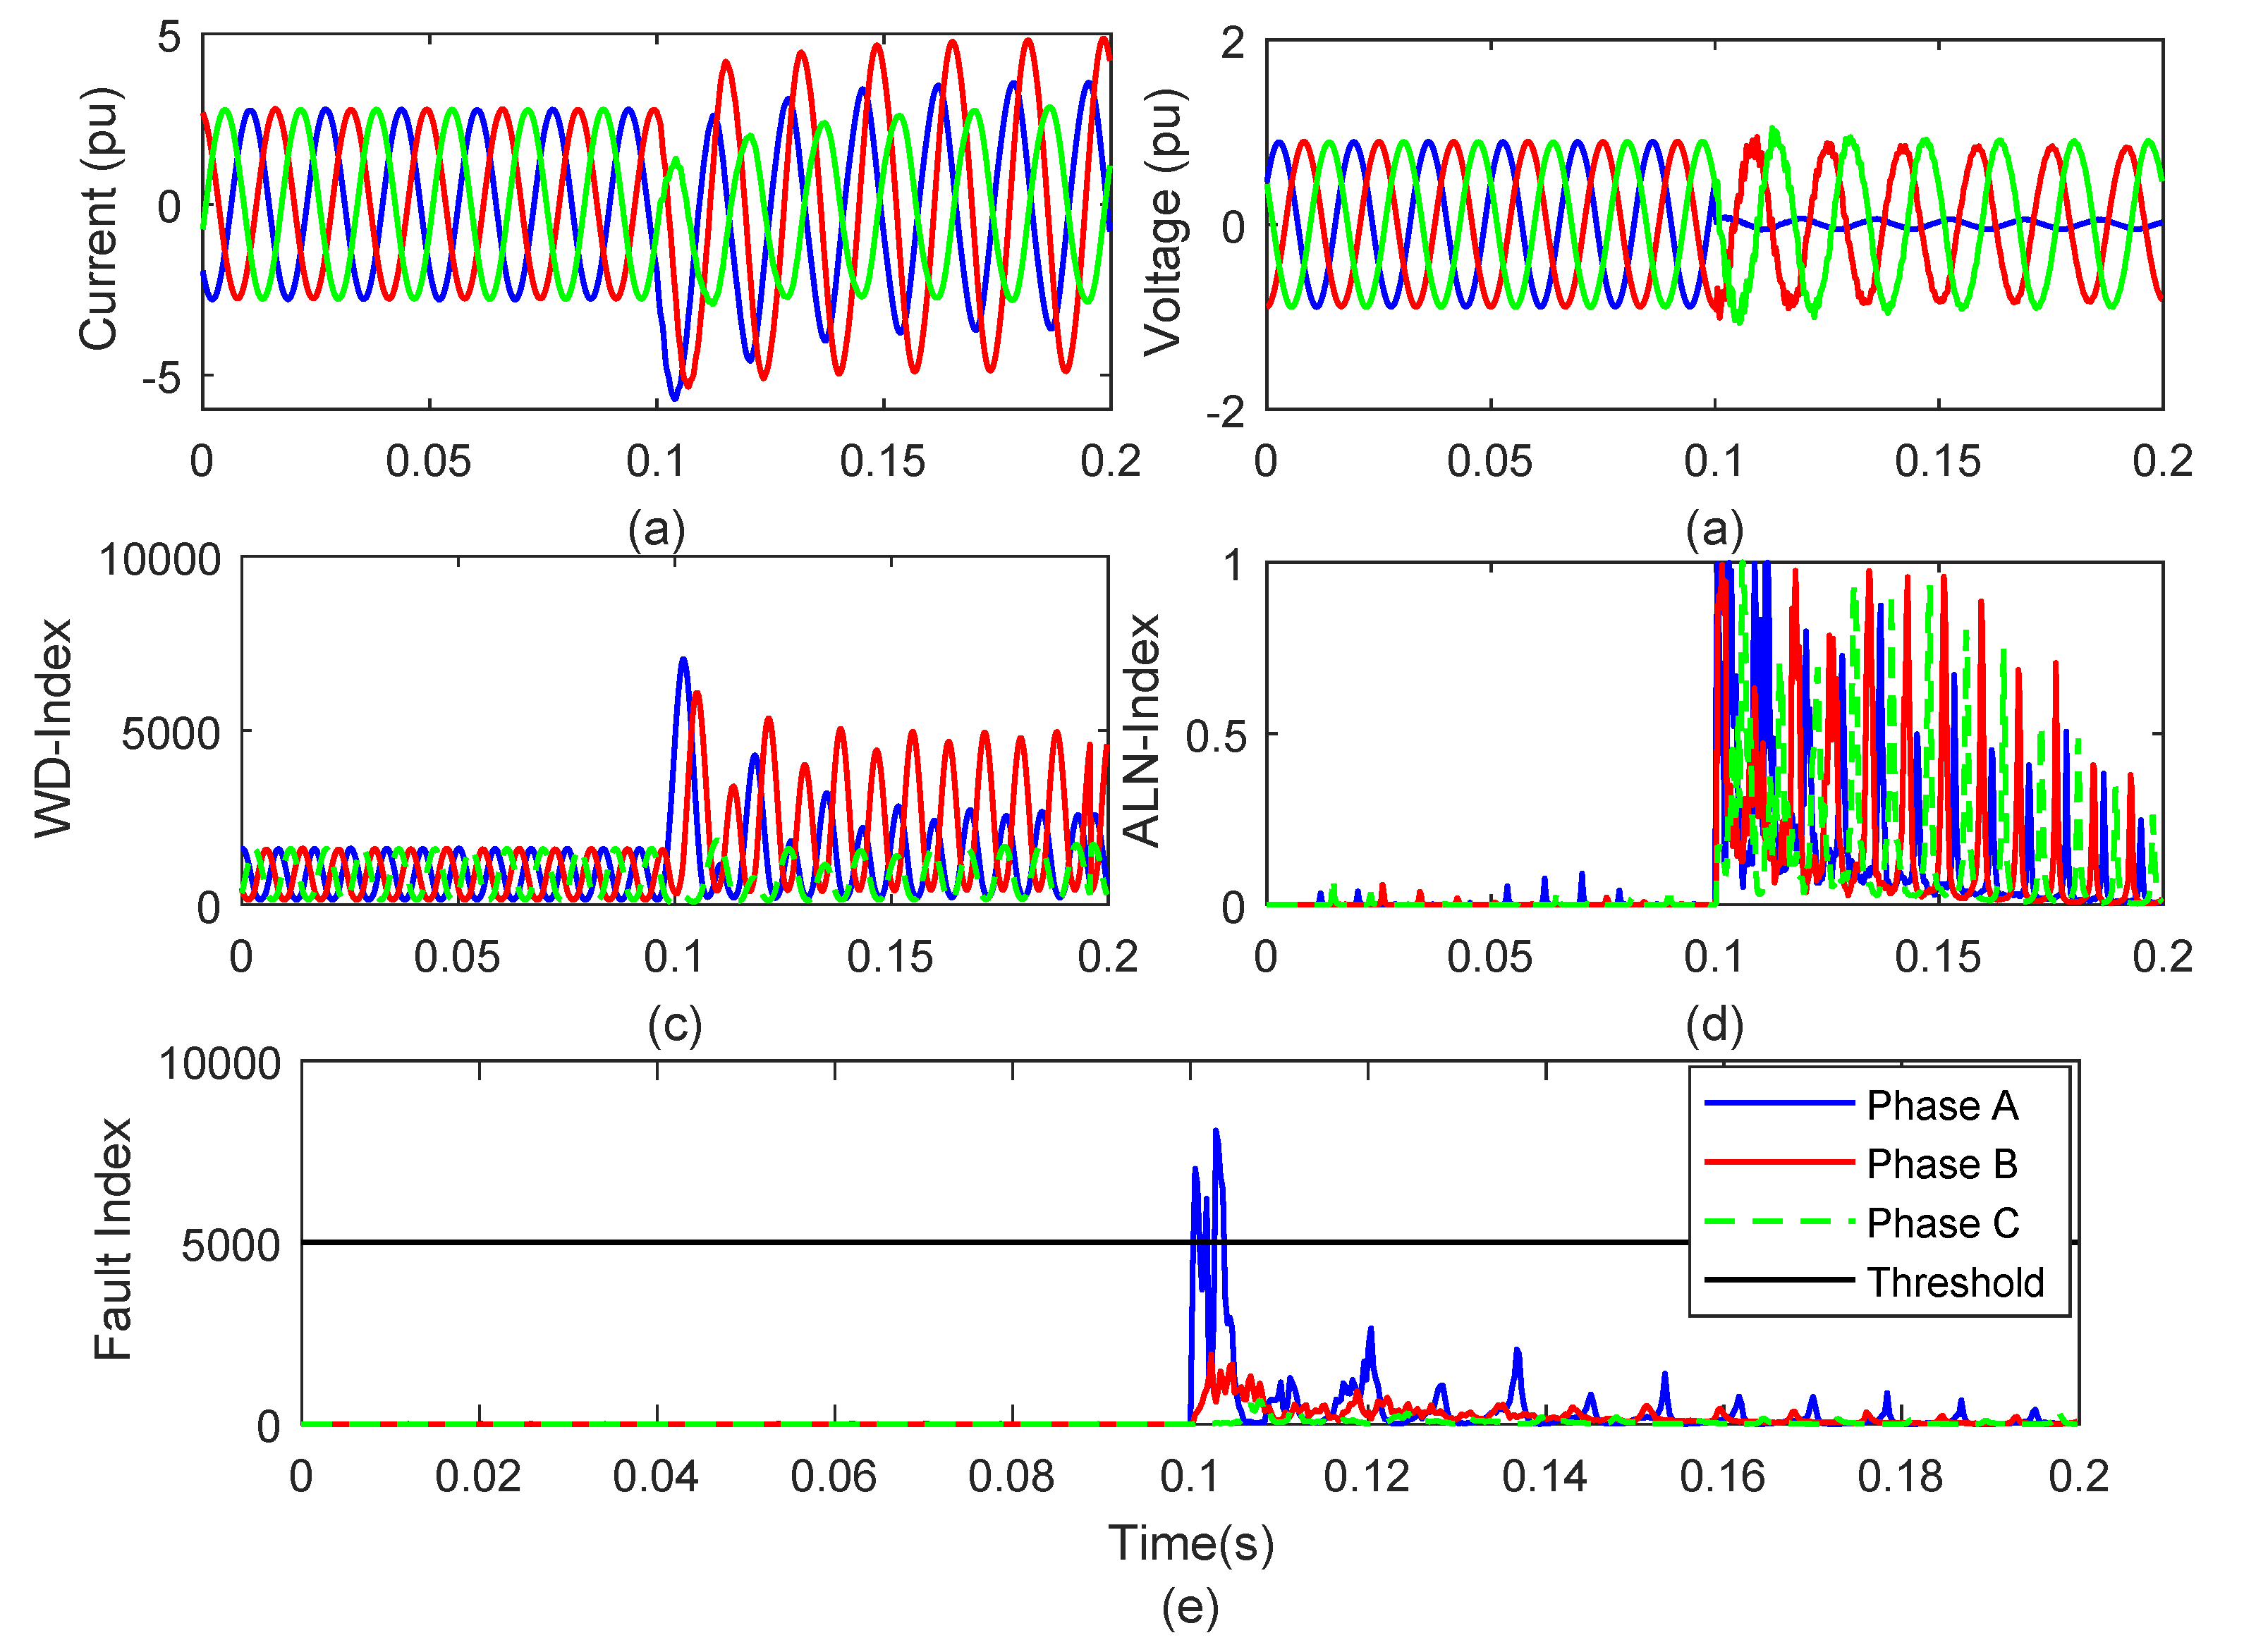
4.2. Phase to Ground Fault

The phase to ground (PG) fault is simulated on phase A at 0.1 s at node 646. Current and voltage signals captured at node 650 for the period of 0.2 s (12 cycles) are detailed in Figure 5a,b, respectively. Current signals are processed using Wigner distribution function (WDF) and WD-index is computed, which is described in Figure 5c. It is observed that WD-index corresponding to phase A has a high magnitude after incidence of PG fault. However, this index, corresponding to phases B and C, has values comparable to the pre-fault values. The ALN-index is computed from the voltage signals and described in Figure 5d. It is concluded that the ALN-index corresponding to all phases sharply increases just after the incidence of PG fault.
Figure 5e describes the FI corresponding to all the phases during the event of PG fault. It can be inferred that FI corresponding to the faulty phase (phase A) has a higher magnitude compared to TM after the incidence of PG fault. However, this FI corresponding to healthy phases (phases B and C) has a lower magnitude compared to TM. Hence, the algorithm is found to be effective for the identification of PG fault, discriminating the healthy and faulty phases. High resolution of FI is illustrated in Figure 5f. It is observed that FI corresponding to phase A rises and crosses the TM after 6 × 10 4 s, whereas the FI corresponding to healthy phases B and C remains below the threshold. Hence, the PG fault was detected effectively in time duration, equal to 3.6% of the total time of the cycle.

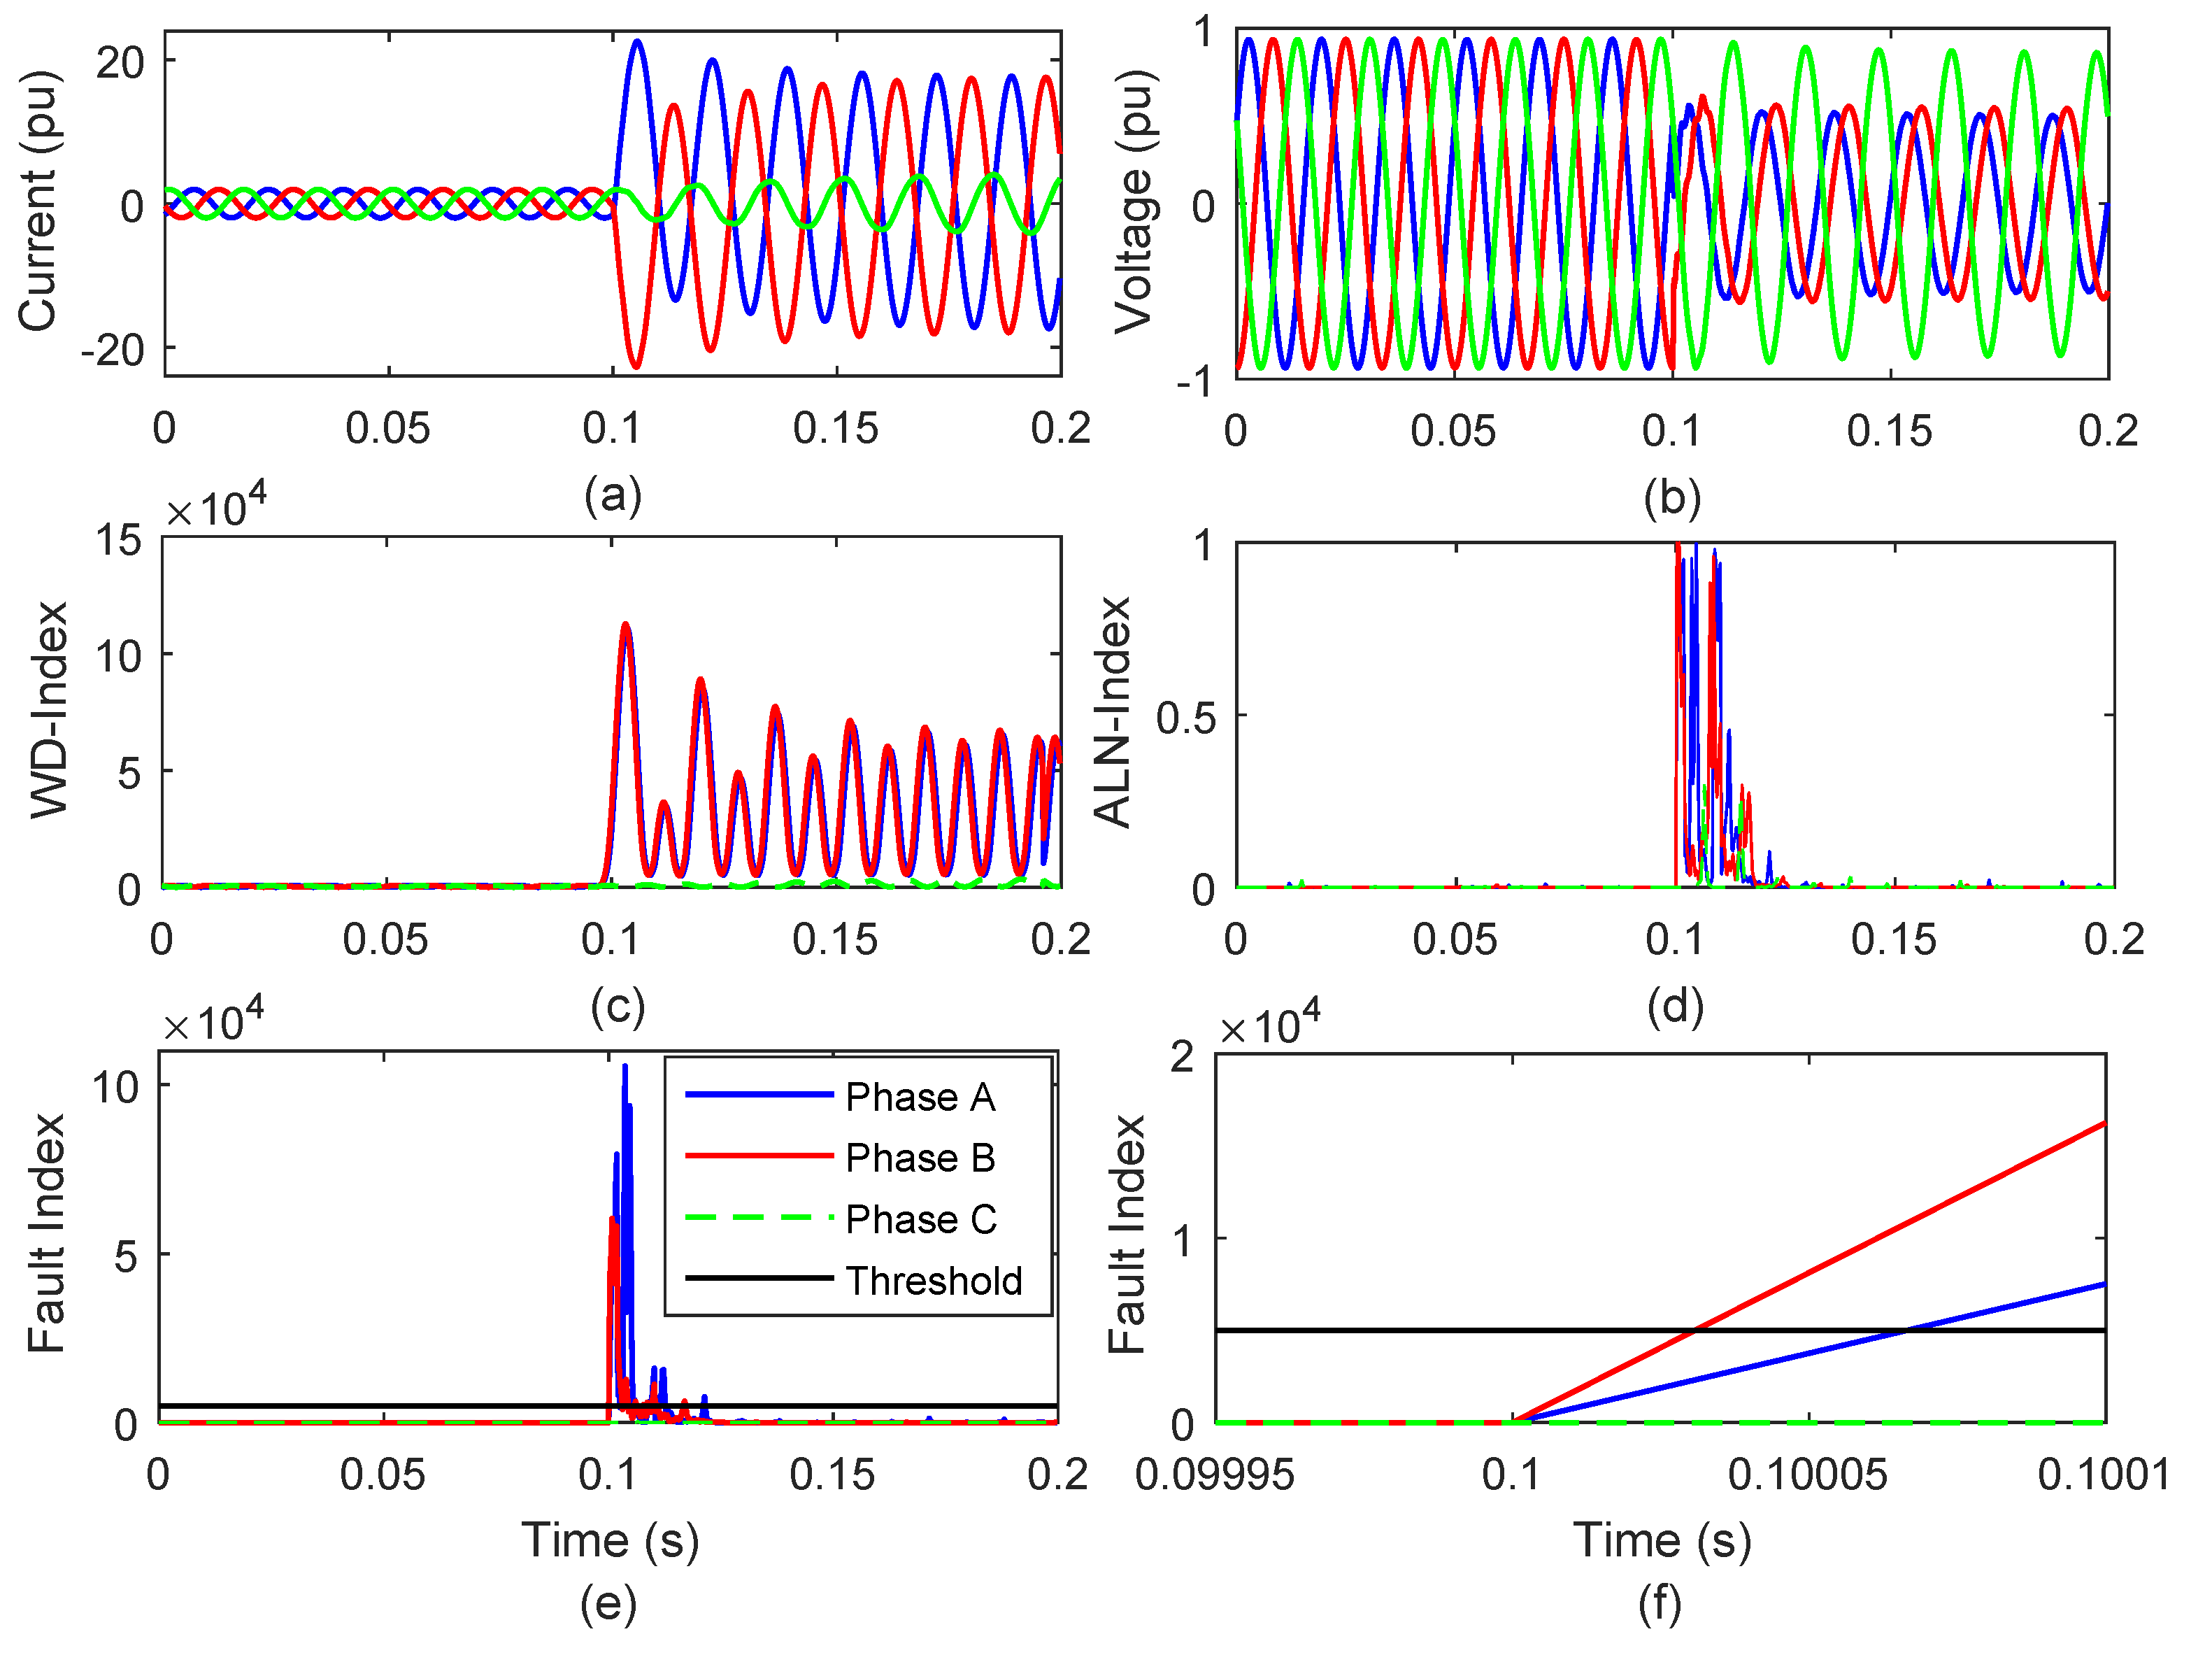
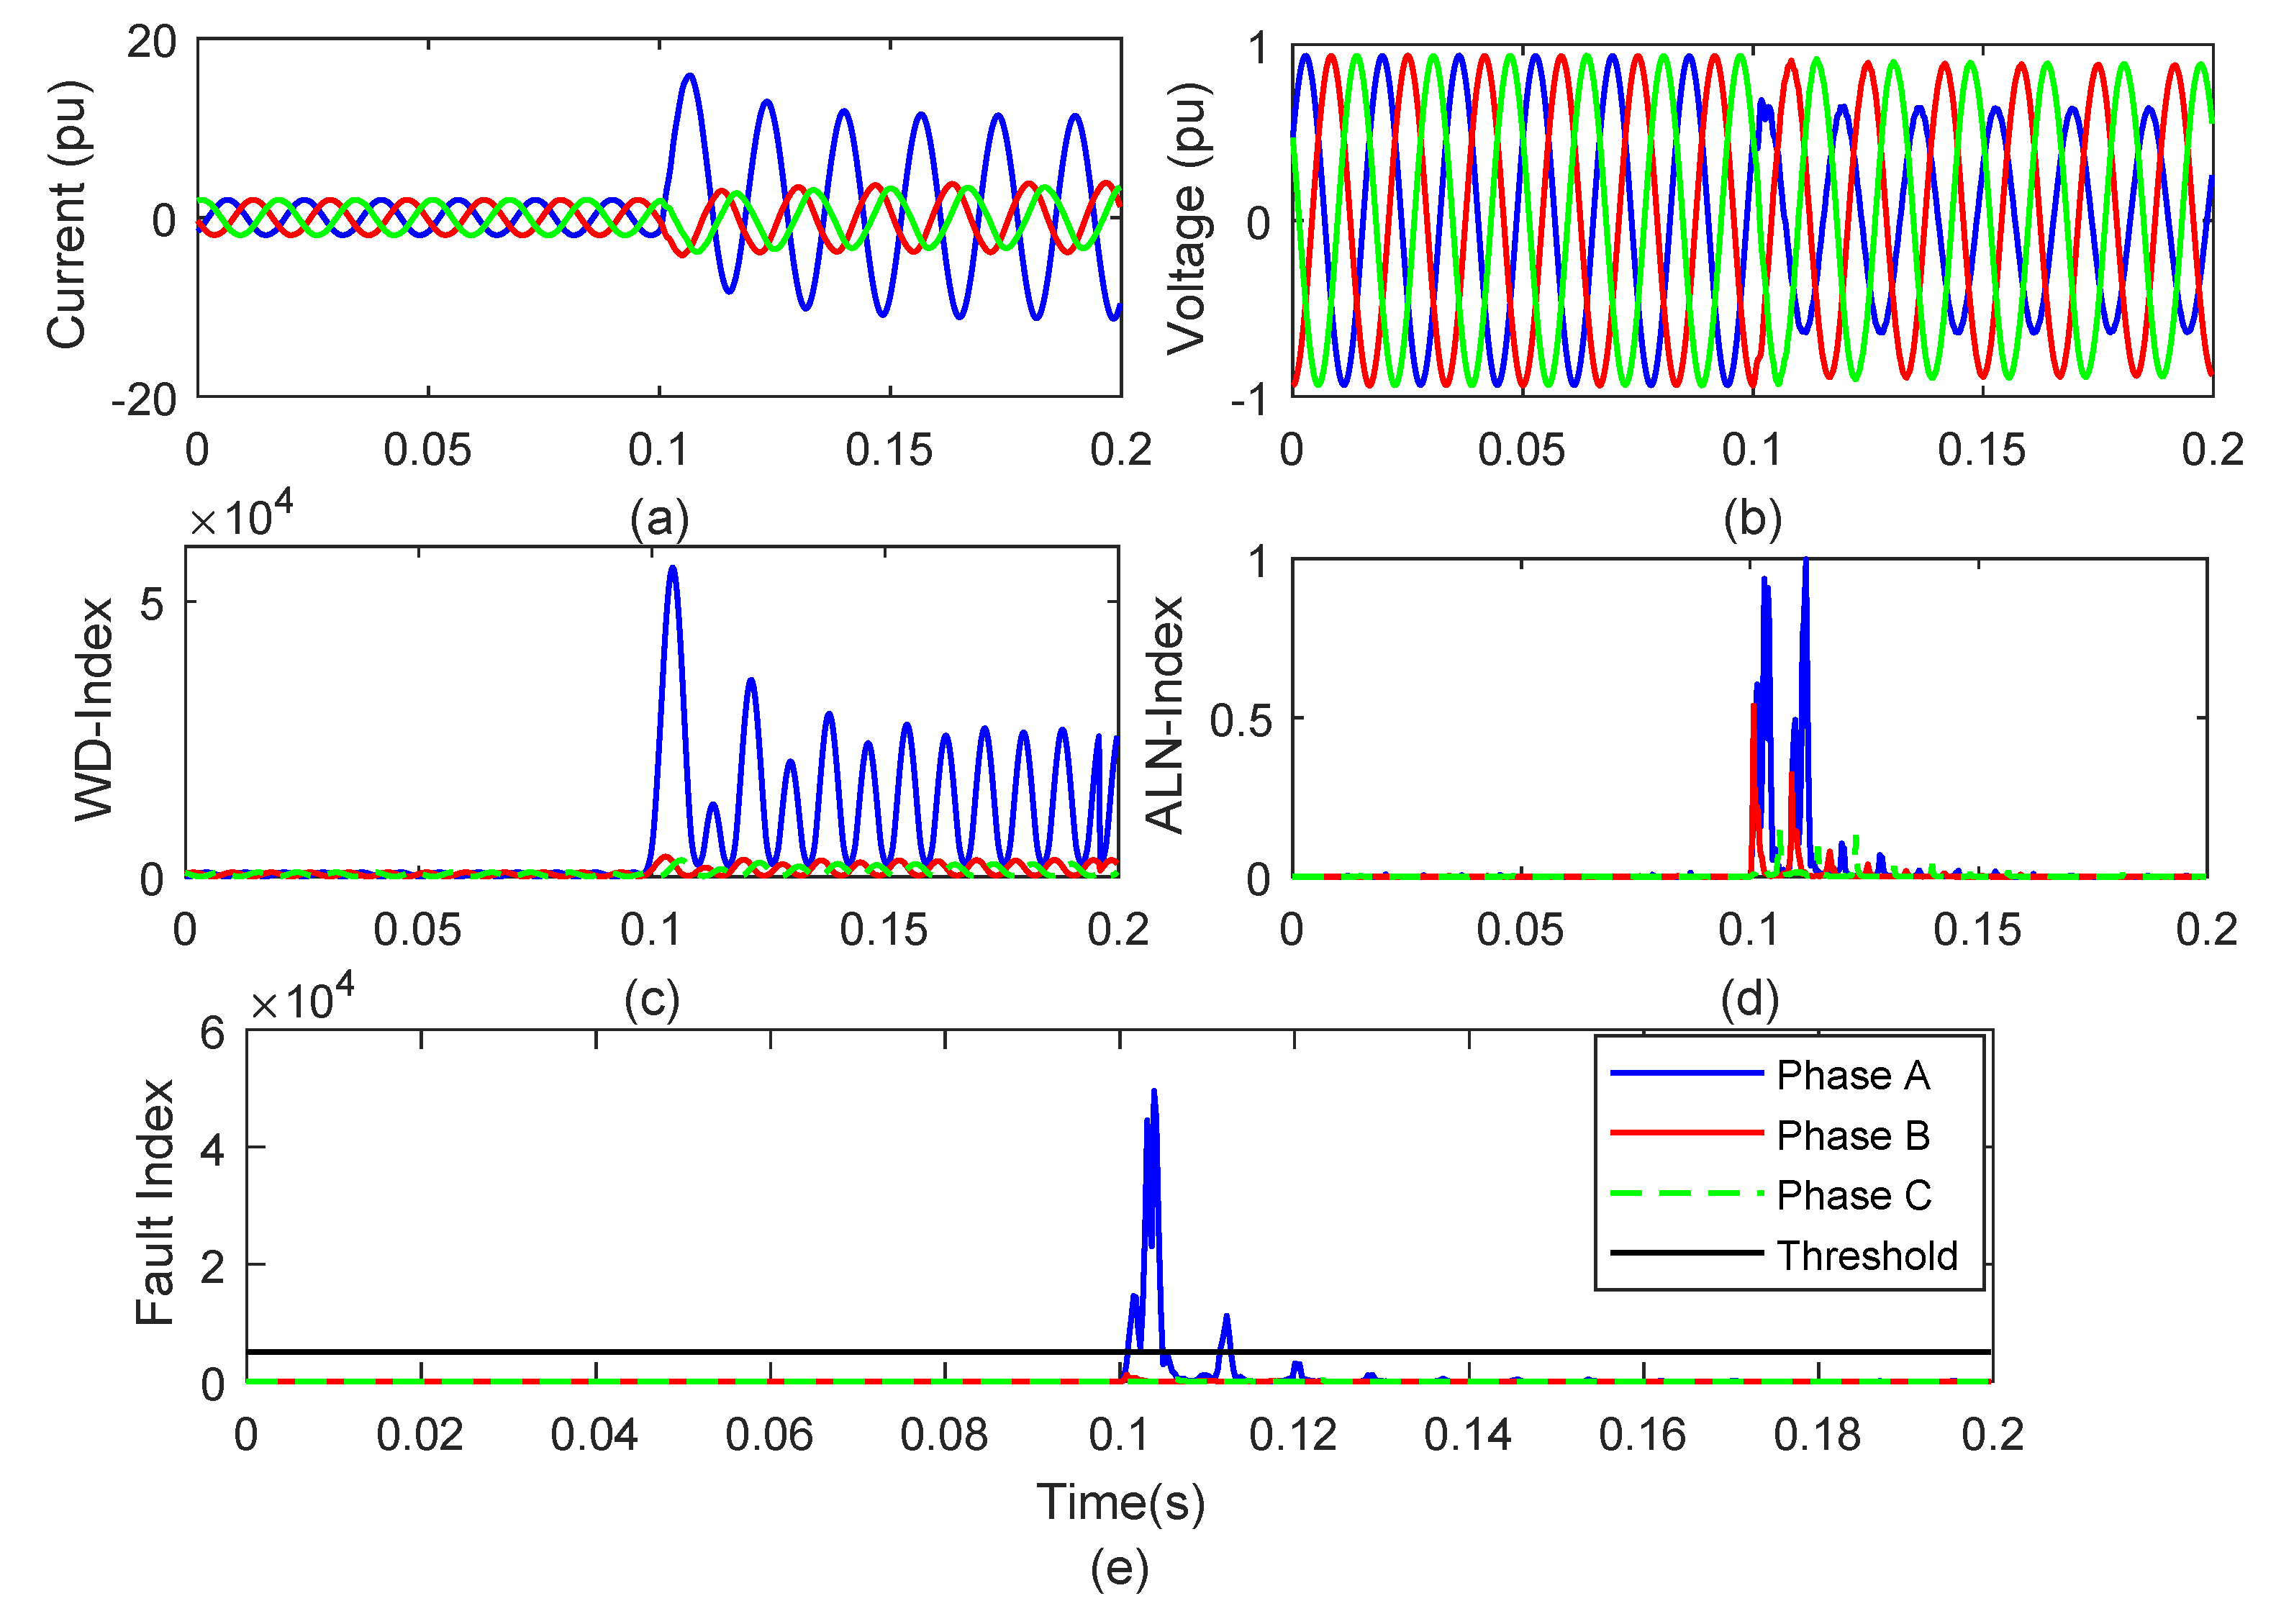
4.3. Double Phase Fault

The double phase (2P) fault is simulated on phases A and B at 0.1 s at node 646. Current and voltage signals recorded at node 650 for the period of 0.2 s (12 cycles) are illustrated in Figure 6a,b respectively. Current signals are processed using WDF and WD-index is computed which is detailed in Figure 6c. It is observed that WD-index corresponding to phases A and B has a high magnitude after incidence of 2P fault. However, this index corresponding to the phase C has values comparable to the pre-fault values. The ALN-index is computed from the voltage signals and detailed in Figure 6d. It is inferred that ALN-index corresponding to all the phases sharply increases just after the incidence of 2P fault.
Figure 6e details the FI corresponding to all phases during the event of 2P fault. It is seen that FI corresponding to faulty phases (phases A and B) has a higher magnitude compared to TM, after the incidence of 2P fault. However, FI corresponding to healthy phase (phase C) has a lower magnitude as compared to TM. Hence, the algorithm is found to be effective for the identification of 2P fault and the discrimination of healthy and faulty phases. High resolution of FI is illustrated in Figure 6f. It is observed that FI corresponding to phases A and B rises and cross the TM after 7 × 10 5 s and 4 × 10 5 s, respectively, which are equal to 0.42% and 0.24% of the total time of a cycle in the same order. FI corresponding to healthy phase C remains below the threshold. Hence, the 2P fault was detected effectively in time duration equal to 0.42% of the total time of a cycle.

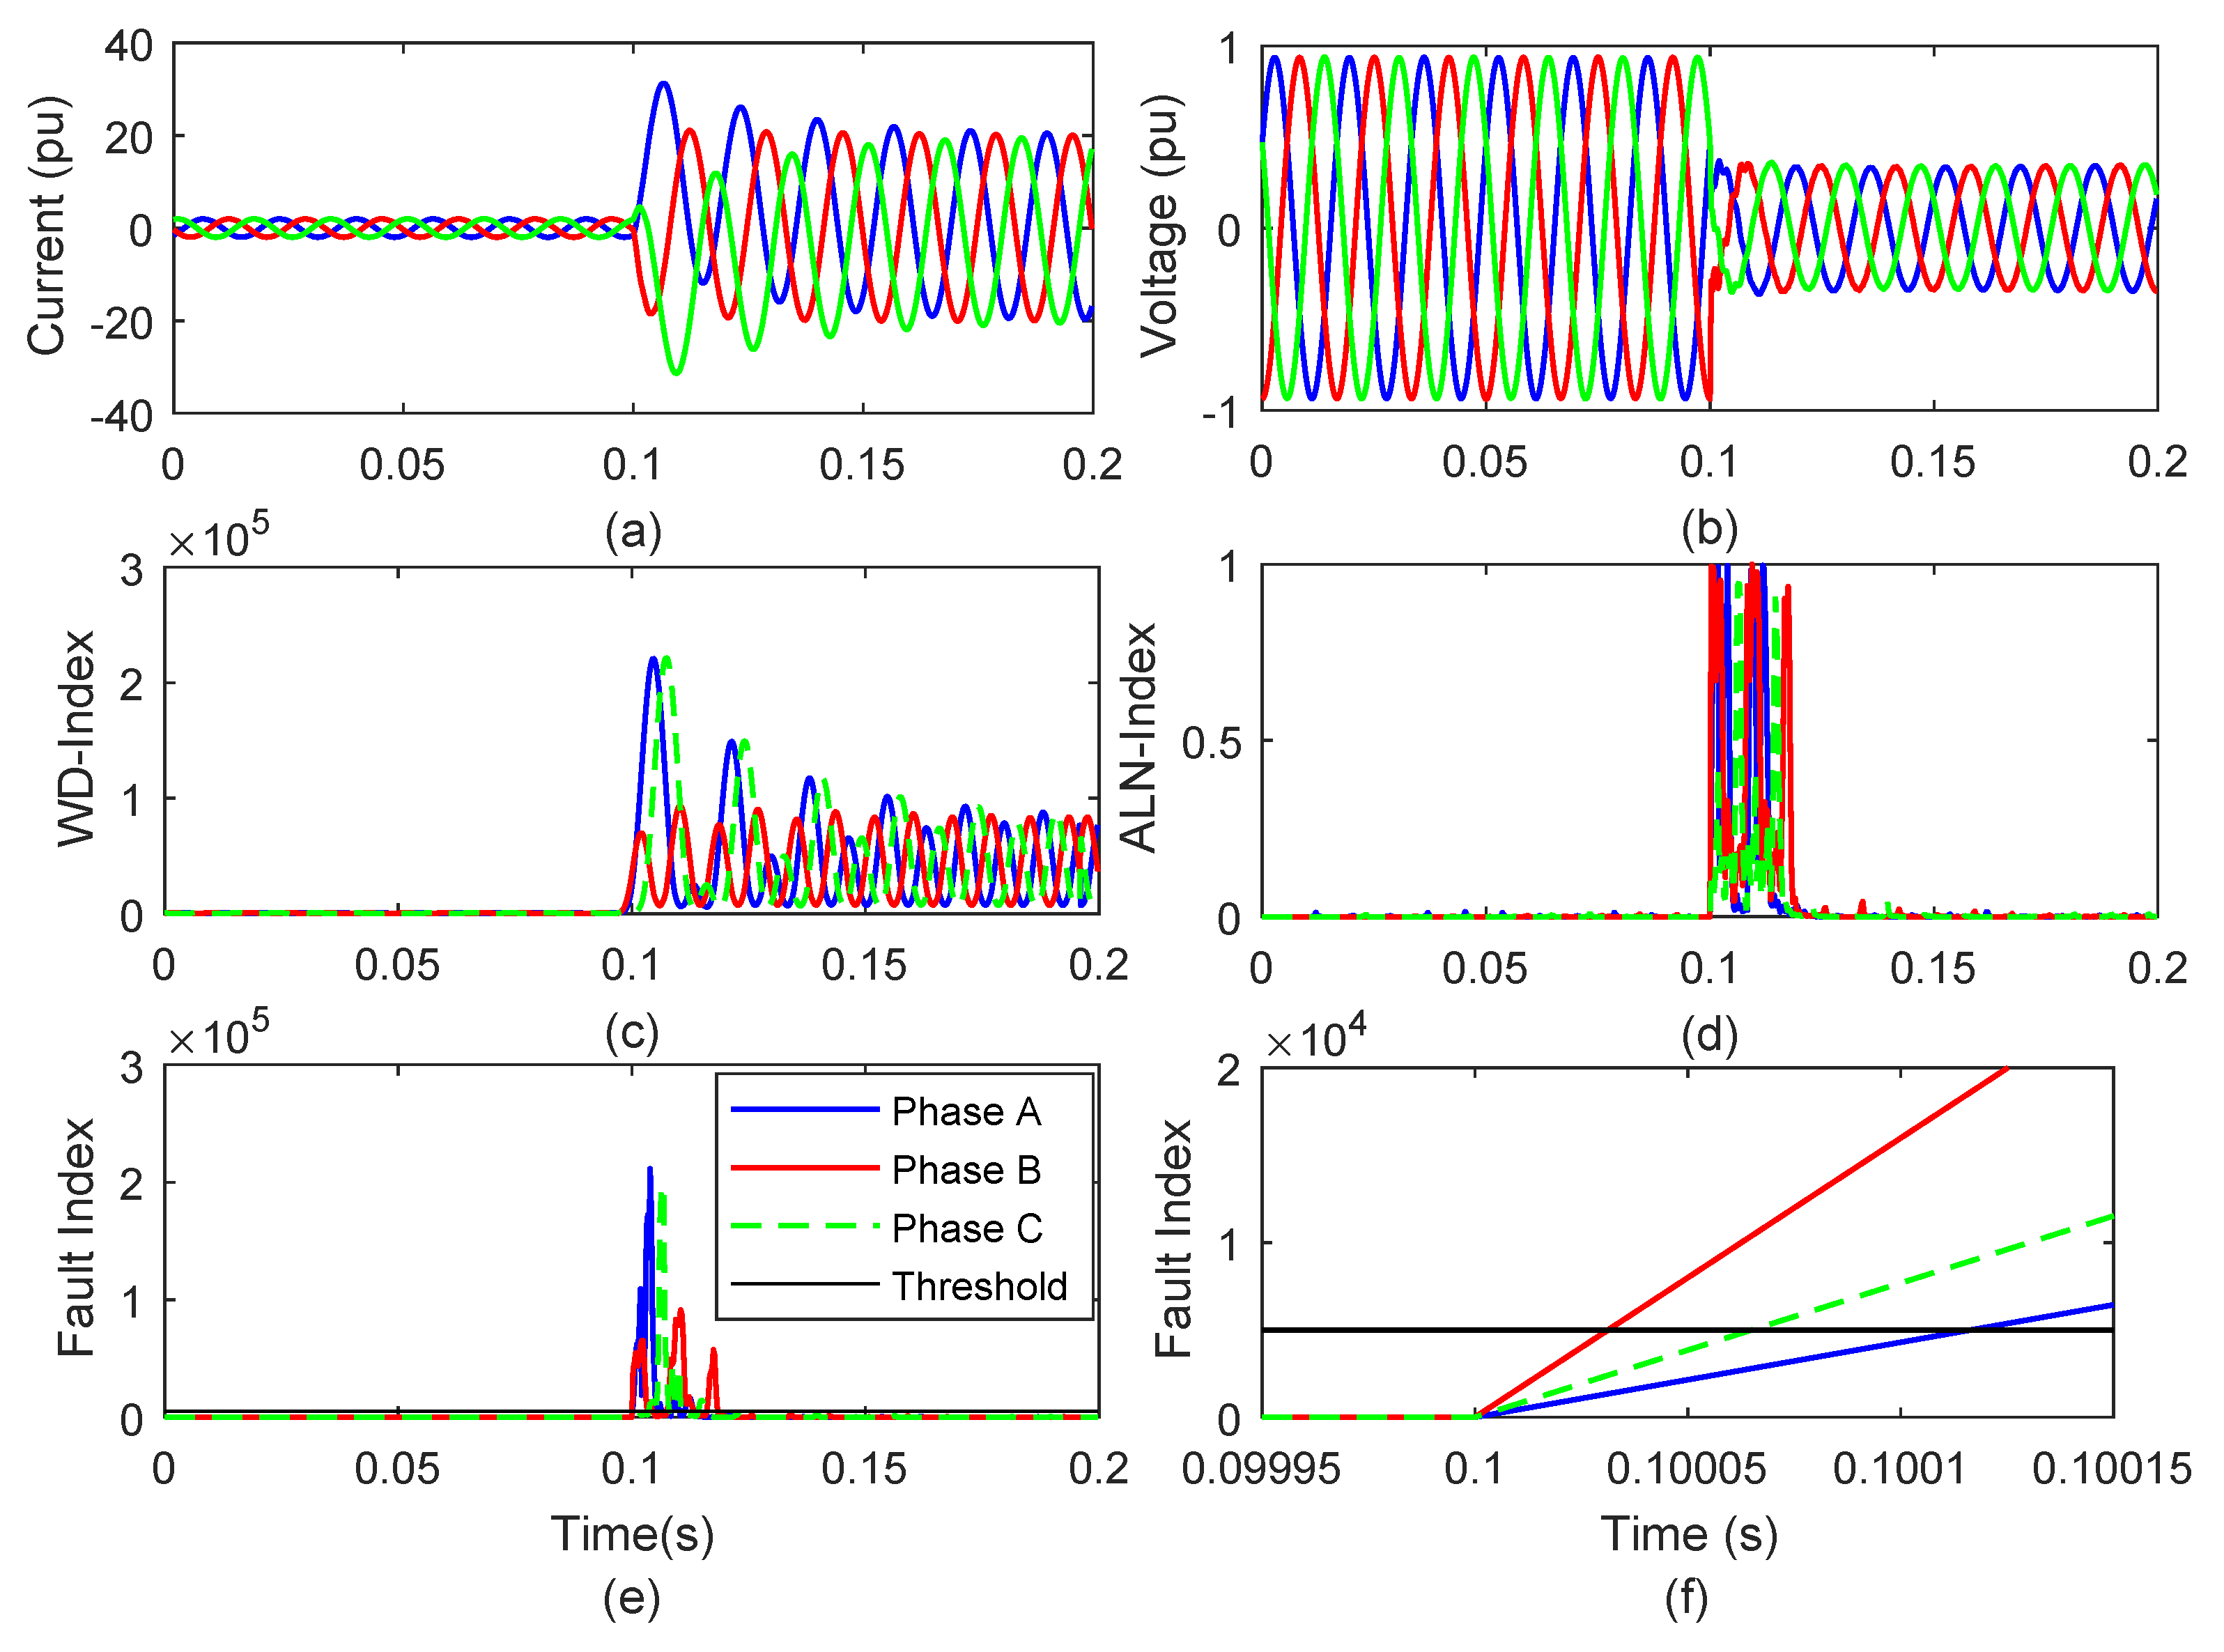
4.4. Double Phase to Ground Fault

The double phase to ground (2PG) fault is simulated on phases A and B at 0.1 s at node 646.Current and voltage signals recorded at node 650 for the period of 0.2 s (12 cycles) are described in Figure 7a and Figure 7b, respectively. Current signals are processed using WDF and WD-index is computed, which is detailed in Figure 7c. This is observed that WD-index corresponding to phases A and B has a high magnitude after incidence of 2PG fault. However, this index corresponding to the phase C has values comparable to the pre-fault values. The ALN-index is computed from the voltage signals and detailed in Figure 7d. This is inferred that ALN-index corresponding to all the phases, sharply increases just after incidence of 2PG fault.
Figure 7e details the FI corresponding to all the phases, during the event of 2PG fault. It is seen that FI corresponding to faulty phases (phases A and B) has a higher magnitude compared to TM after the incidence of 2PG fault. However, FI corresponding to the healthy phase (phase C) has a lower magnitude as compared to TM. Hence, the algorithm is found to be effective for the identification of 2PG fault and for the discrimination of the healthy and faulty phases. High resolution of FI is illustrated in Figure 7f. It is observed that FI corresponding to phases A and B rises and cross the TM after 8 × 10 5 s and 3 × 10 5 s, respectively, which are equal to 0.48% and 0.18% of total time of the cycle in same order. FI corresponding to the healthy phase C remains below the threshold. Hence, the 2PG fault was detected effectively in time equal to 0.48% of the total time duration of the cycle.

4.5. Three Phase to Ground Fault

The three phase to ground (3PG) fault is simulated at 0.1 s at node 646. Current and voltage signals recorded at node 650 for the period of 0.2 s (12 cycles) are described in Figure 8a,b, respectively. Current signals are processed using Wigner distribution function (WDF) and WD-index is computed which is detailed in Figure 8c. It is observed that WD-index corresponding to all phases has a high magnitude after the incidence of 3PG fault. The ALN-index is computed from the voltage signals and detailed in Figure 8d. It is concluded that ALN-index corresponding to all phases sharply increases just after incidence of 3PG fault.
Figure 8e details the FI corresponding to all the phases during the event of 3PG fault. It is seen that FI corresponding to all the phases has a higher magnitude compared to TM after the incidence of 3PG fault, which indicates that all the phases are faulty in nature. Hence, the algorithm is found to be effective for the identification of 3PG fault. High resolution of FI is illustrated in Figure 8f. This is observed that FI corresponding to phases A, B, and C rises and cross the TM after 1.7 × 10 4 s, 3 × 10 5 s and 7 × 10 5 s, respectively, which are equal to 1.02%, 0.18% and 0.42% of the total time of a cycle in same order. Hence, the 3PG fault was detected effectively in a time duration equal to 1.02% of the total time of a cycle.
Therefore, it is established that all types of faults including PG, 2P, 2PG, and 3PG in the network of the hybrid grid incorporated with RE were identified effectively by using proposed algorithm, within time duration of ( 1 / 10 ) th of a cycle.

5. Fault Classification

Type of fault incident on the hybrid power grid in the presence of RE generation were identified using the algorithm illustrated in Figure 3. The PG fault and 3PG fault were identified based on the number of faulty phases, which are 1 and 3, respectively for the PG and 3PG faults. 2P and 2PG faults are included in the same group using the number of faulty phases, identified based on the proposed FI. These faults were classified using the proposed ground fault index as detailed in Figure 9. It is observed that the magnitude of GFI is higher compared to the TMGFI (2000) for the 2PG fault event. However, during the event of 2P fault, the GFI has values lower than the TMGFI. Hence, all the faults were identified effectively using the proposed algorithm.

6. Implementation of the Algorithm to Recognize Faulty Events with Various Scenarios: Case Studies
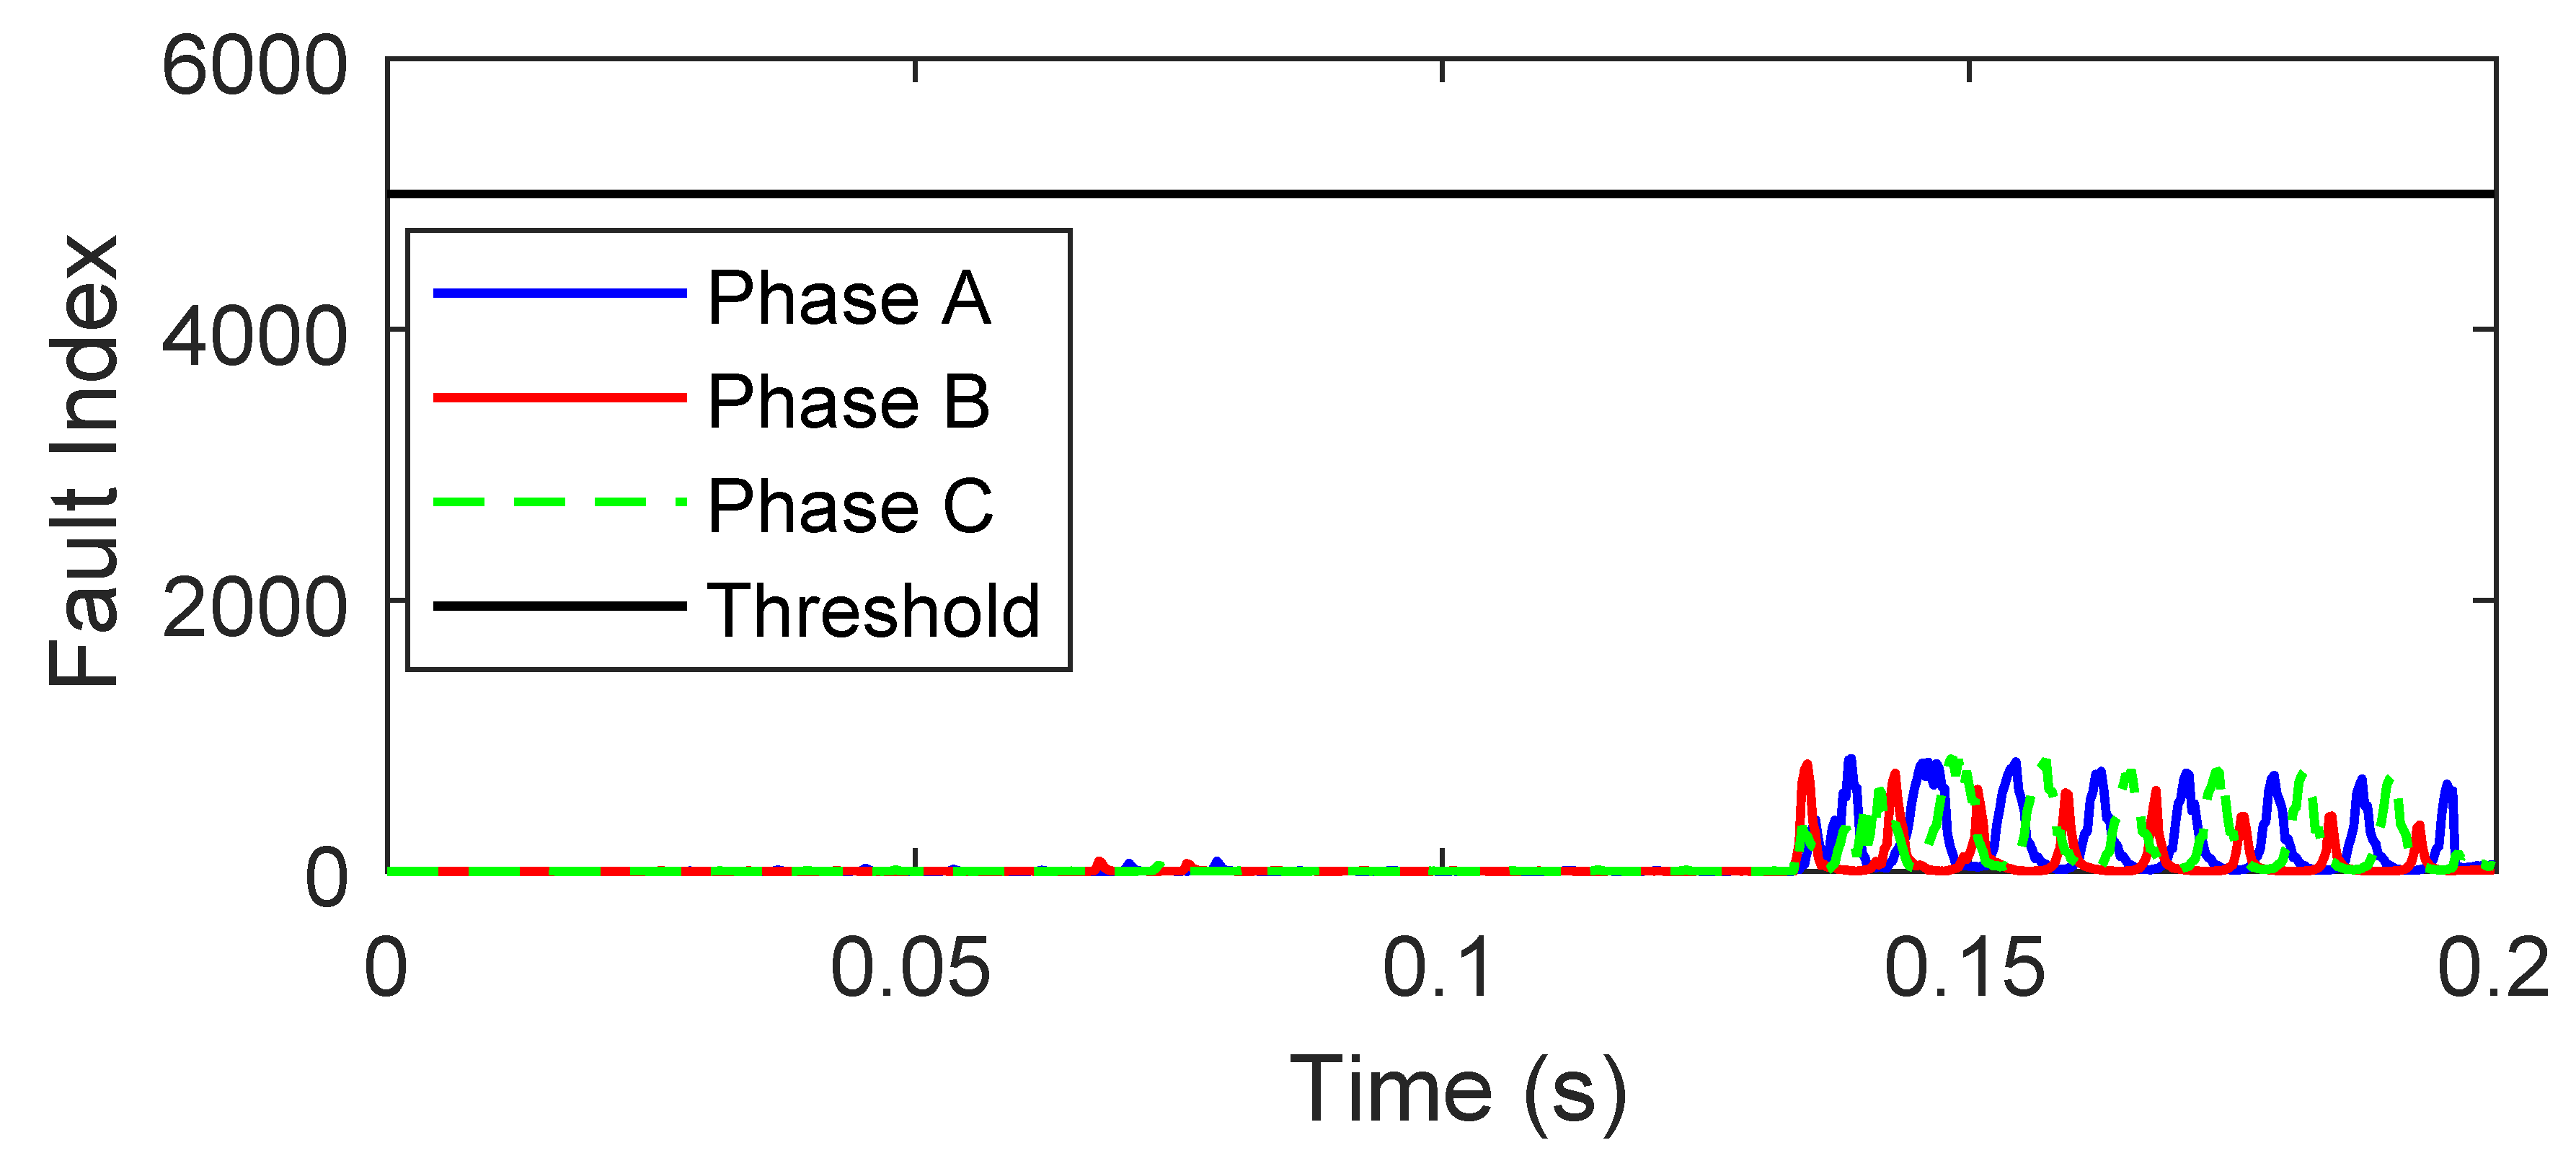
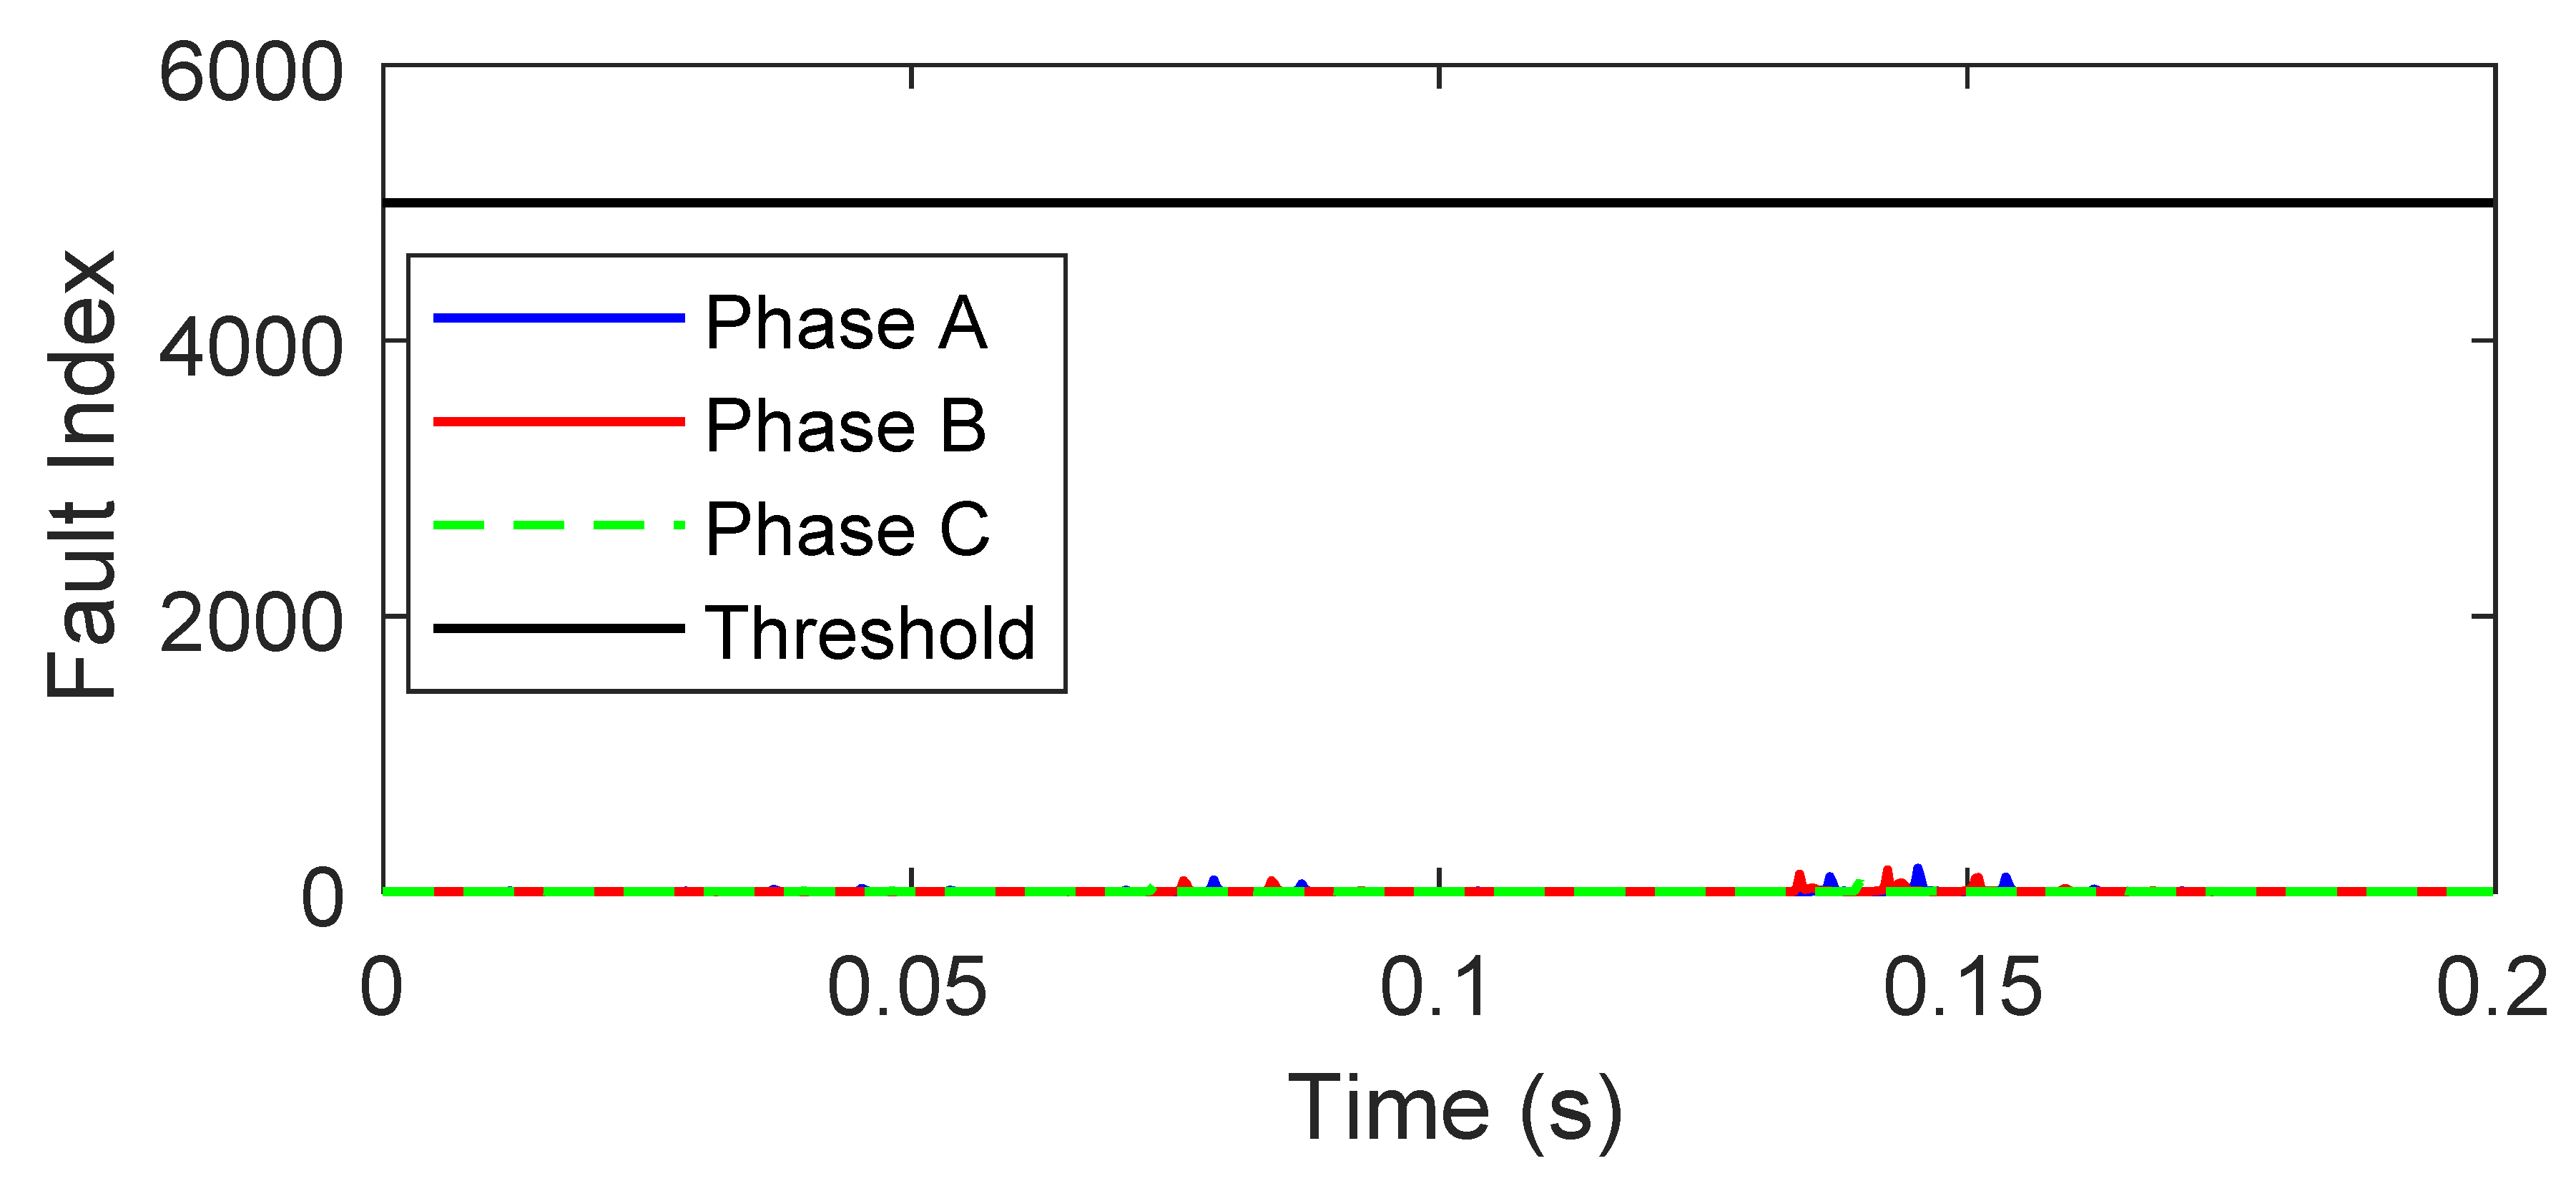
To generalize the implementation of proposed protection scheme to provide effective protections for hybrid grid with RE penetration, algorithm was tested for recognition of the faults during various scenarios such as fault location at different nodes of the hybrid grid, variations in fault impedance, variations in fault incidence angle, effect of noise, effect of change in sampling frequency, effect of transformers and effect of hybrid line with underground (UG) cable and overhead (OH) line sections. The algorithm was also tested for identification of the faulty events by measuring voltage and current signals at PCC. Detailed results for recognition of the PG fault during above mentioned scenarios are discussed in following sections. The algorithm is equally applicable for all fault types.

6.1. Fault Location

Incidence of fault on a particular node/line of the hybrid grid affects the nature of faulty transients, which ultimately affects the performance of fault recognition algorithm. To investigate this effect, the algorithm was tested for the faults, simulated at various critical locations of the hybrid grid. FI corresponding to all the phases during the PG fault event at various nodes of hybrid grid are tabulated in Table 4.
It can be observed from Table 4 that the FI corresponding to the faulty phase A is higher compared to TM at all locations. However, healthy phases B and C have lower FI compared to TM. Hence, PG faulty is effectively recognized at all nodes of the test hybrid grid with RE penetration. Detailed discussion of PG fault at node 652 and 634 is presented in following subsections.

6.1.1. Fault on Node 652

The algorithm was tested for all the faulty events simulated at node 652 and found to be effective for the recognition of these events. Position of this node is critical because there is hybrid combination of line between this node and node 650 (where current and voltage are recorded), which consists of UG cable and OH line sections. At the junction of UG cable and OH line, reflection of the faulty transient, carrying travelling wave may take place, which might affect the performance of algorithm. Results of PG fault simulated on phase A at 0.1 s on node 652 are included in Figure 10. Current and voltage signals captured on node 650 for a period of 0.2 s (12 cycles) are detailed in Figure 10a,b, respectively. Current signals are processed using WDF and WD-index is computed, which is described in Figure 10c. It is observed that WD-index corresponding to phase A has a high magnitude after the incidence of PG fault. However, this index corresponding to the phases B and C has values comparable to the pre-fault values. The ALN-index is computed from the voltage signals and described in Figure 10d. It is concluded that the ALN-index corresponding to all phases sharply increases just after the incidence of PG fault.
Figure 5e describes the FI corresponding to all the phases during the event of PG fault. It can be inferred that FI corresponding to faulty phase (phase A) has a higher magnitude compared to TM after the incidence of PG fault. However, FI corresponding to healthy phases B and C has a lower magnitude compared to TM. Hence, it is established that algorithm is effective for the identification of PG fault and discrimination of the healthy and faulty phases even when there is hybrid combination of UG cable and OH line sections.

6.1.2. Fault on Node 634

The algorithm was tested for all the faulty events simulated on node 634 and found to be effective for the recognition of these events. This node is considered due to the availability of a transformer (TRFF) between nodes 633 and 634. Presence of transformer in the path of travelling wave carrying faulty transients may affect the performance of algorithm as transformer is a magnetically coupled inductive element. Node 634 is operated at voltage of 0.48 kV and node 633 is operated at the voltage of 4.16 kV. Results for PG fault simulated on phase A at 0.1 s on node 634 are illustrated in Figure 11. Current and voltage signals captured at node 650 for a period of 0.2 s (12 cycles) are detailed in Figure 11a,b, respectively. Current signals are processed using WDF and WD-index is computed, which is described in Figure 11c. It is observed that WD-index corresponding to phase A has a high magnitude after the incidence of PG fault. However, this index corresponding to phases B and C has values comparable to the pre-fault values. The ALN-index is computed from the voltage signals and described in Figure 11d. It is concluded that the ALN-index corresponding to all phases sharply increases just after the incidence of PG fault.
Figure 11e details the FI corresponding to all the phases during the event of PG fault. It can be inferred that FI corresponding to faulty phase (phase A) has a higher magnitude compared to TM after incidence of PG fault. However, FI corresponding to healthy phases B and C has a lower magnitude as compared to TM. Hence, it is established that algorithm is effective for the identification of PG fault and discrimination of the healthy and faulty phases even when there is a transformer between the faulty point and relay location.

6.2. Fault Impedance Variations

The nature of fault transients is affected by the fault impedance. Hence, fault impedance might affect the performance of the protection algorithm. In common faulty events, the fault impedance ranges from 0 Ω to 5 Ω . Therefore, the algorithm was tested for the fault impedances of 0 Ω , 5 Ω , 10 Ω , 15 Ω , 20 Ω and 25 Ω for all types of faults. FI magnitude associated with all the phases during the PG fault event incident at node 646 is tabulated in Table 5. It can be observed that FI magnitude is higher compared to TM (5000), corresponds to phase A. Further it is lower as compared to TM, corresponds to phases B and C. It is also observed that FI corresponding to faulty phase decreases with increased fault impedance. Therefore, it is established that PG fault will be effectively detected in hybrid grid with RE penetration and fault impedance up to 25 Ω . Furthermore, the algorithm also works efficiently for all types of faults with fault impedances up to 25 Ω .

6.3. Fault Incidence Angle Variations

Fault transients may also be affected by the fault incidence angle (FIA), which may result false tripping indication. Hence, performance of the algorithm was tested by simulating the fault at node 646 with incidence angles of 0 , 30 , 60 , 90 , 120 and 150 for all types of investigated faults. FI magnitude associated with all the phases during the PG fault event incident at node 646 for different angles is tabulated in Table 6. It can be observed that FI magnitude is higher compared to TM (5000), corresponds to phase A and lower compared to TM, corresponds to phases B and C for all types of fault incidence angles. It is also observed that FI corresponding to faulty phase is maximum for FIA of 90 . Therefore, it is established that PG fault will be effectively detected in hybrid grid with RE penetration and all types of fault incidence angle with respect to current and voltage waveforms. Furthermore, the algorithm also works efficiently for all types of faults for different FIA.

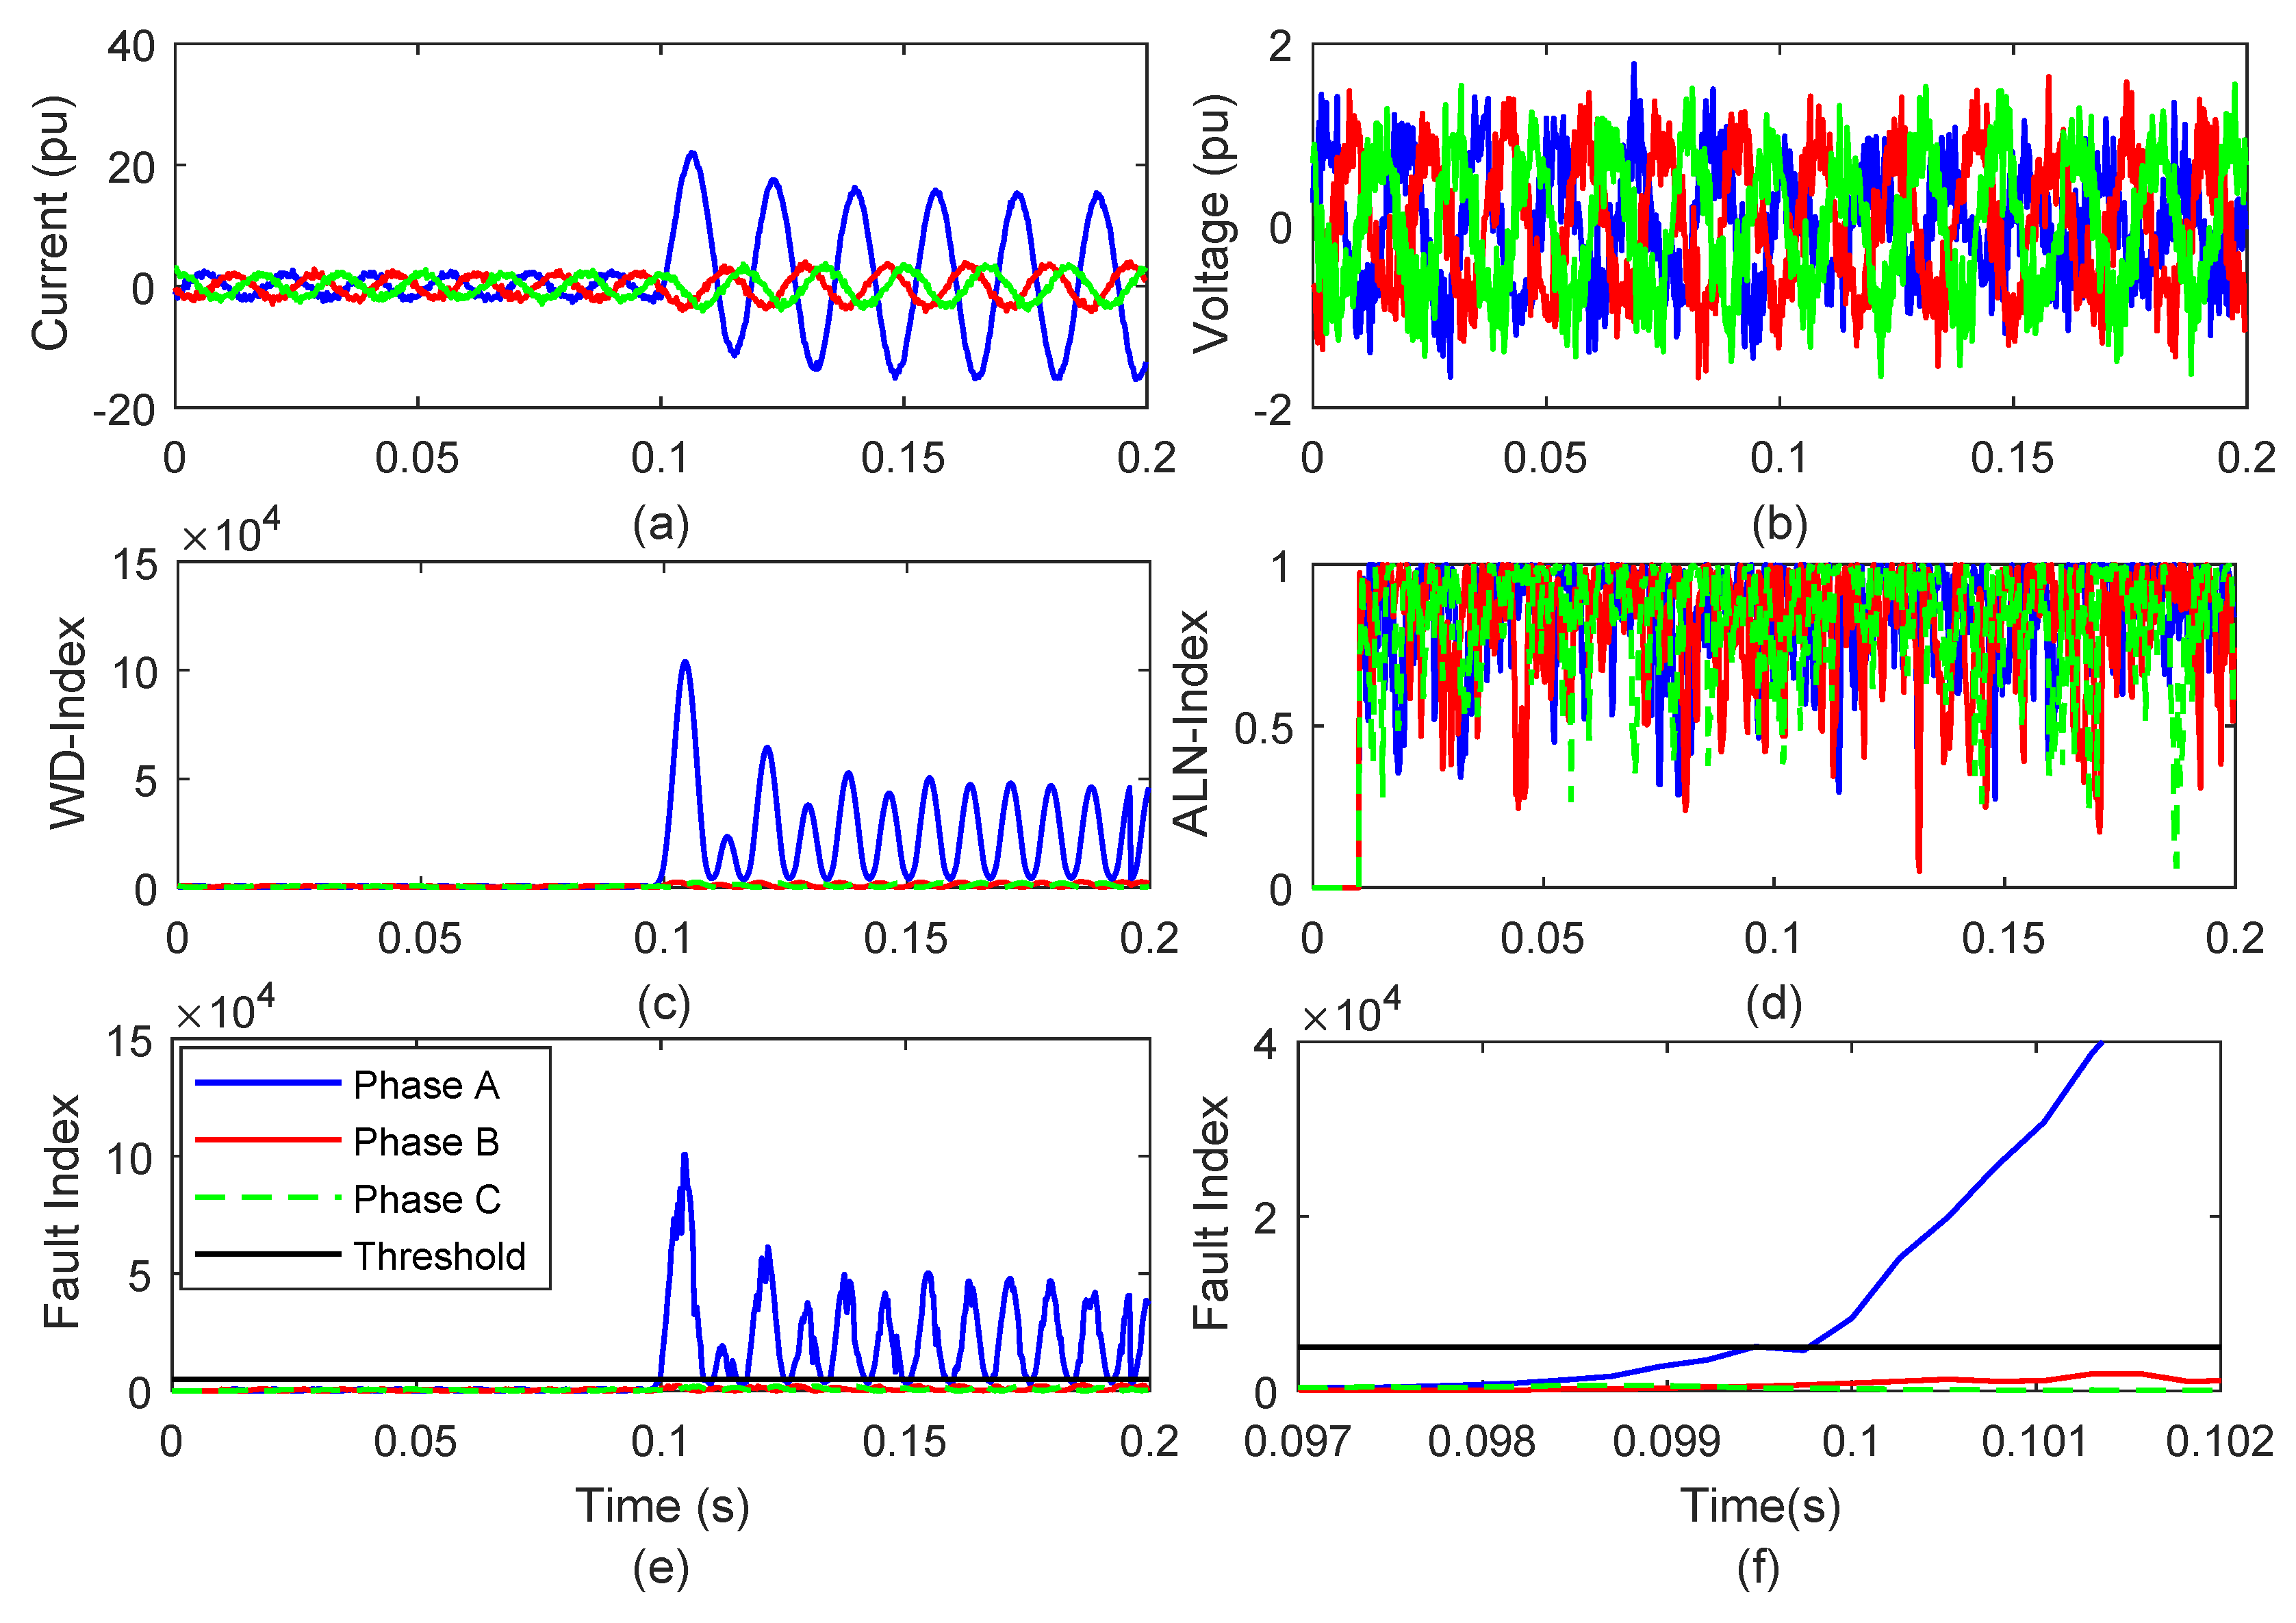
6.4. Effect of Noise

There is a possibility of interference from external factors on the power system distribution and transmission lines while passing through the terrain, which may superimpose noise on the faulty transients travelling from the faulty point to the location of PS. Noise may affect the performance of the protection schemes resulting in false tripping. To investigate the effect of noise on the performance of algorithm, a noise level of 10 dB signal to noise ratio (SNR) is introduced on both the voltage and current signals. The algorithm was tested for all types of faults whereas the results of PG fault simulated on phase A at 0.1 s on node 646 are illustrated in Figure 12, where superimposed noise can be seen easily. Current and voltage signals captured at node 650 for a period of 0.2 s (12 cycles) are detailed in Figure 12a,b, respectively. Current signals are processed using WDF and WD-index is computed, which is described in Figure 12c. It is observed that the WD-index corresponding to phase A has a higher magnitude after the incidence of PG fault. However, this index corresponding to the phases B and C has values comparable to the pre-fault values. Performance of the WD-index is not affected by noise. The ALN-index is computed from the voltage signals and described in Figure 12d. It is concluded that the ALN-index corresponding to all the phases has a high magnitude throughout time range, indicating that performance of ALN-index will be affected by the noise.
Figure 12 details the FI corresponding to all the phases during the event of PG fault with superimposed noise on both voltage and current signals. It can be inferred that FI corresponding to the faulty phase (phase A) has a higher magnitude compared to TM after the incidence of PG fault. However, FI corresponding to healthy phases B and C has a lower magnitude as compared to TM. Hence, it is established that algorithm is effective for the identification of PG fault and discrimination of the healthy and faulty phases even when there is high level noise (10 dB SNR) superimposed on the current and voltage signals in the hybrid grid in the presence of RE generation. High resolution plot of FI is illustrated in Figure 12f, where it can be seen that FI corresponding to phase A crosses the TM and FI for phases B & C is below the TM.

6.5. Sampling Frequency Variations

To investigate the effect of frequency used for sampling the voltage and current signals on the performance of protection scheme, the algorithm was tested for different sampling frequencies. FI corresponding to the faulty phase A during the event of PG fault is observed and equal to 3.981 × 10 4 , 5.055 × 10 4 , and 5.170 × 10 4 while using the sampling frequencies of 1.92 kHz, 3.84 kHz and 7.68 kHz, respectively. Therefore, sampling frequency, lower than 3.84 kHz, reduces the peak magnitude of FI, which may also go lower compared to TM. Sampling frequency greater than 3.84 kHz increases the fault detection time due to large size of input data set. Hence, 3.84 kHz is observed to be the optimum SF for the protection scheme.

6.6. Recognition of Fault by Recording Voltage and Current Signals at PCC

Performance of the algorithm was tested by recording voltage and current signals at PCC (PS-2 relay location), where RE sources are integrated to test hybrid grid and when PG fault is simulated at node 646 to generalize the applicability of the algorithm. Results of the PG fault, simulated on phase A at 0.1s at node 646 with measurements at node 680 are illustrated in Figure 13. Current and voltage signals captured at node 680 for a period of 0.2 s (12 cycles) are detailed in Figure 13a,b, respectively. Current signals are processed using WDF and WD-index is computed, which is described in Figure 13c. It is observed that WD-index corresponding to phase A has a higher magnitude after the incidence of PG fault. However, this index corresponding to the phases B and C has values comparable to the pre-fault values. The ALN-index is computed from the voltage signals and described in Figure 13d. It is concluded that the ALN-index corresponding to all phases sharply increases just after the incidence of PG fault.
Figure 13e details the FI corresponding to all phases during the event of PG fault, when current and voltage signals are recorded at PCC. It can be concluded that FI corresponding to faulty phase (phase A) has a higher magnitude compared to TM after the incidence of PG fault. However, the FI corresponding to the healthy phases B and C has a lower magnitude as compared to TM. Hence, it is established that algorithm is effective for the identification of PG fault and discrimination of the healthy and faulty phases by recording the data at PCC. It establishes the applicability of algorithm to provide protection against faults for the RE sources based hybrid grids.

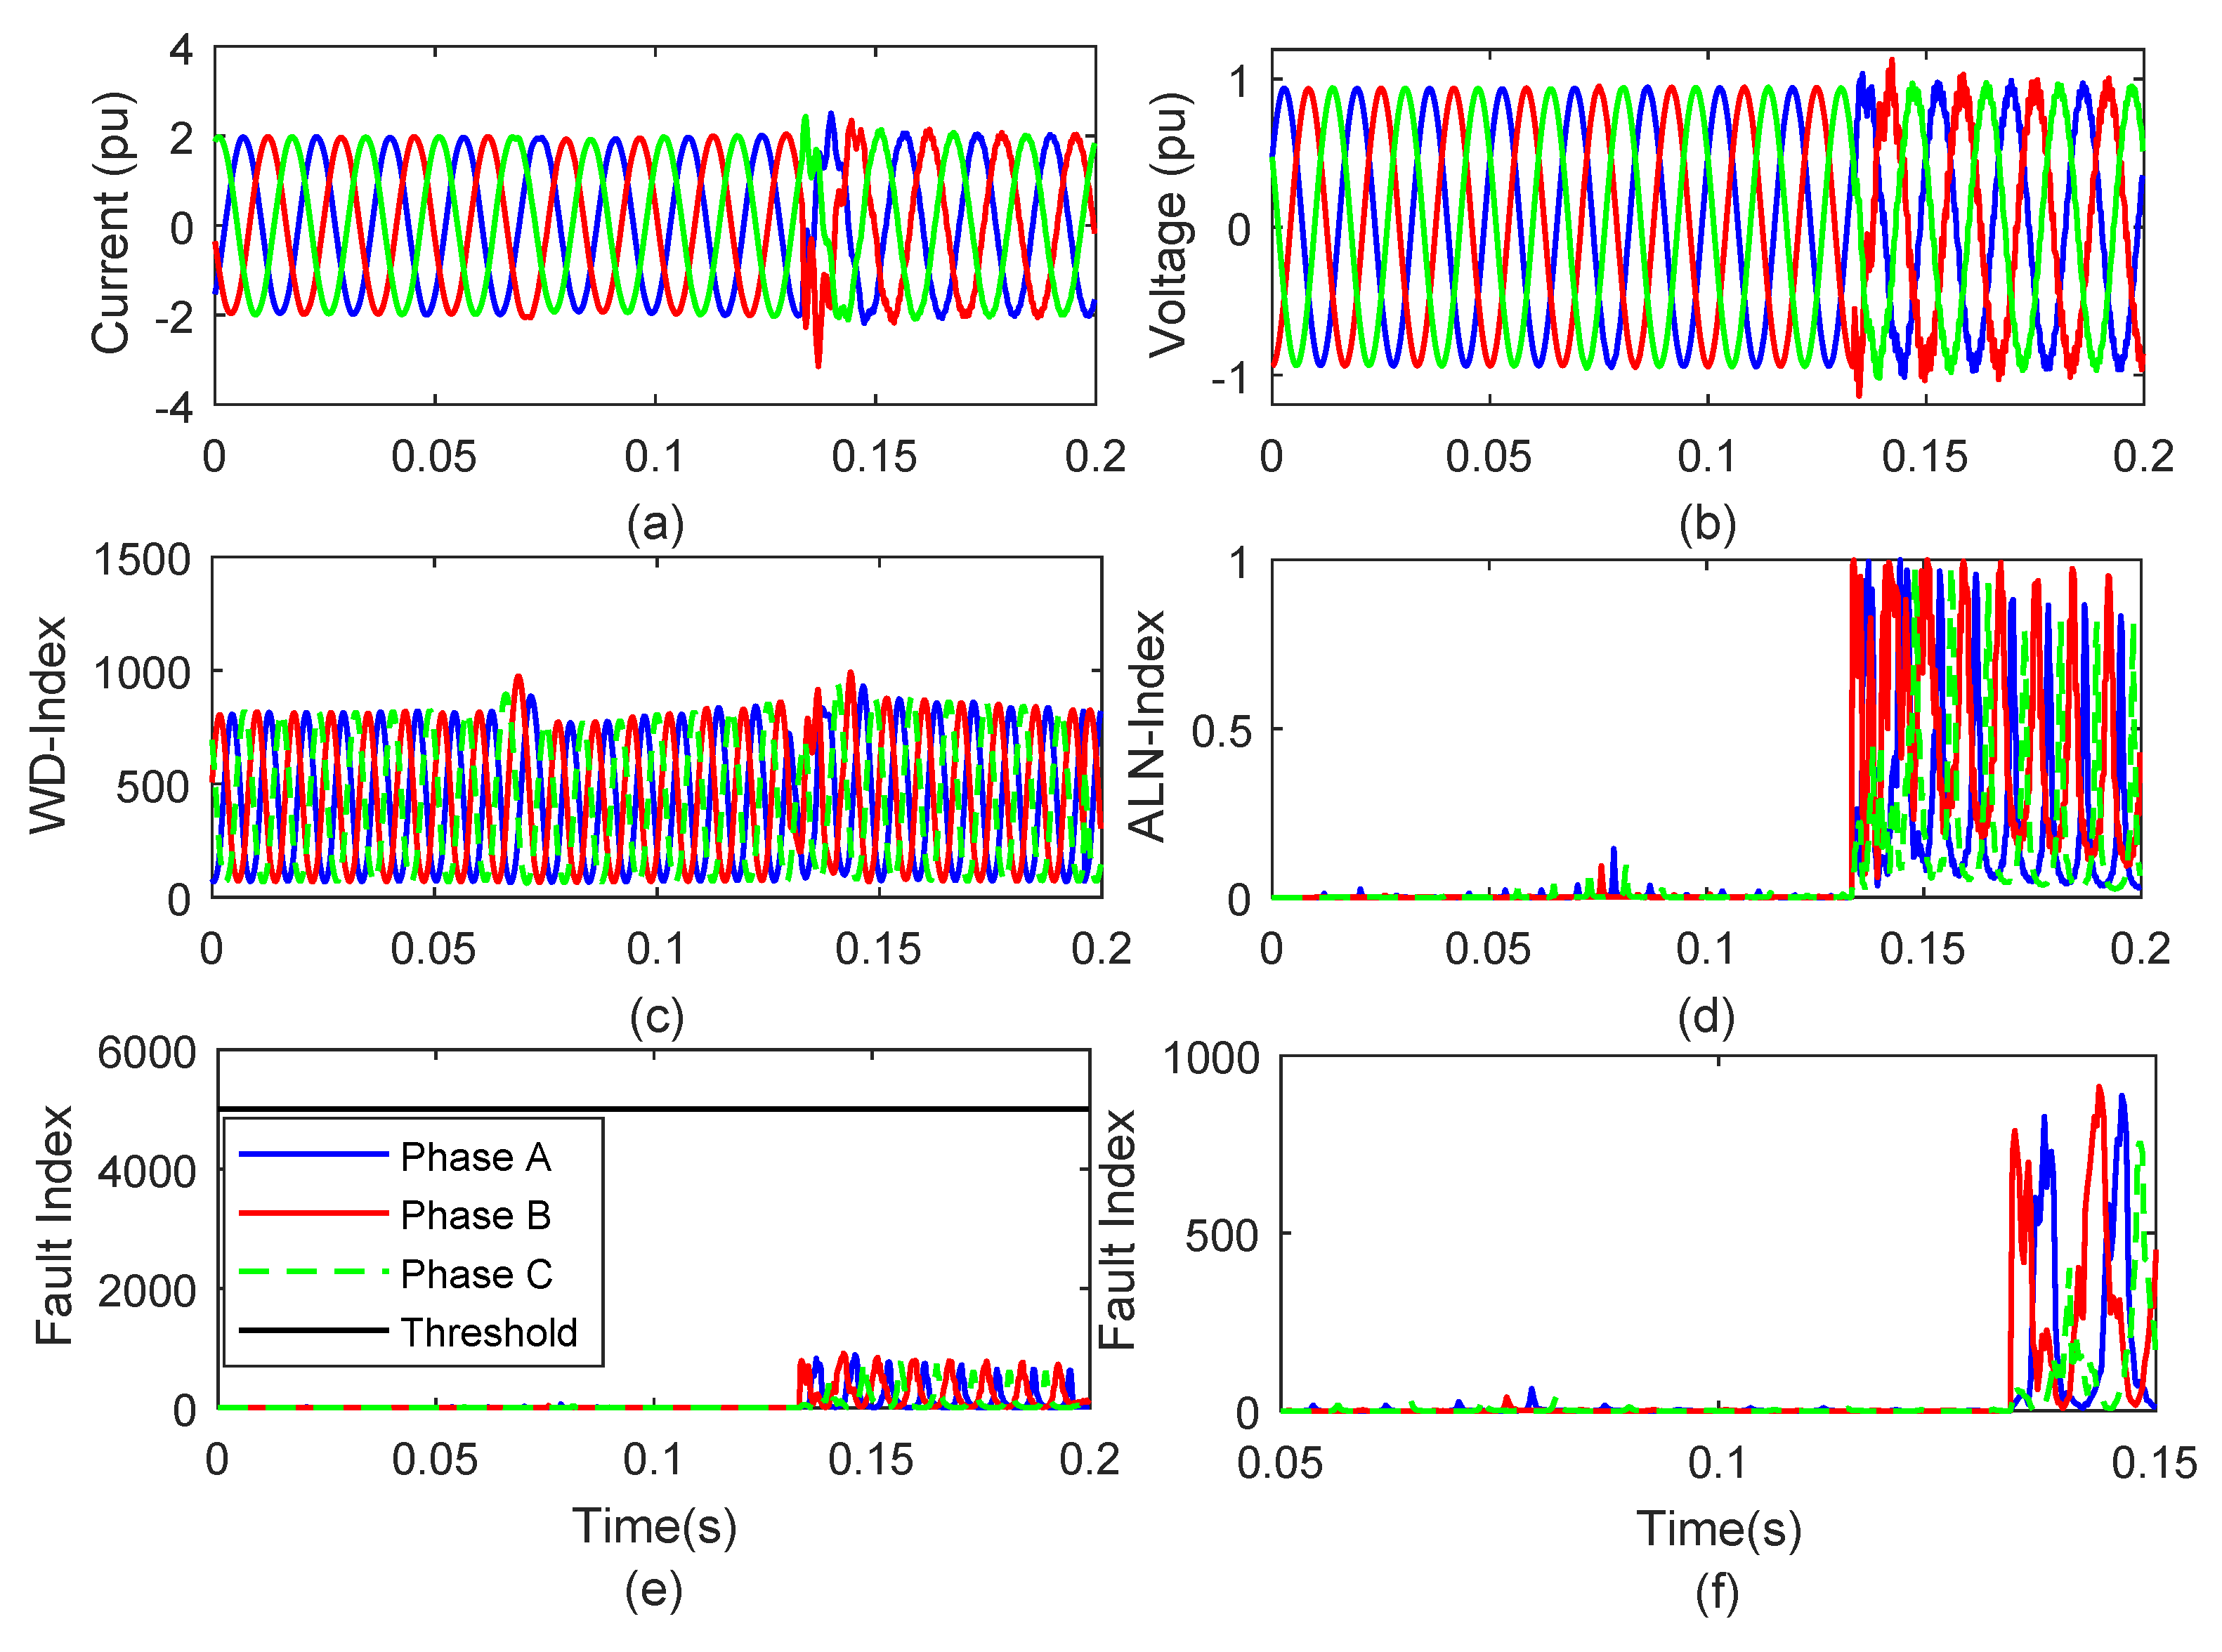
7. Discrimination Between Switching and Faulty Events

This section details the results, obtained by the application of proposed algorithm for the switching events to differentiate these events from the faulty conditions.

7.1. Switching of Line Feeder

The event of switching on and off of the line feeder was realized by opening the circuit breaker (CB) between nodes 671 and 692 at 4th cycle and re-closing the CB at 8th cycle. Results for the period of 12 cycles in the event of switching of line feeder are presented in Figure 14. It is observed that the current and voltage waveforms are distorted with small magnitude at the time of feeder operation (on/off) as depicted in Figure 14a,b, respectively. It is inferred from Figure 14c that magnitude of WD-index increases at the time of feeder tripping and re-closing. Figure 14d indicates that the ALN-index has high magnitude peaks at the time of re-closing of the feeder. However, small magnitude transients are observed at the moment of feeder tripping. Figure 14e gives an indication that FI has a lower magnitude compared to threshold at both the events of tripping as well as re-closing of feeder. However, small magnitude peaks are observed at the moment of feeder tripping as well as re-closing, where feeder re-closing event has a large effect compared to tripping event. A high resolution plot of FI is illustrated in Figure 14f.

7.2. Capacitive Switching

An event of capacitor switching is realized at node 675 by switching off the connected capacitor banks at 4th cycle and again switching on at 8th cycle. Voltage and current signals recorded on node 650 are processed to obtain the FI using WD-index and ALN-index as illustrated in Figure 15. It is inferred from Figure 15 that FI has lower values compared to the threshold during the event of switching off and on of the capacitor bank. Hence, it is established that algorithm is effective for the discrimination of the capacitor switching event from the faulty events.

7.3. Load Switching

An event of load switching is realized by switching off the load connected at node 671 at 4th cycle and again switched on at 8th cycle. Voltage and current signals recorded at node 650 are processed to obtain the FI using WD-index and ALN-index as illustrated in Figure 16. It is inferred from Figure 16 that FI has lower values compared to the threshold during the event of switching off and on the load. Hence, it is established that the algorithm is effective for the discrimination of load switching event from the faulty events.

8. Performance of Protection Scheme

This section presents brief comments on the results and comparison of results with the existing algorithms.

8.1. Brief Discussion of Results

Results discussed in the Section 4, Section 5, Section 6 and Section 7 show that the algorithm introduced in this paper is effective in providing protection against different types of faults to the hybrid grids where conventional generator, wind power plant, solar energy plant, loads, OH lines, UG cables, capacitors, transformers, measuring devices and switches are available. This is effective only if both voltage and current signals are used. It will not work when either current or voltage signals are used individually. This algorithm is fast and accurately identifies as well as classifies all types of faults during different scenarios such as presence of high level noise, different fault incidence angles, high fault impedance, different sampling frequencies, different locations of the RE generators, and different fault locations. The algorithm is effective for protection of the high voltage networks up to voltage levels of 765 kV which comprises of thermal plants, hydro plants, nuclear plants, wind generators integrated to network at different nodes, solar generators integrated to network at different nodes, feeding agriculture (induction motors) loads, domestic loads and industrial loads. However, for ring systems the protection scheme has to be installed at both ends of the line. Results also show that algorithm is effective in discriminating the faulty and operational events.

8.2. Comparative Study

Performance of the proposed algorithm is compared with the algorithms used for the detection of faults in the presence of renewable energy using DWT [12,13] and Stockwell transform (ST) [14,15]. It is observed that the DWT-based technique effectively detects the faults; however its performance is adversely affected by the presence of noise above 50 dB SNR and generates false tripping signals. Hence, DWT-based technique is not effective for the detection of faults when high noise level of 10 dB SNR is present. The Stockwell transform-based algorithm uses the patterns of various contours and plots for the fault detection, which ranges from half cycle to one cycle. The protection scheme based on the application of proposed WD-index individually will be slow and fault detection time will be high. However, its performance is least affected by the noise. The proposed ALN-index is effective for reducing the fault detection time because it has the merit of sharp change at the time of fault incidence. However, this cannot be used as a standalone protection scheme because at the time of fault incidence, its magnitude increases for the faulty as well as healthy phases. Furthermore, the performance of ALN-index-based method is adversely affected by the presence of high noise level. Therefore, proposed algorithm, obtained using WD-index and ALN-index has the combined merits of these indexes and provide fast performance of protection scheme, further it is not affected by the noise. Hence it is established that the performance of proposed algorithm is superior as compared to DWT, Stockwell transform, standalone WD-index and standalone ALN-index.

9. Conclusions

A method for the detection and classification of faults is presented in this paper to design a protection scheme for hybrid grid system integrated with wind and solar energy plants. Various fault types such as PG, 2P, 2PG, and 3PG were successfully identified in the RE sources based hybrid grid using proposed fault index. The FI is obtained using Wigner distribution function based decomposition of current signals (WD-index) sample with alienation coefficient of voltage signals (ALN-index). Fault types were classified using number of faulty phases and identified using proposed FI. A ground fault index, based on the Wigner distribution function supported decomposition of negative sequence current is proposed to differentiate the 2P and 2PG faults. It is concluded that the algorithm is fast and accurate for detection of all the types of faults in the hybrid grid with RE penetration. Furthermore, the algorithm was tested and effectively works in the presence of high level noise, different fault incidence angles, high fault impedance and different fault locations. The algorithm is also effective for the discrimination of switching events of capacitor, load and line feeder from faulty events. The algorithm is also effective in recognizing faults in the presence of transformers and hybrid lines consisting of OH line and UG cable sections. It is also established that the proposed algorithm obtained using WD-index and ALN-index has the combined merits of these indexes and provide fast response protection scheme whose performance is not affected by the noise. Hence it is established that performance of proposed algorithm is superior compared to DWT, ST, standalone WD-index and standalone ALN-index. As a future enhancement, testing of performance of algorithm with data recorded on real time network of the utility grids may be considered before implementation in the protection schemes.

Author Contributions

Conceptualization, S.R.O., O.P.M., A.S., V.S. and S.K.G.; methodology, S.R.O. and O.P.M.; software, S.R.O. and O.P.M.; validation, S.R.O. and O.P.M.; formal analysis, S.R.O., B.K. and O.P.M.; investigation, S.R.O. and O.P.M.; resources, A.S., S.K.G., H.H.A. and P.S.; data curation, S.R.O., B.K. and O.P.M.; writing—original draft preparation, S.R.O., B.K. and O.P.M.; writing—review and editing, B.K., H.H.A. and P.S.; visualization, B.K., H.H.A. and P.S.; supervision, A.S., S.K.G., H.H.A. and P.S. All authors have read and agreed to the published version of the manuscript.

Funding

External funding is not received for this research.

Conflicts of Interest

The authors declare that they have no known conflict of interest.

Abbreviations

Abbreviations used in this article are detailed below:
2PDouble phase
2PGDouble phase to ground
3PGThree phase to ground
PGPhase to ground
ALNAlienation
ANNArtificial neural network
CBCircuit breaker
DFIGDoubly fed induction generator
DGDistributed generation
DWTDiscrete Wavelet transform
ESExpert system
EVElectric vehicle
FIFault index
FIAFault incidence angle
FRDFTFast recursive discrete Fourier transform
FSTFuzzy set theory
GFIGround fault index
ICTInterconnecting transformer
IEEEInstitute of Electrical and Electronics Engineers
OHOverhead
MATLABMatrix laboratory
MPPTMaximum power point tracking
PCCPoint of common coupling
PQPower quality
PSProtection scheme
PVPhotovoltaic
RERenewable energy
SFSampling frequency
SNRSignal to noise ratio
STStockwell transform
TMThreshold magnitude
TMGFIThreshold magnitude of ground fault index
UGUnderground
WECSWind energy conversion system
WDWigner distribution
WDFWigner distribution function

References

  1. Aftab, M.A.; Hussain, S.S.; Ali, I.; Ustun, T.S. Dynamic protection of power systems with high penetration of renewables: A review of the traveling wave based fault location techniques. Int. J. Electr. Power Energy Syst. 2020, 114, 105410. [Google Scholar] [CrossRef]
  2. Eissa, M.; Awadalla, M.H. Centralized protection scheme for smart grid integrated with multiple renewable resources using Internet of Energy. Glob. Trans. 2019, 1, 50–60. [Google Scholar] [CrossRef]
  3. Fang, Y.; Jia, K.; Yang, Z.; Li, Y.; Bi, T. Impact of Inverter-Interfaced Renewable Energy Generators on Distance Protection and an Improved Scheme. IEEE Trans. Ind. Electron. 2019, 66, 7078–7088. [Google Scholar] [CrossRef]
  4. Barra, P.; Coury, D.; Fernandes, R. A survey on adaptive protection of microgrids and distribution systems with distributed generators. Renew. Sustain. Energy Rev. 2020, 118, 109524. [Google Scholar] [CrossRef]
  5. Eissa, M. Protection techniques with renewable resources and smart grids—A survey. Renew. Sustain. Energy Rev. 2015, 52, 1645–1667. [Google Scholar] [CrossRef]
  6. Alhelou, H.H.; Golshan, M.H.; Askari-Marnani, J. Robust sensor fault detection and isolation scheme for interconnected smart power systems in presence of RER and EVs using unknown input observer. Int. J. Electr. Power Energy Syst. 2018, 99, 682–694. [Google Scholar] [CrossRef]
  7. Kumar, D.S.; Srinivasan, D.; Reindl, T. A Fast and Scalable Protection Scheme for Distribution Networks With Distributed Generation. IEEE Trans. Power Deliv. 2016, 31, 67–75. [Google Scholar] [CrossRef]
  8. Pavlatos, C.; Vita, V.; Ekonomou, L. Syntactic pattern recognition of power system signals. In Proceedings of the 19th WSEAS International Conference on Systems (Part of CSCC’15), Zakynthos Island, Greece, 16–20 July 2015; pp. 16–20. [Google Scholar]
  9. Pavlatos, C.; Vita, V. Linguistic representation of power system signals. In Electricity Distribution; Springer: Berlin, Germany, 2016; pp. 285–295. [Google Scholar]
  10. Nieto, A.; Vita, V.; Maris, T.I. Power quality improvement in power grids with the integration of energy storage systems. Int. J. Eng. Res. Technol. 2016, 5, 438–443. [Google Scholar]
  11. Sheesh, R.O.; Amit, S.; Sunil, K.G.; Jhajharia, S.K.; Bhuvnesh, R.; Om Prakash, M. Wigner Distribution Function and Alienation Coefficient Based Transmission Line Protection Scheme. IET Gener. Transm. Distrib. 2020, 14, 1–12. [Google Scholar]
  12. Suman, T.; Mahela, O.P.; Ola, S.R. Detection of transmission line faults in the presence of wind power generation using discrete wavelet transform. In Proceedings of the 2016 IEEE 7th Power India International Conference (PIICON), Bikaner, India, 25–27 November 2016; pp. 1–6. [Google Scholar] [CrossRef]
  13. Suman, T.; Mahela, O.P.; Ola, S.R. Detection of transmission line faults in the presence of solar PV generation using discrete wavelet. In Proceedings of the 2016 IEEE 7th Power India International Conference (PIICON), Bikaner, India, 25–27 November 2016; pp. 1–6. [Google Scholar] [CrossRef]
  14. Thukral, S.; Mahela, O.P.; Kumar, B. Detection of transmission line faults in the presence of solar PV system using stockwell’s transform. In Proceedings of the 2016 2016 IEEE 7th Power India International Conference (PIICON), Bikaner, India, 25–27 November 2016; pp. 1–6. [Google Scholar] [CrossRef]
  15. Ola, S.; Saraswat, A.; Goyal, S.; Jhajharia, S.; Mahela, O.P. Detection and Analysis of Power System Faults in the Presence of Wind Power Generation Using Stockwell Transform Based Median. In Intelligent Computing Techniques for Smart Energy Systems; Lecture Notes in Electrical Engineering; Kalam, A., Niazi, K., Soni, A., Siddiqui, S., Mundra, A., Eds.; Springer: Singapore, 2020; Volume 607, pp. 319–330. [Google Scholar] [CrossRef]
  16. Kersting, W.H. Radial distribution test feeders. Power Syst. IEEE Trans. 1991, 6, 975–985. [Google Scholar] [CrossRef]
  17. Kersting, W. Radial distribution test feeders. In Proceedings of the Power Engineering Society Winter Meeting, Columbus, OH, USA, 1 February 2001; Volume 2, pp. 908–912. [Google Scholar] [CrossRef]
  18. Mahela, O.P.; Shaik, A.G. Power quality improvement in distribution network using {DSTATCOM} with battery energy storage system. Int. J. Electr. Power Energy Syst. 2016, 83, 229–240. [Google Scholar] [CrossRef]
  19. Paz, M.C.R.; Ferraz, R.G.; Bretas, A.S.; Leborgne, R.C. System unbalance and fault impedance effect on faulted distribution networks. Comput. Math. Appl. 2010, 60, 1105–1114. [Google Scholar] [CrossRef] [Green Version]
  20. Shaik, A.G.; Mahela, O.P. Power quality assessment and event detection in hybrid power system. Electric Power Syst. Res. 2018, 161, 26–44. [Google Scholar] [CrossRef]
  21. Mahela, O.P.; Shaik, A.G. Power Quality Detection in Distribution System with Wind Energy Penetration Using Discrete Wavelet Transform. In Proceedings of the 2015 Second International Conference on Advances in Computing and Communication Engineering (ICACCE), Dehradun, India, 1–2 May 2015; pp. 328–333. [Google Scholar] [CrossRef]
  22. Mahela, O.P.; Khan, B.; Alhelou, H.H.; Siano, P. Power Quality Assessment and Event Detection in Distribution Network with Wind Energy Penetration Using Stockwell Transform and Fuzzy Clustering. IEEE Trans. Ind. Inform. 2020, 1–10, in press. [Google Scholar] [CrossRef]
  23. Kuo, C.L.; Lin, C.H.; Yau, H.T.; Chen, J.L. Using Self-Synchronization Error Dynamics Formulation Based Controller for Maximum Photovoltaic Power Tracking in Micro-Grid Systems. Emerg. Sel. Top. Circ. Syst. IEEE J. 2013, 3, 459–467. [Google Scholar] [CrossRef]
  24. Ding, K.; Bian, X.; Liu, H.; Peng, T. A MATLAB-Simulink-Based PV Module Model and Its Application Under Conditions of Nonuniform Irradiance. Energy Convers. IEEE Trans. 2012, 27, 864–872. [Google Scholar] [CrossRef]
  25. Mahela, O.P.; Shaik, A.G. Power quality recognition in distribution system with solar energy penetration using S-transform and Fuzzy C-means clustering. Renew. Energy 2017, 106, 37–51. [Google Scholar] [CrossRef]
  26. Khan, N.A.; Taj, I.A.; Jaffri, M.N.; Ijaz, S. Cross-term elimination in Wigner distribution based on 2D signal processing techniques. Signal Process. 2011, 91, 590–599. [Google Scholar] [CrossRef]
  27. Cheng, J.Y.; Huang, S.J.; Hsieh, C.T. Application of Gabor–Wigner transform to inspect high-impedance fault-generated signals. Int. J. Electr. Power Energy Syst. 2015, 73, 192–199. [Google Scholar] [CrossRef]
  28. Rathore, B. Alienation based fault detection and classification in transmission lines. In Proceedings of the 2015 Annual IEEE India Conference (INDICON), New Delhi, India, 17–20 December 2015; pp. 1–6. [Google Scholar] [CrossRef]
  29. Rathore, B.; Shaik, A.G. Wavelet-alienation based protection scheme for multi-terminal transmission line. Electric Power Syst. Res. 2018, 161, 8–16. [Google Scholar] [CrossRef]
Figure 1. Hybrid power system network incorporating wind and solar energy plants.
Energies 13 01120 g001
Figure 2. Solar cell modelled using single diode equivalent.
Energies 13 01120 g002
Figure 3. The algorithm for the recognition of faults on the hybrid power system incorporating renewable energy.
Energies 13 01120 g003
Figure 4. Phase to ground fault at the node 646 of hybrid power system network (a) root mean square voltage (b) frequency (c) power injected by solar PV system into the hybrid grid (d) power injected by wind power plant into the hybrid grid.
Energies 13 01120 g004
Figure 5. Recognition of PG fault incident at the node 646 of hybrid test system (a) current waveform (b) voltage waveform (c) WD-index (d) ALN-index (e) FI (f) plot to compute fault recognition time.
Energies 13 01120 g005
Figure 6. Recognition of 2P fault incident at node 646 of hybrid test system (a) current waveform (b) voltage waveform (c) WD-index (d) ALN-index (e) FI (f) plot to compute fault recognition time.
Energies 13 01120 g006
Figure 7. Recognition of 2PG fault incident at node 646 of hybrid test system (a) current waveform (b) voltage waveform (c) WD-index (d) ALN-index (e) FI (f) plot to compute fault recognition time.
Energies 13 01120 g007
Figure 8. Recognition of 3PG fault incident at node 646 of hybrid test system (a) current waveform (b) voltage waveform (c) WD-index (d) ALN-index (e) FI (f) plot to compute fault recognition time.
Energies 13 01120 g008
Figure 9. Ground fault index for classification of 2P and 2PG faults.
Energies 13 01120 g009
Figure 10. Recognition of PG fault incident on node 652 of hybrid test system (a) current waveform (b) voltage waveform (c) WD-index (d) ALN-index (e) FI (f) plot to compute fault recognition time.
Energies 13 01120 g010
Figure 11. Recognition of PG fault incident on node 634 of hybrid test system (a) current waveform (b) voltage waveform (c) WD-index (d) ALN-index (e) FI (f) plot to compute fault recognition time.
Energies 13 01120 g011
Figure 12. Recognition of PG fault incident on node 652 of hybrid test system in the presence of noise (10dB SNR) (a) current waveform (b) voltage waveform (c) WD-index (d) ALN-index (e) FI (f) plot to compute fault recognition time.
Energies 13 01120 g012
Figure 13. Recognition of the PG fault incident at node 646 by recording voltage and current signals at PCC (a) current waveform (b) voltage waveform (c) WD-index (d) ALN-index (e) FI.
Energies 13 01120 g013
Figure 14. Recognition of event of switching of line feeder (a) current waveform (b) voltage waveform (c) WD-index (d) ALN-index (e) FI (f) high resolution plot of FI.
Energies 13 01120 g014
Figure 15. Fault index with event of capacitor switching.
Energies 13 01120 g015
Figure 16. Fault index with event of load switching.
Energies 13 01120 g016
Table 1. Feeder Data of Hybrid Grid.
Node ANode BLength of Feeder (m)Configuration of Feeder
632645152.40601
632633152.40601
6336340XFM
64564691.440601
650632609.60601
684652243.84606
632671609.60601
671684680.00601
6716920Switch
68461191.44601
692675152.40606
Table 2. Loading Data of Hybrid Grid.
NodesLoad ModelLoadCapacitor Banks
kWkVAr(kVAr)
634Y-PQ400290
645Y-PQ170125
646Y-PQ230132
652Y-PQ12886
671Y-PQ1155660
675Y-PQ843462600
692Y-PQ170151
611Y-PQ17080100
632–671Y-PQ200116
Table 3. Transformer Parameters of Hybrid Grid with RE Penetration.
TransformerMVAkVkVHV WindingLV Winding
HighLowR ( Ω ) X ( Ω ) R ( Ω ) X ( Ω )
TRFG101154.1629.095211.600.11420.8306
TRFF54.160.480.38072.76880.05100.0042
TRFS14.160.2600.1730195.700.00070.7645
TRFW54.160.480.38072.76880.05100.0042
Table 4. Fault Index at Different Nodes of Test System with PG Fault.
Test NodeFault Index Magnitude
Phase-APhase-BPhase-C
646 5.055 × 10 4 3321370
632 1.138 × 10 5 6451855
634 5.001 × 10 4 348998
652 4.956 × 10 4 1170439
611 6.216 × 10 4 14911785
671 6.234 × 10 4 27112886
675 6.164 × 10 4 15292001
Table 5. Fault Index During PG Faulty Event with Different Fault Impedance.
Phase NameFault Index Magnitude
0 Ω 5 Ω 10 Ω 15 Ω 20 Ω 25 Ω
Phase-A 5.055 × 10 4 4.601 × 10 4 3.307 × 10 4 2.170 × 10 4 1.003 × 10 4 8252
Phase-B332317284253232199
Phase-C13701101923457333316
Table 6. Fault Index During PG Faulty Event with Different Fault Incidence Angles.
Phase NameFault Index Magnitude
0 30 60 90 120 150
Phase-A 5.055 × 10 4 6.848 × 10 4 4.641 × 10 4 7.531 × 10 4 3.875 × 10 4 2.139 × 10 4
Phase-B332110762113231146704
Phase-C13701244985132715675

