Abstract
This study investigates how the petrographic features of Klepa Nafpaktias sandstones affect their behavior in construction applications such as concrete, in environmental applications such as energy storage as well as whether they are suitable for the above uses. For achieving this goal, sandstones (ten samples) were collected in order to study their petrographic characteristics using petrographic microscope and GIS software, as well as their basic physical, mechanical and physicochemical properties were also examined. Concrete specimens (C25/30) were made according to international standards including the investigated aggregate rocks in various grain sizes. Various sandstones were tested and classified in three district groups according to their physicomechanical features as well as to their petrographic and microtopographic characteristics. Concrete strength’s results determined the samples into three groups which are in accordance with their initial classification which was relative to their grain size (coarse to fine-grained). As the grain size decreases their physicomechanical and physicochemical properties get better resulting in higher concrete strength values (25 to 32 MPa). Furthermore, the proposed ratio C/A (crystals/mm2) seems to influence the aggregate properties which constitute critical factors for the final concrete strength, presenting the more fine-grained sandstones as the most suitable for concrete aggregates. Concerning the use of Klepa Nafpaktias sandstones as potential energy reservoirs, the studied sandstones presented as suitable for CO2 storage according to their physicomechanical characteristics.
1. Introduction
Applied petrography constitutes an essential tool for the assessment of natural rocks or recycling materials for different useful applications such as concrete and energy storage. Petrography, generally, using a combination of methods such as microscopic observations (polarizing and scanning electron microscope) and chemical analysis examines the nature of each given rock/material showing the main relationship of texture, structure, composition and alteration degree [1,2,3,4,5,6,7,8,9]. Through these relationships, petrography may explain the physicomechanical and physicochemical properties of materials/rocks as well as the relationships among them. It is well-known that the already above-mentioned properties are the critical ones that define the particular use of each given material/rock either construction or environmental applications.
Concrete is one of the most important and useful composite material, which is made from a mixture of cement, aggregates, water and sometimes admixtures in required proportions [10,11,12,13]. Cement and water bonded with aggregates constitute the concrete. Aggregates constitute the main components of concrete and occupy between 70% and 80% of the concrete volume [10]. Nevertheless, concrete performance depends on the aggregate particles quality [11,12,13,14]. Crushed rocks derived from various geological sources are the natural aggregates [15]. Critical factors for the suitability of aggregates in construction use are their physicomechanical behavior. This behavior is affected by the mineralogical and textural features of aggregates which play critical role in its strength and therefore in concrete strength. The most common types of rocks used in concrete production are classified into igneous, sedimentary and metamorphic rocks. Aggregates can be expected to have an important influence on the concrete’s properties [16]. Such rocks are mainly limestone, granite, sandstone, quartzite, dolomite, marble, dacite etc. Each of these rock types is more or less suitable for uses as concrete aggregates, based on their petrographic characteristics and therefore on physicomechanical properties which contribute to reinforcing the strength of the concrete.
Sandstone is a widespread aggregate presenting various construction applications such as concrete. The physicomechanical properties of the aforementioned rock lithotype are quite different and aggregates such as quartzite, subarcose and greywacke can produce various behaviors of hardened concrete. Thus, it can be seen that these sandstone aggregates can obviously be characterized to acquire relatively predictable aggregate and concrete performances [17]. Sandstone used as aggregate of variable sizes within concrete may result in influencing the corresponding strength. In addition, it is regarded as significant for these aggregates to be graded when applied for concrete production. Moreover, it is well-known that sandstone is vastly affected by moisture content which results in the decrease of the identified mechanical property behavior in brittle construction material. Additionally, these sedimentary rocks have the tendency to display smaller strength compared to conventional aggregate material such as limestones. Sandstone performance behavior under anhydrous conditions is regarded as being good, which is not in the case of hydrous conditions since it is regarded as poor behavior especially in sandstones that are not well cemented [18,19]. Quartz content in concrete prepared by sandstone aggregates determines the concrete application [20]. Yilmaz and Tugrul [21] reported that concretes produced by comparable qualities and quantities cements exhibit variability in strength values depending on: mineralogy assemblage of aggregate, type of cement, textural and physico-mechanic characteristics.
Many researchers have investigated the correlations between the percentages of specific mineralogical compositions of aggregates and the final compressive concrete strength. Petrounias et al. [22,23] when investigating igneous rocks from Greece concluded that the alteration products of serpentinite-bearing rocks and andesitic-intermediate rocks have a profound impact on their mechanical behavior, that apparently affect their ability to be characterized as suitable concrete aggregate material. On the other hand, Yılmaz and Tugrul [21] evaluated sandstone aggregates from Turkey based on the parameters that include: physical properties, mechanical properties and compositional variations. They concluded that concretes produced by comparable qualities and quantities of cements present variabilities in the obtained strength values regarding mineralogy assemblage, the textural and physico-mechanic characteristics of the tested sandstones used in the size of aggregate.
During the last decades, only a few attempts to combine the database and visualization facilities of Geographic Information System (GIS) software and petrographic features of rocks have been carried out. In these studies, polarizing microscope images have been used in order to identify and visualize rock textures on microscopic scale. Li et al. [24] using GIS software to segment and analyze boundaries in the perimeters of grains, proposed a procedure to be applied on examined samples. Barraud [25] has used GIS techniques to process vectorized textural features, whereas Fernandez et al. [26] used the same application to parametrize single grain crystals through map development methods. An innovative methodology combining GIS and petrographic characteristics of various rocks has been applied by Tarquini [27].
Economic growth and a rising global population means that the worldwide demand of energy will be rising with very fast pace. This increases concerns that the extensive use of fossil-fuels should be mitigated, allowing space for further development of renewable energy sources. The problem that arises with the use of the latter is that most of these sources are intermittent and therefore energy storage applications are necessary to make them available around-the-clock for uninterrupted power supply [28]. Suitable subsurface geological formations can serve as energy storage reservoirs depending on the storage purpose and the type of energy source. Energy storage systems include that of thermal energy, CO2, compressed air, hydrogen storage, natural gas and underground pumping of water.
Rocks consisting geological formations must fulfill certain criteria to be considered as a candidate reservoir for potential thermal-energy storage (TES), compressed air energy storage (CAES) and carbon capture and storage (CCS) applications. These criteria have been noted by researchers (e.g., [28,29,30]) stating that rocks should display high values of thermal conductivity, specific heat capacity, and density to enable high storage efficiency. Low porosity values correlate positively with high values of bulk density and uniaxial compressive strength, which are necessary to ensure not only the optimum energy storage criteria but to avoid fracture development and disintegration [28]. Research conducted by Allen et al. [31] and Tiskatine et al. [32] suggest that formations consisting of sandstones may serve as proper energy storage reservoirs, provided that they meet compositional (e.g., calcium-or silica-rich), textural and structural and also not having been significantly affected secondary alteration processes.
Aim of this study is to highlight the effect of petrographic characteristics of sandstones from Klepa Nafpaktias (central western Greece) as a decisive factor in the final strength of the produced concrete specimens by sandstones aggregates and also to examine their potential use as geological reservoir for carbon capture and storage (CCS) applications.
2. Geological Setting
The study area is Klepa Nafpaktias that geographically belongs to the regional unit of Aitolia and Akarnania and geologically to the Pindos Geotectonic Zone, which comprises an intricate thrust belt with allochthonous Mesozoic and Tertiary deep-water tectono-stratigraphic units [33], which are developing along the central Western Greece (Figure 1) and extend into Albania and former Yugoslavia to the north [34] and Crete, Rhodes [35] and Turkey [36,37], toward the south and southeast. The Pindos Zone sedimentary sequence was deposited in an extended oceanic rift related basin that likely was created during the Middle Triassic era, located in the Apulia extensive marginal platform [38] and more specifically in the Gavrovo-Tripolis sedimentary platform [33,39] that emerged periodically, and now lies westwards of Pindos, and the Pelagonian continental block in the east [40,41,42,43]. The progressive closure of the Pindos oceanic basin were initiated during the end of Maastrichtian, as recorded by the gradual alteration, from predominantly carbonates intercalating with radiolaria to siliciclastic/turbiditic lithofacies (Paleocene flysch deposition) derived from the north and east sectors [33,39,44]. The complete closure of the Pindos Ocean during the Eocene led to the detachment of the deep-sea sedimentary cover from the accretionary oceanic prism, which was later overthrusted in a westward direction onto the Pelagonian geotectonic platform, forming multiple layers of thrust sheets [38,42].
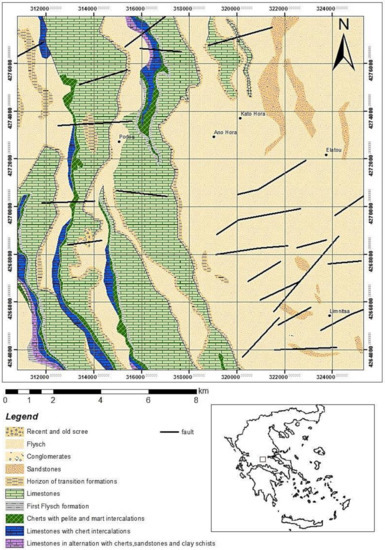
Figure 1.
Geological map of the Klepa Nafpaktias [49] (Central Western Greece) region (modified after fieldwork mapping by using ArcMap 10.1).
The sedimentary alternating strata of Pindos Zone consist of deep-water carbonate, siliciclastic and siliceous rocks of Late Triassic to Eocene age [38,39,42], mainly including the following units (Figure 1): (1) Ophiolite complex of Pindos (Jurassic age); (2) Limestones of Orliakas (Late Cretaceous age); (3) A Mélange formation, namely that of the Avdella (Late Triassic to Late Jurassic age), (4) the Sediments of deep water type, namely that of Dio Dendra (Late Jurassic to Late Cretaceous age); and (5) a thick flysch formation assigned to the Pindos zone (Late Cretaceous to Tertiary age) according to Jones et al. [45]. More extensively, the Pindos flysch consists of thin- to thick-bedded sandstones and mudstones in alteration with marly-oolitic limestones and cherts (reference). According to Konstantopoulos and Zelilidis [46], the sandstones of the Pindos Flysch were possibly cited within an accretionary prism located close to an active marginal basin, supplied by predominantly basic/ultra-basic and less felsic material. Furthermore, Faupl et al. [47] conducted a heavy mineral examination, suggesting that the clastic material of the Pindos flysch has an eastwards origin, while a petrographic and geochemical study by Vakalas et al. [48] on sandstone samples from Epirus and Akarnania regions suggests a granitic source and a supply from the Pelagonian Zone correspondingly. Detrital modes of sandstone suites reveal the lithological composition of source terranes and the tectonostratigraphic level reached by erosion in space and time.
3. Materials and Methods
3.1. Materials
Ten samples from different type of sandstones (coarse-grained and fine-grained) were collected from the studied area. These samples were tested for their petrographic characteristics, physicomechanical and physicochemical properties in order to be classified for their suitability as concrete aggregates. Normal Portland cement (CEM II 32.5N) was used in this study, which conformed to EN 197-1 [50] standard with the collected aggregates in order to produce concrete. For the mixing as well as for the curing of concrete, a potable water with pH = 7, characterized as free of clay, salt, organic matter and silt was chosen to be used. The same volume of aggregate per m3 of the mixture was retained for keeping consistent composition in all the produced specimens. The proportions used for cement, aggregates and water ratio were those of 1/6/0.63. The same collected sandstones were also investigated for their potential use as reservoir for thermal-energy storage (TES) and compressed air energy storage (CAES) applications.
3.2. Methods
3.2.1. Rock Material Tests
Polished thin sections of the collected sandstones were first tested via a petrographic microscope (EN 932-3 [51]) for identifying their mineralogical and textural characteristics. The used microscope was of the type of Leitz Ortholux II POL-BK Ltd., Midland, ON, Canada one. In a further stage, their petrographic characteristics were investigated as well as the quantification of their mineralogical composition was calculated using the ArcMap 10.1 software, in which six representative thin sections of the studied groups (two per sample) were investigated.
Secondary electron images (SEI) were used for the identification of the microtopography of the aggregates (BS 812 Part 1 [52], whereas six qualitative categories were outlined (porous, honeycomb, crystalline, rough, granular, smooth and glassy).
A hammer was used in order to crush the studied sandstones into smaller pieces. Then, a laboratory jaw crusher was used for extra fractioning of the samples. For the preparation of the cylindrical specimens with diameters varying from 50 to 54 mm and with ratio of length to diameter varying from 2.2 to 2.4 mm, laboratory core drill combined with saw machines were used.
The investigated physicomechanical and physicochemical properties of this study were the total porosity (nt) (ISRM 1981 standard [53]), the magnesium sulfate (MgSO4) (S) (EN 1367-2 [54]), the water absorption (wa) (EN 1097-6 [55]), the resistance in abrasion and attrition-Los Angeles (LA) (ASTM C-131 [56]), and the uniaxial compressive strength (UCS) (ASTM D 2938-95 [57]), properties crucial for further quality of the aggregates.
3.2.2. Concrete Tests
Twenty normal concrete cube specimens having dimensions of 150 × 150 mm were produced by the ten investigated sandstone aggregates (ACI-211.1-91) (Table 1) [58]. For all the produced concrete specimens, the used parameters retained fixed. The aggregates were crushed and sieved via standard sieves and separated to achieve the sizes: 2.00–4.75, 4.45–9.5 and 9.5–19.1 mm. After 24 h, the samples were transferred from the mold and for 28 days they were cured in water at 20 ± 3 °C. A compressive testing machine, having an increasing rate of load of 140 kg/cm2 per minute, was used in order to calculate the concrete strength by the division of the value of the load at the moment of failure over the area of specimen. The concrete strength was calculated via BS EN 12390-3:2009 standard [59].

Table 1.
Quantification of the modal composition of the representative investigated groups of sandstones.
In this stage, the examination of the concrete textural features was carried out when using polished thin sections in a petrographic microscope (ASTM C856–17) [60]. A 3D depiction of the petrographic characteristics of the concrete as well as of the studied sandstone aggregates was carried out by the 3D Builder software using thin sections.
4. Results
4.1. Test Results of Aggregates
4.1.1. Petrographic Features of Aggregates Using Petrographic Microscope
The studied sandstones derived from Klepa area have been divided according to the petrographic analysis into three district groups. These groups are based on the grain size of the collected sandstones and they were characterized as coarse to fine-grained ones.
Group I: Coarse-grained sandstones (KL.5, KL.9)
These sandstones comprise sub-angular to angular grains (Figure 2a,b). They are generally moderate to poor sorted. The mineralogical composition mainly includes quartz, K-feldspars, plagioclase, calcite, mica and in minor amounts muscovite, chlorite and biotite as well as lithic fragments (Table 1). These sandstones present mainly siliceous cement. Quartz is mostly displayed as undulose monocrystalline and less as polycrystalline grains. The monocrystalline quartz grains vary from sub-angular to angular, while the polycrystallines range from sub-angular to sub-round. The grain contacts presented as straight to suture. K-feldspars grains vary in size, from small to large with euhedral to subhedral shape, whereas plagioclase is observed in smaller grains. In general, the fragments are sub-rounded and sub-angular to angular and they are mainly comprised of clasts of quartz, feldspars as well as by rock-fragments of basalt and gabbro. Traces of carbonate fossils are also observed in several samples (e.g., KL.5).
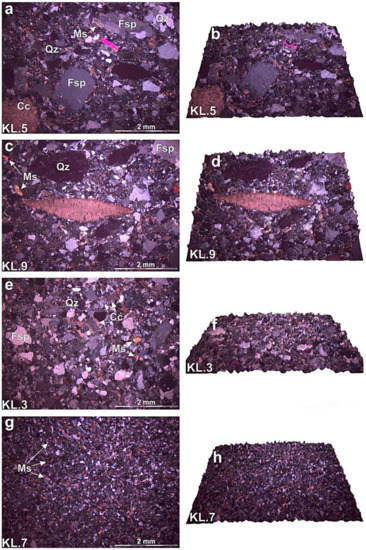
Figure 2.
Photomicrograph of textural characteristics of sandstone aggregates (Nicols+) and 3D depiction of the studied sandstones respectively: (a) clastic texture presented in a coarse-grained quartz sandstone with quartz (Qz), K-feldspars (K-Fs), plagioclase (Plg), muscovite (Ms) and calcite (Cc); (b) 3D depiction of coarse-grained sandstone; (c) clastic texture presented in a coarse-grained sandstone containing large particles of carbonate fossils; (d) 3D depiction of coarse grained sandstone; (e) clastic texture presented in a medium-grained quartz sandstone with quartz (Qz), K-feldspars (K-Fs) and calcite (Cc); (f) 3D depiction of coarse-grained sandstone; (g) clastic texture presented in a fine-grained quartz sandstone with muscovite (Ms); (h) 3D depiction of fine-grained sandstone.
Group II: Medium-grained sandstones (KL.1, KL.2, KL.3, KL.6)
The medium-grained sandstones can be classified as quartz sandstones. They are moderately sorted and their grains are sub-angular to sub-round. The main mineralogical composition includes quartz which forms monocrystalline and polycrystalline grains, K-feldspars, calcite and muscovite (Figure 2c). Polycrystalline quartz shows interlocking texture. Feldspars (mainly microcline) are presented in lesser amounts, including the weathered varieties (Table 1). Cement is mainly siliceous and locally calcareous.
Group III: Fine-grained sandstones (KL.4, KL.7, KL.8, KL.10)
In the fine-grained quartz sandstones, framework grains are mainly sub-angular to sub-round. They are characterized as well sorted quartz sandstones. The modal composition mostly comprises of quartz, K-feldspars, calcite, and mica (mainly muscovite) which is presented in bigger amounts in contrast to the other two groups. Cementing material is mainly siliceous (Table 1).
4.1.2. Petrographic Features of Aggregates Using GIS Method
In this paper, GIS method was used as a new approach for petrographic analysis of the investigated sandstones. For this reason, six thin sections, representative of the investigated sandstones (two sections for each group) were used in order to be analyzed via GIS method. More specifically, a part of the same size and in the same site of the thin section has been chosen to be digitized via ArcMap 10.1 software. Each digitized polygon corresponds to a different grain of the sandstone. The result of that process is the creation of a map that shows the modal composition of the tested rocks as well as their textural characteristics such as the grain size (Figure 3). In a next stage, the semi-quantification of the mineralogical composition of the studied sandstones was carried out, showing that Group III presents higher content of quartz than the other two groups, Group I displays intense higher content of feldspars in contrast to Group II and III (Table 1), while Group II is presented as more enriched in calcite (Table 1). Furthermore, Group III displays significant high content of muscovite. Concerning the containing cement, Group III presents higher content of silica cement in contrary to the other two groups (Table 1). After the petrographic analysis via the GIS proposed method, the ratio C/A was calculated (Table 1). C/A (crystals/mm2) is the ratio of the sum of the measured crystals to the measured area (mm2). As can be seen in Table 1, Group I, which contains the coarser grains, presents an average of C/A 11.60 in contrast to samples of Group III which presents values of C/A from 55.70 to 56.50 and this group consists of the smallest size grains.
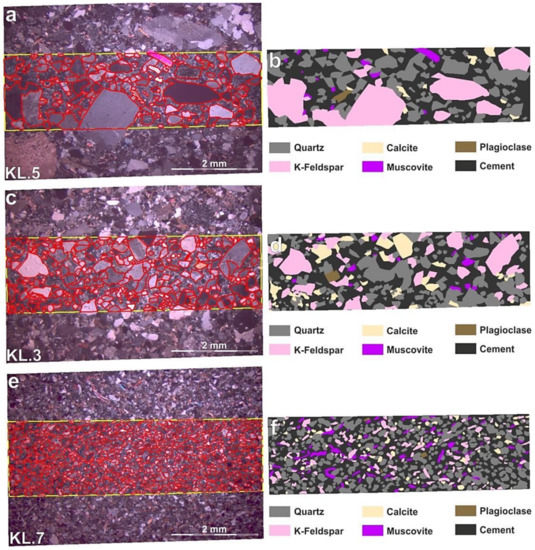
Figure 3.
Representative images from the studied groups derived from the ArcMap 10.1 software showing: (a) The part of the thin section of the coarse-grained sandstone which has been analyzed; (b) the output after the digitalization of the investigated part of each thin section where each mineral phase has been attributed by different colors; (c) the part of the thin section of the medium-grained sandstone which has been analyzed; (d) the output after the digitalization of the investigated part of each thin section where each mineral phase has been attributed by different colors; (e) the part of the thin section of the fine-grained sandstone which has been analyzed; (f) the output after the digitalization of the investigated part of each thin section where each mineral phase has been attributed by different colors.
4.1.3. Microtopographic Characteristics of the Tested Sandstones
The surface textural characteristics of the examined sandstone particles were used to classify the quartz sandstones in groups consistent with the above mentioned Groups I to III, as it is shown in Figure 4. The abundance of the coarse size grains of quartz, feldspars and carbonate fossils in the poor sorted sandstone (Group I) is responsible for the smooth surfaces. Sandstones of Group, II constituting medium-grained rocks, are characterized by rough surface texture. The surface of Group III samples can be characterized as rougher in contrast to the other two groups because of the existence of higher content of evenly distributed mica and quartz expressing topographic low areas combined with feldspars which express lower topographic areas.
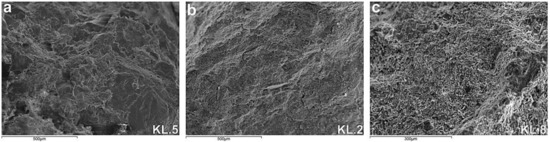
Figure 4.
Secondary electron images (SEI) depicting the microtopography of representative sandstone samples observed to their textural and mineralogical characteristics: (a) coarse-grained; (b) medium-grained; (c) fine-grained sandstone.
4.1.4. Physicomechanical Properties of Aggregates
Three distinct groups of sandstones were determined following the results of their physicomechanical properties (Table 2). The calculated mechanical as well as the calculated physical results of the examined rocks present quite wide range. These results have classified the investigated sandstones into groups which are in agreement with those derived from their petrographic study. Group I includes coarse-grained sandstones, which presented the worst values of mechanical properties among all the studied rock samples. Among the examined sandstone aggregates of Group I, sample KL.5, owing to its lower content in quartz, led to a lowest value of total porosity (nt) as well as in resistance in abrasion. Group II was composed of medium-grained sandstones presented variable physicomechanical performance relative to their mineralogical composition. Group III included fine-grained sandstones, which displayed high physicomechanical parameters among all the determined groups. The fine-grained sandstones, such as KL.4 and KL.8, presented better mechanical characteristics against the coarse-grained sandstones such as KL.5 and KL.9.
Table 2.
The results of the physicomechanical properties of the tested sandstones.
4.2. Concrete Test Results
4.2.1. Uniaxial Compressive Strength of Concrete
Uniaxial compressive strength test was carried out for the produced specimens, whereas their results can be observed in Table 3. These values varied from 24 to 32 MPa after 28 days of curing. The concrete strength results are in relevant accordance with the strength of their aggregates. Concrete specimens displayed the lowest strength values that have been made by sandstones of Group I as aggregate particles (Table 2 and Table 3). More specifically, the coarse-grained sandstone that contains carbonate fossils of big size displays the worst strength value (24 MPa), value which is below the permitted limit for the concrete class C25/30. The concrete specimens, made by medium grained aggregates from Group II, displayed variety on strength values (26 to 31 MPa), whereas on the other hand those made with the finer grained aggregates from Group III showed the highest compressive strength values (30 to 32 MPa).
Table 3.
Uniaxial compressive strength test results of the concrete specimens.
4.2.2. Petrographic Characteristics of the Investigated Concretes
Careful microscopic analysis of the thin sections of the tested concrete specimens which were studied by using polarizing microscope as well as through the 3D depiction of the same thin sections showed, in general, satisfied cohesion between the aggregate particles and the cement paste among all the concrete specimens produced by the coarse-grained, the medium-grained as well as the fine-grained sandstones (Figure 5). The existence of intense content of silica cement may enhance the bonding between the sandstone aggregates and the cement paste. Even neither in concrete specimens produced by aggregates of Group I nor in those produced by aggregates of Group II and III, loss of material can be observed nor extensive interaction zones.
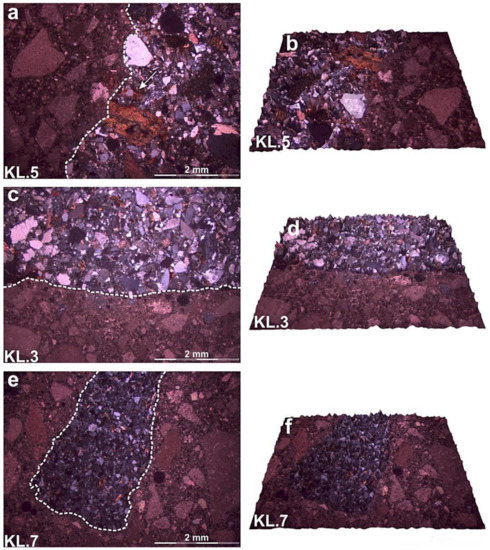
Figure 5.
Photomicrographs of representative tested concrete specimens produced by: (a) Coarse-grained sandstone aggregate; (c) medium-grained sandstone aggregate; (e) fine-grained sandstone aggregate and 3D depiction of representative tested concrete specimens produced by: (b) coarse-grained sandstone aggregate; (d) medium-grained sandstone aggregate; (f) fine- grained sandstone aggregate.
5. Discussion
5.1. The Impact of Petrographic Characteristics on the Sandstone Aggregate Properties and on the Quality of Concrete
Petrographic characteristics such as mineralogical composition, texture, particle size, alteration and weathering degree of rocks which are used as aggregate materials, constitutes the main factors influencing their properties that are critical for their suitability in various construction and industrial applications [61]. Numerous researchers have correlated physical and mechanical properties of rocks used as aggregates [62,63,64] giving clear interpretations of the relationships between them which are based on the type of the contained minerals and on their size. Petrounias et al. [65] have proved that the type of the secondary phyllosilicate minerals contained in mafic, ultramafic and intermediate and acidic volcanic rocks is the critical factor that predominately determines the physico mechanical properties of the studied rocks. Additionally, Tugrul and Zarif [66] have reported that the mean grain size is presented as a primary factor influencing the mechanical behavior of the granites which are used as concrete aggregates. More specifically, they have proved that as the mean grain size decreases, the strength of the rock increases respectively. The statistical method that is widely used to determine the relationships between different engineering parameters of rocks is the regression analysis [66,67,68]. In this paper, where sandstones from Klepa Nafpaktias were studied, strong relationships between the physical and mechanical parameters as well as among mechanical, physical, and physicochemical ones were observed using regression analysis. These correlations as they presented in Figure 6 are mainly dependent on the grain size and lesser on the mineralogical composition and on the amount of the cement. The diagrams of Figure 6 indicates that as the grain size of the investigated sandstone increases, the values of their physical properties increase while the values of their mechanical properties decrease respectively. For example from the diagram of Figure 6a we can observe that Group I, as it is classified after petrographic analysis through the petrographic microscope and verified after the new proposed petrographic analysis via GIS method and is characterized as the more coarse-grained group, presents ratio C/A 11.60 on average and higher values of porosity (nt) (Table 2) and lower resistance in abrasion and attrition (LA). Likewise in the diagram of Figure 6b Group I presented as more capable to absorb water (wa) and with lower values of uniaxial compressive strength (UCS). Diagrams of Figure 6a,b show the interaction between the physical and mechanical properties which are directly depended on the grain size of the similar mineralogical composition tested sandstones. The lower value of the mechanical strength of the coarse-grained sandstones may be a result of the low, and maybe because of the microtopography, internal attrition between the grains combined with the small percentage of cement, which leads to small angles of attrition relative to the density.

Figure 6.
(a) LA vs. total porosity (nt) of rocks; (b) compressive strength (UCS) vs. water absorption (wa) of rocks; (c) LA vs. the compressive strength (UCS) of rocks; (d) water absorption (wa) vs. the soundness test (S) of rocks.
In contrast to the comparatively finer grained sandstones, molecular internal forces are developed during the loading presenting better cohesion and bonding among the grains. Furthermore, the porosity (nt) as well as the water absorption (wa) seems to significantly be increased in the coarse sandstone rocks against the fine ones, which indicates that larger grains exhibiting weaker cohesion in contrast to the smaller are capable to adsorb more percentage of water around each grain mainly in the form of a surface layer. The diagram in Figure 6c illustrates the interaction of the mechanical properties LA and UCS directly dependent on the grain size. Several researchers have also reported similar relationships between these properties [23,65,69,70] when studying various types of rocks. In this diagram, it seems obvious that the mechanical characteristics of sandstones vary in a similar way under different type of mechanical loadings. For example, rocks of Group I (coarse-grained) present lower resistance in abrasion and attrition and lower compressive strength in contrast to those of Group III (fine-grained) which presented more resistance in abrasion and attrition and with higher strength values. In the diagram of Figure 6d, the relationship between the Soundness test (S) and the water absorption (wa) is presented, the trend of which is similar to other reported relationships between the Soundness test and physical properties by several researchers [61]. The interpretation given above regarding the ability of coarse-grained sandstones to adsorb water in their structure in contrast to the fine-grained sandstones has a strong effect on their resistance to temperature changes. All of the above theories regarding the effect of grain size on the physicomechanical properties of rocks are quantified and presented below in Figure 7. More specifically, the quantification of the number of minerals per mm2 (C/A) (calculated via GIS) seems to be strongly correlated with the physicomechanical properties of the sandstones. In Figure 7a, it can be seen that as the C/A increases, the strength of the rocks increases (Figure 7a) and their resistance in abrasion and attrition increases respectively (Figure 7b), whereas the number of minerals per mm2 increases as their porosity decreases (Figure 7c). It is noticeable that the above mentioned relationships display high coefficient of correlation (R2 = 0.72 and R2 = 0.71) (Table 4) a fact that shows that the grain size constitutes the principal but not the unique factor that influences these properties. This happens because the mineralogical composition of rocks also determines their physicomechanical properties.
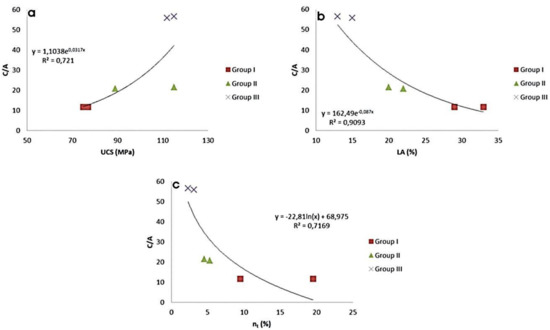
Figure 7.
(a) compressive strength (UCS) of rocks vs. the ratio C/A; (b) LA of rocks vs. the ratio C/A; (c) total porosity (nt) of rocks vs. the ratio C/A.
The results from the investigated sandstone concretes shows that they present satisfactory values of compressive strength (24.00 to 32.00 MPa) relative to other concrete specimens that have been made by andesites and serpentinites as aggregate particles [22]. These satisfactory strength results may attributed to the generally high microtopography of coarse-grained, medium-grained, as well as of fine-grained sandstones relative to the microtopography of other used rocks [22] (Figure 2b,d,f,h and Figure 4). The microtopography of the aggregates constitutes a crucial factor for the mechanical quality of the aggregate rocks and consequently for the quality of the produced concrete as it influences the cohesion and the bonding between the cement paste and the aggregate particles [1,22,23]. The only studied concrete specimen that displays lower strength (25 MPa) than the standard states is the specimen in which the used aggregate was the enriched in carbonate fossils coarse grained sandstone (Figure 2c). This fact may be the result of the lower resistance of the fossils which tend to be broken during the mechanical loading, combined with the low microtopography which they promote (Figure 3d). However, although all the investigated concrete specimens revealed satisfactory strength results, small differences in their values appeared to be dependent on the grain size of the sandstones. The diagrams in Figure 8 indicate that the aggregate properties, which are determined by the size and the number of the grains, as it is shown in Figure 7, determine the final strength of the produced concrete specimens.
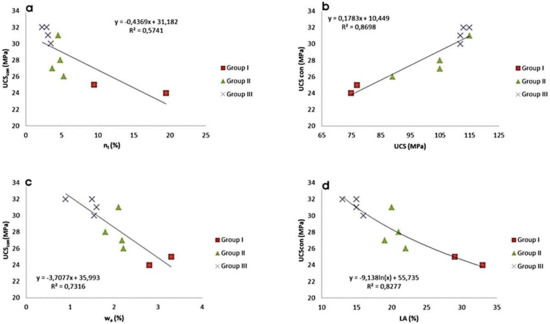
Figure 8.
(a) Total porosity (nt) of rocks vs. concrete strength (UCScon); (b) compressive strength of rocks vs. concrete strength (UCScon); (c) water absorption (wa) of rocks vs. concrete strength (UCScon); (d) LA of rocks vs. concrete strength (UCScon).
During the petrographic analysis of the tested concrete specimens, no significant failures and loss of material were observed in those produced by coarse-grained sandstones and nor extensive reaction zones, which typically occur in igneous high porosity aggregates. One possible interpretation that can be attributed is that the lower mechanical strength of concrete aggregates may depend on the higher porosity of the coarse-grained sandstones in contrast to the fine-grained ones (Table 2) which result in the greater adsorption of water which is useful during the 28 days of curing for the achievement of the optimum cohesion between the cement paste and the aggregate particles. However, such extensive areas of incomplete hydration of the cement around the grains were not observed during petrographic examination of the concrete using polarizing microscope. This may have happened because of the even distribution of the mineralogical composites of rocks as can be seen in the 3D depiction via GIS. This resulted in the even adsorption of water and consequently these zones cannot be easily perceived.
5.2. A Potential Scenario for Storage of CO2 in Sandstones from Klepa Nafpaktias
The studied area presents an appropriate geological basin environment for applying CO2 capture and storage (CCS) applications. It is well-known that the permeability of flysch formations is regarded as being generally low because of the presence of marl and clay intercalations within this type of formation. This practically impermeable sedimentary formation lies stratigraphically above the sandstones, thus providing an excellent seal caprock to keep the buoyant CO2 within the reservoir rock. This case presents many similarities with that described for the Mesohellenic Trough (NW Greece), which examined the potential of CO2 storage within porous sandstones that are overlaid be a less permeable cap rock formation [71,72,73]. In the latter case, a depth of over 800 m was regarded as suitable for trapping CO2 under supercritical conditions [73,74,75]. The sandstone samples provided from our study are highly comparable in terms of composition with sandstones from the Pentalofos formation of the Mesohellenic Trough [72]. Petrographic and mineral modal examinations reveal that the sandstones (Groups I–III) from Klepa Nafpaktias display the following modal compositions: Quartz = 24–29%; K-feldspar = 7–29%; Calcite = 1–8%; Muscovite = 1–4%; Plagioclase~0.5%; Siliceous and Calcite-bearing Cement = 42–57% (Figure 2, Table 1).
These results show that the sandstones examined include relatively higher quartz contents and less calcite compared to those located in the Mesohellenic Trough [73]. Furthermore, effective porosity of the Klepa Nafpaktias sandstones, as it was calculated through the total porosity, which is about 6% for the Group I presents higher values of effective porosity in contrast to the other two sandstone groups and tend to be lower than the Pentalofos sandstones of the Mesohellenic Trough ~ 9%.
Despite the relatively smaller storage potential presented in the region of Klepa Nafpaktias, the rather higher silica contents offers the ability of avoiding undesirable fracture development and disintegration phenomena. This is because CO2 is expected to react with calcite hosted within the sandstones; however, this would result in the formation of unstable bicarbonates, which would hinder their ability for permanent CO2 storage. Recent studies on CO2 geological storage within sandstone formations reveal the importance of feldspar and plagioclase minerals for permanent CO2 trapping [75,76,77,78].
The mineralogical composition of the studied sandstones of Group I as well as their general petrographic characteristics enhances their capacity for CO2 storage as the sufficient amounts of K-feldspars can react with injected supercritical CO2 with the following reactions (1)–(4):
2KAlSi3O8 (K-feldspar) + CO2 + 2H2O ⇒ Al2(Si2O5)(OH)4 (kaolinite) + 4SiO2 + K2CO3
3KAlSi3O8 (K-feldspar) + H2O + CO2 ⇒ KAl3Si3O10(OH)2 (illite) + 6SiO2 + K2CO3
2NaAlSi3O8 (albite) + 2CO2 + 3H2O ⇒ Al2(Si2O5)(OH)4 (kaolinite) + 4SiO2 + 2Na+ + 2HCO−3
NaAlSi3O8 (albite) + CO2 + H2O ⇒ NaAlCO3(OH)2 (dawsonite) + 3SiO2
Thus, the dissolution of alkali feldspars will lead to the precipitation of clay minerals and silica (in the form of quartz). Plagioclase, although present in smaller amounts, is also expected to produce kaolinite, as well as calcite through the successive reactions (5) and (6):
CaAl2Si2O8 (anorthite) + 2CO2 + 3H2O ⇒ Al2(Si2O5)(OH)4(kaolinite) + Ca2+ + 2HCO−3
CaAl2Si2O8 (anorthite) + H2CO3+ H2O ⇒ Al2Si4O5(OH)4(kaolinite) + CaCO3
We provide preliminary calculations that estimate the CO2 that could be stored in the frames of a potential pilot project in the studied region. For this aim, we implement this function:
CO2 Storage Capacity = Σ(V × ϕ × ρ × ε)
With V symbolizing the sandstone reservoir volume (under the flysch cap rock); ϕ denoting the effective porosity; ρ specifying the sCO2 specific gravity properties; whereas ε stands for the sCO2 storage ratio capability. We undertake a likely scenario of a test pilot project, in which we assume a volume of 5000 m (the length) × 3000 m (the width) × 500 m (the depth) = 75 × 108. Based upon the estimations of Jin et al. [75] and with reference to the statistical values of USGS modeling, we can consider the CO2 storage ratio for sandstones to be 1%. The application of this discount factor is necessary in order to obtain a realistic estimation of the sandstone reservoir storage potential. Taking the aforementioned value into consideration, as well as additional parameters that include the average sandstone effective porosity values from our studied site (6%) and the specific gravity considered for CO2 under supercritical conditions (a value of 400 kg/m3 in pressure and temperature conditions of 10 MPa and 50 °C respectively [79]), it is assessed that the demarcated area could potentially store an amount of 18 × 105 tons of CO2.
We also consider Equation (12) of Jin et al. [75] to calculate the quantity of CO2 trapped by feldspars (K-feldspar and plagioclase minerals, where these amounts Κ-feldspar = 23–34%; Plagioclase = ~1% resulted from the reduction of the initial amounts without the cement):
mCO2 Feldspar = [pFeldspar × V × (1 − φ) × ΧFeldspar × MCO2 × R]/MFeldspar
With V symbolizing the sandstone reservoir volume, ϕ denoting the effective porosity, pFeldspar expresses the feldspar density (2.55–2.67 × 10³, 2.55–2.60 × 10³ and 2.75–2.76 × 10³ kg/m3 for K-feldspar, albite and anorthite respectively), MFeldspar is molecular weight (279.07, 262.96 and 278.94 for K-feldspar, albite and anorthite respectively) R is the ratio of feldspar mineral to CO2 0.5, 1 and 1 for K-feldspar, albite and anorthite respectively), ΧFeldspar the proportions of feldspar minerals, MCO2 is the total CO2 storage capacity of mineral trapping. By applying this equation upon alkali feldspars and plagioclase the results calculated for the CO2 that can be permanently trapped within the sandstone formation is ~6 × 10⁵ tons, which is less by almost approximately 1/3 of the storage potential calculated with the previous method. This is due to the fact that the latter equation does not consider calcite crystallization as a stable mineral phase. Nevertheless, considering both cases, it is evident that the sandstones of the Klepa Nafpaktias region are capable of storing sufficient amounts of CO2. This is even more evident taking into consideration that region’s sandstones and flysch formations encompasses an even wider area and thus could allow for the deployment of larger-scale CO2 storage projects, provided that the proposed pilot test is deployed successfully.
6. Conclusions
In this paper, sandstones of various petrographic characteristics derived from Klepa Nafpaktias were examined in order to evaluate their suitability in construction (concrete) and environmental applications (CO2 storage). For the first time, the petrographic study of rocks such as of those sandstones were carried out by using classic petrographic methods (observation through polarizing microscope) combined with modern tools of quantification of modal composition (GIS proposed method) and 3D depictions of their petrographic features (3D Builder software). The above mentioned study leads to the following concluding remarks:
- Three groups of sandstones were detected according to their petrographic features regarding the grain size (coarse, medium and fine-grained size).
- The above classification of rocks was retained in their physicomechanical and physicochemical properties as well as in the final strength of the produced concrete specimens.
- The petrographic observation of thin sections of the concrete specimens combined with the results of their mechanical strength revealed that the studied sandstones are suitable for concrete aggregates (Groups I–III) except one coarse-grained sample (K.L9 (Group I)) which contains intense amount of carbonate fossils presenting lower concrete strength than the standard states.
- The proposed ratio C/A (crystals/mm2) seems to influence the aggregate properties which constitute critical factors for the final concrete strength, presenting the more fine-grained sandstones as the most suitable for concrete aggregates.
- The petrographic characteristics of the sandstones from Klepa Nafpaktias and their porosity values reveal that the coarse-grained samples (Group I) is more capable for potential CO2 storage.
- Preliminary calculations suggest that a potential pilot project can store an amount of up to 18 × 105 tons CO2. The size of the sandstones formation provides the necessary basis for examining the deployment of an even larger scale pilot test that suggested from the present study.
Author Contributions
P.P. was involved in the field data collection, participated in most of the laboratory testing’s, result interpretation and paper writing; P.P.G. was involved in the field data collection, participated in most of the laboratory testing’s, and contributed to paper writing; A.R. was involved in the field data collection, interpretation, and assisted in the paper writing; M.K. was involved in the field data collection, modified the geological map and performed the GIS analysis; P.K. participated by conducting data interpretation and assisted in part of the paper writing; M.-E.D. was involved in the field data collection and in some of the of the laboratory testing’s and N.K. participated by conducting data interpretation and assisted in the paper writing. All authors have read and agreed to the published version of the manuscript.
Funding
Our research study has not received any form funding from external sources.
Acknowledgments
We would like to thank A.K Seferlis for his help concerning the SEM performed work (Lab of Electron Microscopy & Microanalyses, University of Patras).
Conflicts of Interest
No conflicts of interest are declared.
References
- Petrounias, P.; Giannakopoulou, P.P.; Rogkala, A.; Lampropoulou, P.; Tsikouras, B.; Rigopoulos, I.; Hatzipanagiotou, K. Petrographic and Mechanical Characteristics of Concrete Produced by Different Type of Recycled Materials. Geosciences 2019, 9, 264. [Google Scholar] [CrossRef]
- Farzadnia, N.; Abang, A.A.A.; Demirboga, R.; Anwar, M.P. Effect of halloysite nanoclay on mechanical properties, thermal behavior and microstructure of cement mortars. Cem. Concr. Res. 2013, 48, 97–104. [Google Scholar] [CrossRef]
- Tamanna, N.; Sutan, N.M.; Lee, D.T.C. Utilization of Waste Glass in Concrete. In Proceedings of the 6th International Engineering Conference, Energy and Environment (ENCON), 1–4 July; Research Publishing: Wuhan, China, 2013. [Google Scholar]
- Castro, S.; Brito, J. Evaluation of the durability of concrete made with crushed glass aggregates. J. Clean. Prod. 2013, 41, 7–14. [Google Scholar] [CrossRef]
- Abdallah, S.; Fan, M. Characteristics of concrete with waste glass as fine aggregate replacement. J. Eng. Technol. Res. 2014, 2, 11–17. [Google Scholar]
- Jani, W.; Hogland, W. Waste glass in the production of cement and concrete—A review. J. Envir. Chem. Eng. 2014, 2, 1767–1775. [Google Scholar] [CrossRef]
- Meng, Y.; Ling, T.G.; Mo, K.H. Recycling of wastes for value-added applications in concrete blocks: An overview. Resour. Conserv. Recycl. 2018, 138, 298–312. [Google Scholar] [CrossRef]
- Poon, C.S.; Chan, D. Paving blocks made with recycled concrete aggregate and crushed clay brick. Constr. Build. Mater. 2006, 20, 569–577. [Google Scholar] [CrossRef]
- Vanitha, S.; Natrajan, V.; Prada, M. Utilization of waste plastics as a partial replacement of coarse aggregate in concrete blocks. Indian J. Sci. Technol. 2015, 8, 256–268. [Google Scholar] [CrossRef]
- Jackson, N. Civil Engineering Materials; Macmillan Press Ltd.: London, UK, 1981. [Google Scholar]
- LaLonde, W.S.; Janes, M.F. Concrete Engineering Handbook; Library of Congress: New York, NY, USA, 1961. [Google Scholar]
- US Concrete Industry Report; Library of Congress: New York, NY, USA, 2001.
- Neville, A.M. Properties of Concrete, ELSB, 5th ed.; Pearson Education Publishing Ltd.: London, UK, 2005. [Google Scholar]
- Taylor, G.D. Materials in Construction, 2nd ed.; Longman Group Ltd., Longman House, Burnt Mill: Harlow, UK, 1994. [Google Scholar]
- Neville, A.M. Properties of Concrete, 4th ed.; Pitman: London, UK, 1995. [Google Scholar]
- Al-Oraimi, S.K.; Taha, R.; Hassan, H.F. The effect of the mineralogy of coarse aggregate on the mechanical properties of high-strength concrete. Constr. Build. Mater. 2006, 20, 499–503. [Google Scholar] [CrossRef]
- Mackechnie, J.R. Shrinkage of concrete containing greywake sandstone aggregate. ACI Mater. J. 2006, 103, 390–396. [Google Scholar]
- Rodgers, M.; Hayes, G.; Healy, M.G. Cyclic loading tests on sandstone and limestone shale aggregates used in unbound forest roads. Constr. Build. Mater. 2009, 23, 2421–2427. [Google Scholar] [CrossRef]
- Verstrynge, E.; Schueremans, L.; Van Gement, D. Creep and failure prediction of diestian ferruginous sandstone: Modelling and repair options. Constr. Build. Mater. 2012, 29, 149–157. [Google Scholar] [CrossRef][Green Version]
- Kumar, S.; Gupta, R.C.; Shrivastava, S. Strength, abrasion and permeability studies on cement concrete containing sandstone coarse aggregates. Constr. Build. Mater. 2016, 125, 884–891. [Google Scholar] [CrossRef]
- Yilmaz, M.; Tugrul, A. The effects of different sandstone aggregates on concrete strength. Constr. Build. Mater. 2012, 35, 294–303. [Google Scholar] [CrossRef]
- Petrounias, P.; Giannakopoulou, P.P.; Rogkala, A.; Stamatis, P.M.; Tsikouras, B.; Papoulis, D.; Lampropoulou, P.; Hatzipanagiotou, K. The Influence of Alteration of Aggregates on the Quality of the Concrete: A Case Study from Serpentinites and Andesites from Central Macedonia (North Greece). Geosciences 2018, 8, 115. [Google Scholar] [CrossRef]
- Petrounias, P.; Giannakopoulou, P.P.; Rogkala, A.; Stamatis, P.M.; Lampropoulou, P.; Tsikouras, B.; Hatzipanagiotou, K. The Effect of Petrographic Characteristics and Physicomechanical Properties of Aggregates on the Quality of Concrete. Minerals 2018, 8, 577. [Google Scholar] [CrossRef]
- Li, Y.; Onasch, M.C.; Guo, Y. GIS-based detection of grain boundaries. J. Struct. Geol. 2008, 30, 431–443. [Google Scholar] [CrossRef]
- Barraud, J. The use of watershed segmentation and GIS software for textural analysis of thin sections. J. Volcanol. Geotherm. Res. 2006, 154, 17–33. [Google Scholar] [CrossRef]
- Fernandez, F.J.; Menendez-Duarte, R.; Aller, J.; Bastida, F. Application of geographical information systems to shape-fabric analysis. In High-Strain Zones: Structure and Physical Properties, 245; Bruhn, D., Burlini, L., Eds.; Geological Society of London Special Publication: London, UK, 2005; pp. 409–420. [Google Scholar]
- Tarquini, S.; Favalli, M. A Microscopic Information System (MIS) to assist in petrographic analysis. Comput. Geosci. 2010, 36, 665–674. [Google Scholar] [CrossRef]
- Becattini, V.; Motmans, T.; Zappone, A.; Madonna, C.; Haselbacher, A.; Steinfeld, A. Experimental investigation of the thermal and mechanical stability of rocks for high-temperature thermal-energy storage. Appl. Energy 2017, 203, 373–389. [Google Scholar] [CrossRef]
- Kuravi, S.; Trahan, J.; Goswami, D.Y.; Rahman, M.M.; Stefanakos, E.K. Thermal energy storage technologies and systems for concentrating solar power plants. Prog. Energy Combust. Sci. 2013, 39, 285–319. [Google Scholar] [CrossRef]
- Khare, S.; Dell’ Amico, M.; Knight, C.; Mc Garry, S. Selection of materials for hightemperature sensible energy storage. Solar Energy Mater. Solar Cells 2013, 115, 114–122. [Google Scholar] [CrossRef]
- Allen, K.G.; von Backström, T.W.; Kröger, D.G.; Kisters, A.F.M. Rock bed storage for solar thermal power plants: Rock characteristics, suitability, and availability. Solar Energy Mater. Solar Cells 2014, 126, 170–183. [Google Scholar] [CrossRef]
- Tiskatine, R.; Eddemani, A.; Gourdo, L.; Abnay, B.; Ihlal, A.; Aharoune, A.; Bouirden, L. Experimental evaluation of thermo-mechanical performances of candidate rocks for use in high temperature thermal storage. Appl. Energy 2016, 171, 243–255. [Google Scholar] [CrossRef]
- Karakitsios, V.; Tzortzaki, E.; Giraud, F.; Pasadakis, N. First evidence for the early Aptian Oceanic Anoxic Event (OAE1a) from the Western margin of the Pindos Ocean (NW Greece). Geobios 2018, 51, 187–210. [Google Scholar] [CrossRef]
- Robertson, A.H.F.; Karamata, S. The role of subduction-accretion processes in the tectonic evolution of the Mesozoic Tethys in Serbia. Tectonophysics 1994, 234, 73–94. [Google Scholar] [CrossRef]
- Aubouin, J.; Bonneau, M.; Davidson, G.J.; Leboulenger, P.; Matesko, S.; Zambetakis, A. Esquisse structurale de l’Arc egeen externe: Des Dinarides aux Taurides. Bull. Soc. Géol. Fr. 1976, 7, 327–336. [Google Scholar] [CrossRef]
- Bernoulli, D.; De Graciansky, P.C.D.; Monod, O. The extension of the Lycian Nappes (SW Turkey) into the Southeastern Aegean Islands. Eclogae Geol. Helv. 1974, 67, 39–90. [Google Scholar]
- Argyriadis, I.; De Graciansky, P.C.; Marcoux, J.; Ricou, L.E. The opening of the Mesozoic Tethys between Eurasia and Arabia-Africa. In Proceedings of the Geologie des Chaınes Alpines Issues de la Tethys, 26th International Geological Congress, Colloque C5, Paris, France, 7–17 July 1980; Aubouin, J., Debelmas, J., Latreille, M., Eds.; Bureau de Recherches Geologiques et Minieres Memoire: Paris, France, 1980; Volume 115, pp. 199–214. [Google Scholar]
- Kafousia, N.; Karakitsios, V.; Jenkyns, H.C.; Mattiolis, E. A global event with a regional character: The Early Toarcian Oceanic Anoxic Event in the Pindos Ocean (northern Peloponnese, Greece). Geol. Mag. 2011, 148, 619–631. [Google Scholar] [CrossRef]
- Fleury, J.J. Les zones de Gavrovo-Tripolitza et du Pinde-Olonos (Grece continentale et Peloponese du nord) Evolution d’une plate-forme et d’un basin dans leur cadre alpin. Soc. Geol. Nord 1980, 4, 1–473. [Google Scholar]
- De Wever, P.; Baudin, F. Palaeogeography of radiolarite and organic-rich deposits in Mesozoic Tethys. Geol. Rundsch. 1996, 85, 310–326. [Google Scholar] [CrossRef]
- Clift, P.D. The collision tectonics of the southern Greek Neotethys. Geol. Rundsch. 1992, 81, 669–679. [Google Scholar] [CrossRef]
- Degnan, P.J.; Robertson, A.H.F. Mesozoic–early Tertiary passive margin evolution of the Pindos Ocean (NW Peloponnese Greece). Sediment. Geol. 1998, 117, 33–70. [Google Scholar] [CrossRef]
- Pe-Piper, G. The nature of Triassic extension-related magmatism in Greece: Evidence from Nd and Pb isotope geochemistry. Geol. Mag. 1998, 135, 331–348. [Google Scholar] [CrossRef]
- Neumann, P.; Zacher, W. The Cretaceous sedimentary history of the Pindos Basin Greece. Int. J. Earth Sci. 2004, 93, 119–131. [Google Scholar] [CrossRef]
- Jones, G.; Robertson, A.H.F.; Cann, J.R. Genesis and emplacement of the suprasubduction zone Pindos Ophiolite, Northwestern Greece. In Ophiolite Genesis and Evolution of the Oceanic Lithosphere; Peters, T., Nicolas, A., Coleman, S., Eds.; Sultanate of Oman Ministry of Petroleum and Minerals: Muscat, Oman, 1991. [Google Scholar]
- Konstantopoulos, P.A.; Zelilidis, A. Sedimentation of submarine fan deposits in the Pindos foreland basin, from late Eocene to early Oligocene, west Peloponnesus peninsula, SW Greece. Geol. J. 2013, 48, 335–362. [Google Scholar] [CrossRef]
- Faupl, P.; Pavlopoulos, A.; Migiros, G. On the provenance of flysch deposits in the External Hellenides of mainland Greece: Results from heavy mineral studies. Geol. Mag. 1999, 135, 412–442. [Google Scholar] [CrossRef]
- Vakalas, I. Evolution of Foreland Basins in Western Greece. Ph.D. Thesis, University of Patras, Patras, Greece, 2004. [Google Scholar]
- Loftus, D.L.; Matarangas, D.; Zindros, G.; Katsikatsos, G. Geological Map of Greece, Klepa Sheet, 1:50,000; IGME: Athens, Greece, 1984. [Google Scholar]
- Part 1: Composition, Specifications and Conformity Criteria for Common Cements; EN 197-1; European Standard: Warsaw, Poland, 2011.
- Part 3: Procedure and Terminology for Simplified Petrographic Description; EN 932; European Standard: Warsaw, Poland, 1996.
- Methods for Sampling and Testing of Mineral Aggregates, Sands and Fillers, Part 1: Methods for Determination of Particle Size and Shape; BS 812; British Standard Institution: London, UK, 1975.
- ISRM Suggested Methods. Rock Characterization Testing and Monitoring; Brown, E., Ed.; Pergamon Press: Oxford, UK, 1981. [Google Scholar]
- EN 1367-2. Tests for Thermal and Weathering Properties of Aggregates—Part 2: Magnesium Sulfate Test; European Committee for Standardization: Brussels, Belgium, 1999. [Google Scholar]
- EN 1097-6. Tests for Mechanical and Physical Properties of Aggregates—Part 6: Determination of Particle Density and Water Absorption; European Committee for Standardization: Brussels, Belgium, 2000. [Google Scholar]
- ASTM C-131. Resistance to Abrasion of Small-Size Coarse Aggregate by Use of the Los Angeles Machine; American Society for Testing and Materials: Philadelphia, PA, USA, 1989. [Google Scholar]
- Standard Test Method for Unconfined Compressive Strength of Intact Rock Core Specimens; ASTM D 2938-95; American Society for Testing and Materials: West Conshohocken, PA, USA, 2002.
- Standard for Selecting Proportions for Normal, Heavyweight and Mass Concrete; ACI-211.1-91; American Concrete Institute: Farmington Hills, MI, USA, 2002.
- Part 3: Testing Hardened Concrete. Compressive Strength of Test Specimens; British Standard Institution: London, UK, 2009; BS EN 12390.
- Standard Practice for Petrographic Examination of Hardened Concrete; ASTM C856; American Society for Testing and Materials: West Conshohocken, PA, USA, 2017.
- Rigopoulos, I.; Tsikouras, B.; Pomonis, P.; Hatzipanagiotou, K. The impact of petrographic characteristics on the engineering properties of ultrabasic rocks from northern and central Greece. Q. J. Eng. Geol. Hydrogeol. 2012, 45, 423–433. [Google Scholar] [CrossRef]
- Smith, M.R.; Collis, L. Aggregates: Sand, Gravel and Crushed Rock Aggregates for Construction Purposes; Spec. Publ. 17; The Geological Society: London, UK, 2001. [Google Scholar]
- Hartley, A. A review of the geological factors influencing the mechanical properties of road surface aggregates. Q. J. Eng. Geol. 1974, 7, 69–100. [Google Scholar] [CrossRef]
- Barttli, B. The influence of geological factors on the mechanical properties of basic igneous rocks used as road surface aggregates. Eng. Geol. 1992, 33, 31–44. [Google Scholar] [CrossRef]
- Petrounias, P.; Giannakopoulou, P.P.; Rogkala, A.; Lampropoulou, P.; Koutsopoulou, E.; Papoulis, D.; Tsikouras, B.; Hatzipanagiotou, K. The Impact of Secondary Phyllosilicate Minerals on the Engineering Properties of Various Igneous Aggregates from Greece. Minerals 2018, 8, 329. [Google Scholar] [CrossRef]
- Turgul, A.; Zarif, I.H. Correlation of mineralogical and textural characteristics with engineering properties of selected granitic rocks from Turkey. Eng. Geol. 1999, 51, 303–317. [Google Scholar]
- Rigopoulos, I.; Tsikouras, B.; Pomonis, P.; Hatzipanagiotou, K. Correlations between petrographic and geometrical properties of ophiolitic aggregates from Greece. Bull. Eng. Geol. Environ. 2014, 73, 1–12. [Google Scholar] [CrossRef]
- Escartin, J.; Hirth, G.; Evans, B. Strength of slightly serpentinized peridotites: Implications for the tectonics of oceanic lithosphere. Geology 2001, 29, 1023–1026. [Google Scholar] [CrossRef]
- Giannakopoulou, P.P.; Petrounias, P.; Rogkala, A.; Tsikouras, B.; Stamatis, P.M.; Pomonis, P.; Hatzipanagiotou, K. The influence of the mineralogical composition of ultramafic rocks on their engineering performance: A case study from the Veria-Naousa and Gerania ophiolite complexes (Greece). Geosciences 2018, 8, 251. [Google Scholar] [CrossRef]
- Giannakopoulou, P.P.; Petrounias, P.; Tsikouras, B.; Kalaitzidis, S.; Rogkala, A.; Hatzipanagiotou, K.; Tombros, S.F. Using Factor Analysis to Determine the Interrelationships between the Engineering Properties of Aggregates from Igneous Rocks in Greece. Minerals 2018, 8, 580. [Google Scholar] [CrossRef]
- Koukouzas, N.; Ziogou, F.; Gemeni, V. Preliminary assessment of CO2 geological storage opportunities in Greece. Int. J. Greenh. Gas Con. 2009, 3, 502–513. [Google Scholar] [CrossRef]
- Tassianas, A.; Koukouzas, N. CO2 Storage Capacity Estimate in the Lithology of the Mesohellenic Trough, Greece. Energy Procedia 2016, 86, 334–341. [Google Scholar] [CrossRef]
- Koukouzas, N.; Kypritidou, Z.; Purser, G.; Rochelle, C.A.; Vasilatos, C.; Tsoukalas, N. Assessment of the impact of CO2 storage in sandstone formations by experimental studies and geochemical modeling: The case of the Mesohellenic Trough, NW Greece. Int. J. Greenh. Gas Con. 2018, 71, 116–132. [Google Scholar] [CrossRef]
- Shafeen, A.; Croiset, E.; Douglas, P.L.; Chatzis, I. CO2 sequestration in Ontario, Canada. Part I: Storage evaluation of potential reservoirs. Energy Convers. Manag. 2004, 45, 2645–2659. [Google Scholar] [CrossRef]
- Jin, C.; Liu, L.; Li, Y.; Zeng, R. Capacity assessment of CO2 storage in deep saline aquifers by mineral trapping and the implications for Songliao Basin, Northeast China. Energy Sci. Eng. 2017, 5, 81–89. [Google Scholar] [CrossRef]
- Ryoji, S.; Thomas, L.D. Experiment al study on water-rock interactions during CO2 flooding in the Tensleep Formation, Wyoming, USA. Appl. Geochem. 2000, 15, 265–279. [Google Scholar]
- Robert, J.R.; Tamer, K.; James, L.P. Experiment al investigation of CO2- brine-rock interactions at elevated temperature and pressure: Implications for CO2 sequestration in deep-saline aquifers. Fuel Process. Technol. 2005, 86, 1581–1597. [Google Scholar]
- Ryzhenko, B.N. Genesis of dawsonite mineralization: Thermo-dynamic analysis and alt ernative. Geochem. Int. 2006, 44, 835–840. [Google Scholar] [CrossRef]
- Spycher, N.; Pruess, K. CO2-H2O Mixtures in the Geological Sequestration of CO2. II. Partitioning in Chloride Brines at 12–100 °C and up to 600 bar. Geochim. Cosmochim. Acta 2005, 69, 3309–3320. [Google Scholar] [CrossRef]
© 2020 by the authors. Licensee MDPI, Basel, Switzerland. This article is an open access article distributed under the terms and conditions of the Creative Commons Attribution (CC BY) license (http://creativecommons.org/licenses/by/4.0/).