Energy Potential Mapping: Open Data in Support of Urban Transition Planning


1
Faculty of Architecture and the Built Environment, Department of Architectural Engineering + Technology, Delft University of Technology, 2628 BL Delft, The Netherlands
2
Department of Planning, Design and Technology of Architecture, Sapienza University, 00185 Rome, Italy
*
Author to whom correspondence should be addressed.
Energies 2020, 13(5), 1264; https://doi.org/10.3390/en13051264
Submission received: 15 November 2019
/
Revised: 24 February 2020
/
Accepted: 25 February 2020
/
Published: 9 March 2020
(This article belongs to the Special Issue Open Data and Energy Analytics)
Abstract
:Cities play a key role in driving the transition to sustainable energy. Urban areas represent between 60% and 80% of global energy consumption and are a significant source of CO2 emissions, making energy management at the urban scale an important area of research. Urban energy systems have a strong influence on the environment, economy, social dimensions and urban spatial planning. Energy consumption affects the urban microclimate, urban comfort, human health, and conversely, urban physical, economic and social characteristics affect the energy urban profile. In order to improve the quality of energy strategies, policies, and plans, local authorities need decision support tools, like energy potential mapping, which have risen significance in the last decades. Energy data are crucial for those tools. They can increase the quality and effectiveness of energy planning but also support the integration between energy and spatial planning. Energy data can also stimulate citizen engagement as well as encourage sustainable behaviours and CO2 emission reduction. This paper aims to increase the practice of data-aware planning, through the study of problems in energy data acquisition and processing observed in European projects focused on developing energy mapping tools. The problems observed attend to two main areas: technical and socio-economic issues. Those were derived from a comparison of energy mapping tools, and the work conducted for the PLANHEAT development. The scope of the research is to understand the main recurring issues in energy data acquisition and processing, in order to overcome the barriers in data availability. Increasing awareness of the relevance of energy data can foster the use of energy mapping tools, increasing the quality of energy policies and planning.
1. Introduction
Human society is facing an unprecedented challenge. The extended use of fossil fuels as a source of CO2 emissions has been the main driver of global climate change, and the built environment is playing a significant part in this. Changing urban planning practices is considered a primary component of the pathways towards climate mitigation [1,2]. In order to plan for the transition towards residual and renewable energy within this built environment, the nature of the urban fabric and local circumstances are highly important, yet often poorly mapped and quantified.
The availability of open data [3] contributes to the political, social and economic development of a country. Public administrations are often not aware of the value data can bring to societies, quality of life, environmental protection and energy turn. In order to accomplish this, data must be available, accessible, user-friendly, and reusable [4,5]. In this sense, energy data (e.g, data about energy demand and local renewable energy sources) are crucial to innovate and increase the efficacy of urban energy policy and urban energy planning.
The urgency of countering climate change [1] spurs local governments to define their energy strategies, emission targets, as well as sustainability agendas, spurs local governments to define their energy strategies, emission targets, as well as sustainability agendas, but in many cases, these are lists of well-meant intentions, rather than operative actions, and not easy to translate into specific interventions. The reason behind this is that urban energy policies are not directly based on real data and information, but on top-down, aggregated estimations of the city energy profile (i.e., the urban energy performance in terms of energy demand, energy local sources, and the future trend of energy demand and supply). The city energy profile is however strongly related to urban shape, geometry and physical characteristics [6,7,8,9,10,11]. Energy demand and energy sources are rarely distributed homogenously within the city. Some areas show high energy consumption, and waste, whereas others exhibit energy poverty issues; and there are areas with high resource availability, while in others, locally available resources cannot satisfy the demand [12].
Many studies [7,8,13,14,15] show that, in the long term, the most suitable opportunities to influence energy consumption and the related CO2 emissions are represented by the decisions taken in the field of urban planning. These decisions concern the land use, the design of public and private mobility, the urban waste system (i.e., collection and recycling process), the water system (i.e., supply and water treatment), the energy production from renewable sources (Spatial planners must find optimal locations for windmills, biomass and solar power plants as well as energy storage systems. At the same time conflicts with competing uses and the environment have to be minimized.) and its distribution; the green system and of course the design of buildings. The irregular spatial distribution of energy demand and supply sources within cities show a need for understanding the different relationships between energy and urban characteristics. These considerations find in the urban energy map a tool able to give effective support to the decision-making and planning process [11,16,17].
Energy mapping tools can give a spatial dimension to the energy issue and provide a means of understanding the relationships between urban and energy factors. The energy map aims to clarify the characteristics of a specific energy pattern (demand, supply, production and distribution), through the spatial visualization of energy data, which can support “informed” interventions, suggest strategies, and identify priorities and the most suitable locations for energy district developments. The energy map may be also a good basis to trigger an informed debate on the choices to take: an ideal catalyst for discussions and for defining shared objectives.
The term “energy mapping” is not officially defined, and because of the complexity of the subject, encompasses a wide range of implementations. Over the last decade, cities have developed different tools to increase their capacity to evaluate the availability of renewable energy sources (such as solar maps, geothermal maps) connected to the energy consumption and demand (heating and cooling maps). Several techniques, methods and objectives have been developed, some only in empirical form, others have been coded at the operational level, identifying steps of implementation [11,13,18].
All of these rely on sufficient availability of (geo) data. The literature on energy mapping instruments [11,13,16,19,20,21,22,23] offers a summary of the variables that an energy map should contain and integrate: the spatial distribution of the energy demand (electricity and heating/cooling energy demand); the spatial distribution of population; the land use; the characteristics of the building stock (use, year of construction, height of buildings, etc.); polluting emissions resulting from energy consumption; the spatial distribution of RES (Renewable Energy Sources, such as solar, solar thermal, wind, both in-land and off-shore, hydroelectric, geothermal, from biomass, from reconversion of excess heat, from waste-to-energy, etc.); heating degree hours (HDH); the presence and location of anchor loads; the design of energy grids; the location and size of expansion plans (residential, commercial, etc.); some specific barriers such as the presence of protected areas (frequently in the heritage and ecology categories); the mobility system; and possibly socio-economic indicators to identify the poorest or most degraded areas.
The innovative nature and the benefits of using an energy mapping tool have not necessarily resulted in swift implementation. One of the main difficulties is a lack of suitable data, that is also available to the urban planner. Access to energy data is essential to developing the appropriate tools and improve the ability to make decisions that merge physical-spatial issues with energy-environmental ones. “Making urban data accessible” is therefore becoming a fundamental prerequisite for urban innovation [24], and for increasing the quality of energy-related policies. Energy data should be accurate and based on real acquisition (in order to reduce the inaccuracies associated with estimation), geospatially referenced, and measured at short temporal intervals over at least a year (in order to account for both peaks and seasonal fluctuations).
Fortunately, the digital revolution is offering significant perspectives in terms of data acquisition, processing and use, providing new opportunities for urban investigation. New technologies improve the ability to analyse the urban energy profile (for instance smart meters–now also available for gas consumption), and can allow for a very detailed and real-time view of consumption (but also the use of mobile devices-mobile phones, tablets, etc.–for recording consumption and citizen habits, able to influence also people behaviour).
Aims and Objectives
This study builds upon the work conducted during the Horizon 2020 funded European PLANHEAT project, which started in 2016 [22]. The main objective of PLANHEAT is to develop an integrated tool, a potential energy map, which will empower public authorities (cities and regions) in the development of sustainable energy plans, with a special focus on distributed heat (cold) networks and energy district design. The PLANHEAT tool supports local authorities by providing:
- thermal energy (heat and cold) demand mapping;
- local potential mapping for distributed low carbon energy sources;
- forecasted demand mapping;
- a planning tool for defining scenarios which will be sustainable, feasible, and environmentally friendly based on the usage of renewable energy sources (as well as highly efficient cogeneration and district heating);
- a tool to understand the interactions of planned scenarios with already existing infrastructure such as district heating, gas and electricity networks and transport sector, etc.;
- a simulation module that calculates demand, supply and storage behaviour over a year and provides data on technical, environmental, economic and social impacts;
- a scenario evaluation instrument which allows for both a baseline and user defined scenario comparison [25]
Both the development of the PLANHEAT toolkit and its use require collecting energy related data. Thus, an assessment was made early on in the project, in order to discover the main issues related to the availability and quality of these types of data (both open and internal/proprietary data), as experienced by the toolkit’s intended end users [25]. Through questionnaires and interviews, 26 cities in 8 countries (France, Belgium, Italy, Greece, Netherlands, Hungary, Croatia, and Spain) were asked to evaluate the rate of data openness in 7 data categories: heat demand, heat supply, transport sector, census information, energy audits, knowledge and motivation, and finally, the connection of local and national plans. The results showed that every country involved has more than 50% of the types of data considered available publicly [18,19,20,21,22,23,24,25], however local authorities highlighted structural difficulties in reaching and using these data [25]. Even if datasets exist, getting the required data (for example when the data owner is another stakeholder) sometimes proves difficult, and they may require processing or interpreting if the data was recorded for different purposes.
These results bring forward the need of investigating in greater detail the reasons behind those difficulties, with the aim of increasing the capacity of PLANHEAT to provide a useful toolkit and increase its usability by municipalities with varying levels of access to energy data. Thus, other projects with similar goals were analysed, with the aim to understand which type of data they used, how they collected them and which problems they had to deal with. The comparison between the difficulties emerged in these projects those that emerged in the PLANHEAT interviews made it possible to find similarities and common issues useful to determinate the main barriers in developing and using energy maps.
The scope of this paper is to understand the nature of commonly recurring problems in accessing and processing energy data. These problems can limit the usability of energy mapping tools by local authorities. Identifying the main issues assists in making these instruments more adaptable and therefore more effective, in terms of supporting energy turn and the decision-making process. Furthermore, this can also help improve the normative framework related to open data policies, and the elaboration of data standards and licenses for publication, which in turn may increase the future availability of suitable energy data.
2. Materials and Methods
This paper points out two main problems related to energy data availability and usability: technical issues (spatial and temporal resolution) and socio-economic issues (privacy, financial costs, ownership, concurrence, etc.). These two categories of problems raise from (1) the interviews conducted during the preliminary phase of the PLANHEAT project [25] and (2) from a comparative analysis of energy mapping projects and experiences, listed in Table 1.
In order to have a better understanding of the shared and common difficulties occurring in the energy data access and processing for developing energy maps, both a literature review and a study on European projects have been conducted. The intention of studying projects only in Europe comes from the need to remain under the same normative energy efficiency and data legislation. The literature review is built based on material collected through searching scholarly databases, mainly Scopus.com and Sciencedirect.com, using keywords including: “Urban energy maps”; “Urban energy mapping tools”; “Urban energy atlas”; “Energy web maps”; “Energy decision-support tools”. For the selection of EU (European Union) projects, the research has been conducted on the European Commission web site, which collects all projects funded by topic. At the section Intelligent energy Europe, the projects have been selected in the categories: “Energy efficiency”; “Integrated initiatives”; “Heating and cooling” (https://ec.europa.eu/energy/intelligent/projects/). From this initial, wide range of energy mapping projects (EU projects and academic/institution ones) related to urban energy mapping tools, a selection was made of those deemed most suitable for comparison, from the perspective of evaluating the difficulties in collecting and processing data, as shown in Table 1. These projects provided sufficient information on the applied methodologies, the type of data used, and the results achieved for evaluation. Other projects found did not allow sufficient in-depth study for the analysis conducted, either because data collection was not a significant element, or because the underlying model is proprietary.
For each project, an analysis was made of the aim and type of the project; the steps of implementation; its status (ongoing, ended); the type of tool developed and its usability; the spatial scale(s) used; and the type of (geo) data used. The study focuses on building bound energy data availability and processing, intending to raise the most recurring problems, which can reduce the implementation of energy potential maps by local authorities. The aim of the paper is to increase data-aware planning and policy-making in the field of energy planning and urban energy policies, by identifying opportunities and solutions for problems with data acquisition and processing. This helps to improve the effectiveness of energy mapping tools and makes their usage more affordable for the large number of smaller local authorities.
In the majority of these projects either open data is used, but the level of detail is low (city/region/country), or the detail level is high (below city level), but the user is required to input significant amounts of private data to get to the planning stage.
3. Energy Planning Data: An Overview of Problems and Issues
Although all these projects are intended for energy planning, and supporting local and regional authorities, their specific implementation varies. In some cases the end result was an energy atlas, in others a spatial and/or quantitative decision support tool for the built environment. They do all share a requirement for and ability to use (geo) data in order to provide their potentials and assessments.
Furthermore, they benefit from more accurate data to be able to represent the real energy profile of the city [12,26,27,40]. Open energy data can create both economic as well as social value [5]. Those are largely driven by the level of openness and the cost of availability.
The first step for increasing the energy relevance into a planning process is the definition of which energy data are relevant at which steps and phases [26,41]. It allows more directed collection of data and avoids loss of time and resources. The second step should be a general overview of data owners and stakeholders. It is necessary to clarify which stakeholders are crucial for which elements [42], to increase the participation and understand which type of data is available and who can provide them (private bodies, public offices, European or international agencies). If the data needed are still not available, local authorities could consider building a new dataset. This process incurs a cost however, which may be a significant hurdle for small organisations.
In most cases, energy related datasets are available [43]. Municipalities, for example, have data about the floor space, year of construction, and building function (office, residential etc.). Energy and infrastructure companies have billing data that refers to the energy consumption of their clients. Standard renewable energy potentials, like for example solar (photovoltaic or thermal), are increasingly available at a high detail level due to their relatively low input requirements. In this case it is possible to use information on roof surface, slope and orientation, all covered by a high-resolution DEM that is an open-source dataset, with solar radiation data acquired from meteorological institutes (usually available as open data) to calculate roof potential [25].
However, in many cases, the use of datasets faces several challenges. From the comparative study of energy mapping and energy analysis tools (Table 1) we discovered two main categories of data acquisition problems:
- Technical issues: spatial resolution and temporal resolution problems;
- Socio-economic issues: privacy and data ownership; the financial cost of collecting and processing data, market competition, awareness.
3.1. Technical Issues
As the process of urban energy planning is relatively new, most of the relevant data has been collected for other purposes. Because of this, the exact definition of the values represented in the dataset determines if, and if so, how suitable these are for energy planning purposes.
Furthermore, available data are usually only (publicly) released in an aggregated form, if at all. This applies both to spatial and temporal aspects.
3.1.1. Spatial Resolution
An issue that was frequently encountered with geospatial dataset availability during the PLANHEAT project, is that either the spatial resolution is too low for suitable projection or further analysis, or that only a single figure is available for the area under consideration.
An example is open data on residential building gas consumption in the Netherlands, which is collected by energy supply companies (ESCOs) and made available publicly in aggregated form at the neighbourhood level, through Statistics Netherlands (CBS) [25]. As a result of privacy regulations, figures in some neighbourhoods were also occasionally reported as censored (‘afgeschermd’) when the number of houses or companies fell below a threshold. Experiences in other countries have been mixed, where sometimes the local ESCO did not provide even aggregated numbers at all, reportedly for competitive or political reasons. Section 3.2 goes into greater detail on this and other socio-economic issues.
Data may also not be available in the same type of spatial division. Statistics agencies for example tend to collect their data using administrative divisions, whereas energy supply potential maps may be based on environmental data which uses rasters. Although GIS (Geographic Information System) software allows these to be projected over one another, using different source formats may introduce additional inaccuracies during both the analysis and subsequent processing steps.
A low spatial resolution may also frustrate the analysis of demand and supply geodata and matching of sources and sinks, especially if there is a strong relation with the urban fabric for the categories under consideration. Although a planner would be able to use low resolution data to do an initial, fast assessment of the possibilities in their city, designing energy transition plans requires not only (geo)data on demand, retrofitting (i.e., demand reduction), and (residual and renewable) supply potentials, but also on the possibilities of existing, and space for new, infrastructure.
In some cases, commercial organisations provide high resolution energy potential maps themselves. For the same competitive reasons mentioned however they are rarely transparent about the exact calculation steps followed in order to produce the values displayed and may include internal assessments on suitability and cost that deviate from the considerations of other users. A lack of transparency decreases the level of confidence of these datasets in itself.
3.1.2. Temporal Resolution
A second issue is with the available temporal resolution. Datasets encountered during the PLANHEAT project that were suitable for energy planning, were usually either geospatial (annual figures) or temporal (for one or few buildings or areas) in nature, however rarely both (the one notable exception within the project being 1 to 5 km2 resolution environmental satellite data, used for surface water potentials).
For mapping and planning purposes, annual data are usually sufficient, as at this stage of the planning process, quantities and concentrations are more important than temporal patterns. However, the fluctuating nature of both demand and some forms of residual and renewable energy supply might mean that the total potential figures require more than simply providing sufficient generation capacity, as there may be periods where supply vastly outpaces demand requirements (therefore effectively losing available energy), or conversely, demand outpaces supply.
An annual simulation can therefore be run to consider the impact of an energy transition plan. This however requires high resolution temporal, rather than spatial data for the components that are part of the planned energy system, in order to determine if these components are dimensioned to cope with both mismatches and peaks in demand and supply. As with high resolution spatial data, suitable high-resolution temporal data (at the hourly or smaller level) is frequently not available publicly in some cases, or at all in others.
More than with the spatial dimension, the technical and privacy considerations of data acquisition can be an issue here. Registering an hourly profile for household electricity demand over a year firstly requires the presence of a smart meter, and secondly permission of the household to read and store more than just the annual balance (which is required for billing purposes, the primary reason an electricity meter is installed). Accurately assessing the residual heat potential of an industrial process requires both temperature and volume monitoring, especially when used in a simulation. Even if monitoring is already active, commercial entities may be reluctant to (publicly or privately) release these figures, because they might subsequently be analysed by competitors.
3.2. Socio-Economic Issues
The analysis conducted on the PLANHEAT interviews’ results and the literature review (European and academic researches related to energy mapping tools) highlights several socio-economic difficulties in dealing with energy data: data ownership and privacy, market competition, irregular updating of datasets, discrepancies between data formats, problems of data aggregation and disaggregation, public administration incapacity to treat and process data. Privacy (Article 8 of the Charter of Fundamental Rights of the European Union and Article 16 of the Treaty on the functioning of the European Union guarantee the protection of personal data. This means that acquisition, transfer and publication of personally identifiable data are subject to restrictions [44].) is always mentioned as one of the key challenges. The EU has several framework policies that protect the privacy of individuals (for instance the new GDPR (General Data Protection Regulation) directive in 2018 [45]), and therefore provide barriers both in the acquisition, transfer between actors (sometimes even between departments within the same civil authority) and publication [25]. When using statistical division-based datasets, sometimes even neighbourhoods and districts may cause confidentiality or privacy issues, if very few addresses are located there. For privacy issues in publication, a simple solution is available: aggregation, which can provide acceptable anonymity. But data aggregation may also reduce the quality of the final output. In many cases, local authorities possess data at a low spatial resolution, for example, city level energy consumption (or even regional scale statistical data). In this case a disaggregation process, using spatial indicators (like city cadastre or land use), would be needed to estimate the spatial distribution of energy consumption in the city.
Energy data are often in the hands of actors who may be unwilling to share it (energy companies, other private companies that for some reasons collect useful data). The competitive market is also a challenge when publishing open data is seen as potentially disadvantageous for companies. Sometimes (commercial) energy companies may have relevant data, but either do not provide this at all or only share at a low resolution, unsuitable for planning purposes. In the case is possible to run into problems of data combining and harmonization, because datasets come from different data owners, with different standards and aggregation methods, due to the liberalization of the energy production and sales market.
Sometimes new data acquisition is needed. The cost of creating and publishing datasets is high and take a long time. Understanding which types of data are available makes it easier to discover which data are missing, so data collection efforts can be specifically targeted for these, avoiding extra costs. Interviewing suitable stakeholders is also useful, especially when data collection projects are already planned, and the user simply must wait for it to become available. In this case, it will be more about cooperation than the associated cost.
Therefore, sometimes useful information might be derived from unexpected sources, and communicate any benefits coming from data sharing is beneficial to make it more interesting for companies to cooperate.
A lack of awareness is also a key challenge. The difficulty of accessing energy data is connected to the complexity of the energy production and supply system, increased with the liberalization of the energy market and the entry of different and new stakeholders. Commercial companies often have little interest in processing and sharing data. Public administrations have huge difficulties in managing data, as a result of differing standards and aggregation methods used by the operators. Municipalities and commercial companies are also not motivated and incentivised, and sometimes not aware of the potential benefits of sharing their energy data. When data owners are not aware of the potential value and the possibilities of open energy data to themselves, the step towards publishing their data is not likely to happen [5]. Now commercial companies (especially related to the energy market) see the opening of energy data as an added cost, without any benefit. The benefits of opening data would become much clearer if there would be direct incentives (financial incentives, government support) for private parties to publish energy data.
Lastly, data quality (including age) and the completeness of datasets is also crucial. Inaccurate or incomplete datasets can lead to misinterpretation and liability issues. For example, final consumption data that is a decade old may not be representative anymore, as not just the size and thermal efficiency of the building stock may have changed, but internal heat load (for example more electronics) and user habits will be different as well.
An interesting element from the Scotland heat map [28] is the methodology used to classify the quality of collected data: the confidence level. Data are categorized respect the level of detail provided. The confidence level 5—the most accurate one—represents data with high resolution, for example, data that come from the family bills. Meanwhile, at confidence level 1, there is the footprint of buildings from which to estimate or disaggregate the urban energy consumption. The goal of the Scotland heat map is to increase over time the quality of all the data collected, to obtain a real representation of the energy profile of the Scottish territory as accurately as possible [28].
Other problems linked to the quality of data are related to consumption habits and certain energy carriers. In some regions, part of the heat demand is fulfilled with unmetered sources, for example, wood (pellets) or fuel oil. The use of electric resistance heating means that some heat demand is effectively concealed as electricity consumption. This also applies to cooling, which is largely supplied by air conditioning. Cities where cooling demand plays a significant role or is expected to in the future because of climate change, are lacking methods to extract actual cooling demand from the data they have [25].
Finally, the lack of a governance framework, guidance, and regulation specifically on open energy data may also form a problem.
4. PLANHEAT: Using Public Open Data to Overcome Problems in Data Acquisition
Addressing the issues with data availability forms the basis of the PLANHEAT project [25]. In this Horizon 2020 funded project, a toolkit was developed that both integrates a wide range of open datasets and allows the user to replace these with higher resolution private data, and add own data for which there is no public substitute yet.
The PLANHEAT integrated toolkit is open source and QGIS3-based. The use of GIS software is becoming commonplace in urban planning practices but requires significant amounts of high-resolution data in order to produce useful results. A Heat/Cold (HC) potential map, as in this case, needs a large amount of data (geospatial, temporal and other), which municipalities may not have or cannot use. The main innovation of the PLANHEAT toolkit is that it can produce useful results, even if a local administration only has a limited amount of information available. Conversely, the same toolkit can use rich datasets as well, in order to be attractive for large metropolitan areas, where detailed data is frequently available to produce more accurate maps, plans and simulations. The objective of PLANHEAT is to offer a support tool, based as much as possible on public and open databases, for example, European ones, automatically loaded in the device settings. Initiatives like the EU Open Data Portal [13] aim to unlock data already collected by governments and institutions free of charge and without copyright. The PLANHEAT toolkit only asks for a relatively small amount of initial information from municipalities, like the municipal and district boundaries, the location of monuments or historic buildings with high cultural and aesthetic value, or particular consumption habits or resources used. Municipalities can replace the data provided in the toolkit when more detailed local data becomes available, in order to increase the accuracy of the results. The ability to use generic data at a lower detail level makes it possible to get started quickly without having to spend significant effort on data collecting. This will also reveal which layers to concentrate efforts for additional data collection, and which ones can be investigated later. For example, a map coming from the disaggregation process based on NUTS3 datasets (Nomenclature of territorial units for statistics) will allow visualizing the peaks of demand or the greatest territorial potentialities, which represents a crucial starting point for increasing the quality of urban energy strategies and planning.
The PLANHEAT tool consists of three modules: the mapping module (mapping local demand and supply sources), the planning module (plan new scenarios based on residual and renewable energy sources), and the simulation module (simulation of the new scenarios and Key Performance Indicator (KPI) evaluation). At the side of the energy consumption and supply mapping module, the tool provides two approaches.
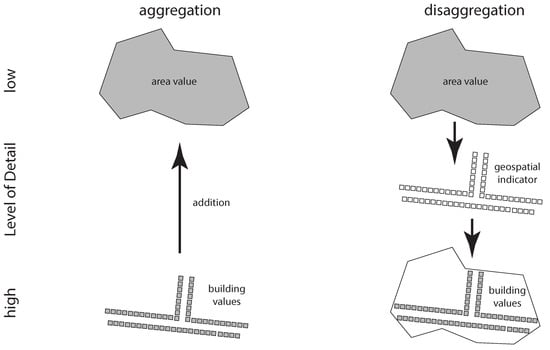
The first one is the City Mapping Module (CMM), which applies a top-down or disaggregation method (Figure 1) [16,22,23]. For this method, the input required from the user is very limited. Only aggregated final consumption figures (GWh, Gigawatthour) per sector are required, and the boundary or boundaries to which they apply (city, districts). Subdivision within each boundary is made by applying the appropriate geospatial indicator, some of which are available directly through the PLANHEAT web database. Examples of geospatial indicators are the CORINE land use map (Coordination of Information on the Environment) and OpenStreetMap (specifically building footprints) [22].
The second one, the District Mapping Module (DMM), uses a bottom-up approach (aggregation, [16,22,23], Figure 1), by deriving heat demand from building characteristics (Table 2). Although more complicated, it provides two calculation routes: ‘complete’, which requires 11 variables and ‘simplified’, which will be less accurate, but requires only little input (a unique identifier for each building; gross floor area; age and use of each building) (Table 2) [22] shows a comparison between the input data for the ‘complete’ and ‘simplified’ methods. Both methods result in individual building values for use by the simulation module, that can also be aggregated for mapping purposes.
The DMM was tested on a district close to Lecce, Italy, where little data was available. With this tool was possible determinate the district energy demand and identify opportunities for developing energy strategies based on RES and alternative energy resources. The validation test was incredibly useful for supporting the planning activity of the municipality.
On the supply side, both environmental and anthropogenic sources were included. Input data can be divided into technical parameters and geospatial indicators. An example is residual heat from wastewater treatment plants (WWTPs), for which the European Environment Agency had a base dataset that covered the EU28 [46,47]. Input data used are shown in Table 3.
Although explicit levels of confidence were not implemented project wide, because in many cases a single data flow and corresponding continentally uniform dataset was chosen, the sewage heat recovery dataset contains two Confidence Levels (CLs). Measured flow is not available for some facilities, therefore residual heat potential was in some cases estimated based on capacity multiplied by the average national load (see Table 3), and therefore assigned a lower CL [14]. In future versions of the tool, which may contain a wider range of (higher or lower input data resolution) calculation methods catering to specific European regions, this feature will likely be expanded upon.
The full list of input data used in the PLANHEAT project is extensive, and can be found in the reports released by the project [16,18,22,24,46,47]. These represent a balance between accuracy, public availability, and full coverage of the EU28, and can be accessed through the PLANHEAT web database.
Experiences gained during the PLANHEAT project show that is possible to start an energy mapping process with relatively little data input. This opportunity is crucial for data-aware planning and to support policy-making both from an energetic and spatial perspective.
5. Conclusions and Recommendations
The energy transition will only be successful if it is integrated into the urban planning process [13,20]. As the need to increase the sustainability of the built environment is widely acknowledged, there is a clear need to rethink and implement new urban planning procedures in order to meet these expectations. A better understanding of and interactions between urban planning and energy issues are useful, not only for the planners themselves but also for the private sector, local communities and citizens who may take appropriate decisions and receive benefits from related economic and social added values [42].
The economic value could come from the increased economic activity and employment, while the social value could come from the improved social conditions within different communities of a city. Sharing responsibility makes the communities involved (Local energy communities).
Alhamwi et al. [21] and Manfren et al. [48] argue that the most innovative and advanced planning practices include communication strategies and actions for activating the participation of all urban actors. Supporting tools for visualizing urban phenomena and simulating future trends will play an increasing role in the coming years. The use of these tools supports inclusion and participation, because it allows the sharing of goals, shows the advantages of decisions, finds which actors will be involved in the processes, enables community participation (by the creation of local energy cooperatives), influences behaviour and increases overall awareness.
The energy sector produces economic benefits and attracts investments. In the transition from a centralized energy system to a distributed one, local economic opportunities increase. Energy potential maps are a useful tool to increase investment in clean energy and energy efficiency, providing the geospatially quantified information required to guide urban transformation processes. An energy potential map can also influence investor choices, attract external financing and demonstrate potential economic income, increasing the attractiveness and competitiveness of the city. The renewable energy sector is an expanding market, which rewards the most virtuous cities, communities and companies. In the long term, a city’s ability to deal with climate change and offer high-quality, healthy environments will depend on its capacity to understand these complex phenomena. Supporting tools can represent a winning means to face new urban challenges and boost sustainable development.
The opportunity of applying innovative methodologies (and the tools that facilitate these) does not necessarily result in immediate concrete application of the opportunities identified. One of the problems that cause this is a lack of availability of required and suitable data. Using appropriate energy data in the planning process (both spatial and energy related) allows for a more effective analysis, as well as more effective interventions and strategies. Collecting data issues can be divided into two main categories: technical issues and socio-economic issues. Research on open data maturity in Europe (EU28+) [5] shows that countries completed over 55% of their open data journey with the development of basic open data policies and open data portal. Even if suitable datasets exist, the development of supporting tools is complicated. For this reason, the development of an incremental tool, like PLANHEAT, applicable in every context and based on public open data, permits a quick start and increases the usability.
From an open data perspective, the strategy should be the creation of open data policies, the increase of policy quality, and the setup of standards and licenses for the publication, all of which will in turn improve the availability of suitable energy data. Sometimes, a lack of standardization is related to a desire to facilitate data publication from data owners. Setting up standards would require a bigger effort from them, which might also translate to higher related costs. However, standardization is crucial for making the interoperability of datasets possible and increasing their use (or re-use) by local authorities.
Energy issues and spatial planning are tightly connected. For this reason, facilitating the vertical and horizontal coordination between urban and energy stakeholders is very important, in order to provide energy demand and supply data, to invest in integrated projects and to actively participate in the energy transition [42].
Author Contributions
Conceptualization, M.F. and A.B.; Methodology, A.B. and M.F.; Validation, M.F., P.D.P.; Formal Analysis A.B.; Resources, M.F. and A.B.; Data Curation, M.F. and A.B.; Writing-Original Draft Preparation, A.B., M.F.; Writing—Review & Editing, A.B., M.F.; Supervision, M.F. and P.D.P.; Project Administration M.F. and A.B. All authors have read and agreed to the published version of the manuscript.
Funding
Part of the research leading to this paper has received funding from the European Research Council (ERC) under the European Union’s Horizon 2020 research and innovation programme (grant agreement n° 723757).
Acknowledgments
The authors would like to thank all PLANHEAT partners: RINA Consulting; Delft University of Technology; University of Zagreb; National Observatory of Athens; Tecnalia; Vito; Lecce local authority; Antwerp local authority; Velika Gorica local authority; the Regional environmental center for central and eastern Europe; Euroheat & Power; Geonardo; Artelys.
Conflicts of Interest
The authors declare no conflict of interest. The funding sponsors had no role in the design of the study; in the collection, analyses, or interpretation of data; in the writing of the manuscript, and in the decision to publish the results.
References
- Masson-Delmotte, V.; Zhai, P.; Pörtner, H.-O.; Roberts, D.; Skea, J.; Shukla, P.R.; Pirani, A.; Moufouma-Okia, W.; Péan, C.; Pidcock, R.; et al. IPCC Special Report. In Global Warming of 1.5 °C; Summary for Policymakers; IPCC: Geneva, Switzerland, 2018; ISBN 978-92-9169-151-7. [Google Scholar]
- Ann, J.; Mills, G. The role of urban form as an energy management parameter. Energy Policy 2013, 53, 218–228. [Google Scholar]
- European Legislation on Open Data and the Re-Use of Public Sector Information. Available online: http://ec.europa.eu/digital-agenda/en/european-legislation-reuse-public-sector-information (accessed on 28 February 2020).
- Directive 2003/98/EC of the European Parliament and of the Council of 17 November 2003 on the Re-Use of Public Sector Information. Available online: https://eur-lex.europa.eu/legal-content/en/ALL/?uri=CELEX%3A32003L0098 (accessed on 28 February 2020).
- Carrara, W.; Nieuwenhuis, M.; Vollers, H. Open Data Maturity in Europe. Report 2016. Available online: https://euagenda.eu/publications/open-data-maturity-in-europe-2016 (accessed on 28 February 2020).
- Knowles, R. Energy and Form: An Ecological Approach to Urban Growth; MIT Press: Cambridge, UK, 1974. [Google Scholar]
- Owens, S. Energy, Planning and Urban Form; Pion Limited: London, UK, 1986. [Google Scholar]
- Jaccard, M.; Failing, L.; Berry, T. From equipment to infrastructure: Community energy management and greenhouse gas emissions reduction. Energy Policy 1997, 25, 1065–1074. [Google Scholar] [CrossRef]
- Steemers, K. Energy and the city: Density, buildings and transport. Energy Build. 2003, 35, 3–14. [Google Scholar] [CrossRef]
- Madlener, R.; Sunak, Y. Impacts of urbanization on urban structures and energy demand: What can we learn for urban energy planning and urbanization management? Sustain. Cities Soc. 2011, 1, 45–53. [Google Scholar] [CrossRef]
- Stoeglehner, G.; Neugebauer, G.; Erker, S.; Narodoslawsky, M. Integrated Spatial and Energy Planning: Supporting Climate Protection and the Energy Turn with Means of Spatial Planning; Springer: Berlin/Heidelberg, Germany, 2016. [Google Scholar]
- Pereira, I.M.; Sad de Assis, E. Urban energy consumption mapping for energy management. Energy Policy 2013, 59, 257–269. [Google Scholar] [CrossRef]
- Hemis, H. Integrating ENERGY in Urban Planning Processes—Insights from Amsterdam/Zaanstad, Berlin, Paris, Stockholm, Vienna, Warsaw and Zagreb. Report Urban Learning. Available online: http://www.urbanlearning.eu/fileadmin/user_upload/documents/D4-2_Synthesis-report_upgraded_processes_final_170807.pdf (accessed on 28 February 2020).
- Owens, S. Land-use planning for energy efficiency. Appl. Energy 1992, 43, 81–114. [Google Scholar] [CrossRef]
- Anderson, W.P.; Kanaroglou, P.S.; Miller, E.J. Urban form, energy and environment: A review of issues evidence and policy. Urban. Stud. 1996, 33, 7–55. [Google Scholar] [CrossRef]
- PLANHEAT. D1.2 Report on End-Users’ Current Status, Practices and Needs in H&C Plans. Report 2017. Available online: https://ec.europa.eu/research/participants/documents/downloadPublic?documentIds=080166e5aff3c1c4&appId=PPGMS (accessed on 28 February 2020).
- Cornelis, E.; Meinke-Hubeny, F. Stratego Project. Local Action: Methodologies and Data Sources for Mapping Local Heating and Cooling Demand and Supply. Report 2015. Available online: https://ec.europa.eu/research/participants/documents/downloadPublic?documentIds=080166e5ba5e00b8&appId=PPGMS (accessed on 28 February 2020).
- PLANHEAT. D1.4 Common IT Framework Specifications. Report 2017. Available online: http://planheat.eu/project-documents (accessed on 28 February 2020).
- Stremke, S.; van den Dobbelsteen, A. Sustainable Energy Landscapes. Designing, Planning, and Development; Stremke, S., Ed.; Taylor & Francis: Copenagen, Denmark, 2013. [Google Scholar]
- Hemis, H. Review of Current Governance Processes of Urban and Energy Planning in Amsterdam/Zaanstad, Berlin, Paris, Stockholm, Vienna, Warsaw and Zagreb. Available online: https://ec.europa.eu/research/participants/documents/downloadPublic?documentIds=080166e5adf1c1d3&appId=PPGMS (accessed on 28 February 2020).
- Alhamwi, A.; Medjroubi, W.; Vogt, T.; Agert, C. GIS-based urban energy systems models and tools: Introducing a model for the optimisation of flexibilisation technologies in urban areas. Appl. Energy 2017, 191, 1–9. [Google Scholar] [CrossRef]
- PLANHEAT. D5.1 Presentation on PLANHEAT Integrated Tool Functionalities. Report 2017. Available online: http://planheat.eu/project-documents (accessed on 28 February 2020).
- PLANHEAT. Project Brief. Available online: http://planheat.eu/project-brief (accessed on 28 February 2020).
- Delponte, I. Achieving Smart Energy Planning Objectives. The Approach of the Transform Project. TeMA 2014. [Google Scholar] [CrossRef]
- PLANHEAT. D1.7 Overcoming Barriers in Data Collection. Report 2018. Available online: http://planheat.eu/project-documents (accessed on 28 February 2020).
- Cornelis, E.; Meinke-Hubeny, F. Stratego Project. Local Action: Methodologies and Data Sources for Mapping Local Heating and Cooling Demand and Supply. Available online: https://www.google.com/url?sa=t&rct=j&q=&esrc=s&source=web&cd=1&ved=2ahUKEwjN_OSy1ozoAhVU-WEKHQwZBbAQFjAAegQIBBAB&url=https%3A%2F%2Fwww.euroheat.org%2Fwp-content%2Fuploads%2F2016%2F04%2FD3.7_Methodologies-and-data-sources-for-mapping.pdf&usg=AOvVaw1nVLcUafGDsEk7urnjYJn4 (accessed on 1 November 2019).
- Cornelis, E.; Holm, A.B.; Lauersen, B.; Lygnerud, K. Stratego Project. Insights from Drafting Local Heating and Cooling Action Plans. Available online: https://www.google.com.hk/url?sa=t&rct=j&q=&esrc=s&source=web&cd=1&ved=2ahUKEwiF4ZXn14zoAhWLHHAKHR9vCrEQFjAAegQIBxAB&url=https%3A%2F%2Fwww.euroheat.org%2Fwp-content%2Fuploads%2F2016%2F04%2FD3.d-WP3-Final-Report.pdf&usg=AOvVaw3kn6iVDl_t2yuoa-GjYcTD (accessed on 1 November 2019).
- Scottish Government Scotland Heat Map. User Guide. 2.0 Methodology Report. Available online: https://www.gov.scot/binaries/content/documents/govscot/publications/advice-and-guidance/2018/11/scotland-heat-map-documents/documents/scotlands-heat-map-user-guidance/2.0-report-methodology/2.0-report-methodology/govscot%3Adocument/Scotland%2527s%2Bheat%2Bmap%2B2.0%2Breport%2Bmethodology%252C%2B17%2BNovember%2B2015.pdf (accessed on 27 February 2020).
- TRANSFORM Open Energy Data: A Prerequisite for Cities to Become Low-Carbon. Available online: https://smartcities-infosystem.eu/sites/www.smartcities-infosystem.eu/files/transform_open_energy_data_-_a_prerequisite_for_cities_to_become_low-carbon.pdf (accessed on 1 November 2019).
- De Sousa, L.; Eykamp, C.; Leopold, U.; Baume, O.; Braun, C. iGUESS–A Web-Based System Integrating Urban Energy Planning and Assessment Modelling for Multi-Scale Spatial Decision Making 2012. Available online: https://scholarsarchive.byu.edu/iemssconference/2012/Stream-B/293/ (accessed on 1 November 2019).
- Broersma, S.; Fremouw, M.; van den Dobbelsteen, A. Heat mapping the Netherlands. Laying the foundations for energy-based planning. In Proceedings of the 6th World sustainable building Conference SB11, Helsinki, Finland, 18 –21 October 2011. [Google Scholar]
- Broersma, S.; Fremouw, M.; van den Dobbelsteen, A. Energy potential mapping: Visualising energy characteristics for the exergetic optimisation of the built environment. Entropy 2013, 15, 490–506. [Google Scholar] [CrossRef] [Green Version]
- Musco, F. Rigenerazione Urbana e Sostenibilità; FrancoAngeli: Milano, Italy, 2009. [Google Scholar]
- ARUP Decentralised Energy Masterplanning. A manual for Local Authorities. Report 2011. Available online: https://www.google.com.hk/url?sa=t&rct=j&q=&esrc=s&source=web&cd=1&ved=2ahUKEwie_caxv4zoAhWwy4sBHTMVBJUQFjAAegQIBhAB&url=https%3A%2F%2Fwww.theade.co.uk%2Fassets%2Fdocs%2Fresources%2FDENet_manual_lo_v10.pdf&usg=AOvVaw0fReu8qQRPyLDGmlWSe9sR (accessed on 1 November 2019).
- van den Dobbelsteen, A.; Jansen, S.; Vernay, A.L.; Gommans, L. Building within an energetic context: Low-exergy design based on local energy potentials and excess or shortage of energy. In Proceedings of the PLEA Conference, Singapore, 22–24 November 2007. [Google Scholar]
- Stoeglehner, G.; Niemetz, N.; Kettl, K.H. Spatial dimensions of sustainable energy systems: New visions for integrated spatial and energy planning. Energy Sustain. Soc. 2011, 1, 1–9. [Google Scholar] [CrossRef] [Green Version]
- Stoeglehner, G.; Narodoslawsky, M. Energy-Conscious Planning Practice in Austria: Strategic Planning for Energy-Optimized Urban Structures. In Sustainable Energy Landscapes. Designing, Planning, and Development; Stremke, S., Stremke, S., van den Dobbelsteen, A., Eds.; Taylor & Francis: Copenagen, Denmark, 2013; pp. 355–370. [Google Scholar]
- Cherix, G.; Capezzali, M.; Rager, J. Territorial energy systems: A methodological approach and case study. In Proceedings of the 10th Conference on Sustainable Development of Energy, Water and Environment Systems, Dubrovnik, Croatia, 27 September–2 October 2015. [Google Scholar]
- Van Gessel, S.; Bader, A.G.; Bialkowski, A.; Beccaletto, L.; Begemann, L. Energy Storage Data Collection. Report 2016. Available online: http://www.estmap.eu/downloads/ESTMAP-D3.04-v2016.12.14-Datacollection-report-public.pdf (accessed on 28 February 2020).
- Meskel, E.; Weber, P. Review of Instruments and Tools Used for Energy and Urban Planning in Amsterdam/Zaanstad, Berlin, Paris, Stockholm, Vienna, Warsaw and Zagreb. Available online: http://www.urbanlearning.eu/fileadmin/user_upload/documents/D3.2_Synthesis_report_instruments_tools_170425_final.pdf (accessed on 28 February 2020).
- Meshartility report D5.4 Recommendations for EU and National Policymakers on Improving the Collection and Access to Energy Data. Available online: http://www.meshartility.eu/images/documents/MESHARTILITY_deliverable_5.4.pdf (accessed on 28 February 2020).
- Cajot, S.; Peter, M.; Bahu, J.M.; Guignet, F.; Koch, A.; Maréchal, F. Obstacles in energy planning at the urban scale. Sustain. Cities Soc. 2017, 30, 223–236. [Google Scholar] [CrossRef]
- Stremke, S.; Kohn, J. Ecological concepts and strategies with relevance to energy-conscious spatial planning and design. Environ. Plan. B Plan. Des. 2010, 37, 518–532. [Google Scholar] [CrossRef]
- Treaty on the Functioning of the European Union 2012/C 326/. Available online: http://data.europa.eu/eli/treaty/tfeu_2012/oj (accessed on 28 February 2020).
- Regulation (EU) 2016/679 of the European Parliament and of the Council of 27 April 2016 on the Protection of Natural Persons with Regard to the Processing of Personal Data and on the free Movement of such Data, and Repealing Directive 95/46/EC (General Data Protection Regulation). Available online: https://eur-lex.europa.eu/eli/reg/2016/679/oj (accessed on 28 February 2020).
- PLANHEAT. D2.5 Methods to Quantify and Map Unconventional Heating and Cooling Sources. Report 2018. Available online: http://planheat.eu/project-documents (accessed on 28 February 2020).
- PLANHEAT. D2.6 Models for Quantifying and Mapping Energy Potential from Renewable Energy Sources. Report 2018. Available online: http://planheat.eu/project-documents (accessed on 28 February 2020).
- Manfren, M.; Caputo, P.; Costa, G. Paradigm shift in urban energy systems through distributed generation: Methods and models. Appl. Energy 2011, 88, 1032–1048. [Google Scholar] [CrossRef]
Figure 1.
‘City’ (top-down or disaggregation) and ‘District’ (bottom-up or aggregation) methods, as used in PLANHEAT [14].
Figure 1.
‘City’ (top-down or disaggregation) and ‘District’ (bottom-up or aggregation) methods, as used in PLANHEAT [14].


Table 1.
List of Projects Focused on Energy Potential Mapping Development.
| Project Name | Reference | Start | End | Category | Result and Usability | Spatial Scale(s) | Types of (Geo) Data Used |
|---|---|---|---|---|---|---|---|
| PLANHEAT | [16,22,23,25] | 2016 | 2019 | EU project | open source plug-in Qgis | city/district | open databases for most maps |
| STRATEGO | [26,27] | 2014 | 2016 | EU project | open web-based GIS map | city/country | open databases |
| Scotland Heat Map | [28] | 2014 | ongoing | Institutional project | open web-based GIS map | region | databases updated by local authorities |
| Amsterdam Energy Atlas | [29] | 2013 | 2015 | EU project | open maps | city | datasets provided by local authorities and private sector |
| MUSIC iGUESS | [30] | 2009 | 2014 | EU project | open maps | city | datasets provided by local authorities and private sector |
| NL 3D heat maps | [31,32] | 2009 | 2011 | Institutional research | methodology–open map | city/country | new datasets production (data estimation)–Data provided by private sector and public bodies |
| London Heat Map | [33,34] | 2009 | 2019 upgraded | Institutional project | open web-based GIS map | city | data provided by the 23 London Boroughs–Dataset production |
| POP Groningen | [19,35] | 2006 | / | Institutional project | methodology–open maps | province | public open base map and new datasets production (data estimation) |
| PlanVision | [11,36,37] | 2009 | 2011 | Academic project | methodology–Energy Zone Maps | city | datasets production (survey and public data collection) |
| PlanETer | [38] | 2013 | 2015 | Institutional project | open web-based GIS map | city | datasets production (private and public data collection) |
| ESTMAP3 | [39] | 2015 | 2016 | EU project | open web-based GIS map | region/country | open databases |
| Elas calculator | [11] | 2009 | 2011 | Academic project | open web-based tool (calculator) | city | Data provided by local authorities in the calculator tool |
Table 2.
Input data requirement comparison of the DMM calculation methods [22].
Table 2.
Input data requirement comparison of the DMM calculation methods [22].
| Method: | ID Building | Centroid | Age | Use | Total Height | Gross Floor Area | Number of Floors | Roof Area | Facade Area | Volume | Protection Degree |
|---|---|---|---|---|---|---|---|---|---|---|---|
| Complete | Y | Y | Y | Y | Y | Y | Y | Y | Y | Y | Y |
| Simplified | Y | Y | N | N | N | Y | N | N | N | N | N |
Table 3.
Geospatial indicators and technical variables used for residual heat potential from WWTPs.
| Variable [Unit] | Data Specification | Default Maps |
|---|---|---|
| Sewage treatment plant locations | - | https://www.eea.europa.eu/data-and-maps/data/waterbase-uwwtd-urban-waste-water-treatment-directive-5 |
| Sewage treatment plant, number of p.e. treated annually [p.e./yr] | (1) uwwLoadEnteringUWWTP: Number of person equivalents treated (note: actual use, not capacity). | https://www.eea.europa.eu/data-and-maps/data/waterbase-uwwtd-urban-waste-water-treatment-directive-5 |
| (2) If not available, use the national average uwwCapacity (based on known uwwCapacity and uwwLoadEnteringUWWTP in the UWWTP database) | ||
| Effluent of waste water treatment plants | Flow of the effluent of the waste water treatment plant | http://www.eea.europa.eu/themes/water/water-pollution/uwwtd/interactive-maps/urban-waste-water-treatment-maps-1 |
| Sewage network temperature [°C] | Monthly average effluent temperature (12 values per year). | User required |
| Max cooling temperature [°C] | User specified, 2 °C will be the maximum realistic delta T. | 2 |
| Heat capacity [J/kg/K] | Heat capacity of sewage | 4.2 |
| Person equivalent [l/day] | EEA figure applicable to all of Europe, user may specify a more precise national or local figure | 200 |
© 2020 by the authors. Licensee MDPI, Basel, Switzerland. This article is an open access article distributed under the terms and conditions of the Creative Commons Attribution (CC BY) license (http://creativecommons.org/licenses/by/4.0/).
Share and Cite
MDPI and ACS Style
Fremouw, M.; Bagaini, A.; De Pascali, P. Energy Potential Mapping: Open Data in Support of Urban Transition Planning. Energies 2020, 13, 1264. https://doi.org/10.3390/en13051264
AMA Style
Fremouw M, Bagaini A, De Pascali P. Energy Potential Mapping: Open Data in Support of Urban Transition Planning. Energies. 2020; 13(5):1264. https://doi.org/10.3390/en13051264
Chicago/Turabian StyleFremouw, Michiel, Annamaria Bagaini, and Paolo De Pascali. 2020. "Energy Potential Mapping: Open Data in Support of Urban Transition Planning" Energies 13, no. 5: 1264. https://doi.org/10.3390/en13051264
Note that from the first issue of 2016, this journal uses article numbers instead of page numbers. See further details here.