Cost Optimization of a Stand-Alone Hybrid Energy System with Fuel Cell and PV
by
 , , , and
Shakti Singh
1 ,
,
Prachi Chauhan
1,
Mohd Asim Aftab
1,* ,
,
Ikbal Ali
2,
S. M. Suhail Hussain
3 and
Taha Selim Ustun
3 1
Electrical and Instrumentation Engineering Department, Thapar Institute of Engineering and Technology, Patiala 147001, Punjab, India
2
Department of Electrical Engineering, Jamia Millia Islamia (A Central University), New Delhi 110025, India
3
Fukushima Renewable Energy Institute, AIST (FREA), National Institute of Advanced Industrial Science and Technology (AIST), Koriyama 963-0298, Japan
*
Author to whom correspondence should be addressed.
Energies 2020, 13(5), 1295; https://doi.org/10.3390/en13051295
Submission received: 13 February 2020
/
Revised: 4 March 2020
/
Accepted: 4 March 2020
/
Published: 10 March 2020
(This article belongs to the Section A1: Smart Grids and Microgrids)
Abstract
:Renewable energy has become very popular in recent years. The amount of renewable generation has increased in both grid-connected and stand-alone systems. This is because it can provide clean energy in a cost-effective and environmentally friendly fashion. Among all varieties, photovoltaic (PV) is the ultimate rising star. Integration of other technologies with solar is enhancing the efficiency and reliability of the system. In this paper a fuel cell–solar photovoltaic (FC-PV)-based hybrid energy system has been proposed to meet the electrical load demand of a small community center in India. The system is developed with PV panels, fuel cell, an electrolyzer and hydrogen storage tank. Detailed mathematical modeling of this system as well as its operation algorithm have been presented. Furthermore, cost optimization has been performed to determine ratings of PV and Hydrogen system components. The objective is to minimize the levelized cost of electricity (LCOE) of this standalone system. This optimization is performed in HOMER software as well as another tool using an artificial bee colony (ABC). The results obtained by both methods have been compared in terms of cost effectiveness. It is evident from the results that for a 68 MWh/yr of electricity demand is met by the 129 kW Solar PV, 15 kW Fuel cell along with a 34 kW electrolyzer and a 20 kg hydrogen tank with a LPSP of 0.053%. The LCOE is found to be in 0.228 $/kWh. Results also show that use of more sophisticated algorithms such as ABC yields more optimized solutions than package programs, such as HOMER. Finally, operational details for FC-PV hybrid system using IEC 61850 inter-operable communication is presented. IEC 61850 information models for FC, electrolyzer, hydrogen tank were developed and relevent IEC 61850 message exchanges for energy management in FC-PV hybrid system are demonstrated.
1. Introduction
The depletion of fossil fuels and increasing electricity needs attracted attention towards renewable power generation. The development of renewable energy generators to fulfill electricity demand of small industries, shopping complexes, residential buildings and transportation is provoking. In recent years, fuel cell (FC) technology has proven to be a feasible and reliable source of power generation with reduced carbon footprints [1]. Fuel cell with combination of other technologies has a huge potential to provide electricity to stand-alone locations. Fuel cells are having an edge over conventional batteries as they produce electricity as long as they receive a constant supply of hydrogen and oxygen. Fuel cell-based power generation can be used to provide power to commercial buildings, transportation, data centers, telecommunications towers, hospitals and off grid locations [2].
Fuel-cell along with solar photovoltaic (PV) has made some major strides in renewable power generations. This combination works by powering the electrolyzer through PV which generates hydrogen which is required to run the fuel cell. The generated hydrogen can be stored in the hydrogen tank. The sizing of components, energy management and cost effectiveness of the FC-PV based hybrid systems is a challenging work and requires a proper methodology. Recently, numerous research has been carried out to design PV-FC based hybrid energy systems. Authors in [3] presented a feasibility study by integrating stand-alone or grid connected fuel cells with PV panels to meet the load demand and removed the intermittent nature of the solar generation. In [4] the feasibility of the FC-PV hybrid system has been done for electricity demand in remote areas. Authors in [5] developed a MATLAB simulation model of grid connected FC-PV hybrid system. It can be concluded that extensive study has been reported in literature related to modeling, optimization and energy management for FC-PV hybrid systems [6,7,8,9,10,11,12]. It is evident from the literature that fuel cells along with solar have a huge potential for emission free power generation for small houses, commercial building, offices etc. in off grid mode.
Although extensive study has been reported in literature for modeling of FC-PV hybrid system but finding optimal configuration of FC-PV hybrid energy system with guaranteed least levelized cost of electricity (LCOE) while ensuring high-reliability of energy supply to the consumer is missing. Abridging this knowledge gap, this paper presents a simplified modeling of an autonomous FC-PV based hybrid energy system. A detailed and simplified modeling of fuel cell technology, which may be helpful in designing other fuel cell-based different hybrid energy systems, particularly in off grid locations is presented. The main focus of the work is to obtain the optimal configuration of the system while efficiently managing fuel cell and solar energy. Moreover, the optimal sizing of components such as the rating of PV panels, fuel cell, electrolyzer and size of hydrogen tank is deduced for cost effectiveness and reliability of the proposed system to provide an uninterrupted supply. The component sizing is obtained by using HOMER software and by a meta-heuristic optimization technique, artificial bee colony (ABC) algorithm.
HOMER (Hybrid optimization method for electric renewable), is a very user-friendly micropower design tool developed by national renewable energy laboratory in 1992. HOMER simulates various renewable energy source system configurations and sort them on the basis of the net present cost (NPC) of the system, it is a general purpose hybrid system framework that facilitates the design of electric power system for stand alone and also for grid connection applications [13]. The ABC algorithm is inspired by social behavior of honey bees [14]. The ABC algorithm has been tested on standard benchmark functions [15] and results have been compared with other meta-heuristic algorithms such as genetic algorithm, differential evolution and particle swarm optimization and it is found that the performance of the ABC is very much competitive with the above-mentioned algorithms with the edge of having less control parameters.
Moreover, for realization of the proposed scheme, an effective communication framework is required. This communication, if standardized and inter-operable presents benefits of reduced vendor dependence, feasibility and flexibility. In this regard, IEC 61850 standard is adopted as a global standard for power system automation [16,17]. To adopt IEC 61850 based communication architecture, modeling of power system entities as per IEC 61850 logical nodes is required. Hence, this paper presents the IEC 61850 information modeling of different components of FC-PV hybrid system. Furthermore, IEC 61850 communication-based implementation of FC-PV hybrid system has also been presented.
The remaining manuscript is structured into six sections. Section 2, explains the detailed mathematical modeling of various components used in the proposed system. Energy management system and objective function are discussed in Section 3. Section 4, explains the description of the ABC algorithm. In Section 5, technical and economic parameters of components used for the case study have been demonstrated. The results achieved by the proposed ABC algorithm for the case study have been compared with HOMER. In Section 6, implementation of IEC 61850 communication model has been presented. A brief conclusion of the work is presented in Section 7.
2. Modeling System Components
This work mainly emphasizes on the formulation of a stand alone FC-PV hybrid energy system to obtain effective cost of electricity generated by the system. Figure 1 shows the schematic diagram of the proposed AC/DC hybrid energy system. The PV panels, fuel cell stack and electrolyzer are connected to the DC bus. Electrolyzer takes input power from PV panels to produce hydrogen by carrying out electrolysis of water and store it in a hydrogen tank. Fuel cell stack uses stored hydrogen and oxygen to carry out chemical reactions and convert chemical energy into electrical energy. The electrolyzer and hydrogen tank are size dependent and have been considered as optimization parameters. The system has both kinds of electrical demand, i.e., AC and DC. Therefore, DC to AC converters are used to convert output power of PV panels and Fuel cells to AC power and meet the requirement of AC and DC primary loads of the community center. The excess power is given to the dump load that is connected to the DC bus. A microgrid controller is also proposed to control and manage power flow between different components of the the system. The mathematical model of the each component of the proposed system is discussed as follows:
2.1. Solar Photo Voltaic Panel
A PV panel is used to generate electric power by consuming sunlight. However, there are certain factors on which the output of a PV panel depends like temperature and solar radiation. The power produced by one PV panel () at any particular time is given as:
where is the rating of one PV module, is the solar radiation at time t, is the temperature coefficient of power and is the cell temperature. The cell performance changes with respect to temperature, as standard indicator, called the NOCT, which stands for nominal operating cell temperature. The NOCT is cell temperature of a module when ambient temperature is 20 C, solar irradiation is 0.8 kW/m and wind speed is 1 m/s. For conditions other then ambient, the cell temperature, , can be calculated as per following equation
where is the ambient temperature. The rated power output of a single panel, , depends upon maximum voltage output, , and maximum output current, , and further can be calculated as
Further, the total power generated from all PV panels, , is calculated as:
where is the number of total PV panels, which is a decision variable [1,13].
2.2. Fuel Cell
Proton exchange membrane fuel cell is employed to produce electric power from chemical reactions. The FC-PV hybrid system yields higher efficiency and other benefits of using fuel cell with PV panels are, minimizing CO poisoning, managing water and heat in the cell stack and developing lower-cost materials. There are two porous gas diffusion electrodes in a single cell which are separated by an electrolyte, that distinguishes one cell type from another. The electrolyte is composed of a thin membrane which conducts positive ions, but not electrons or neutral gases. The fuel cell takes hydrogen from electrolyzer and oxygen enters from the other side to form chemical reaction, hydrogen dissociate into protons and electrons. The chemical reaction is given as follows [18]:
Since the hydrogen gas dissociates into protons and electrons at an anode on the left, so the concentration gradient develops between the electrodes across the membrane. This gradient results in causing protons to diffuse through the membrane and electrons are left behind. Drifting of protons towards the cathode results in positively charged cathode with respect to anode. The electrons that are left behind are attracted towards the positively charged cathode; but since they cannot pass through the membrane, so they find another way and flows from anode to cathode and resulting in current flow in the opposite direction. The output voltage of a fuel cell, , is given as [19]
where , , are activation, ohmic, concentration voltage and mass transport loss respectively. Electric potential or maximum voltage that can be generated by a cell is given by:
where is electric work called Gibbs free energy, n is number of moles, F is Faraday’s constant, is specific entropy, T is operational absolute temperature in , is taken as 25 C, , and are pressure of pure oxygen, hydrogen and as fuel and R is gas constant, respectively. The total output power of fuel cell stack is given by:
where and are rating of fuel cells in a stack and current of the fuel cell, respectively.
In modelling of fuel cell, for power generation, the major component is mass flow rate of the hydrogen. The mass flow rate of hydrogen, , consumed by 1 kW fuel cell in kg/h can be calculated as :
where , and are fuel cell intercept coefficient in , fuel cell slope curve in kg/h/kW and rated capacity of the fuel cell in kW. For 1 kW of fuel cell rating, considering and to be 0.0003 and 0.058 kg/h/kW, respectively, calculated is 0.059 kg/h. Therefore, 0.059 kg/h hydrogen is required to generate 1 kW power by fuel cell [13].
2.3. Electrolyzer
Electrolyzer takes excess electricity from PV panels to produce hydrogen for further usage which is stored in a hydrogen tank for usage by fuel cell for power generation. The major parameter which need attention is the amount of hydrogen generated by the electrolyzer. The mass flow rate of hydrogen produced, , in kg/h by 1 kW electrolyzer can be calculated as :
where and are 1 kW, heating value of hydrogen in MJ/kg and efficiency of electrolyzer, respectively. The efficiency of electrolyzer is considered to be 90% [12]. The electrolyzer with a heating value of hydrogen being 142 MJ/kg, the mass flow rate of hydrogen will be 0.02268 kg/h/kW. Therefore, 1 kW electrolyzer will produce 0.02268 kg/h hydrogen [20].
2.4. Hydrogen Tank
Hydrogen tank is used to store hydrogen produced by the electrolyzer and to supply it to fuel cells for power generation. The hydrogen produced in a day by the electrolyzer is stored in the hydrogen tank, while hydrogen tank provides supply of hydrogen to fuel cell when there is no PV power generation. In the modelling of the proposed system, size of hydrogen tank, , in kg has been considered as a decision variable. The mass flow rate of hydrogen available at any time t is . The mass flow rate of hydrogen available at a particular time after being produced by the electrolyzer is calculated as:
where is the power taken by the electrolyzer to produce hydrogen and is the mass flow rate of hydrogen produced in kg/h by 1 kW electrolyzer, as calculated by Equation (11). This available hydrogen is stored in hydrogen storage tank and it is updated as:
where is the hydrogen present in the tank at previous hour. The fuel cell generates power by using hydrogen. The mass flow rate of hydrogen taken by fuel cell from hydrogen tank at a particular time is calculated as:
where is the power produced by fuel cell and is the mass flow rate of hydrogen consumed by 1 kW fuel cell in kg/h, as calculated by Equation (10). The hydrogen storage tank is updated after taking hydrogen, the remaining hydrogen in the tank is calculated as:
where is the hydrogen in the tank at time .
2.5. Converter
Power converters are used in a hybrid AC/DC energy system to convert AC to DC and vice versa. The output power of PV panels and fuel cells is DC however, to meet the AC load demand, inverters are required. The size of an inverter is chosen according to peak AC load demand, . Therefore, the rated power of the inverter, , can be calculated as:
where denotes efficiency of the inverter. The system is not connected to grid so rectification of power is not required.
3. Energy Management System and Objective Function
3.1. Energy Management System
In stand alone hybrid energy systems an efficient energy management is required to achieve reliability and cost effectiveness of the electricity generated. In this study, two types of load demands i.e., AC and DC have to be satisfied by solar power generation and fuel cells. The difference between power generation and load demand at any time can be calculated as :
where and are power produced by PV panels, AC and DC load demand at a particular time, respectively. Therefore, depending on three cases can be formed as follows.
- Case I:
- If , then the remaining power is fed to electrolyzer (). If power fed to electrolyzer is greater than the rating of electrolyzer () then, and remaining power is treated as excess electricity. This excess electricity can be given to some dump load or non priority load. The mass flow rate of hydrogen produced by the electrolyzer is calculated as:where and are the mass flow rate of hydrogen at any time t and hydrogen produced by 1kW electrolyzer, respectively. The hydrogen tank is updated as:where is the status of hydrogen tank at previous hour. The excess electricity can be calculated asIf , then repeat the process using Equations (18) and (19). In case the hydrogen accumulated as per Equation (19) in tank becomes greater than the size of the tank, i.e., , then electrolyzer is not run on rated capacity, the desired electrolyzer power can be calculated as:
- Case II:
- If , then there is no power exchange, and the total demand is met by the solar generation.
- Case III:
- If , then required power is provided by fuel cells. Power produced by fuel cell can be calculated as:The mass flow rate of hydrogen taken by fuel cell from hydrogen tank at a particular time to produce is calculated as:In case hydrogen tank does not have sufficient hydrogen i.e., , then unmet load is calculated as:If , then there is no unmet load and hydrogen storage tank is updated as:If the power required by fuel cells is greater than the rating of fuel cell (i.e., ), then assign , and further the power deficiency can be calculated by using Equation (24).The unmet load must be zero to ensure that the total load is served reliably, while minimizing the objective function. The loss of power supply probability (LPSP) during a considered period of time must be lower than a certain predetermined value. Mathematically, LPSP can be calculated as:
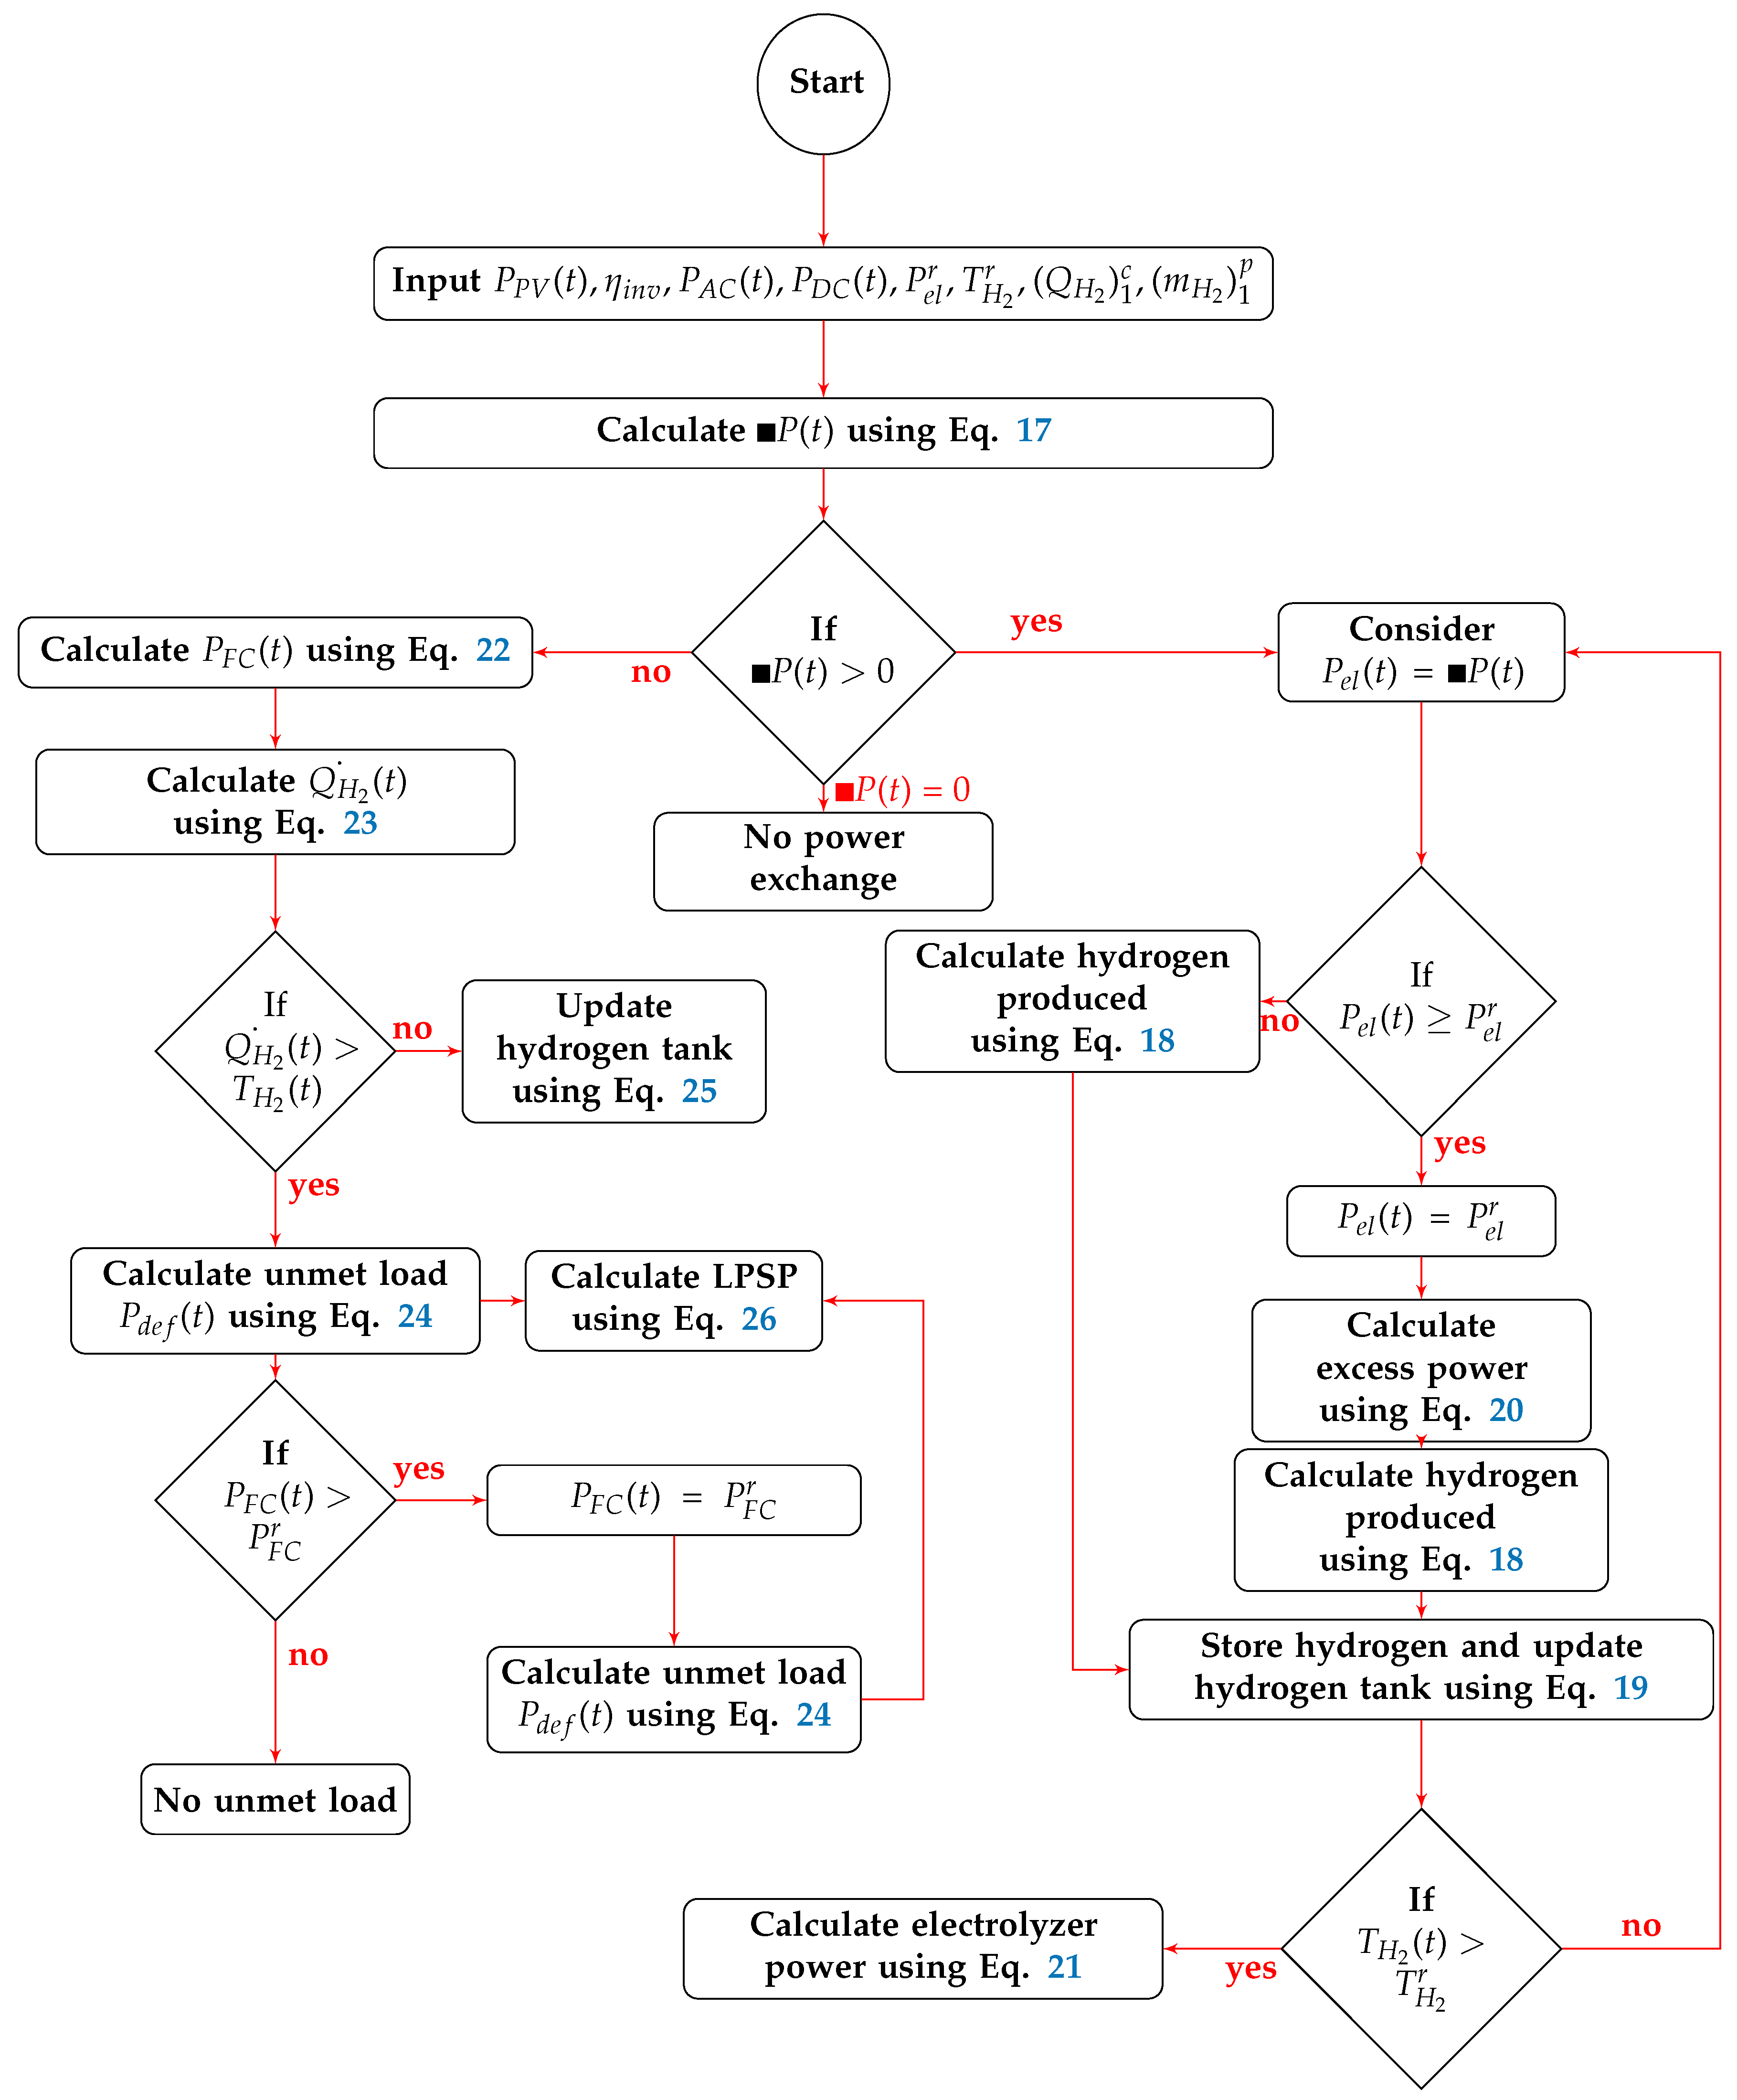
In order to solve the optimal sizing problem, the LPSP can be maintained in a specific tolerance band. In this work, the maximum limit of LPSP has been considered to be 1%. The energy management algorithm is demonstrated with the help of a simplified flow chart as shown in Figure 2.
3.2. Objective Function and Constraints
The power exchange between various components of the system and hydrogen management between fuel cell and electrolyzer while minimizing LCOE of the overall proposed system and satisfying all the constraints and fulfilling AC and DC load demands is main objective of this work. The detailed cost analysis, including capital, replacement and maintenance cost has been presented in this section. For cost optimization of the proposed system the decision variables are, rating of PV panels, fuel cells, electrolyzer, inverter and size of hydrogen storage tank. The concept of the annualized cost of the system used in the study can be given as:
where , , , and are the cost of PV panels (per kW), fuel cell (per kW), electrolyzer (per kW), hydrogen storage tank (per kg) and inverter (per kW), respectively. , and are the number of PV panels, fuel cells, electrolyzer, size of hydrogen storage tank and rating of inverter, respectively.
In this work the concept of Annualized cost of the system (ACS) has been adopted for cost analysis. The ACS of a particular component has several parts such as annual capital cost (), operation and maintenance cost (), annual replacement cost () and salvage value (). A detailed description of cost analysis of the components has been adopted as mentioned in reference [21].
Cost optimization is performed on the basis of LCOE. It is the ratio of ACS and total electricity served. The LCOE is calculated as follows
The objective function is subjected to following constraints:
where is the maximum number of PV panels and is the maximum rating of fuel cells, P is the maximum rating of electrolyzer and is the maximum size of the hydrogen tank. For the comparison of results these maximum numbers are kept same for both the methods (i.e., ABC and HOMER).
4. Algorithm Description
The ABC algorithm proposed by Karaboga and Basturk relay on investigating the idea of an artificial bee colony which contains three types of bees: onlooker, employed and scout bees. The food source and employed bees are equal in number and half of the total number of bees. The unoccupied food source by employed bee is converted into a scout and onlooker bees wait in the hives. The steps from searching of food to selection of food are as follows
- Food source is searched by employed bees and its location is stored in memory.
- That food source or location goes to onlooker bees.
- The onlooker bee do the quality search on food source given by employed bees by exploring it and the best one is selected.
The main steps of the implementation of the ABC algorithm to solve the optimization problem for the above mentioned hybrid system are described as per following steps.
- Input, , Control parameters of the ABC algorithm, i.e., maximum cycle number, colony size, population of food sources , dimension of the problem D, and limit.
- Consider the number of food sources equals the half of the colony size.
- Generate a randomly distributed population within the range of boundaries of the parameters by using the following equationwhere …, and …D.
- Set trial counters (to store the number of solution trials) to zero.
- According to initial guess solutions (number of PV panels, fuel cells, electrolyzer, and size of hydrogen storage tank) perform the following steps.
- Power management using as per flow chart shown in Figure 3
- The objective function as described in Equation (27) is evaluated for initial food source.
- Cycle = 1.
- Repeat.
- Produced a new modified food location for the employed bees by using the following equationwhere …, is a randomly chosen index. Whereas, is the random integer between the range of [−1,1].
- If a parameter generated exceeds its predetermined limits, it can be set to an acceptable boundary.
- Evaluate the objective function described in Equation (27) using new solutions by following the procedure mentioned in step 5.
- Apply the greedy selection process for the employed bees.
- Calculate the probability value, , for the solutions using fitness value by following equationwhere is the fitness value corresponding to solution.
- Produce the new solutions by using Equation (35) for the onlookers bees from the solutions selected depending upon the value of .
- Evaluate the objective function described in Equation (27) using new solutions by following the procedure mentioned in step 5.
- Apply the greedy selection process for the onlookers bees.
- Determine the abandoned solution for the scout, if exists and replace it with a new randomly produced solution.
- Memorize the best solution obtained as of now.
- Cycle = Cycle + 1.
- Until (Cycle = Maximum cycle number).
For implementation of the ABC algorithm different control parameters such as number of colony size (employed +onlooker bees), food number, limit, dimension of the problem have been considered as 20, 10, 100, and 4, respectively. The maximum number of cycles has been considered as 200.
5. Result and Discussions
Capacity sizing of the different components of the hybrid energy system, as shown in Figure 1, to meet the AC and DC primary load demand of a small community center is the main aim of the study. Four main parameters, i.e., a rating of PV panel, fuel cell, electrolyzer and size of hydrogen tank have been considered as decision variables. The size of the inverter has not been considered as an optimization parameter, it has been selected on the basis of peak load demand only, i.e., 12 kW as only DC to AC conversion is there. Technical and economical specifications of the components used in the system have been presented in Table 1. The lifetime of the project was taken as 20 years with an interest rate of 6%, whereas the lifetime of the fuel cell was taken as 50,000 h.
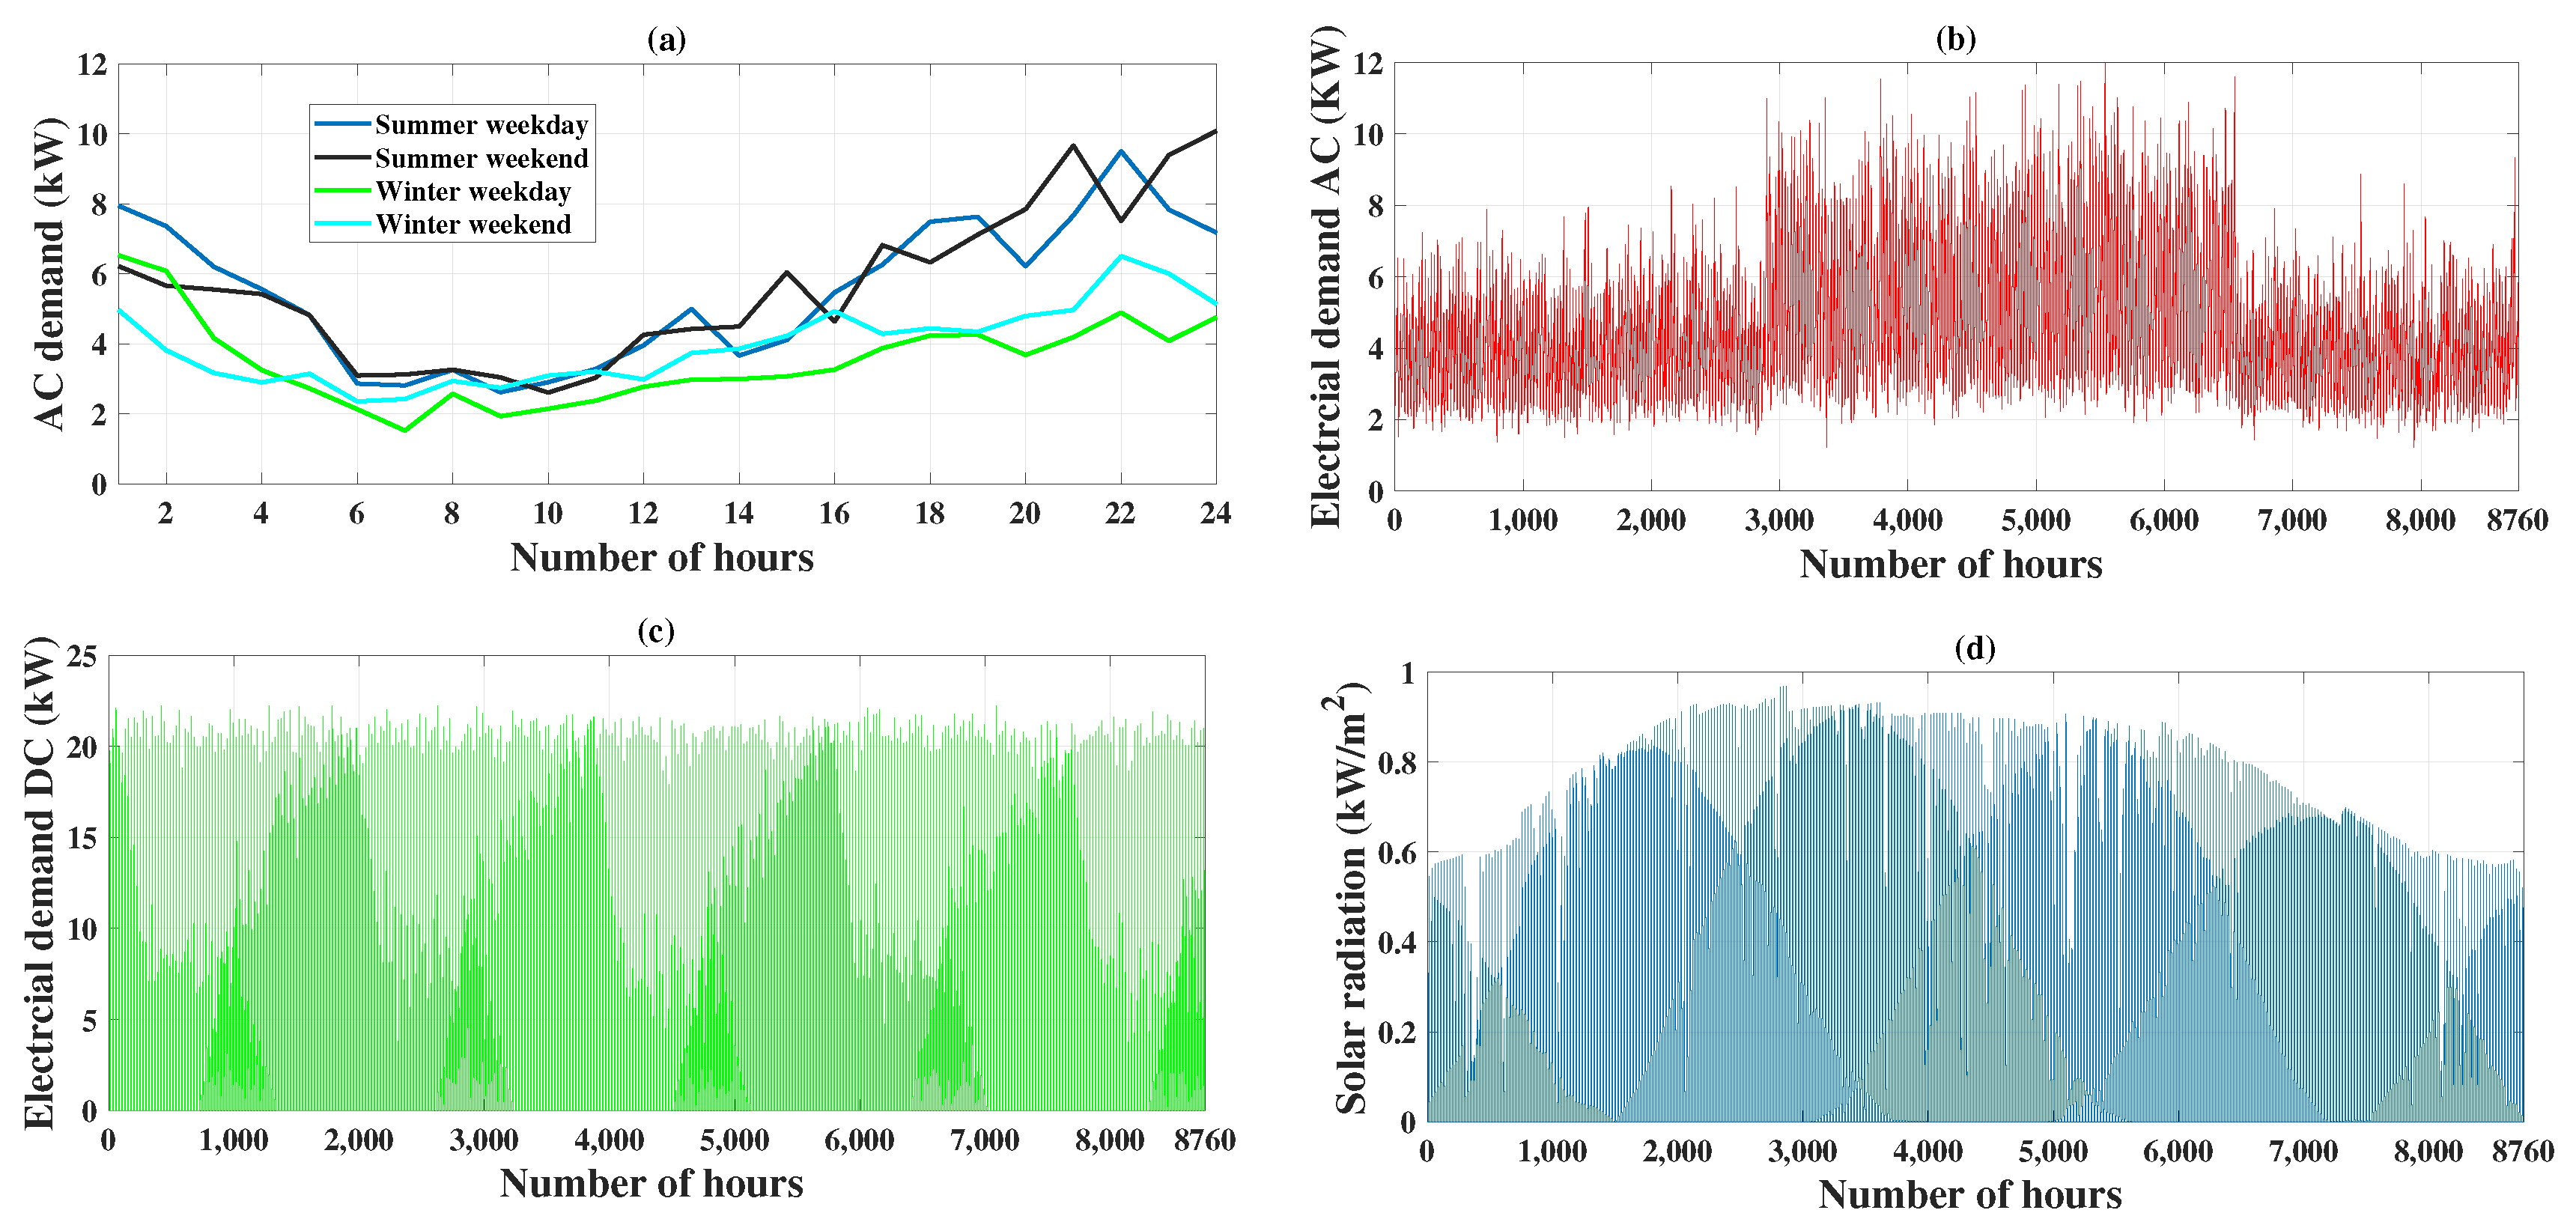
Figure 3 shows the resource data used in the simulation. A simulation is run on MATLAB 2017 with a time interval of one hour for a complete year. Figure 3a shows AC primary load demand used in the study (weekends and weekdays). The load demand at weekends in winters and summers is having a peak of 6 kW and 12 kW, respectively, whereas during weekday load demand is comparatively less than weekends having a peak of 6.50 kW in winters and 9.50 kW in summers. Figure 3b shows electric AC load demand throughout the year with average load demand of 110 kWh/day and overall average of 4.5 kW. Figure 3c shows electric DC load demand throughout the year. AC demand has been varied 10% time to time and day to day. Figure 3d shows solar radiation data throughout the year with an average solar radiation of 5.14 kWh/m/day [22].
The algorithm is run for a maximum number of iterations of 200. Table 2 summarizes the comparison of optimization results of the proposed hybrid system by ABC algorithm and HOMER. It is inferred from the results that the proposed hybrid system has LCOE of 0.228 $/kWh by ABC algorithm and 0.232 $/kWh by HOMER. The annualized cost analysis obtained by HOMER and ABC has been shown in Table 3. It can be deduced from the results of the ABC and HOMER that ACS of the system accounts to be 15,674 $/yr and 15,776 $/yr, respectively.
The both methods of sizing provides almost equal results with a slight difference in component selection. However, the ABC algorithm provides better results in terms of fulfilment of load requirements.
Table 4 shows electricity production and consumption for a complete year. Energy production from PV panels is 90% of the total energy produced and from fuel cells is 9.5% of the total energy produced. AC and DC primary loads account to be 31% and 22% of the total load demand and electrolyzer load is 46.7% and unmet load is 37 kWh/yr. The configuration obtained by the ABC algorithm provides less unmet load in the system. The unmet load in case of both the systems is due to no availability of hydrogen in the hydrogen tank in few initial hours. Therefore, the system will always have an unmet load. The unmet load could be met only if there is initial hydrogen provided in the hydrogen tank.
For further discussion, the configuration obtained by the ABC algorithm has been selected. Figure 4a shows the convergence characteristics of the ABC algorithm. It is evident from the figure that the algorithm converges in almost initial 20 iterations. Figure 4b demonstrates nominal cash flow throughout the project life. The initial cost of 155,637.19$ is required to set up the project. The annualized cost of the system has been calculated using Equation (27). The only component which needs replacement is a fuel cell as its replacement comes at 11th year. The life time of fuel cell is in hours instead of number of years. The other components considered in the project have the same lifetime as the project life, therefore no replacement is required. The salvage value of the fuel cell is also calculated which is approximately 101$ at the end of project lifetime. The operating and maintenance cost occurs annually, which is shown in figure. Figure 4c show monthly PV and fuel cell power generation. Figure 4d shows monthly hydrogen produced by the electrolyzer. One can note from the figure that in the month of October and November, more fuel cell power has been used by the system.
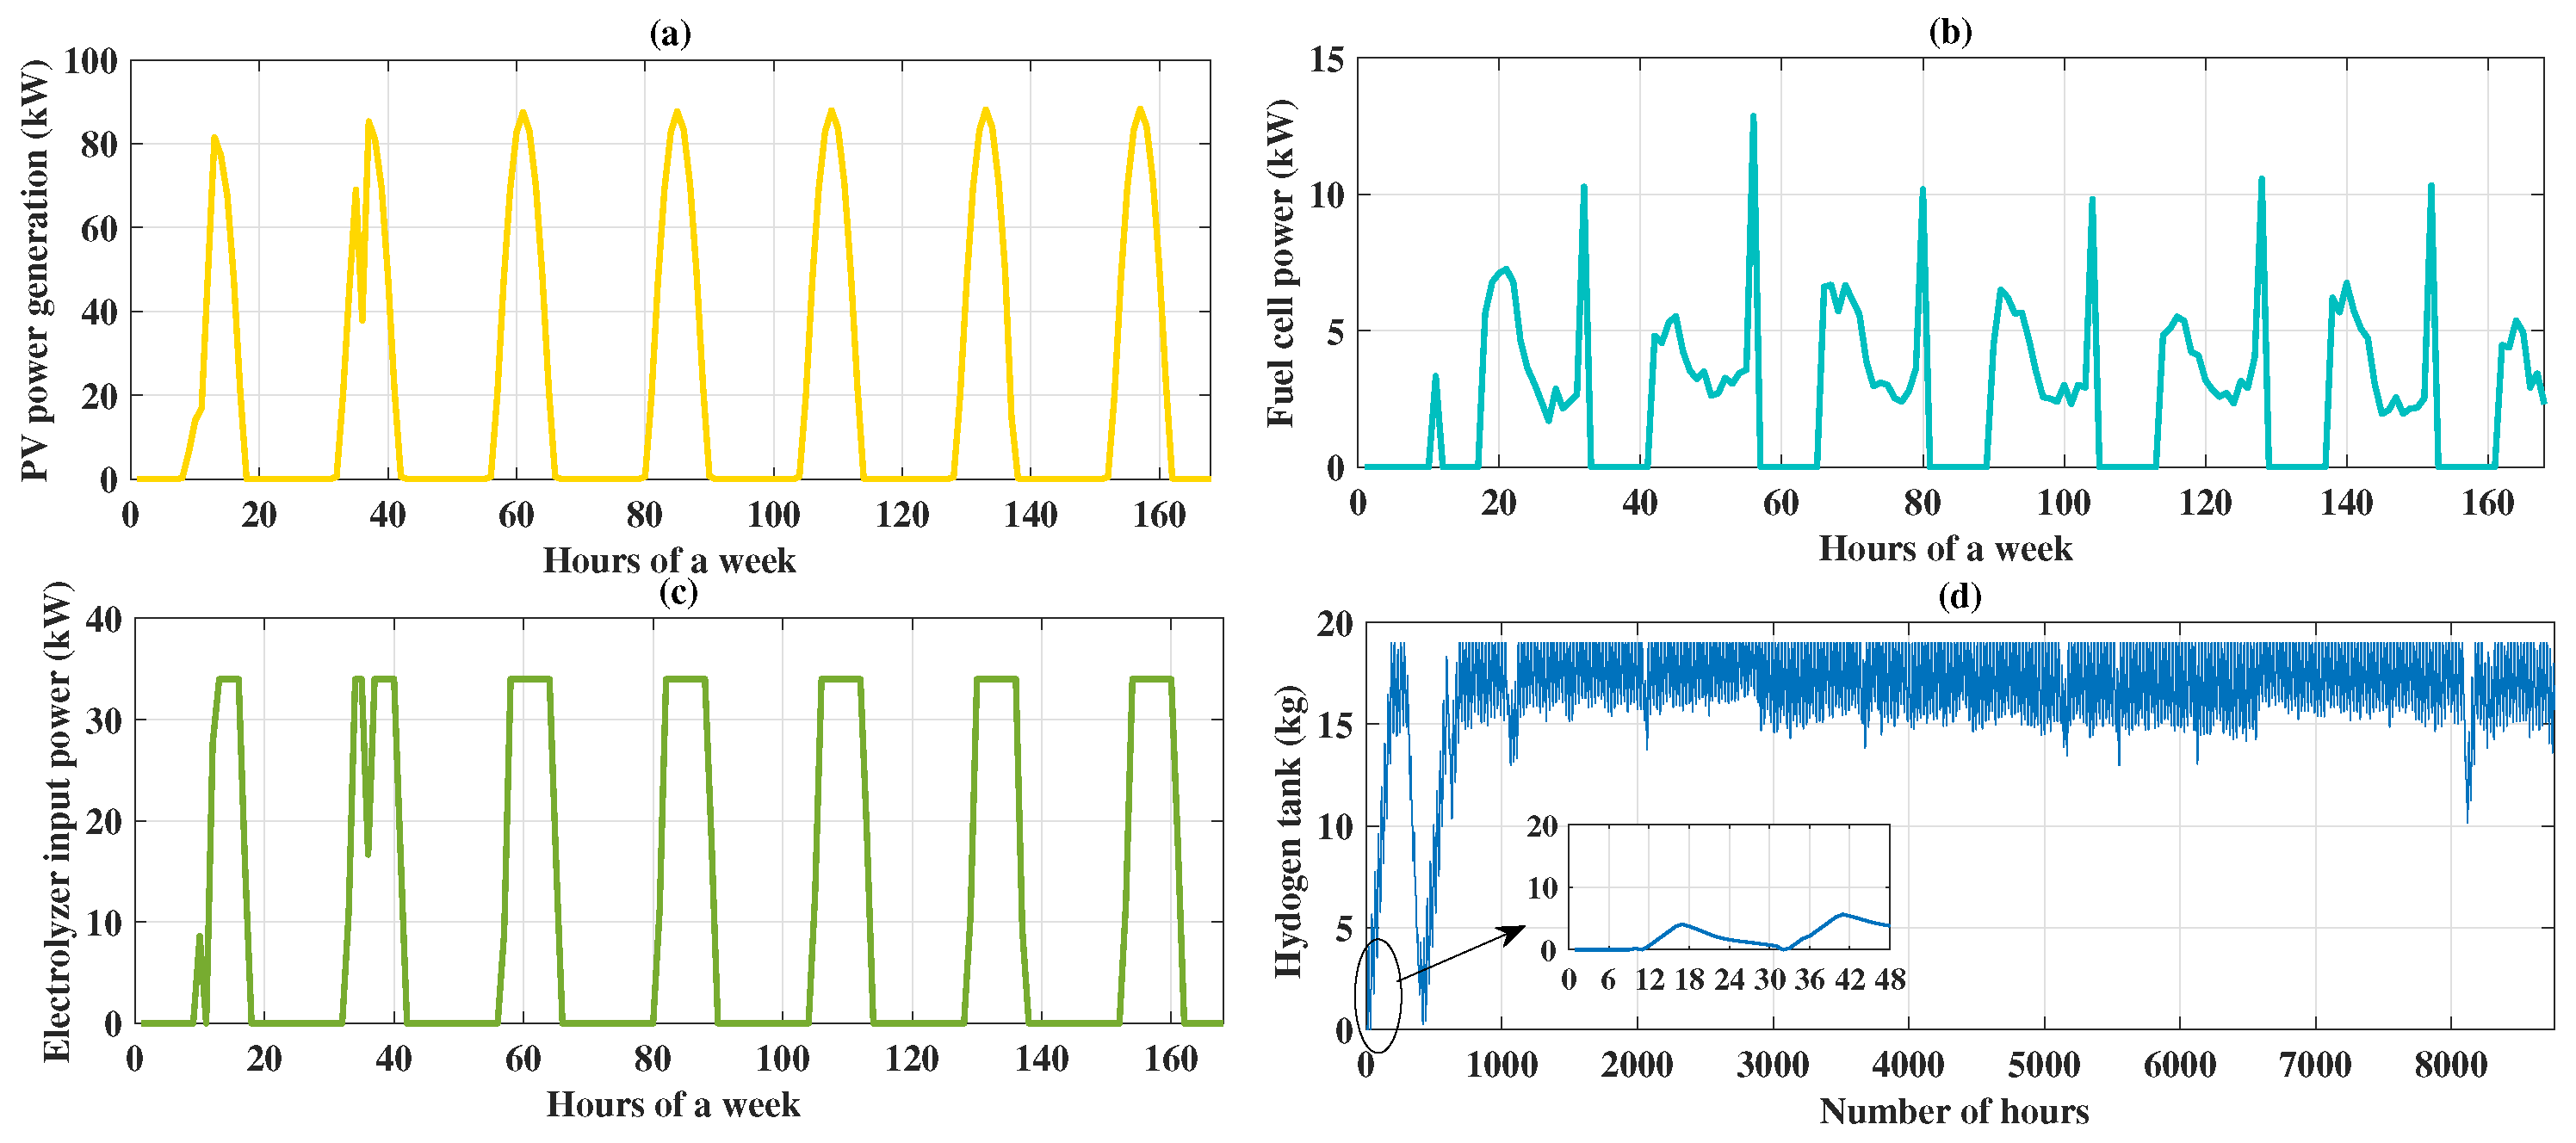
Figure 5a shows PV power generation throughout the a week. Peak and overall power generation throughout the year are 108 kW and 217,287 kWh/yr, respectively. Figure 5b shows the power generated by fuel cell throughout a week, it is found that peak fuel cell power generation is 14.40 kW. Figure 5c shows input power taken by the electrolyzer to produce hydrogen. If input power is more than the maximum rating of the electrolyzer than remaining power could be treated as excess electricity. Figure 5d shows the status of the hydrogen stored in the tank throughout the year. It can be seen from the figure that hydrogen tank autonomy is in the month of January only due to the lack of hydrogen generation.
Figure 6a shows the status of the hydrogen consumption and production (kg/h) throughout the week. For hydrogen production, 34 kW electrolyzer can produce a maximum of 0.78 kg/h of hydrogen as calculated by Equation (11). Figure 6b shows excess electricity produced by the system throughout the week. The excess electricity could be fed to some dump or inferred load. Figure 6c,d shows unmet load throughout the year and on the very first-day of simulation. The unmet load is due to no availability of hydrogen in few initial hours, therefore the system will always have an unmet load. The unmet load could be met only if there is initial hydrogen is provided in the tank. The case is just similar to the batteries connected systems, if batteries are not fully charged initially.
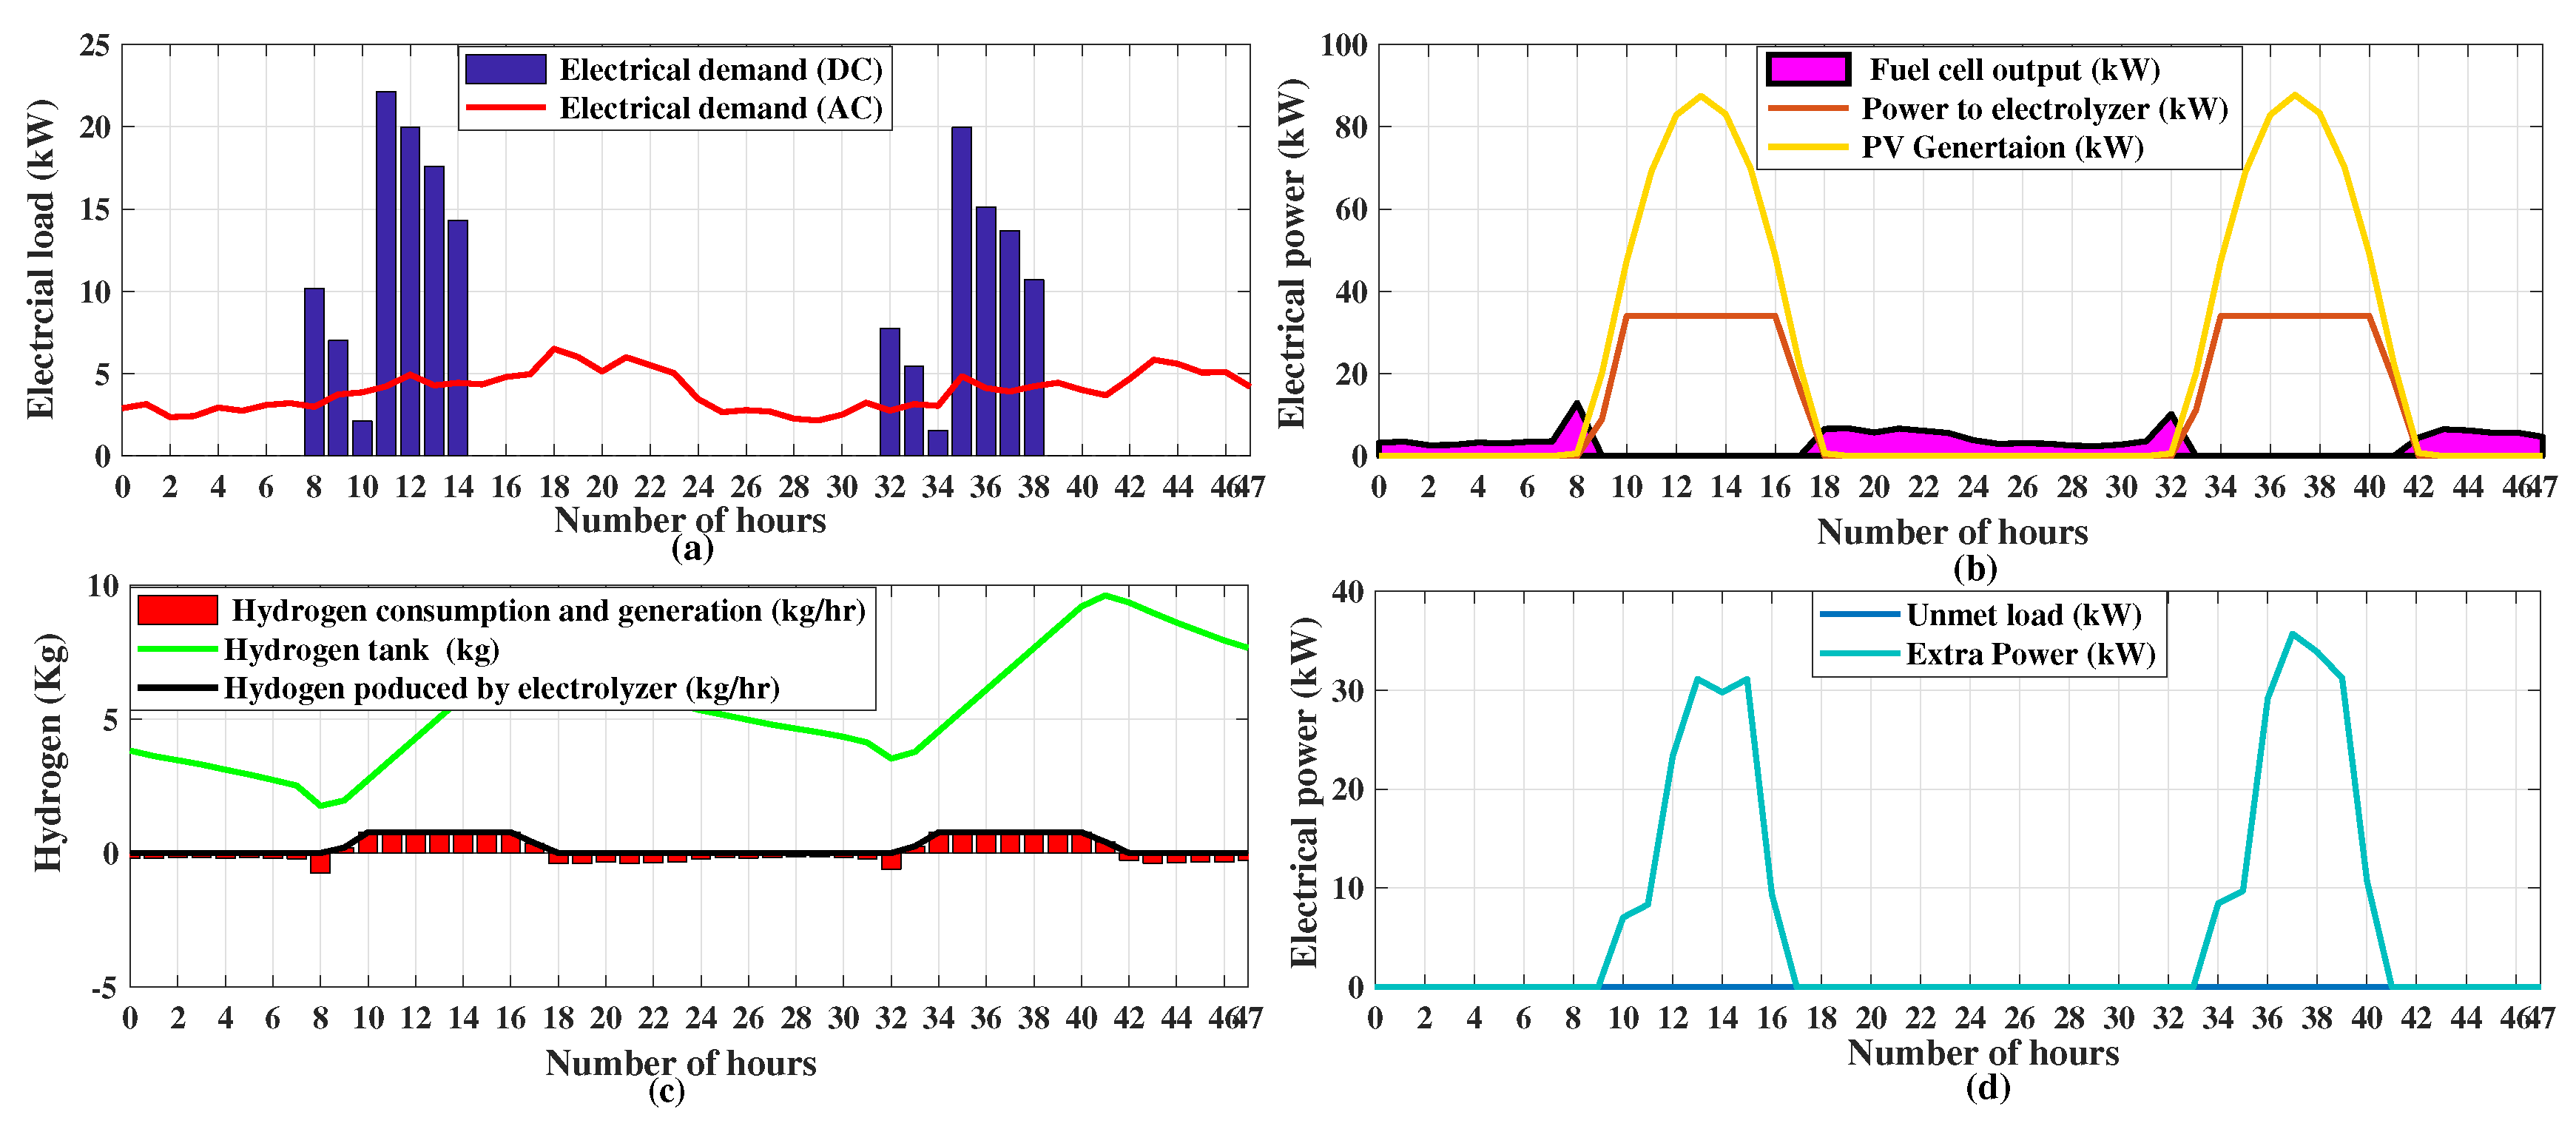
In order for better understanding of power and hydrogen management of the system, two days in winter and summer have been selected randomly. Figure 7 shows power and hydrogen management in two days, i.e., 48 h in the winters. Figure 7a shows AC and DC electric load demand. During the interval 12 noon to 1:00 p.m. the AC and DC electric load demand is 4.93 kW and 19.98 kW respectively, resulting in total demand of 24.91 kW. Figure 7b shows fuel cell and PV power generation and input power taken by the electrolyzer. During the considered interval, i.e., 12 noon to 1:00 p.m. there is no power generation from fuel cell and from PV panels it is 82.79 kW. The power input taken by the electrolyzer during this interval to produce hydrogen is 34 kW. Figure 7c shows hydrogen balance in two days. Hydrogen produced by the electrolyzer during the considered interval was 0.77 kg/h, thereby increasing hydrogen storage tank status to 4.28 kg. Figure 7d shows unmet load and excess power generated. There was no unmet load during the considered interval and excess electricity was 23.32 kW. It is evident from the figure that all the constraints have been satisfied.
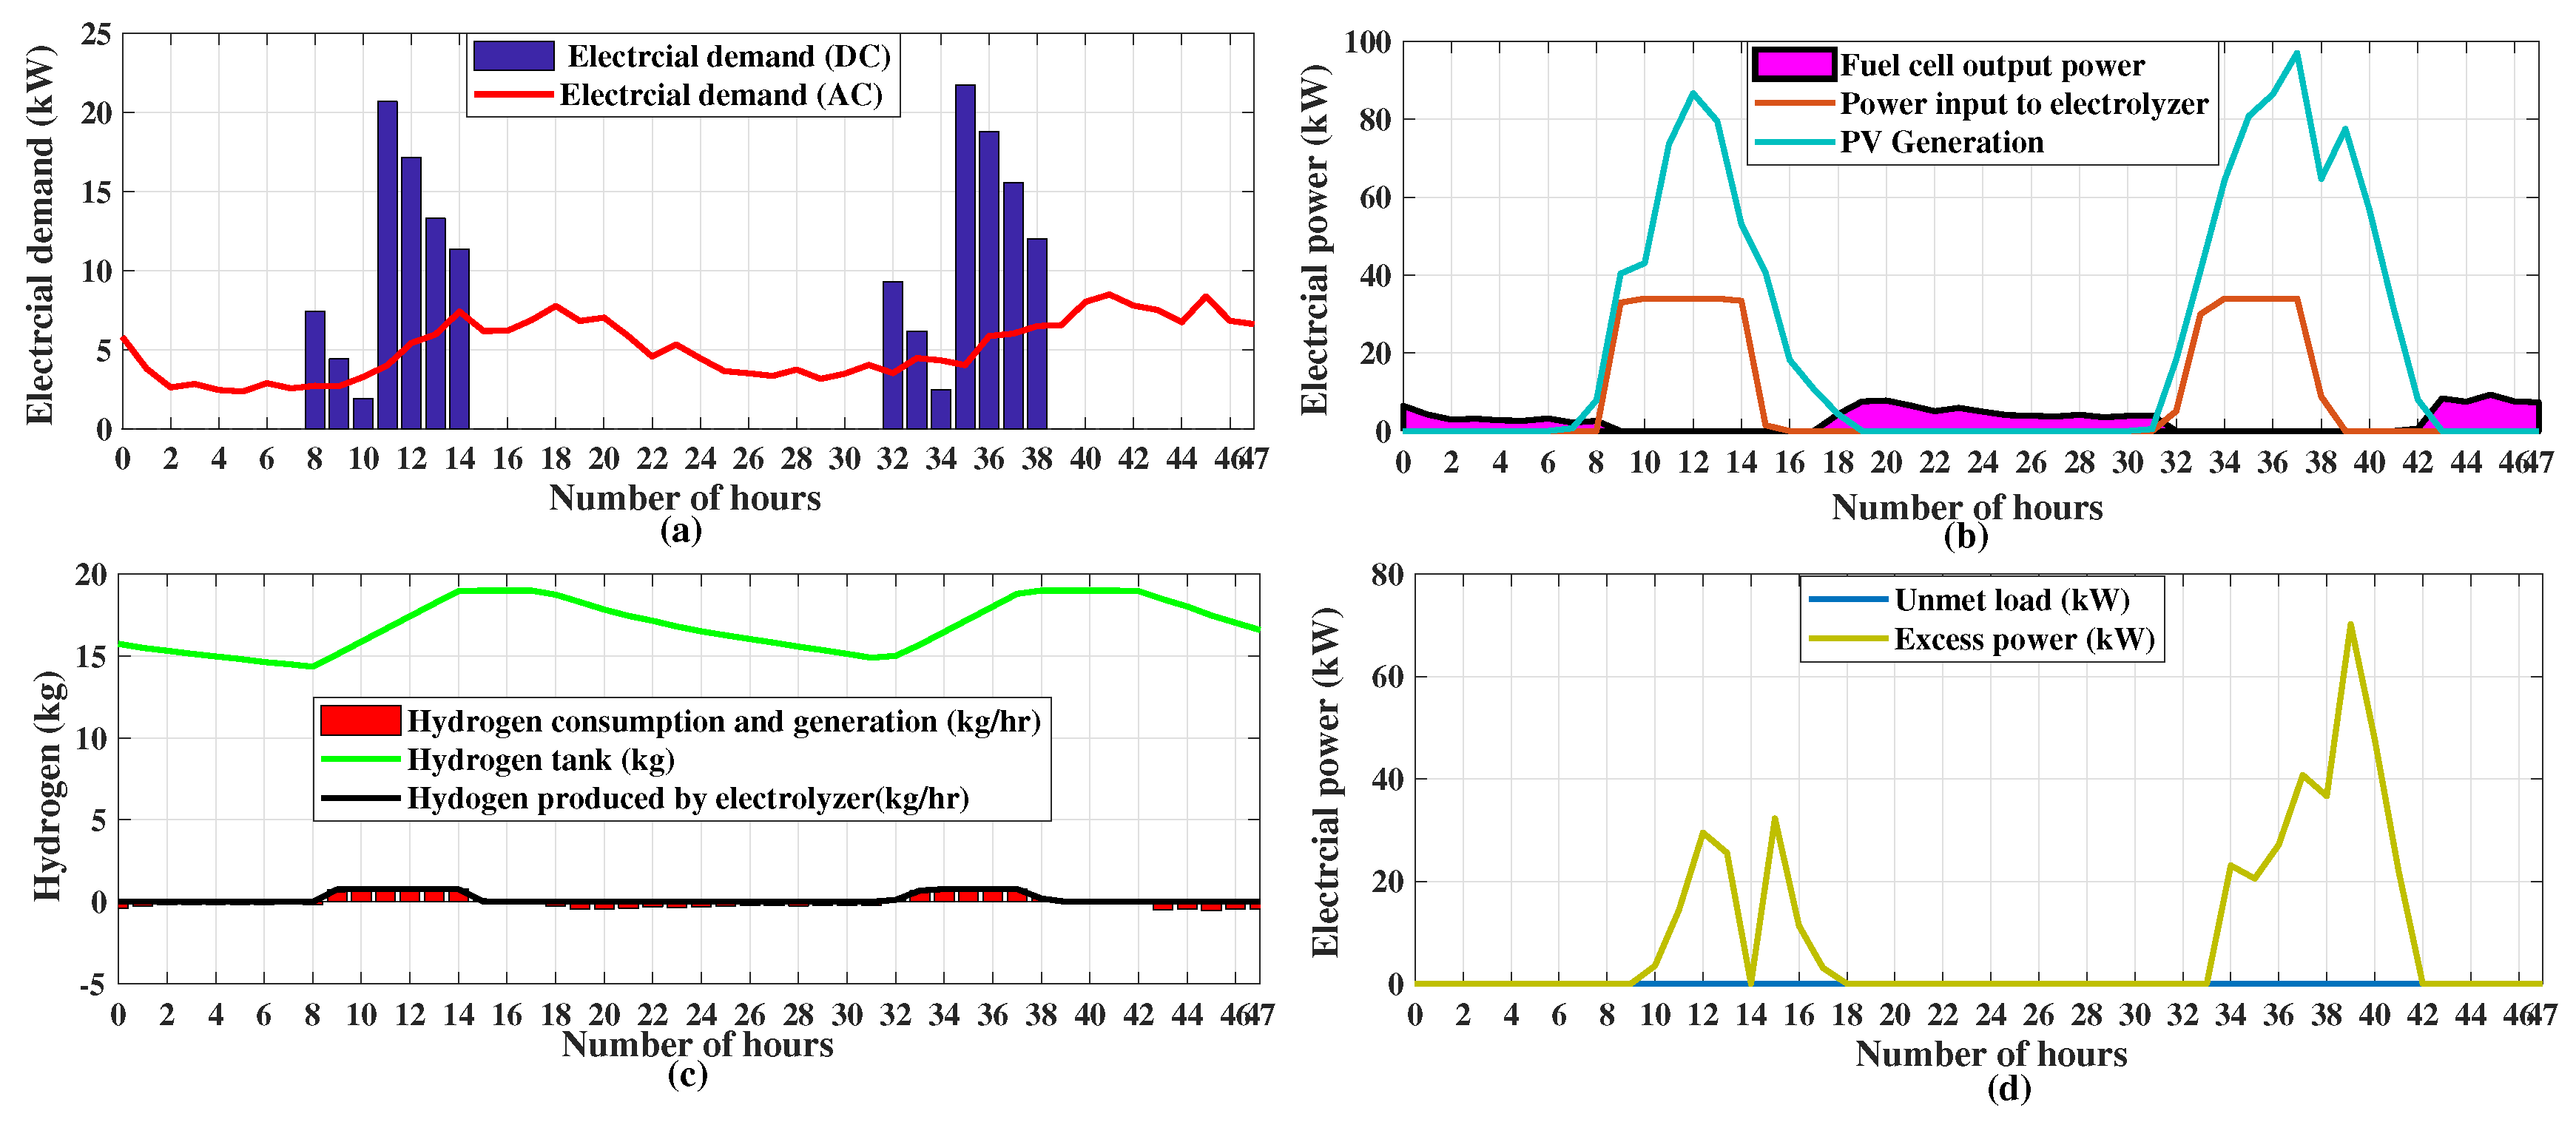
Figure 8 shows power and hydrogen management in two days, i.e., 48 h in the summers. Figure 8a shows AC and DC electric load demand. During the interval 12 noon to 1:00 p.m. the AC and DC electric load demand was 5.43 kW and 17.14 kW respectively, resulting in total demand of 22.57 kW. Figure 8b shows fuel cell and PV power generation and input power taken by the electrolyzer. During the considered interval, i.e., 12 noon to 1:00 p.m. there is no power generation from fuel cells and from PV panels it is 86.65 kW. The power input taken by the electrolyzer during this interval to produce hydrogen is 34 kW. Figure 8c shows hydrogen balance in two days. Hydrogen produced by the electrolyzer during the considered interval is 0.77 kg/h thereby increasing hydrogen storage tank status to 17.43 kg. Figure 8d shows unmet load and excess power generated. There is no unmet load during the considered interval and excess electricity was 29.48 kW.
The above discussion shows that both kinds of load demands have been fully satisfied in proposed system with the help of solar and fuel cell power generation. The excess power generated by PV during the day has been supplied to the electrolyzer, which further generates hydrogen. The hydrogen tank supplies hydrogen to fuel cells for power generation, particularly when there is no or less solar power generation. As shown in Figure 5d hydrogen tank throughout the year has very less autonomy, which further strengthens the reliability of the proposed system. However, the proposed standalone system suffers few major drawbacks, mainly its total dependence on weather conditions. To overcome this weather uncertainty and to enhance the reliability and stability of the system, a grid connection or battery storage backup or a diesel generator is required. In case of for back up system, a large storage system must be required, which further increases the capital cost the complete system, on the contrary will enhance the reliability of the system.
It can be concluded from the aforesaid discussion that the proposed FC-PV hybrid energy system provides LCOE of 0.228 $/kWh with a LPSP of 0.053 %, which is very much competitive with the other LCOEs found in current literature [10,24] which are 0.20 $/kWh, and 0.228 $/kWh, receptively. The FC-PV based energy system proving to be a reliable and cost effective energy system for off-grid locations, the LCOE of the system generated is very much competitive with other kinds of hybrid energy system found in literature such as hybrid biomass-PV-wind [21], biomass-PV [25] and solar-wind-FC [26] with an LCOE of 0.18 $/kWh, 0.185 $/kWh, and 0.47 $/kWh, respectively.
6. IEC 61850 Implementation
In this section, the operational details of FC-PV hybrid system using IEC 61850 based communication is presented.
6.1. IEC 61850 Based Information Modeling Of FC-PV Hybrid System
The IEC 61850 information model defines a simplified description of a real device in an abstract way. It is method of providing standardized syntax, semantics and hierarchical structures to the data that is exchanged among different devices and systems [27]. In IEC 61850 standard, the information modeling is realized by defining logical nodes and data objects (DOs). Logical nodes are group of data objects which serve specific functions and are defined abstractly in IEC 61850 [28]. A combination of several logical nodes form logical devices which interact with each other in agreement with a set of rules set forth by the standard.
Information modeling of FC-PV hybrid system requires the specific process parameters of various components of FC-PV hybrid system to be modeled as instance of the logical nodes. The information model for PV plant has been developed in [29] with the required DOs as shown in Figure 9. The logical nodes STMP and MMET provide the required temperature characteristics and the meteorological data for the PV panel respectively. The array type is chosen as module with a value of ‘4’ for the DO ‘Typ’ in the logical node DPVA. The power rating of a single module is mapped by DO ‘ArrWRtg’. The total power generated from the PV panel is mapped by the DO ‘MdulWRtg’ of logical node DPVM for the IEC 61850 information model of PV system.
The logical node for the converter is ZCON and has been adopted from the IEC 61850-7-420 standard. To model the loads, a logical node CNLO developed in [29] is used in this paper. The information model of Fuel Cell with the necessary logical nodes and DOs is shown in Table 5. The communication model of the hybrid FC-PV system with developed and pre existing logical nodes is shown in Figure 9. The newly proposed logical nodes have their DOs expanded to present a lucid picture.
The DO ‘VRtg’, ‘IRtg’ and ‘Plim’ are for the voltage and current ratings of fuel cell and for power limit of the fuel cell. The fuel cell maximum hydrogen consumption rate is modeled by DO ‘OutH2Rte’. The fuel cell is turned on/off depending upon the load demand in energy management. This is carried out by opening and closing the supply for fuel. This control is mapped by DO ‘FuelSht’.
For information modeling of the electrolyzer, a new logical node has been developed. The primary function of electrolyzer is to convert excess power available through the PV system to hydrogen gas which can then be used as a fuel to propel fuel cell. The logical node, ‘DELZ’ has been proposed for electrolyzer for the very first time in literature. The data attributes for the newly developed logical node are tabulated in Table 6.
The DO ‘ThermCap is used to map the heating value of electrolyzer in MJ/kg. The DOs ‘MaxTmp’ and ‘MaxPres’ are for keeping in limits the temperature and pressure of the electrolyzer respectively. The DO ‘MaxPwr’ is the maximum power which can be supplied from the electrolyzer. The electrolyzer operates with the conversion efficiency and is mapped by DO ‘PwrH2Ef’. The hydrogen flow rate to the electrolyzer is mapped by the DO ‘HydFlwrate’. The DO ‘FuelSht’ is used for controlling the electrolyzer.
For modeling hydrogen tank, a logical node DHGT has been developed in this paper. The hydrogen tank receives excess hydrogen from the electrolyzer which can be supplied to the fuel cell as and when required. The data attributes for the logical node DHGT has been tabulated in Table 7. The DO ‘H2Presinit’ and ‘H2Presfin’ defines the initial and final pressure of hydrogen tank respectively. The maximum permissible temperature and pressure of hydrogen tank are defined by DO ‘MaxTmpH’ and ‘MaxPresH’.
6.2. Communication Message Exchanges for Realizing Energy Management
To design inter-operable and standardized communication architecture as per IEC 61850 standard, service modeling for different communication messages is required. This has been dealt with in this section. The information modeling for FC-PV hybrid system was done in previous section. The IEC 61850 communication message exchanges for realizing EM are implemented and demonstrated in this section. Based upon the application, IEC 61850 standard three types of services viz. Service for real time communication, service for client server communication and service for time synchronization. For real time communication, Generic Object Oriented Substation Event (GOOSE) and Sampled Value (SV) type of messages is defined. For client server communication Manufacturing Message Specification (MMS) type of message is defined.
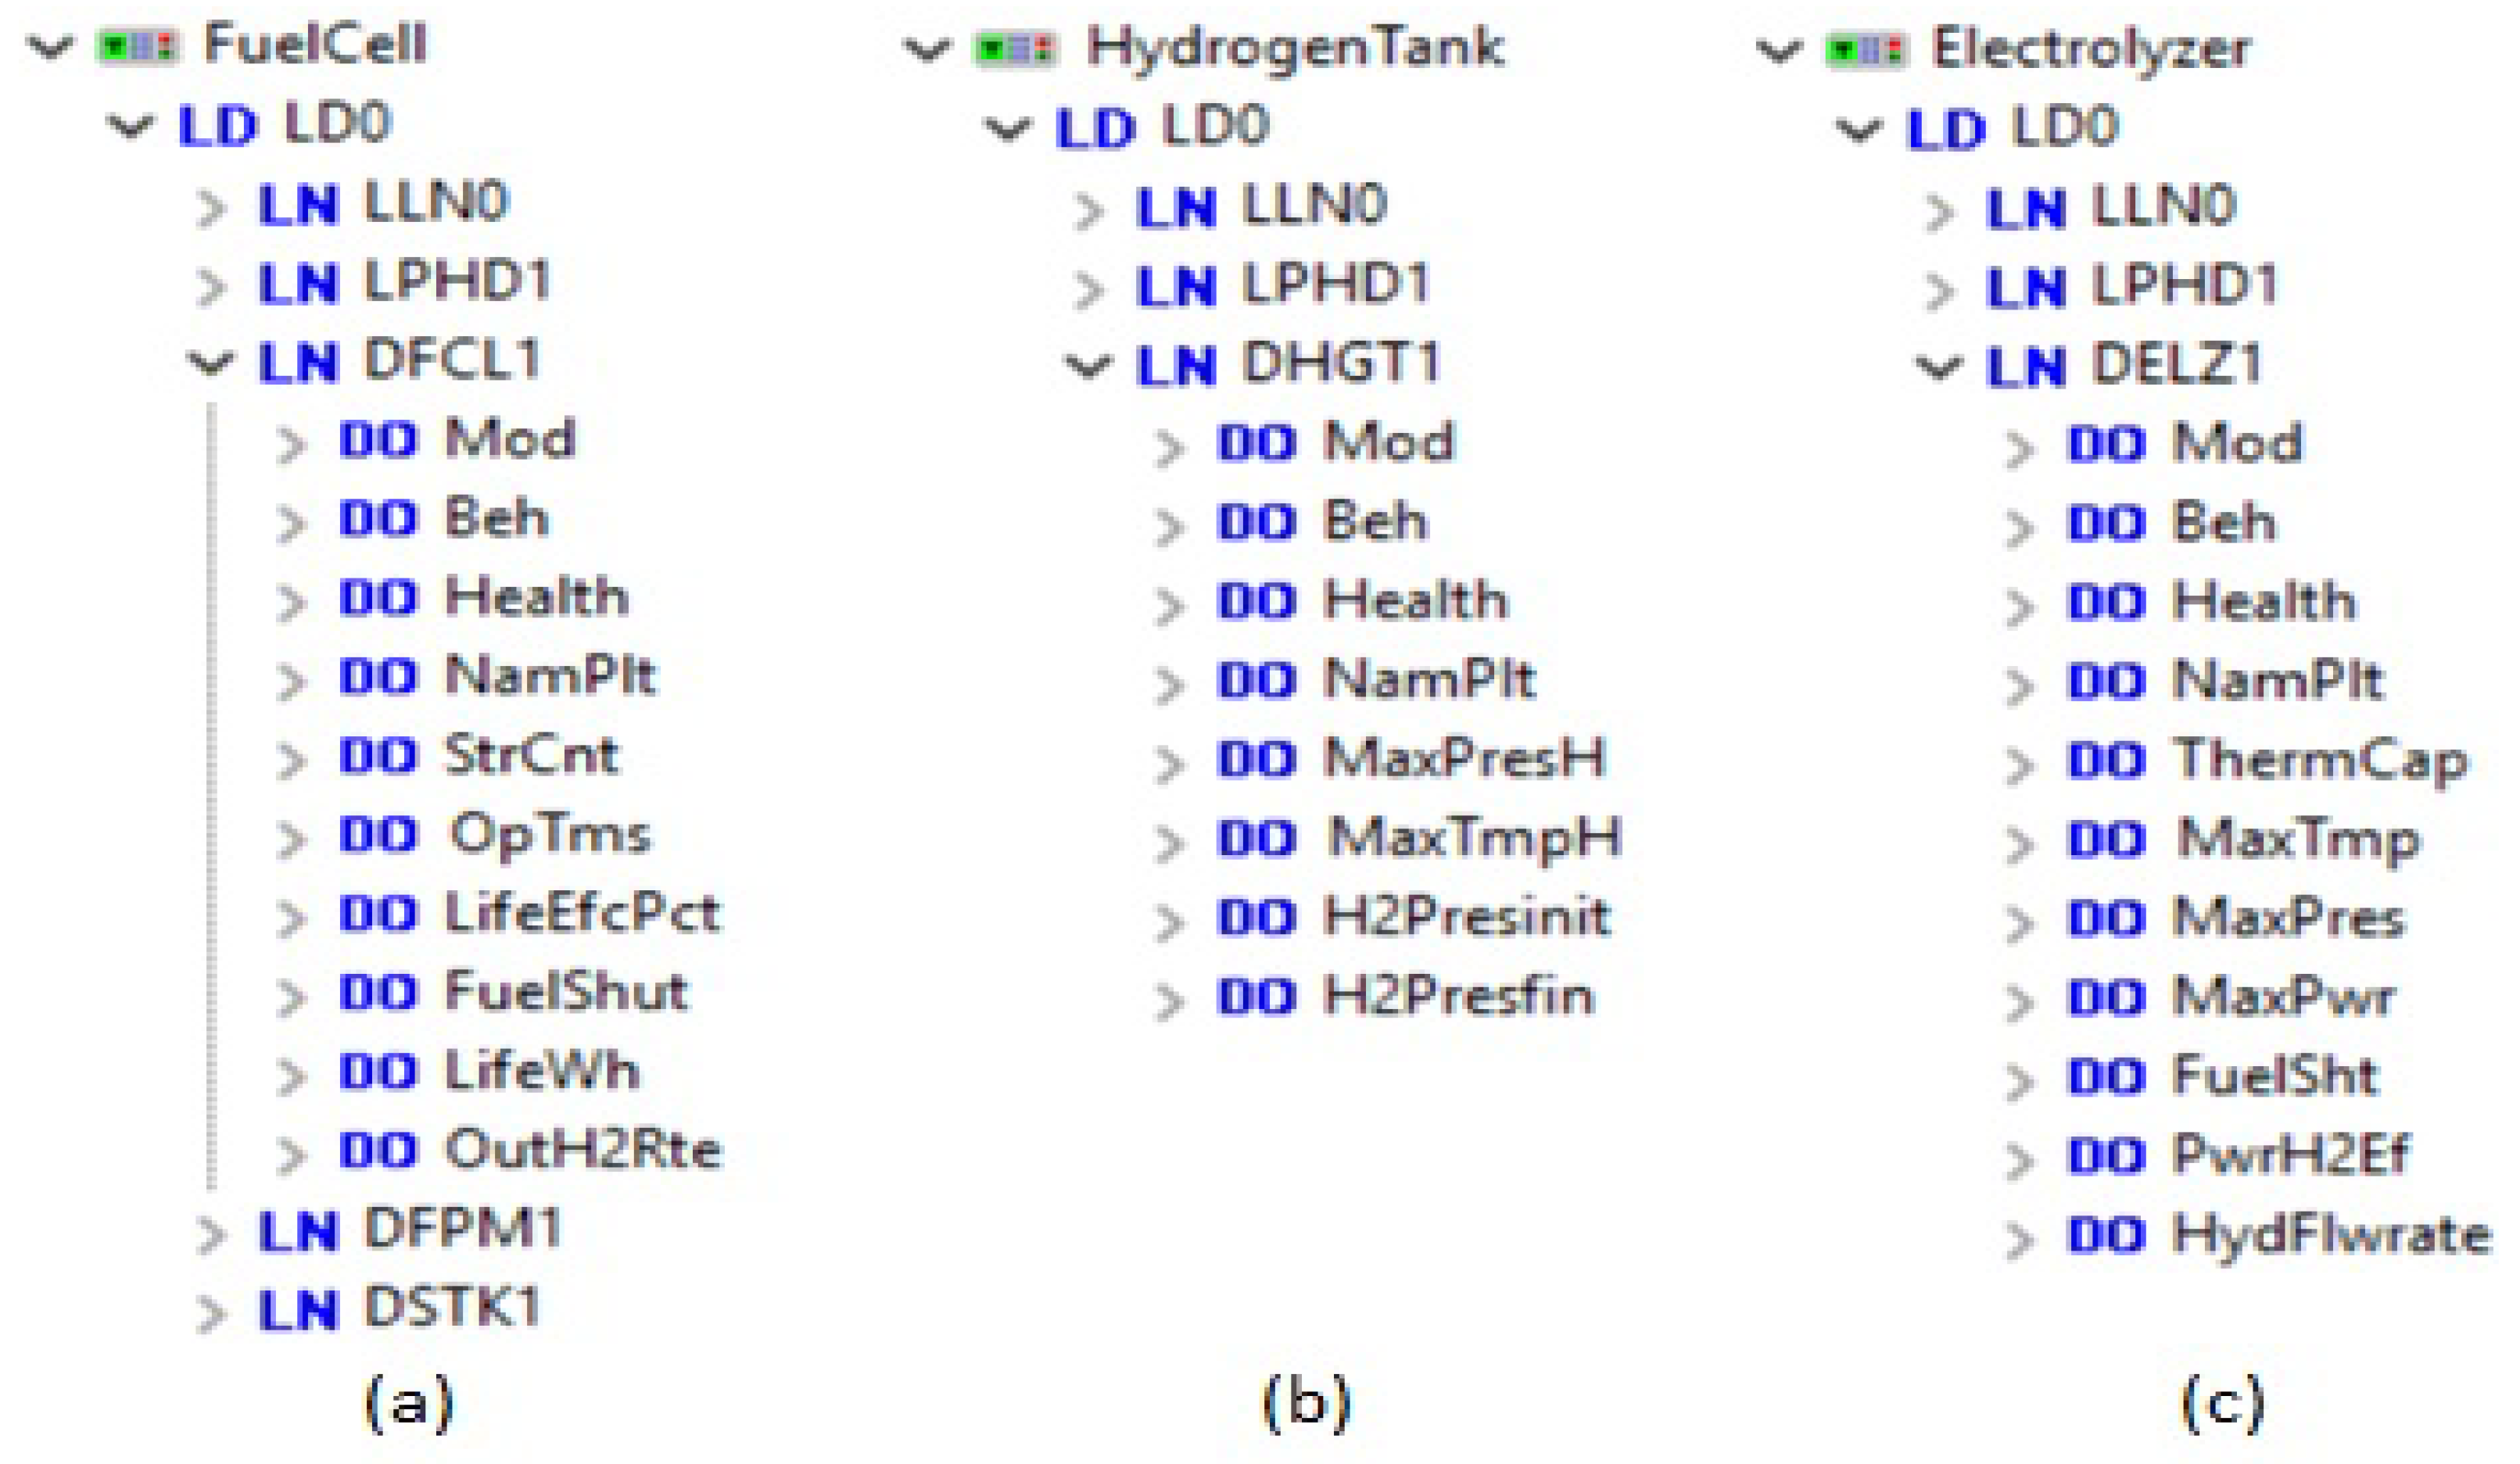
The EM for FC-PV hybrid system is applied on the developed communication model in Figure 9. The system configuration file (SCL) for different components such of FC-PV hybrid system is developed from the IEC 61850 information models developed in Section 6.1. Using these SCL files the IEC 61850 information model of different components is emulated and real time message exchanges are implemented. Figure 10 shows the SCL developed for fuel cell, hydrogen tank and electrolyzer.
The message exchanges required for realizing EM in FC-PV hybrid system are enlisted in Table 8. Table 8 provides details such as source, destination, type, IEC 61850 ACSI service for each message exchange. It summarizes the communication message exchanges for the developed cases I and III. These communication message exchanges forms the basis for realization of IEC 61850 communication for FC-PV hybrid system. The Microgrid Central Controller (MGCC) computes the available power from the FC-PV system and the power requirement of the loads (AC and DC). This requires updating of initial power levels of FC-PV, load requirements which are then used by MGCC to compute power required by (17). The fuel cell updates its status to MGCC by a MMS Read/Response message as shown in Equation (37).
Similarly, other DERs update their status to MGCC as shown in Table 5. The hydrogen tank updates the hydrogen pressure which is used to determine the amount of hydrogen at that time instant. For demonstration, specific cases viz. Cases I and III as described in previous energy management section (Section 3.1) has been considered and tabulated in Table 8. In case I, if required power from (17), , the remaining power is fed to electrolyzer for generating hydrogen which is then fueled to fuel cell and stored in hydrogen tank. For this, the MGCC, makes the value of DO ‘FuelSht’ of logical node DELZ to true by sending a GOOSE message. The MGCC then fetches the current level of hydrogen in the tank. The current level of hydrogen is determined through the hydrogen pressure in the tank. This is done through a MMS type message as shown in Equation (38).
After updating it, the MGCC starts the flow of excess power to electrolyzer and the generated hydrogen is stored in the hydrogen tank. After the process, MGCC updates the hydrogen tank with the final value of hydrogen in it by the DO ‘H2Prefin’. Similarly, IEC 61850 messages exchanges occur to realize the energy management process in the FC-PV hybrid system.
7. Conclusions
In this study, a simplified mathematical model of a FC-PV generation has been proposed for carrying out cost analysis. The optimal size of different components such as the rating of PV panels, fuel cell, electrolyzer and size of hydrogen tank has been deduced by a software tool HOMER and meta-heuristic optimization technique ABC algorithm. IEC 61850 information models for different components of FC-PV hybrid system are presented. Further, the IEC 61850 communication design and message exchanges for realizing energy management and energy flows are presented. It is observed from the results that a cost-effective AC/DC hybrid energy system could be designed by proper sizing of components and efficiently managing energy flow between system components. The result obtained by the ABC algorithm shows that the proposed system meets an AC load demand of 40 MWh/yr and DC demand of 28 MWh/yr with the help of 129 kW PV panels, 15 kW fuel cell and 34 kW electrolyzer with a hydrogen tank capacity of 19 kg at a very competitive price of electricity 0.228 $/kWh. The NPC of the system is found to be $0.18 million with a renewable power generation fraction of nearly one. The system has a LPSP of 0.05%, which is almost negligible and provide a 108 MWh/yr, excess electricity which can be further used for dump load. The proposed hybrid energy system may be helpful in generating emission-free power and to reduce dependency on grid, particularly in developing countries.
Author Contributions
Conceptualization, S.S., M.A.A., P.C. and S.M.S.H.; methodology, S.S., M.A.A. and S.M.S.H.; software, S.S. and P.C.; validation, S.S., M.A.A.; formal analysis, S.S., M.A.A. and I.A.; investigation, S.S., P.C., M.A.A., I.A., S.M.S.H. and T.S.U.; resources, S.M.S.H. and T.S.U.; writing–original draft preparation, S.S., P.C. and M.A.A.; writing–review and editing, S.M.S.H., I.A., and T.S.U.; visualization, S.S., M.A.A. and P.C.; supervision, I.A. and T.S.U.; funding acquisition, S.M.S.H. All authors have read and agreed to the published version of the manuscript.
Funding
This research received no external funding.
Conflicts of Interest
The authors declare no conflict of interest.
References
- Masters, G.M. Renewable and Efficient Electric Power Systems; Willy Inter Science: Hoboken, NJ, USA, 2004; ISBN 0-471-28060-7. [Google Scholar]
- John, A.T.; Amawarisenua, K.T. Generation power through hydrogen-oxygen fuel cells. Int. J. Eng. Sci. 2014, 4, 56–62. [Google Scholar]
- Rahman, S.; Tam, K. A feasibility study of photovoltaic-fuel cell hybrid energy system. IEEE Trans. Energy Convers. 1988, 3, 50–55. [Google Scholar] [CrossRef]
- Rekioua, D.; Bensmail, S.; Bettar, N. Development of hybrid photovoltaic-fuel cell system for stand-alone application. Int. J. Hydrog. Energy 2014, 39, 1604–1611. [Google Scholar] [CrossRef]
- Bayrak, G.; Mehmet, C. Grid connected fuel cell and PV hybrid power generating system design with Matlab Simulink. Int. J. Hydrog. Energy 2014, 39, 8803–8812. [Google Scholar] [CrossRef]
- Jiang, Z. Power management of hybrid Photovoltaic—Fuel Cell power systems. In Proceedings of the IEEE Power Engineering Society General Meeting, Montreal, QC, Canada, 18–22 June 2006. [Google Scholar]
- Saeed, W.; Warkozek, G. Modeling and analysis of renewable PEM Fuel Cell System. Energy Proc. 2015, 74, 87–101. [Google Scholar] [CrossRef] [Green Version]
- Ganguly, A.; Misra, D.; Ghosh, S. Modeling and analysis of solar photovoltaic-electrolyzer-fuel cell hybrid power system integrated with a floriculture greenhouse. Energy Build. 2010, 42, 2036–2043. [Google Scholar] [CrossRef]
- Mostofi, F.; Safavi, M. Application of ABC Algorithm for grid-independent hybrid Hydro/Photovoltaic/Wind/Fuel Cell power generation system considering cost and reliability. Int. J. Renew. Energy Res. 2013, 3, 928–940. [Google Scholar]
- Khemariya, M.; Mittal, A.; Baredar, P.; Singh, A. Cost and size optimization of solar photovoltaic and fuel cell based integrated energy system for un-electrified village. J. Energy Storage 2017, 14, 62–70. [Google Scholar] [CrossRef]
- Singh, A.; Baredar, P.; Gupta, B. Techno-economic feasibility analysis of hydrogen fuel cell and solar photovoltaic hybrid renewable energy system for academic research building. Energy Convers. Manag. 2017, 145, 398–414. [Google Scholar] [CrossRef]
- Ghenai, C.; Salameh, T.; Merabet, A. Technico-economic analysis of off grid solar PV/ Fuel cell energy system for residential community in desert region. Int. J. Hydrog. Energy 2018. [Google Scholar] [CrossRef]
- Hybrid Power System Optimization Software. Available online: https://www.homerenergy.com (accessed on 4 January 2020).
- Karaboga, D.; Basturk, B. A powerful and efficient algorithm for numerical function optimization: Artificial bee colony (ABC) algorithm. J. Glob. Optim. 2007, 39, 459–671. [Google Scholar] [CrossRef]
- Karaboga, D.; Basturk, B. A comparative study of Artificial Bee Colony algorithm. Appl. Math. Comput. 2009, 214, 108–132. [Google Scholar] [CrossRef]
- Ali, I.; Hussain, S.M.S. Control and management of distribution system with integrated DERs via IEC 61850 based communication. Eng. Sci. Tech. Int. J. 2017, 20, 956–964. [Google Scholar] [CrossRef]
- Aftab, M.A.; Hussain, S.M.S.; Ali, I.; Ustun, T.S. IEC 61850 and XMPP Communication Based Energy Management in Microgrids Considering Electric Vehicles. IEEE Access 2018, 6, 35657–35668. [Google Scholar] [CrossRef]
- EG&G Technical Services, Inc. Fuel Cell Handbook, 7th ed.; Solid State Energy Conversion Alliance: Torrance, CA, USA, 2002.
- Mao, L.; Jackson, L.; Davies, B. Effectiveness of a Novel Sensor Selection Algorithm in PEM Fuel Cell On-Line Diagnosis. IEEE Trans. Ind. Electron. 2018, 65, 7301–7310. [Google Scholar] [CrossRef] [Green Version]
- Ghenai, C.; Bettayeb, M. Optimized design and control of an off grid solar PV/hydrogen fuel cell power system for green buildings. IOP Conf. Ser. Earth Environ. Sci. 2017, 93, 1–11. [Google Scholar] [CrossRef]
- Singh, S.; Singh, M.; Kaushik, S.C. Feasibility study of an islanded microgrid in rural area consisting of PV, wind, biomass and battery energy storage system. Energy Convers. Manag. 2016, 128, 178–190. [Google Scholar] [CrossRef]
- Singh, S.; Kaushik, S.C. Optimal sizing of grid integrated hybrid PV-biomass energy system using artificial bee colony algorithm. IET Renew. Power Gen. 2016, 10, 642–650. [Google Scholar] [CrossRef]
- Singh, S.; Chauhan, P.; Singh, N.J. Capacity optimization of grid connected solar/fuel cell energy system using hybrid ABC-PSO algorithm. Int. J. Hydrog. Energy 2020. [Google Scholar] [CrossRef]
- Zhanga, W.; Malekic, A.; Rosend, M.A.; Liu, L. Sizing a stand-alone solar-wind-hydrogen energy system using weather forecasting and a hybrid search optimization algorithm. Energy Convers. Manag. 2019, 180, 609–621. [Google Scholar] [CrossRef]
- Heydari, A.; Askarzadeh, A. Optimization of a biomass-based photovoltaic power plant for an off-grid application subject to loss of power supply probability concept. Appl. Energy. 2016, 165, 601–611. [Google Scholar] [CrossRef]
- Samy, M.M.; Barakata, S.; Ramadan, H.S. Techno-economic analysis for rustic electrification in Egypt using multi-source renewable energy based on PV/ wind/ FC. Int. J. Hydrog. Energy 2019. [Google Scholar] [CrossRef]
- Aftab, M.A.; Hussain, S.M.S.; Ali, I.; Ustun, T.S. Novel SCL Configuration Method for Modeling Microgrids With IEC 61850. IEEE Syst. J. 2019. [Google Scholar] [CrossRef]
- Hussain, S.M.S.; Aftab, M.A.; Ali, I. IEC 61850 Modeling of DSTATCOM and XMPP Communication for Reactive Power Management in Microgrids. IEEE. Syst. J. 2018, 12, 3215–3225. [Google Scholar] [CrossRef]
- Ali, I.; Hussain, S.M.S. Communication Design for Energy Management Automation in Microgrd. IEEE Trans. Smart Grid 2018, 9, 2055–2064. [Google Scholar]
Figure 1.
Schematic diagram of the proposed hybrid energy system.
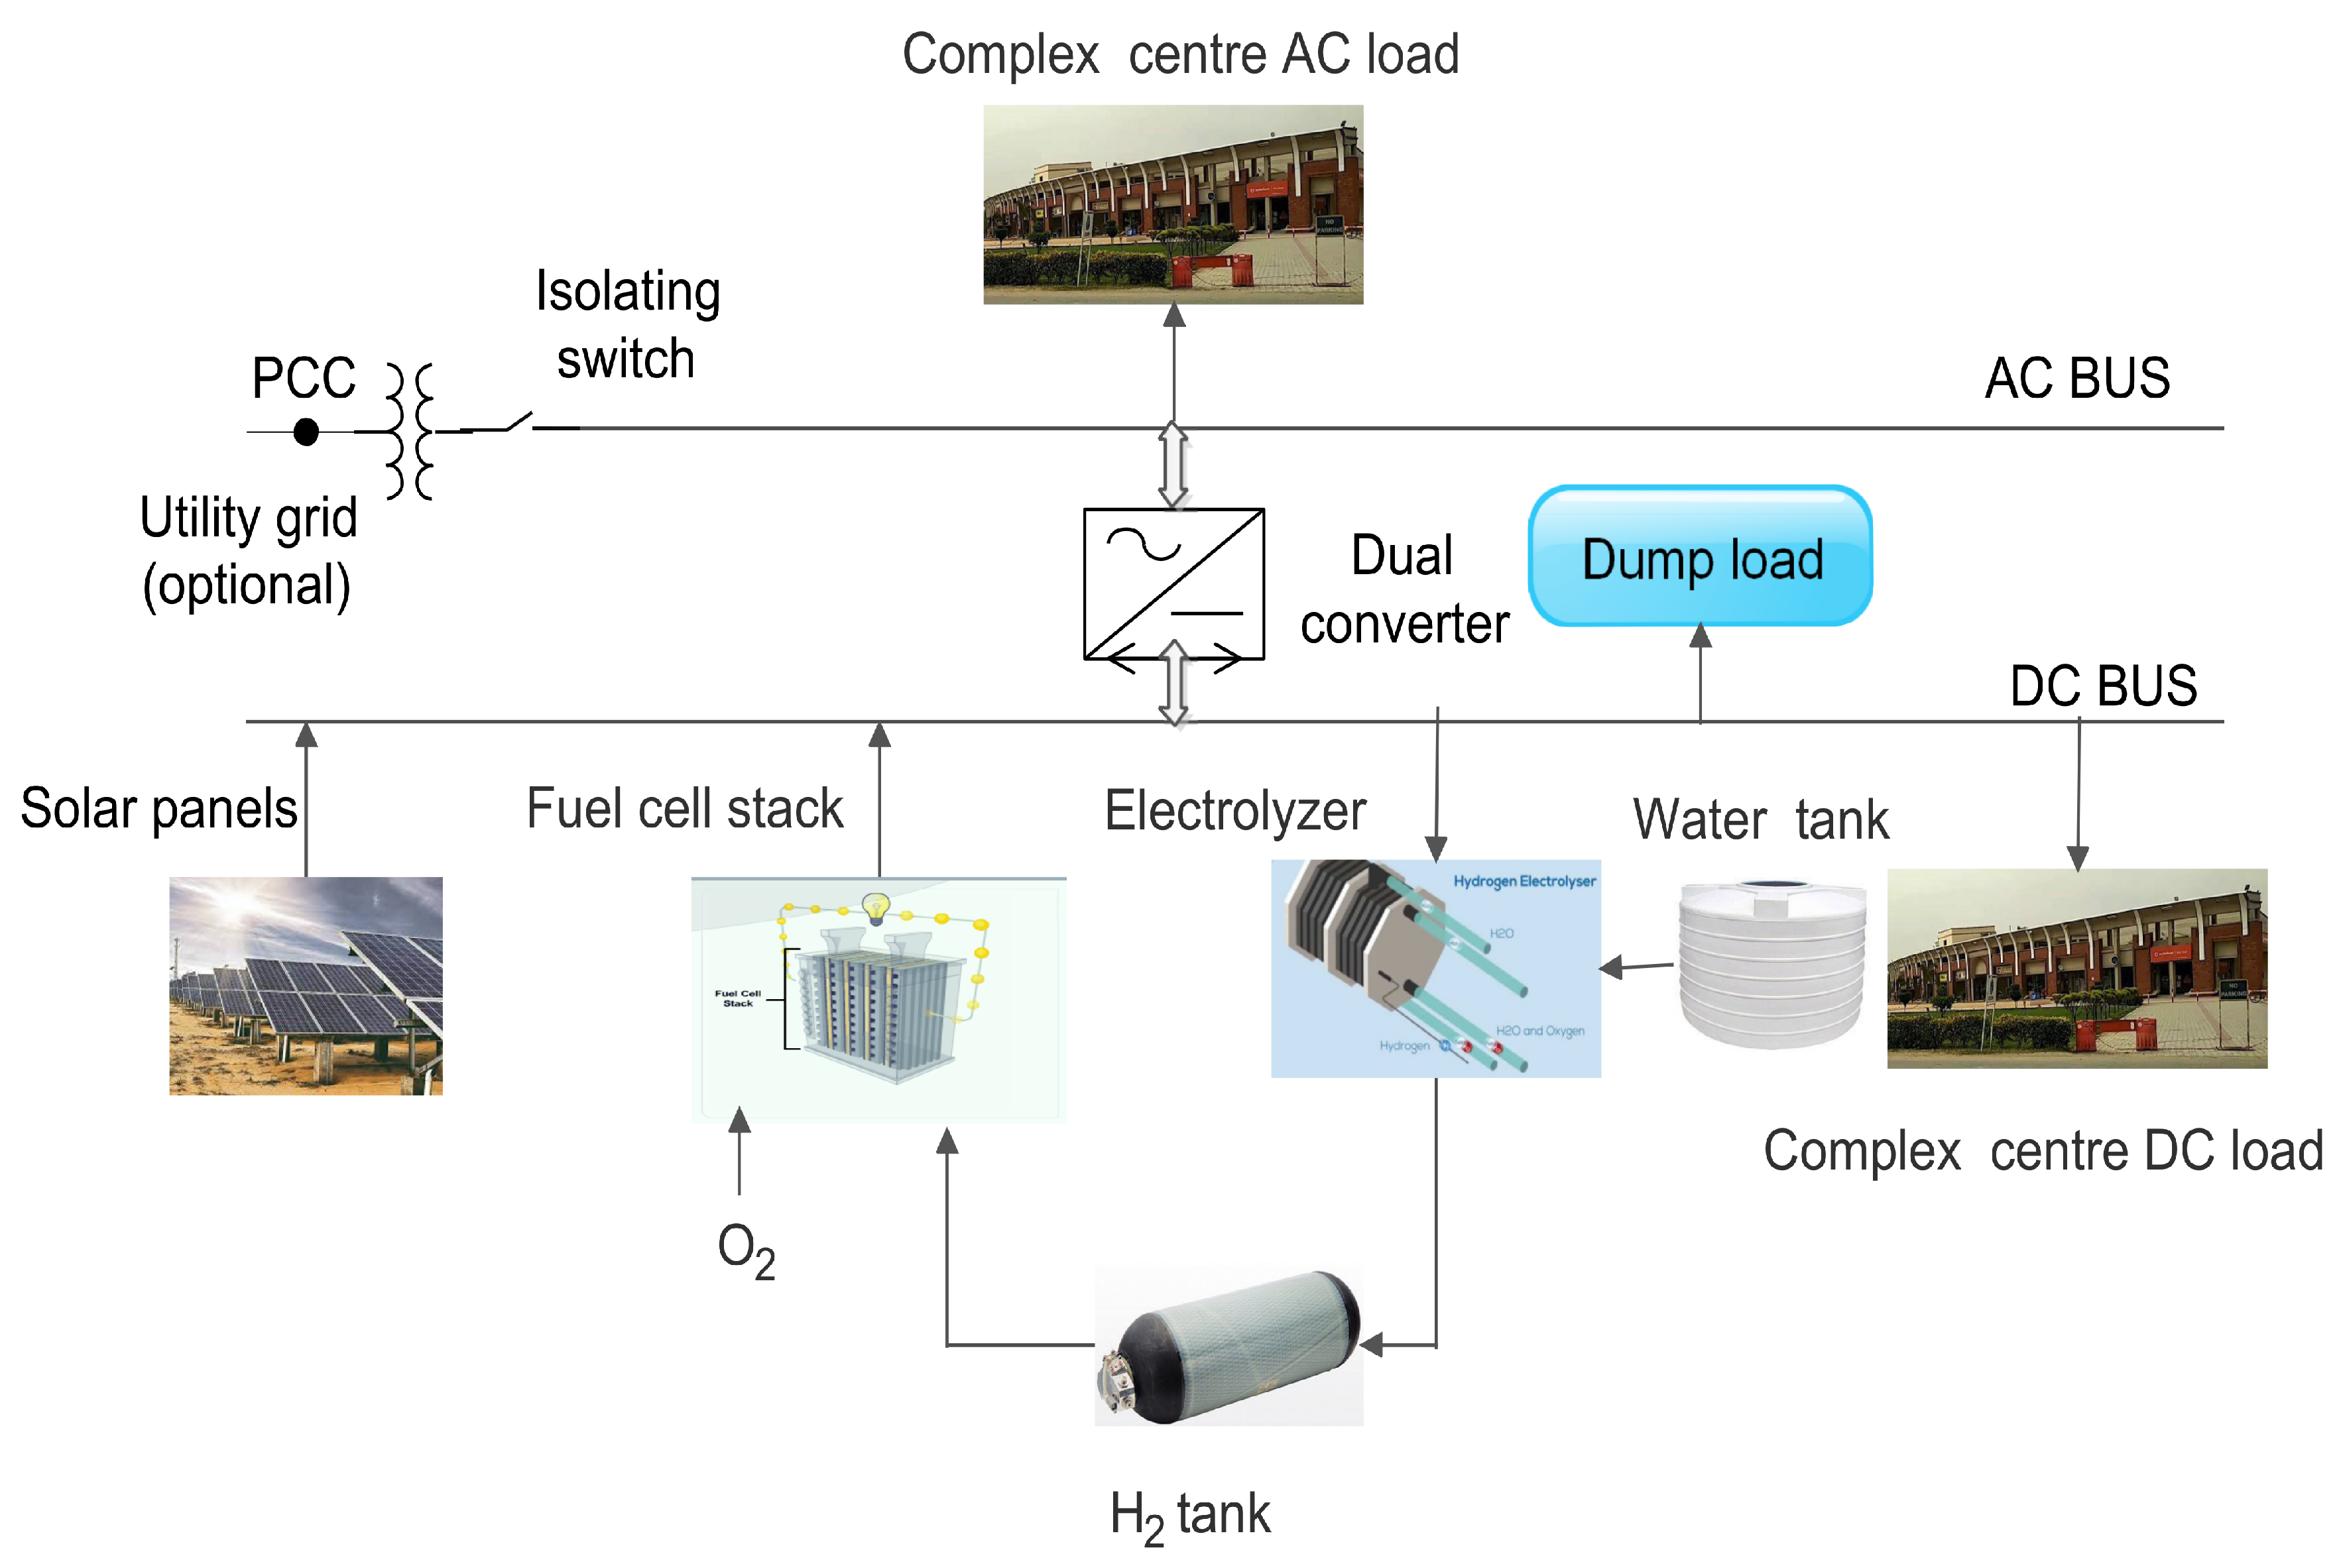
Figure 2.
Flow chart for energy management of the proposed system.
Figure 3.
(a) Load profile of the study area; (b) electrical demand (AC) yearly; (c) electrical demand (DC) yearly; (d) solar radiation yearly.
Figure 3.
(a) Load profile of the study area; (b) electrical demand (AC) yearly; (c) electrical demand (DC) yearly; (d) solar radiation yearly.
Figure 4.
(a) Convergence characteristics of the ABC algorithm; (b) nominal cash flow throughout the project life; (c) monthly photovoltaic (PV) and fuel cell (FC) power generation; (d) monthly hydrogen produced by the electrolyzer.
Figure 4.
(a) Convergence characteristics of the ABC algorithm; (b) nominal cash flow throughout the project life; (c) monthly photovoltaic (PV) and fuel cell (FC) power generation; (d) monthly hydrogen produced by the electrolyzer.
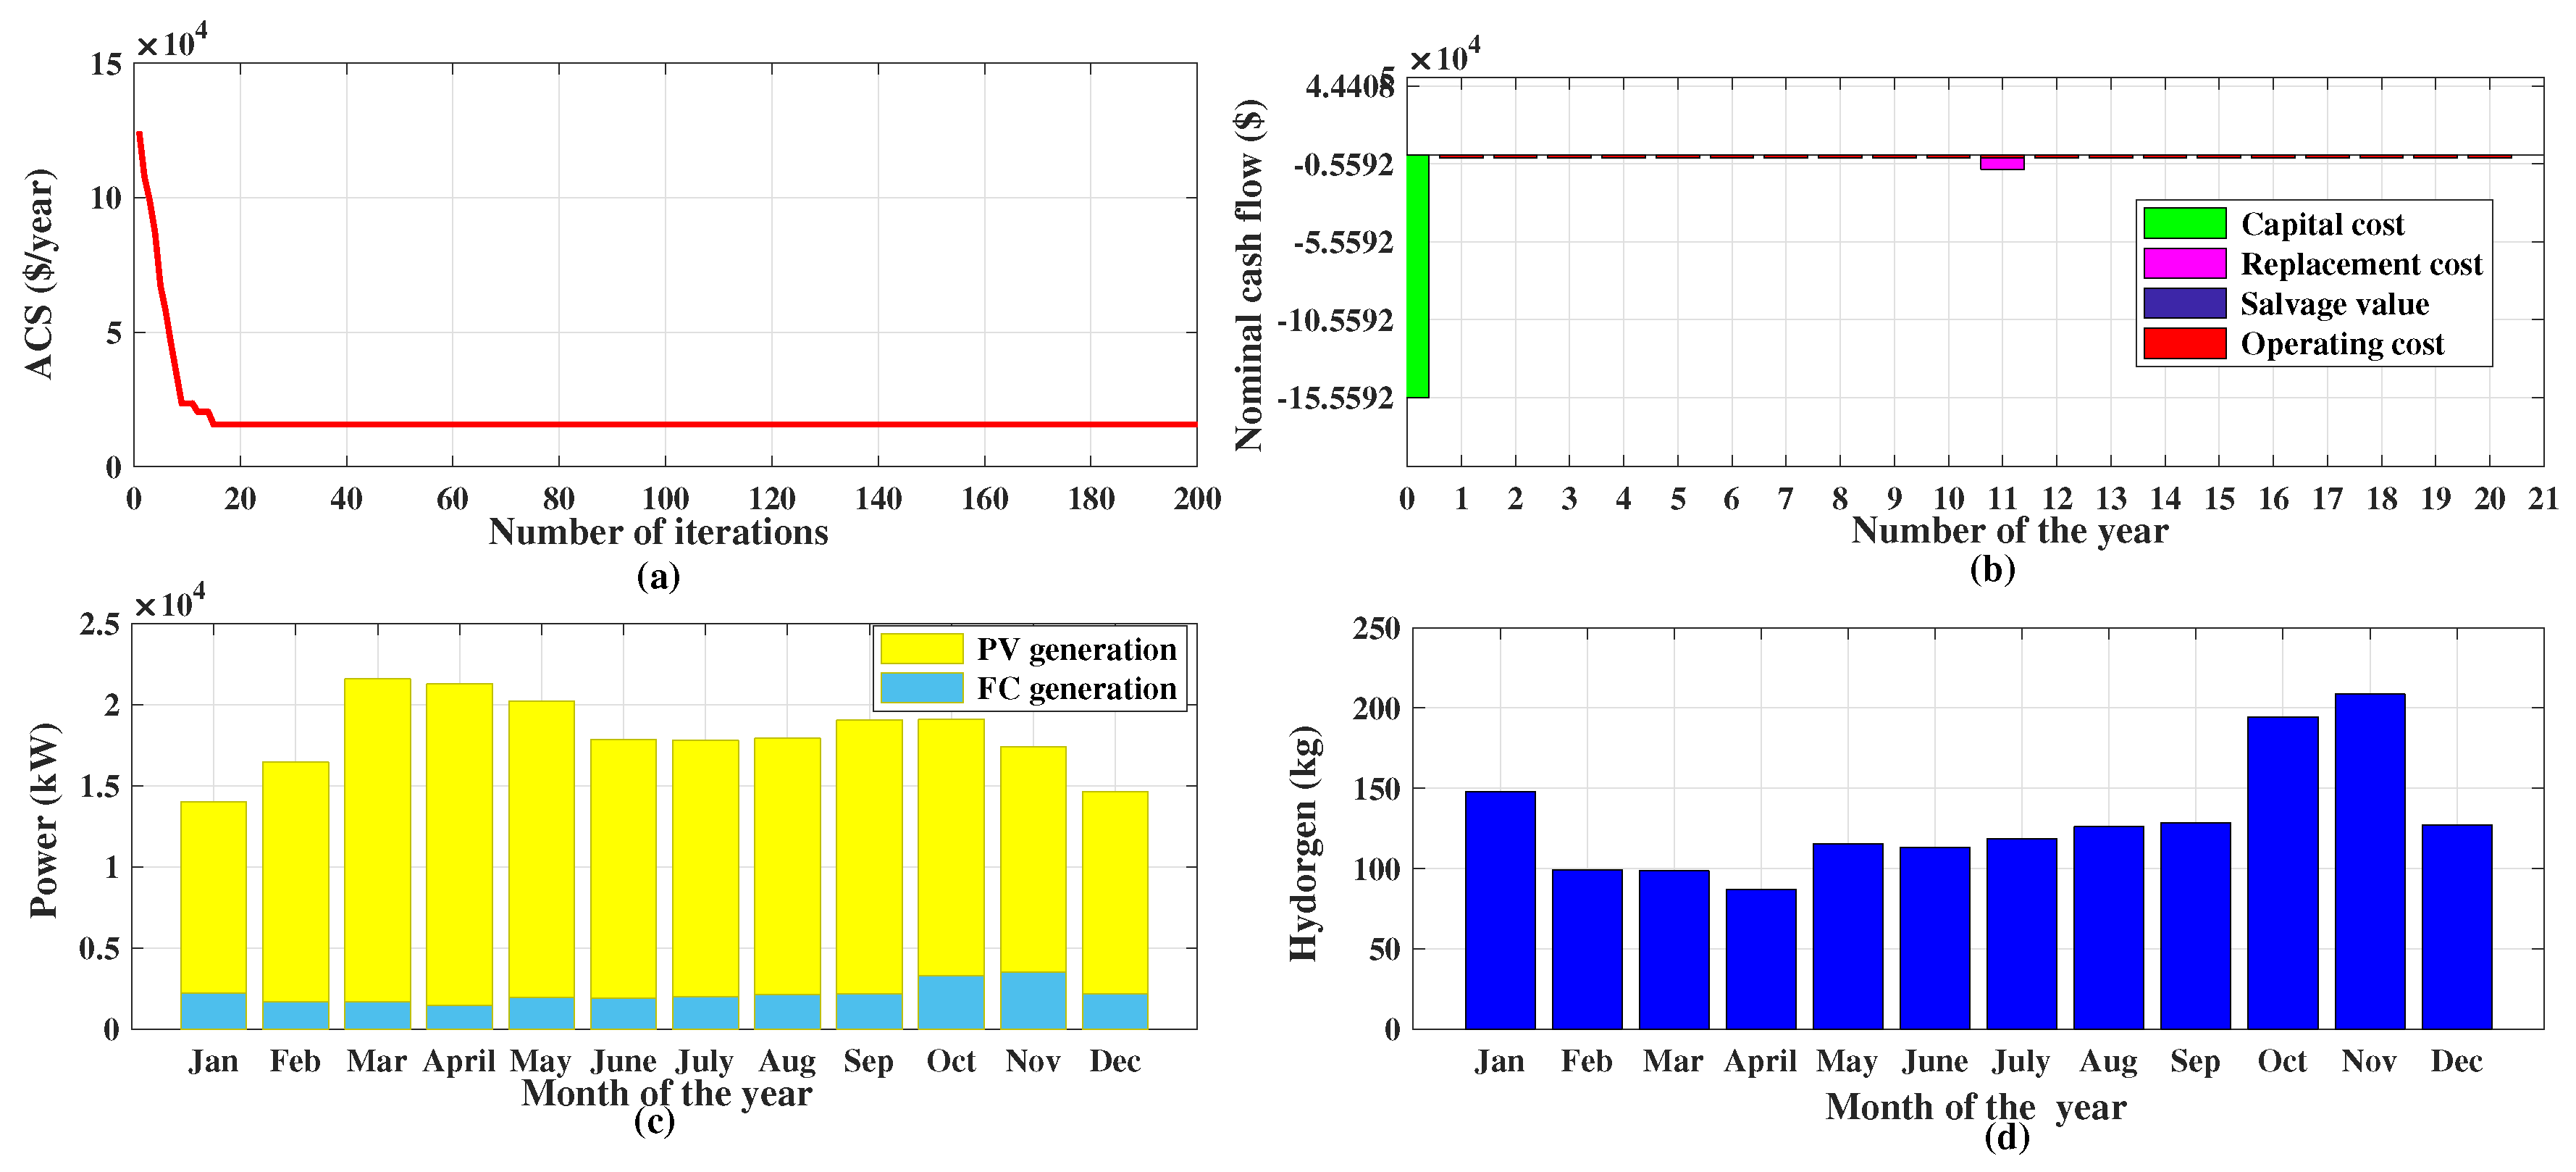
Figure 5.
(a) Power generated by PV panels in one week; (b) fuel cell power generation in one week; (c) electrolyzer input power in one week; (d) hydrogen tank storage status throughout the year.
Figure 5.
(a) Power generated by PV panels in one week; (b) fuel cell power generation in one week; (c) electrolyzer input power in one week; (d) hydrogen tank storage status throughout the year.
Figure 6.
(a) Hydrogen consumption and production in one week; (b) excess electricity produced by the system for a week; (c) unmet demand throughout the year; (d) unmet demand on the very first day of simulation.
Figure 6.
(a) Hydrogen consumption and production in one week; (b) excess electricity produced by the system for a week; (c) unmet demand throughout the year; (d) unmet demand on the very first day of simulation.
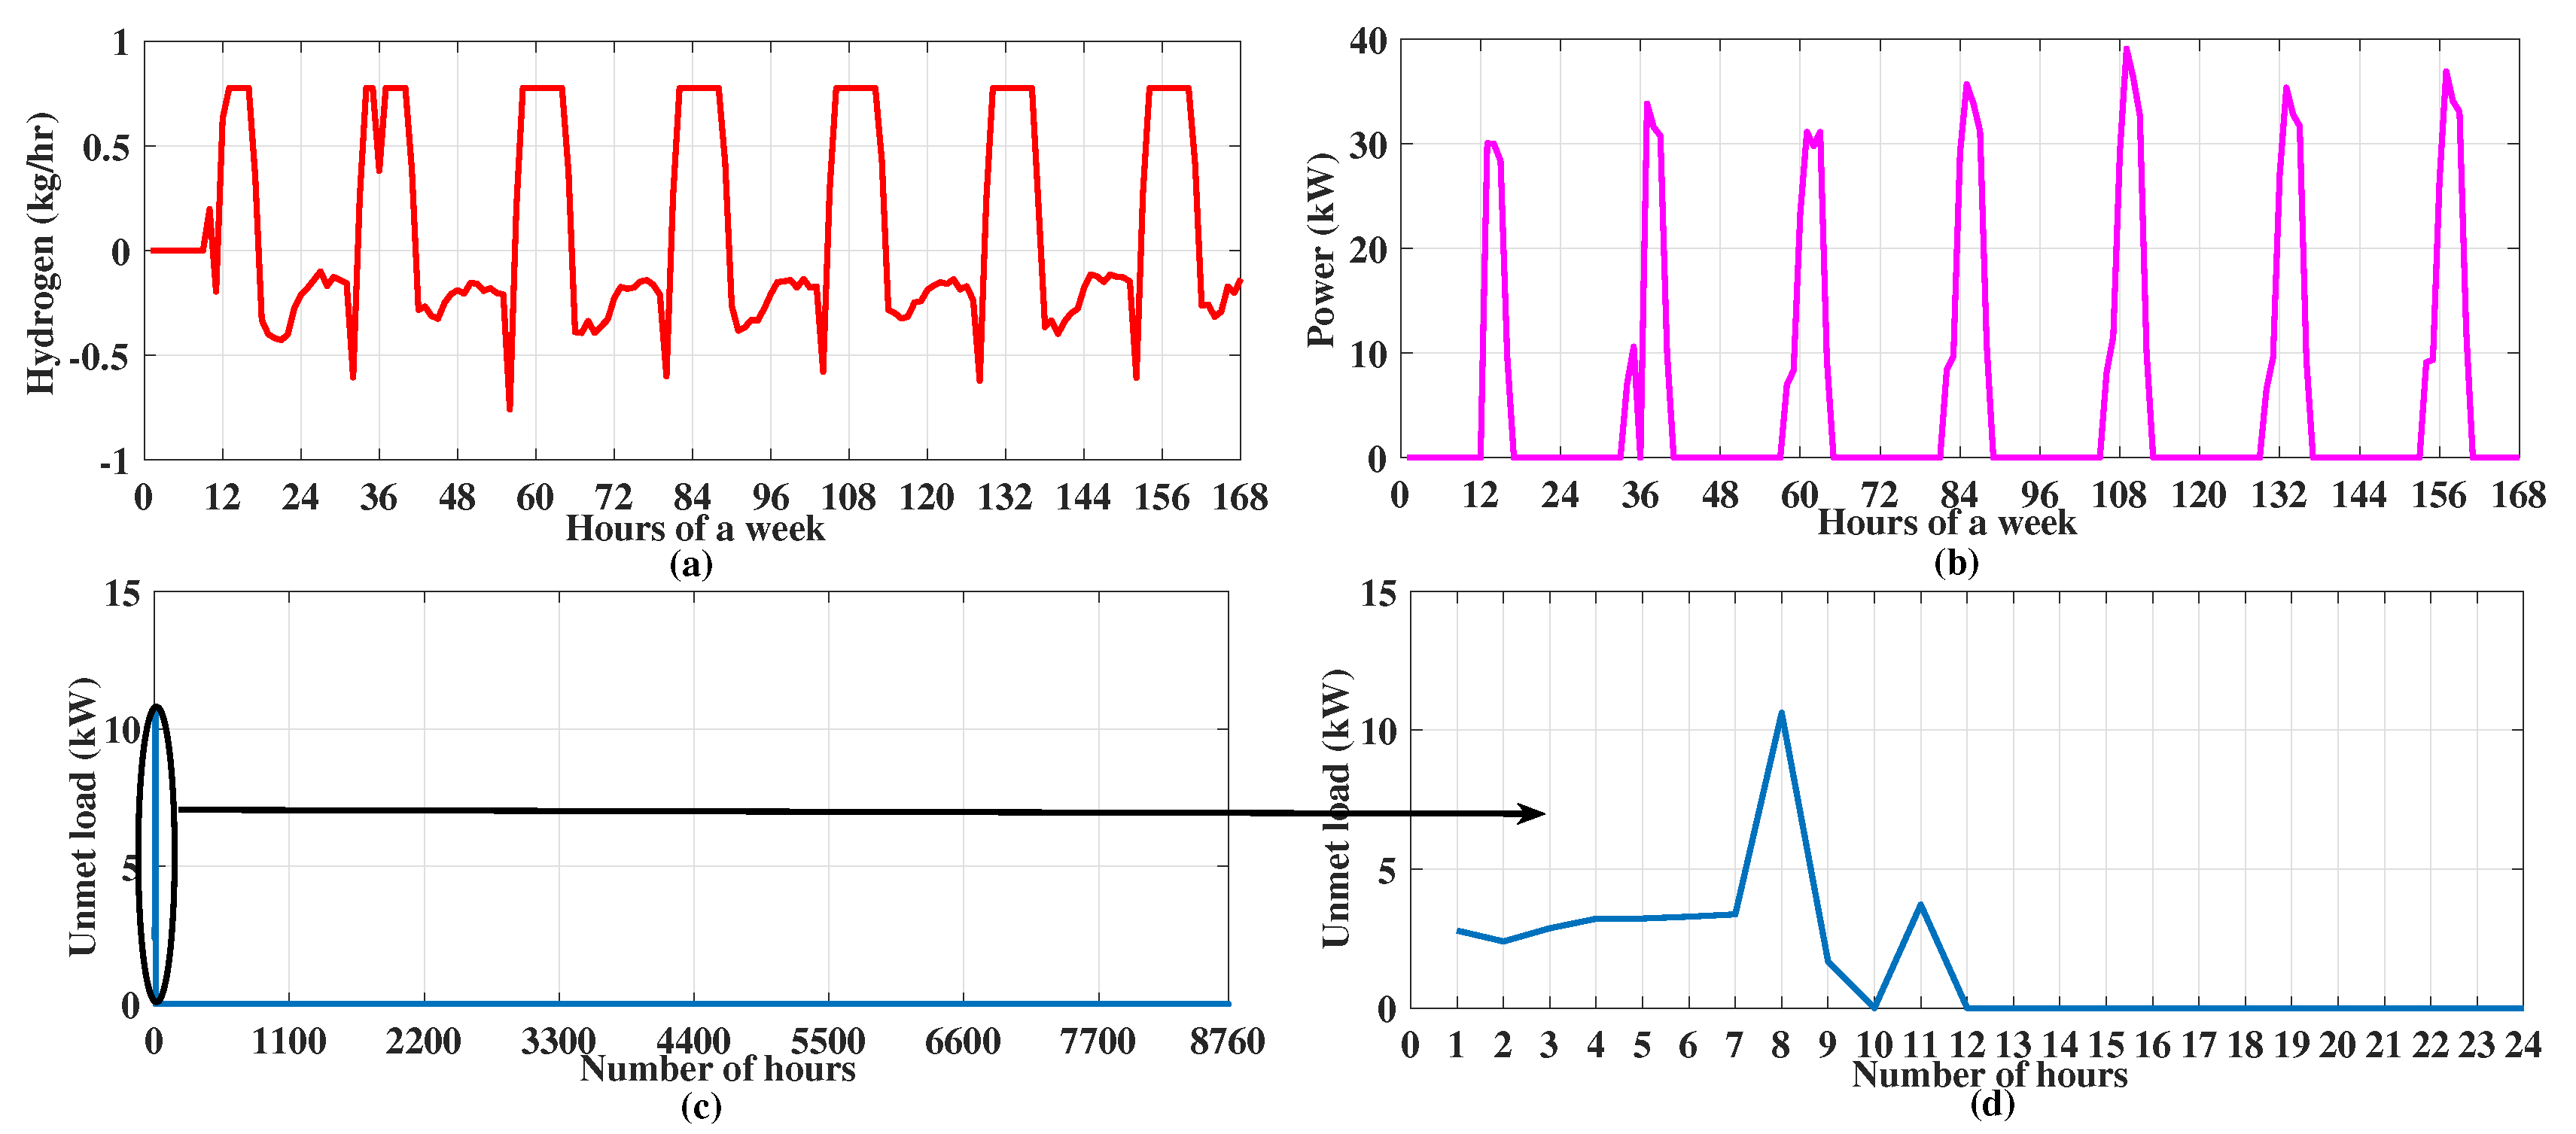
Figure 7.
(a) Electrical load demand AC and DC both; (b) PV, fuel cell output and electrolyzer input power; (c) hydrogen balance; (d) excess power and unmet load.
Figure 7.
(a) Electrical load demand AC and DC both; (b) PV, fuel cell output and electrolyzer input power; (c) hydrogen balance; (d) excess power and unmet load.
Figure 8.
(a) Electrical load demand AC and DC both; (b) PV, fuel cell output and electrolyzer input power; (c) hydrogen balance; (d) excess power and unmet load.
Figure 8.
(a) Electrical load demand AC and DC both; (b) PV, fuel cell output and electrolyzer input power; (c) hydrogen balance; (d) excess power and unmet load.
Figure 9.
IEC 61850 communication model of FC-PV hybrid system.

Figure 10.
IEC 61850 SCL file for (a) fuel cell, (b) hydrogen tank and (c) electrolyzer.

Table 1.
System component specifications and their costs [23].
Table 1.
System component specifications and their costs [23].
| Parameter | Value | Unit | Parameter | Value | Unit |
|---|---|---|---|---|---|
| PV panel | Inverter | ||||
| Maximum power ( ) | 100 | W | Rated power | 1 | kW |
| Maximum power voltage () | 18 | V | Inverter () efficiency | 90 | % |
| Maximum power current () | 5.56 | A | Capital and replacement cost | 127 | $/kW |
| Open circuit voltage () | 22.3 | V | O&M cost | 1 | $/yr |
| Short circuit voltage () | 6.1 | A | Life time | 20 | yr |
| Number of cells | 36 | - | |||
| Nominal operating cell temperature | 45 | ||||
| Capital cost and replacement cost | 1084 (per kW) | $ (per kW) | |||
| O&M cost | 5 (per kW) | $/yr | |||
| Life time | 20 | yr | |||
| Fuel cell | Electrolyzer | ||||
| Rated power | 1 | kW | Capital and replacement cost | 150 | $/kW |
| Capital and replacement cost | 600 | $/kW | O&M cost | 8 | $/yr/kW |
| O&M cost | 0.01 | $/hr/kW | Efficiency | 90 | % |
| Fuel cell coefficient | 0.0003 | $/hr/kW | Life time | 20 | yr |
| Hydrogen to electricity conversion by fuel cell ( | 0.059 | $/hr/kW | |||
| Life time of FC | 50,000 | h | |||
| Hydrogen tank | Others | ||||
| Capital cost | 1.3 | $/kg | DC bus voltage | 120 | V |
| Replacement cost | 0.5 | $/kg | Project life (N) | 20 | yr |
| O&M cost | 0.6 | $/yr/kg | Interest rate (i) | 6 | % |
| Life time | 20 | yr |
Table 2.
Optimal sizing result for the proposed system obtained by the HOMER and ABC algorithms.
| Algorithm | PV | FC | Electrolyzer | Tank | Inverter | NPC | ACS | LCOE | FC Hours |
|---|---|---|---|---|---|---|---|---|---|
| (kW) | (kW) | (kW) | (kg) | (kW) | ($) | ($) | ($/kWh) | (hrs) | |
| ABC | 129 | 15 | 34 | 19 | 12 | 179,747.7 | 15,674 | 0.228 | 4974 |
| HOMER | 130 | 15 | 34 | 20 | 12 | 180,917.4 | 15,776 | 0.232 | 4972 |
Table 3.
Annualized cost analysis obtained by the HOMER and ABC algorithms.
| HOMER | ABC Algorithm | |||||||||
|---|---|---|---|---|---|---|---|---|---|---|
| Component | Capital | Repl | O&M Cost | Salvage | Total | Capital | Repl | O&M Cost | Salvage | Total |
| ($/yr) | ($/yr) | ($/yr) | ($/yr) | ($/yr) | ($/yr) | ($/yr) | ($/yr) | ($/yr) | ($/yr) | |
| PV | 12,286 | 0 | 650 | 0 | 12,936 | 12,191 | 0 | 645 | 0 | 12,836 |
| Fuel Cell | 785 | 437 | 746 | −3 | 1965 | 785 | 437 | 745 | −4 | 1963 |
| Electrolyzer | 445 | 0 | 272 | 0 | 717 | 445 | 0 | 272 | 0 | 717 |
| tank | 2 | 0 | 12 | 0 | 14 | 1.9 | 0 | 11.4 | 0 | 13 |
| Inverter | 133 | 0 | 12 | 0 | 145 | 133 | 0 | 12 | 0 | 145 |
| Total system | 13,615 | 437 | 1692 | −3 | 15,777 | 13,556 | 437 | 1685 | −4 | 15,674 |
Table 4.
Electricity production and consumption for a complete year.
| Energy Production | Energy Consumption | ||||||||
|---|---|---|---|---|---|---|---|---|---|
| ABC Algorithm | HOMER | ABC Algorithm | HOMER | ||||||
| kWh/yr | % | kWh/yr | % | kWh/yr | % | kWh/yr | % | ||
| PV panels (DC) | 217,284 | 90.4 | 218,968 | 91 | DC Primary load | 28,422 | 22 | 28,426 | 22 |
| Fuel cells (DC) | 22,945 | 9.5 | 22,927 | 9.4 | AC Primary load | 40,114 | 31 | 40,120 | 31 |
| Total | 240,229 | 100 | 241,895 | 100 | Electrolyzer load | 60,065 | 46.7 | 59,997 | 46.7 |
| Total | 128,601 | 100 | 128,543 | 100 | |||||
| Excess electricity | 108,162 | 180,894 | Unmet load / LPSP (%) | 36.92 | 0.053 | 37.3 | 0.054 | ||
Table 5.
Fuel cell controller (DFCL) logic node.
| DFCL Class | |||
|---|---|---|---|
| Data Name | CDC | Explanation | M/O/C |
| LN Name | - | Shall be inherited from the logical-node class (see IEC 61850-7-2) | |
| Data | |||
| System logical node data | |||
| LN shall inherit all mandatory data from common logical node class | M | ||
| Settings | |||
| VRtg | ASG | Voltage rating of fuel cell stack | M |
| IRtg | ASG | Current rating of fuel cell stack | M |
| Plim | ASG | Power limit | M |
| Controls | |||
| FuelSht | DPC | True for fuel cell operation, False for Fuel cell shutdown | M |
| Measured Values | |||
| OutH2Rte | MV | Measures the rate of hydrogen. | M |
Table 6.
Electrolyzer controller (DELZ) logical node.
| DELZ Class | |||
|---|---|---|---|
| Data Name | CDC | Explanation | M/O/C |
| LN Name | Shall be inherited from the logical-node class (see IEC 61850-7-2) | ||
| Data | |||
| System logical node data | |||
| LN shall inherit all mandatory data from common logical node class | M | ||
| Settings | |||
| ThermCap | ASG | Defines the thermal capacity of conversion of electrolyzer | M |
| MaxTmp | ASG | The maximum permissible temperature of electrolyzer | M |
| MaxPres | ASG | The maximum permissible pressure of electrolyzer | M |
| MaxPwr | ASG | The maximum power of electrolyzer | M |
| Controls | |||
| FuelSht | SPS | For operating the electrolyzer when excess energy is available. True = ON, False = OFF | M |
| Measured Values | |||
| PwrH2Ef | MV | Defines the efficiency of conversion from power to hydrogen | M |
| HydFlwrate | MV | Defines the flow rate of hydrogen produced. | M |
Table 7.
Hydrogen tank (DHGT) logical node.
| DHGT Class | |||
|---|---|---|---|
| Data Name | CDC | Explanation | M/O/C |
| LN Name | Shall be inherited from the logical-node class (see IEC 61850-7-2) | ||
| Data | |||
| System logical node data | |||
| LN shall inherit all mandatory data from common logical node class | M | ||
| Settings | |||
| MaxTmpH | ASG | The maximum permissible temperature of tank | M |
| MaxPresH | ASG | The maximum permissible pressure of tank | M |
| Measured Values | |||
| H2Presinit | MV | Defines the hydrogen pressure available in the tank | M |
| H2Presfin | MV | Defines the hydrogen pressure after hydrogen addition in the tank | M |
Table 8.
IEC 61850 message exchanges during energy management in FC-PV hybrid system.
| Message Exchanges for Energy Management in FC-PV Hybrid System | ACSI Service | Type of PDU/Message | |
|---|---|---|---|
| Source IED | Destination IED | ||
| PV IED → DPVM → MdulWRtg | MGCC | GetDataValues | Read-MMS Request, Read-MMS Response |
| Fuel Cell IED→ DFCL→ OutHydRate | MGCC | GetDataValues | Read-MMS Request, Read-MMS Response |
| Electrolyzer IED→ DELZ→MaxPwr | MGCC | GetDataValues | Read-MMS Request, Read-MMS Response |
| Hydrogen Tank IED →DHGT→MaxPresH | MGCC | GetDataValues | Read-MMS Request, Read-MMS Response |
| AC, DC loads→CNLO →WRtg | MGCC | GetDataValues | Read-MMS Request Read-MMS Response |
| Case I | |||
| MGCC | XCBR4→DELZ→FuelSht | SendGOOSEMessage | GoosePDU |
| Hydrogen Tank IED→DHGT→H2Presinit | MGCC | GetDataValues | Read-MMS Request, Read-MMS Response |
| MGCC | Hydrogen Tank IED→DHGT→H2Presfin | SetDataValue | Write-MMS Request, Write-MMS Response |
| Case III | |||
| MGCC | XCBR3→DFCL→FuelSht | SendGOOSEMessage | GoosePDU |
| Fuel Cell IED→DFCL→ PwrH2Ef | MGCC | GetDataValues | Read-MMS Request Read-MMS Response |
| MGCC | Fuel Cell IED→DFCL→Plim, OutHydRate | SetDataValue | Write-MMS Request, Write-MMS Response |
© 2020 by the authors. Licensee MDPI, Basel, Switzerland. This article is an open access article distributed under the terms and conditions of the Creative Commons Attribution (CC BY) license (http://creativecommons.org/licenses/by/4.0/).
Share and Cite
MDPI and ACS Style
Singh, S.; Chauhan, P.; Aftab, M.A.; Ali, I.; Hussain, S.M.S.; Ustun, T.S. Cost Optimization of a Stand-Alone Hybrid Energy System with Fuel Cell and PV. Energies 2020, 13, 1295. https://doi.org/10.3390/en13051295
AMA Style
Singh S, Chauhan P, Aftab MA, Ali I, Hussain SMS, Ustun TS. Cost Optimization of a Stand-Alone Hybrid Energy System with Fuel Cell and PV. Energies. 2020; 13(5):1295. https://doi.org/10.3390/en13051295
Chicago/Turabian StyleSingh, Shakti, Prachi Chauhan, Mohd Asim Aftab, Ikbal Ali, S. M. Suhail Hussain, and Taha Selim Ustun. 2020. "Cost Optimization of a Stand-Alone Hybrid Energy System with Fuel Cell and PV" Energies 13, no. 5: 1295. https://doi.org/10.3390/en13051295
Note that from the first issue of 2016, this journal uses article numbers instead of page numbers. See further details here.