The Communication System and its Impacts on Line Current Differential Protection in Distributed Feeder Automation


College of Electrical and Information Engineering, Hunan University, Changsha 410082, China
*
Author to whom correspondence should be addressed.
Energies 2020, 13(6), 1298; https://doi.org/10.3390/en13061298
Submission received: 10 February 2020
/
Revised: 4 March 2020
/
Accepted: 7 March 2020
/
Published: 11 March 2020
(This article belongs to the Special Issue Protection and Communication Techniques in Modern Power Systems)
Abstract
:As one of the core technologies of distributed feeder automation (DFA), line current differential protection (LCDP) can locate faults quickly and accurately and have the ability to cope with multi-directional flow. However, LCDP algorithm has high requirements for communication speed, and is sensitive to communication quality. In order to apply the LCDP algorithm to a real project, the communication system and its impacts on LCDP need to be studied in depth. In this paper, the design method of a communication system for LCDP, including communication mode, topology, communication protocol, and synchronization, is analyzed in detail. For better parameter determination, the communication models are investigated, and the impact of time delay, data loss, and jitter on LCDP are discussed. Further, the distribution network based on a real project is built in a cyber-physical co-simulation environment, and the impact of electrical fails and communication fails on LCDP are studied. The results show that the design method and parameters determination method proposed in this paper are effective.
1. Introduction
With the development of distributed generations (DGs), distributed energy storages, and electric vehicles, a large number of power electronics devices are connected to distribution networks. In order to ensure the reliability of a distribution network, distributed feeder automation (DFA) technology is proposed. It can complete fault location, isolation, and service restoration (FLISR) quickly and accurately and is not affected by power electronics devices [1,2]. In recent years, DFA technology has been widely studied and a large number of pilot projects have been demonstrated around the world [3,4,5]. Especially in China, the State Grid and China Southern Power Grid have added DFA technical requirements into some provincial bidding technical specifications, and the discussion of standard test procedures for DFA has also entered the final stage. The DFA technology will be widely used in China in the near future.
As one of the core technologies of DFA, line current differential protection (LCDP) can identify the fault in multi-port protection areas and cope with multi-directional flow, and has been used in DFA systems extensively [6,7,8,9,10,11,12,13,14,15]. LCDP is a regional protection, which needs to acquire data from other protection devices (PDs) through communication, so the design of a communication system is an important part of it. In [3], the LCDP for future renewable electric energy delivery and management (FREEDM) system is proposed. The communication system is based on Ethernet, and the communication protocol is transmission control protocol (TCP). The impact of communication on LCDP is not considered. In [5], a hierarchical section protection based on LCDP is proposed. This method simplifies the protection scheme, so the communication data link is minimized and the synchronized measurement is not required. However, the disadvantage is that the method is only suitable for a simple network, and cannot be used in the distribution network with complex environment. In [6], except for the LCPD algorithm research, the communication system and communication protocol selection, as well as self-synchronization technique, are also analyzed in detail. But the impact of communication on LCDP is also not considered. In [8], the application of LCDP is based on distributed communication and global positioning system (GPS) time synchronization, but the detail of the distributed communication system is not mentioned. In [12], a Zigbee network and the generic object-oriented substation event (GOOSE) protocol are used for LCDP, and the time delay, data loss are analyzed in detail. However, the communication distance of Zigbee limits the application in long-distance lines of the distribution network. In [13], the wireless token ring protocol is applied, and the topology and time delay are discussed. This paper does not discuss the abnormal situation of the communication system, so the performance of the scheme cannot be evaluated effectively. In [14,15], the world interoperability for microwave access (WiMAX) wireless communication is provided in the real-world distribution network test bed, but there is only one WiMAX communication base station for data transfer, the common situation of multi base stations is not discussed. Besides these papers, references [4,7,9,10,11] have studied LCDP method in depth, but the communication system is regarded as ideal. This assumption makes these well-designed algorithms hard to implement in reality. The LCDP is an elaborate design considering both power system and communication system. Missing any part will make the method an impractical work. The insufficient research on the communication system is the common deficiency of the above paper.
By studying the design method of the communication system in the distribution network and the impact of the communication system on the LCDP algorithm, the aim of the work presented in following paper is to present practical design method and parameter determination for the communication systems of distribution networks, and provide an effective theoretical basis and technical support for practical projects. In particular, the following topics will be discussed:
- The communication system for LCDP in distribution networks has its special requirements: multi device participation and adequate performance with low cost. So the existing design of the communication system, including transmission network and distribution network, cannot be used directly. Based on a real project, the design method considering the characteristics of LCDP is discussed in detail.
- As a protection, LCDP needs to be fast enough to isolate faults, but as a distributed system, it must wait for data from other PDs. Therefore, the analysis of the impact of the communication system on LCDP is of great significance to speed up the protection and improve the protection performance. Impact factors, including time delay, data loss, and jitter, are studied.
- The performance of LCDP is affected by both the power system and communication system, but it is difficult to build a unified model for analysis. In contrast, the co-simulation environment for a cyber-physical system is an effective tool to study it. In this paper, the cyber-physical model based on the real project is established, and the design and analysis in the paper are validated.
All the research in this paper comes from a real pilot project: a DFA system deployed to manage a part of the distribution network of the City of Xiangtan in China. The design thinking and parameter selection of this paper are based on the relevant standards of the State Grid and the actual situation of the project.
The rest of this paper is organized as follows: the design method of the communication system is analyzed in Section 2, including communication mode, topology, communication protocol and synchronization. For better parameter determination, the impact of the communication system on LCDP is investigated in Section 3, and the influences of time delay, data loss, and jitter are discussed in detail. In Section 4, based on previous studies, a distribution network is built in a cyber-physical co-simulation environment, and impacts of electrical fails and communication fails on LCDP are studied.
2. Communication System Design for LCDP
To build a communication system for the distribution network, several important points should be considered: first is the choice of communication mode. By the analysis of the demand and the existing network, the best communication technologies and international communication standards can be determined. After that, the topology of the communication system is a key factor affecting the LCDP in engineering, which must be considered carefully. In order to match new standards and communication architecture, the PD must make some functional modifications for communication, in which communication protocol and synchronization are two key functions. This section mainly discusses the above four LCDP-related designs.
2.1. Communication Mode
Because each PD needs to know the data of other PDs, the point-to-point communication architecture based on Ethernet is used widely [16]. The ring topology-based redundancy Ethernet (RTRE) is applied in many pilot projects as a solution. This network uses optical fiber as the transmission channel, and the industrial Ethernet switches (IES) are connected in a loop. Once a fault occurs, the alternate link, which is disabled in normal operation, will work automatically and the network can be recovered quickly. High-speed wireless communication, especially 4G and WiMAX, is also an option. It has the characteristics of high bandwidth, fast speed, and low construction cost [14,15]. The problem of wireless communication is that there is no direct communication channel between PDs, and data must be transferred via wireless base stations. The real-time and reliability of the protection data cannot be guaranteed when the base station load is heavy. Therefore, the communication mode that can be widely used in practical projects now is the RTRE based on optical fiber.
Considering the cost, to build a separate LCDP optical fiber channel for the power company is unaffordable. The communication system for LCDP needs to be integrated with the existing system. According to the different communication modes used in China, there are two combination methods:
- Integration with Ethernet passive optical network (EPON) communication system. EPON is a point to multi-point communication system. Under this structure, devices cannot communicate with each other directly, and all data must be exchanged on the server. The optical line terminal (OLT), which connects to substation communications networks (SCN), is placed in a substation for data processing and timing management. The optical network unit (ONU) is connected with ring main units (RMU) for conversion of optical signal and electrical signal. A splitter is used to realize the distribution and coupling of optical fiber channels. To integrate EPON and RTRE, multi-core optical cable (48 cores in Xiangtan pilot project) can be used for networking. LCDP occupies some channels according to the communication and backup requirements, and EPON occupies the rest, as shown in Figure 1a. Although the optical fiber cable can be shared in this method, the devices for both EPON and RTRE need to be installed and maintained, resulting in the increase of cost.
- Integration with the industrial Ethernet system (IES). Although the original communication network and the LCDP communication network can be configured as two independent networks according to the EPON integration method, the required devices and maintenance costs also need to be doubled. The solution to reduce the cost is to combine the original communication network and LCDP communication network into a single one, as shown in Figure 1b. Such a design will not increase any construction cost and maintenance cost, and is the most economical method.
2.2. Topology
Ring is the best topology structure for the LCDP algorithm, but the electrical topology of the distribution network usually cannot meet this condition. How to combine the ring communication topology with the electrical topology is another important issue. Five distribution network topologies [17] used in China are discussed below.
- Open loop connection from same substation. Two feeders are led out from the same substation and connected at the end through the tie switch. The electrical topology is a ring, so the RTRE can be deployed easily, as shown in Figure 2a.
- Open loop connection from different substations. Two feeders are respectively led out from two substations, and connected at the end through the tie switch. Because the electrical topology is a line, it is unaffordable to lay two optical fiber cables between two substations. The solution is to put two optical channels into the same multi-core optical cable to form a circular communication channel, as shown in Figure 2b. When the optical fiber fails, the connection can ensure the rapid recovery of communication. However, if the optical fiber cable is damaged by an external force (such as cut by excavator), the communication cannot be restored. Although LCDP can still quickly isolate faults, the deviation of fault location will increase, resulting in expansion of power loss area.
- Double shunt connection. Adding a cable to the open loop network connecting two substations forms a double-loop network. Along with the new cable, breakers and optical fiber cables will be also installed. Two communication cables can form a communication ring network, and LCDP based on this topology can realize all functions, as shown in Figure 2c. This topology is composed of four feeders, so the number of PDs is more than other topologies, which will affect communication delay, jitter, etc. If communication requirements are not met, a communication link in the middle of the ring network can be added. The new link can divide the large ring into two small rings to improve the performance of the communication system.
- Overhead line with multiple sources. The communication channels are difficult to form the real ring network. For them, to realize a dual fiber channel-based ring communication network by a multi-core optical cable is an effective solution. In particular, boundary PDs need to be interconnected with optical fiber, as shown in Figure 2d. Such connections can ensure that the optical fiber at the multi-connection point has enough backup channels.
- Lattice type loop connection. The lattice type distribution network is actually two interconnected ring networks, so it can be easily connected into two RTREs, as shown in Figure 2e.
After the above analysis, one finds that open loop connection from the same substation, double shunt connection, and lattice type loop connection have the best compatibility with LCDP, which can give full play to the LCDP algorithm and achieve accurate fault isolation. In contrast, the topology of open loop connection from different substations and overhead line with multiple sources limits the performance of the LCDP algorithm. When the cable is cut off, the fault cannot be accurately located, and the power loss range will expand. It should be noted that the topology is one of the factors that affect the LCDP in the communication system. Choosing a topology is only the first step in designing a reliable communication system. The analysis of other factors and determination of performance metrics are carried out in detail in Section 3.
2.3. Communication Protocol
The GOOSE defined in IEC61850 is one of the important message types for protection and control in the power substation [18]. It has the characteristics of high reliability and fast response, and is widely considered as the best protocol for LCDP in distribution networks [6,12,14,19,20]. However, the transmission mechanism of GOOSE is configured based on a MAC address, the work area of it is limited to local area network (LAN). That is to say, the network can access up to 256 devices. This has no effect on the digital substations with limited devices, but it is not enough for the communication system of distribution networks. In addition to the PD, other devices in the distribution network also use this communication system, such as micro-environment monitor and supervisory control and data acquisition (SCADA) devices. In addition, with the development of the digitally enabled substation [21], feeder-based microgrid [19], and other technologies, more devices such as the intelligent transformer terminal unit (TTU), micro-phasor measurement unit (μPMU) and DG controller will be connected to the feeder, and the number of these devices will be far greater than 256. The existing GOOSE protocol cannot meet the requirement.
To solve this problem, the routable-GOOSE is presented as a solution [22,23]. The routable-GOOSE maps the GOOSE message to user data protocol (UDP) and transmits it by the transmission control protocol/internet protocol (TCP/IP) stacks. The GOOSE over UDP transmission mechanism can transmit messages in wide area network (WAN), so the number of devices connected in distribution networks can be improved. Meanwhile, based on the TCP/IP stacks, the routable-GOOSE transmission is easily realized and has a high reliability. Besides, UDP can directly transmit messages without establishing a connection and can achieve a variety of communication methods such as broadcast, multicast, and unicast. These features enable routable-GOOSE to meet the real-time and flexibility requirements of the GOOSE transmission mechanism.
In addition to the number of devices, the backward compatibility of communication protocol is another problem. At present, most feeder automation systems in China still use the protocol based on IEC60870-5. All devices are designed based on this protocol. Although DFA is a development direction for smart grid, its construction is a long-term task. New devices and traditional devices will coexist during this period. From the perspective of economy and management, it is not feasible to maintain two protection systems at the same time. The solution is the software-defined networking (SDN) technology [24]. SDN is an architecture that decouples the network control and forwarding functions, enabling the network control to become directly programmable. Using the protocol conversion function of specialized SDN switches, traditional devices can interact with the IEC61850-based control center without upgrading.
2.4. Synchronization
At present, there are three methods for time synchronization in power systems: the method based on the global positioning system (GPS)/BeiDou navigation satellite system (BDS) [8], based on network time protocol (NTP) [25], and based on IEEE 1588 precision time protocol (PTP) [26]. The GPS/BDS-based time synchronization is used widely in business, but this method is not fit for distribution networks because many devices in the distribution network are installed indoors, and it is difficult for them to receive satellite signals. The NTP method is a simple and low-cost choice, and many smart grid applications are based on this method. The design and deployment of a time synchronization system over an existing heterogeneous network is investigated in [25]. The results show that the time error of the devices synchronized via optical fiber can be limited in 1 ms, which meets the protection requirements. However, the maximum jitter reaches 6 ms and can be extended due to the concurrency of the LCDP algorithm. Such a large jitter will seriously affect the data consistency of LCDP, so the NTP is not suitable. The IEEE 1588 solution can synchronize time at the level of microseconds if existing communication devices support the hardware timestamp process [26], but the disadvantage of high cost is also obvious.
From the LCDP algorithm perspective, the key is data synchronization rather than time synchronization, so some simple timing schemes can work better in this scenario. By introducing the timing-sync protocol for sensor networks (TPSN) [27], a data synchronization method for the LCDP algorithm is proposed below.
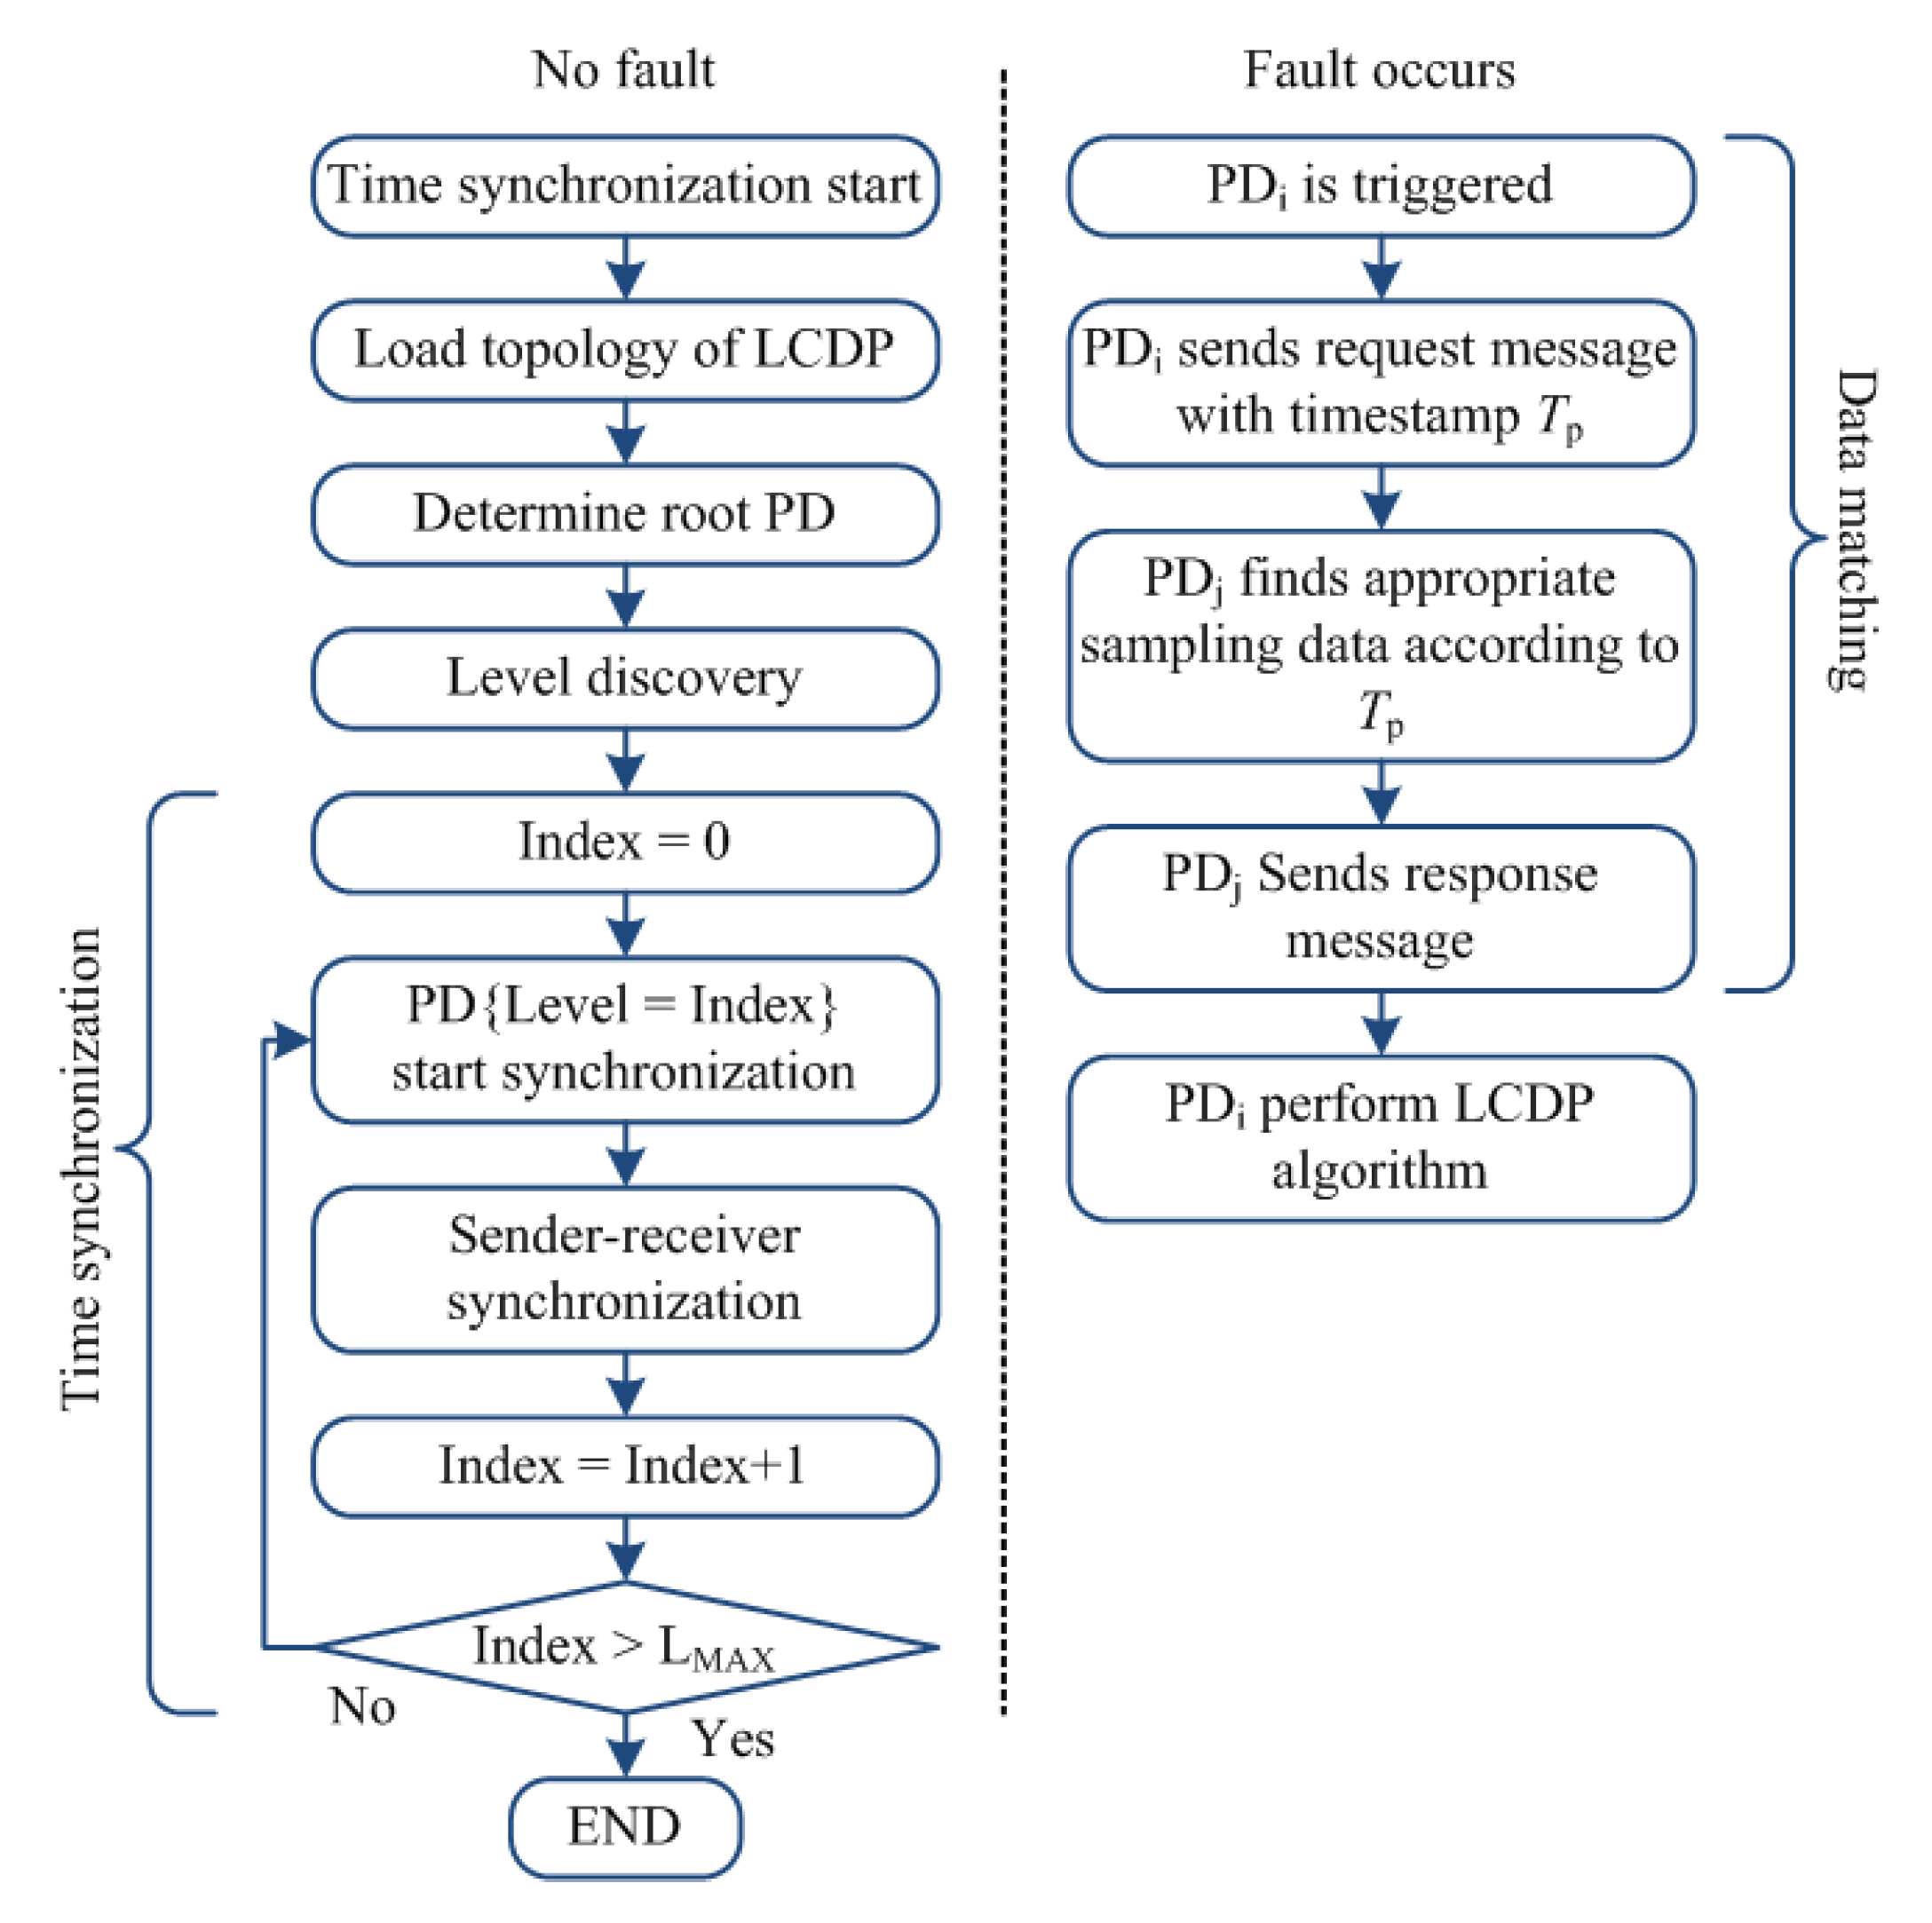
The flowchart of the method is shown in Figure 3. It can be divided into two phases. During normal operation, all PDs perform periodic time synchronization operations in accordance with TPSN. When the fault occurs, PDs synchronize the data through the time stamp in GOOSE message to ensure the data consistency on time. The details are as follows:
- Time synchronization start. The start of this task is cyclical, and because most PDs have high precision internal clocks, which can get high accuracy in a short period, synchronization does not need to be too frequent. Similar to GPS second pulse signal, it is appropriate to use 1 second as synchronization time interval.
- Load topology of LCDP. Topology identification is an important part of the LCDP algorithm [20], so the synchronization algorithm can use the result directly.
- Determine root PD. The time synchronization of TPSN is progressive according to the topology. Each synchronization will produce a time error, and the cumulative error will increase if the depth of topology is greater. The best way to solve this problem is to set the root node to the central node of the chain network, which can minimize the depth of the topology and the cumulative error.
- Level discovery and time synchronization. TPSN is used in this part. Refer to [27] for specific operation.
- Data matching. Define PDi is a triggered PD when the fault occurs, and PDj is the PD that needs to return sampling data to PDi. After being triggered, PDi needs to get data from PDj for LCDP calculation. PDi adds the timestamp of sampling data (TP) into the GOOSE frame and sends it to PDj. Each PDj receives the frame, does not return the latest sampling data, but returns the sampling data closest to TP. After data matching, the data consistency on time can be guaranteed.
3. Impacts of Communication System on LCDP
When the communication system of DFA is designed as mentioned above, it does not mean that PDs based on the LCDP algorithm can be used without any problems, because the parameters of the communication system also impact on LCDP’s performance. The transmission quality of communication network depends on three factors: time delay, data loss, and delay jitter [28]. In this section, these three factors are analyzed respectively.
3.1. Impact of Time Delay
The communication process of LCDP is shown in Figure 4, where ΔTM is the measurement deviation of PDs, which is used to present the difference of sampling time between two PDs, TC is the time consumption for processing communication data by a PD, and Ttrans is the communication latency of a frame through an IES. The synchronized timestamps of PDA and PDB are TSA and TSB, respectively, and the ΔTS is the difference of them.
The total delay of a data request process consists of two parts: the delay of sending a request command, and the delay of receiving data. The process is shown in Figure 5. The expression of the total delay time can be obtained as
where N is the number of IESs, and Ttrans can be expressed by [29]
where tr is the switch inherent delay of the IES for data relay; tq is the queuing delay of the IES caused by store-and-forward mechanism to avoid the frame conflict; to is the transmission delay of the optical signal in the optical fiber cable per kilometer; l is the length of fiber optic cable; R is the communication rate of Ethernet; d is the length of the message.
Since a PD cannot perform the LCDP algorithm until all data from other PDs are received, TD plays an important role in the response speed of LCPD. Besides, TD can also affect the result of the differential calculation. When data synchronization is used, the sampling time of each PD is synchronous, and the sampled data are labeled with timestamps. In this case, the time difference between two PDs is only related to ΔTS, and TD does not affect the calculation result. When the data synchronization is not used, the measurement deviation ΔTM is no longer zero, and the maximum value is equal to the sampling period (TS). On the other hand, because the timestamp does not exist, data synchronization between multiple PDs can only be guaranteed by the communication network.
As shown in Figure 5, if TD is far less than TS, PDB can get the latest data from PDA quickly, and the time difference between two PDs is ΔTM. But when TD becomes larger, the data PDB gets from PDA are the data that are sampled in the next period. With the increase of TD, the time difference between PDA and PDB will grow continuously. The expression of the time difference can be obtained as
where NS is the number of sampling periods spanned during the time delay. It can be calculated as
Although TASYN will not affect the LCDP on the fault zone, it could lead the Isum of the LCPD to beyond the threshold value temporarily in non-fault zones, causing malfunction. Therefore, reducing the time delay and using data synchronization are effective ways to enhance response speed and improve the LCDP reliability.
3.2. Impact of Data Loss
UDP cannot supervise the effectiveness of communication. In order to solve this problem, the retransmission mechanism in GOOSE protocol is introduced. The process of data retransmission is shown in Figure 6. Under normal conditions, a PD sends the data request frame to other PDs with T0 intervals. A PD can not only confirm the quality of the communication system, but also checks the sensor by calculating the real-time data [30]. Once the PD detects the exception on the electrical lines, it will send a data request command immediately. To ensure the frame can arrive correctly, the PD will retransmit the frame several times with shortest interval (T1). After the specified number of retransmissions, the data request frame will continue be transmitted by the PD, but the interval will gradually increase from T2, T3 to T0 according to GOOSE protocol.
Because of the high demand for the response speed of the protection, only the frames with the shortest interval (T1) are effective. In the worst case, the requested data are received successfully in the last retransmission, and the communication delay can be expressed as
where N is the number of retransmissions. Increasing the number of retransmissions can reduce the packet loss exponentially, but the communication delay will grow. By reducing T1, the communication delay can be shortened, but this will increase the traffic of the communication network in a short time, resulting in network congestion. The better way is to set the value of T1 slightly larger than the time TD, and retransmit until the response data are returned. The maximum number of retransmissions can be calculated by
where TREQ is the requirement of real-time message transfer latency in distribution networks. According to the division method of IEC 61850, the requirement latency is 10 ms [23].
When the network is in good condition, this method can ensure the rapidity of the communication process and does not produce additional data to increase the network load. If the network delay is long, this method can maximize the number of retransmissions and improve the data reliability without deteriorating the network condition.
3.3. Impact of Delay Jitter
In addition to the protection information of PDs, the communication network of distribution networks also transmits information for other devices, such as the SCADA data, the energy data, and the video data. Since there is no uniform control over these applications, there is a certain probability that these data will be transmitted concurrently, resulting in network congestion in a short time. From the device level, when a large number of data frames arrive at an IES, they will be accumulated at this device and greatly increase the communication delay. If the traffic load exceeds the limit of the IES, the new data will be lost. Compared with the time delay, jitter is more concerned about the characteristics of communication in a specific short time, which is also one critical indicator for the LCDP. When a fault occurs, all PDs send data request frames to other PDs and return real-time data at the same time. This concurrent behavior will deteriorate the network environment in a short time and cause more delay and data loss.
Virtual local area network (VLAN) technology can reduce the delay jitter of GOOSE communication and ensure its reliability [18]. However, the communication network based on VLAN has two problems:
- Some types of frame also require strict timing, such as control data frame and synchronous data frame. These frames must be set to the high priority, so they will inevitably have impacts on the data delay of LCDP.
- The short-term congestion caused by the distributed processing mechanism of PDs cannot be avoided, especially when the communication network is abnormal.
Because the delay jitter is related to the network topology, IESs, and applications, it is difficult for mathematical analysis. The only way to diagnose delay jitter is co-simulation for the hybrid electrical and communication system.
4. Impact Analysis by Co-Simulation
In this section, a closed loop test system combining PDs and the co-simulation environment for cyber-physical smart energy systems (CS4CPS) [31,32] is used for impact analysis and verification. In the next part, the modeling, parameter measurement, and co-simulation analysis are discussed in detail.
4.1. Modeling
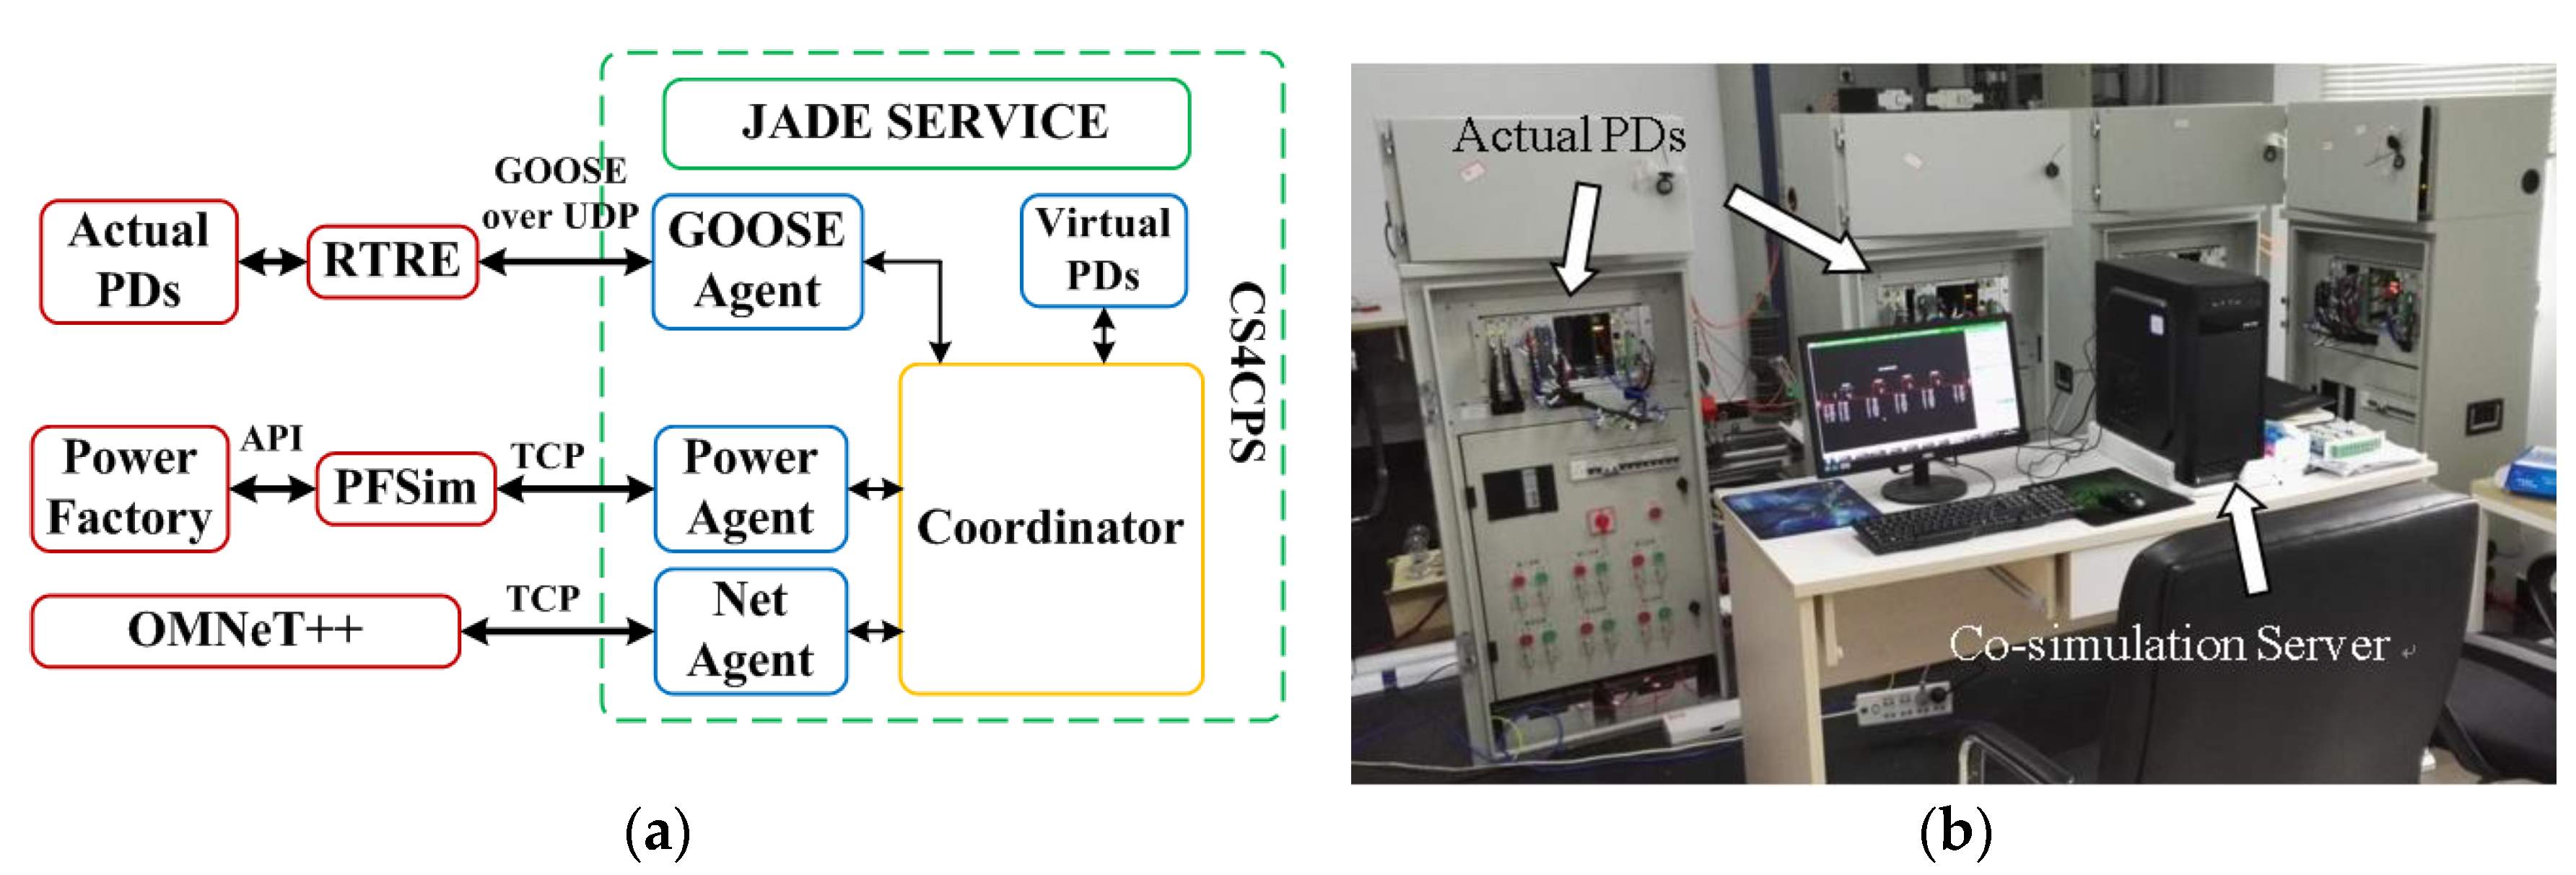
The architecture of the closed loop test system is shown in Figure 7a. The CS4CPS is a co-simulation environment based on Java agent development framework (JADE). It can connect the power simulation software (PowerFactory) (15.0, DIgSILENT GmbH, Gomaringen, Germany) the communication simulation software (OMNeT++) and distributed control models, and perform co-simulation of the whole system. There are also six actual PDs connected to the CS4CPS via the RTRE, as shown in Figure 7b. The PD can receive the sampling data generated by the power simulation software and output the GOOSE frame to control the circuit breaker in the electrical model. The results of co-simulation can be used to evaluate the performance of the PD and LCDP algorithm.
Based on the real project, the power system model and communication system model are built in PowerFactory and OMNeT++, respectively. The topology is shown as Figure 8, and the parameters of the distribution network are shown in Table 1. The network consists of eight RMUs and a pole-mounted circuit-breaker. In each RMU, there are three or four circuit breakers, the corresponding number of PDs, an IES, and some monitoring devices. The PD is used to control the circuit breaker and implement the LCDP algorithm. All PDs are connected to RTRE via IESs. The background traffic of the communication network is set as shown in Table 2.
4.2. Measurement of Communication Parameters
As mentioned above, some latency parameters are related to the hardware design. To ensure the effectiveness of the simulation result, these parameters must be obtained by computing and testing before the co-simulation. For data transmission latency, tr and TC are measurable. The measurement method for these parameters is a round-trip test. It can accurately evaluate the delay of each part by comparing multiple round-trip times under different topologies.
In a round-trip test, one PD broadcasts a GOOSE message to another PD, which is expected to respond as fast as possible. TRT is the total round-trip time between sending the GOOSE and receiving the response. The expression is
During testing, tq and l can be considered as 0, and R is 100 Mbps. When d is fixed, different TRT can be measured by changing N, which represents the number of IESs. Then TC and tr can be obtained by Equation (7). The measurement data are shown in Table 3. From this table, TC is proportional to the frame length, and tr is close to a fixed value. By using the least square method, the expression of TC can be obtained as
and the average value of 3.21 is used as the simulation parameter of tr. It should be noted that Tc and tr are heavily affected by the traffic. The parameters measured here are right only when light traffic is on the line. When the traffic become heavy, both values will become larger, but this change will not affect the results.
4.3. N-1 Test and Delay Analysis
When a communication line fails, the alternate link (IES0-IES10) will work and keep the communication uninterrupted. However, the change of communication network topology makes the routing path to other PDs different, which leads to a communication delay change. By the co-simulation, the communication delay of each IES under different communication network topologies can be obtained.
Figure 9a shows the time delay of IES1, IES3, IES6, and IES9 under different communication network topologies. When the fault line appears on both sides of the RMU, the delay of the LCDP algorithm reaches the maximum. There are two reasons for the rise of the time delay: the routing path becomes longer, and more data frames have passed through the alternate link due to topological changes.
Figure 9b is the delay statistics for all IESs, and the number at the top of the column is the standard deviation of delay corresponding to the IES. As can be seen from the graph, the minimum time delay of all IESs is about 1 ms, and the maximum value is about 2.5 ms. It is important to note that the maximum value here only occurs at the time of the communication link failures. If communication and electrical failures occur at the same time, the time delay will continue to increase because of the concurrent communication of PDs. This phenomenon will be seen in the fault simulation.
The value of the standard deviation shows that the closer the communication distance is to the substation, the smaller the change of delay will be. However, the standard deviation value of the IES farthest from the substation is not the largest. This is because the delay change is also affected by two other factors: the number of PDs in each RMU and the position of the open point.
4.4. Fault Simulation and Analysis
A phase-to-phase short-circuit fault is triggered between RMU5 and RMU6 at 0.03 s. Theoretically, PDs on the fault line can detect and isolate a fault according to the LCDP algorithm. But if the communication cannot work well, the result will be different. In the co-simulation, the communication fault is placed at different locations when the fault occurs, and the result is shown in Table 4. From this table it can be seen that when the fault occurs, the minimum time delays of two action PDs (PD52, PD61) are 2.8 ms and 3.9 ms, both of which are larger than the maximum values in the above simulation. This is mainly caused by the concurrency of PD data frames. When there is no fault, the retransmit interval T0 of each PD is long, and the time offsets are different, so the probability of all PDs sending data frames at the same time is minimal. When the electrical fault occurs, the fault current triggers all PDs just like a synchronous signal, which makes them send data frames at the same time, and greatly increase the burden of communication network.
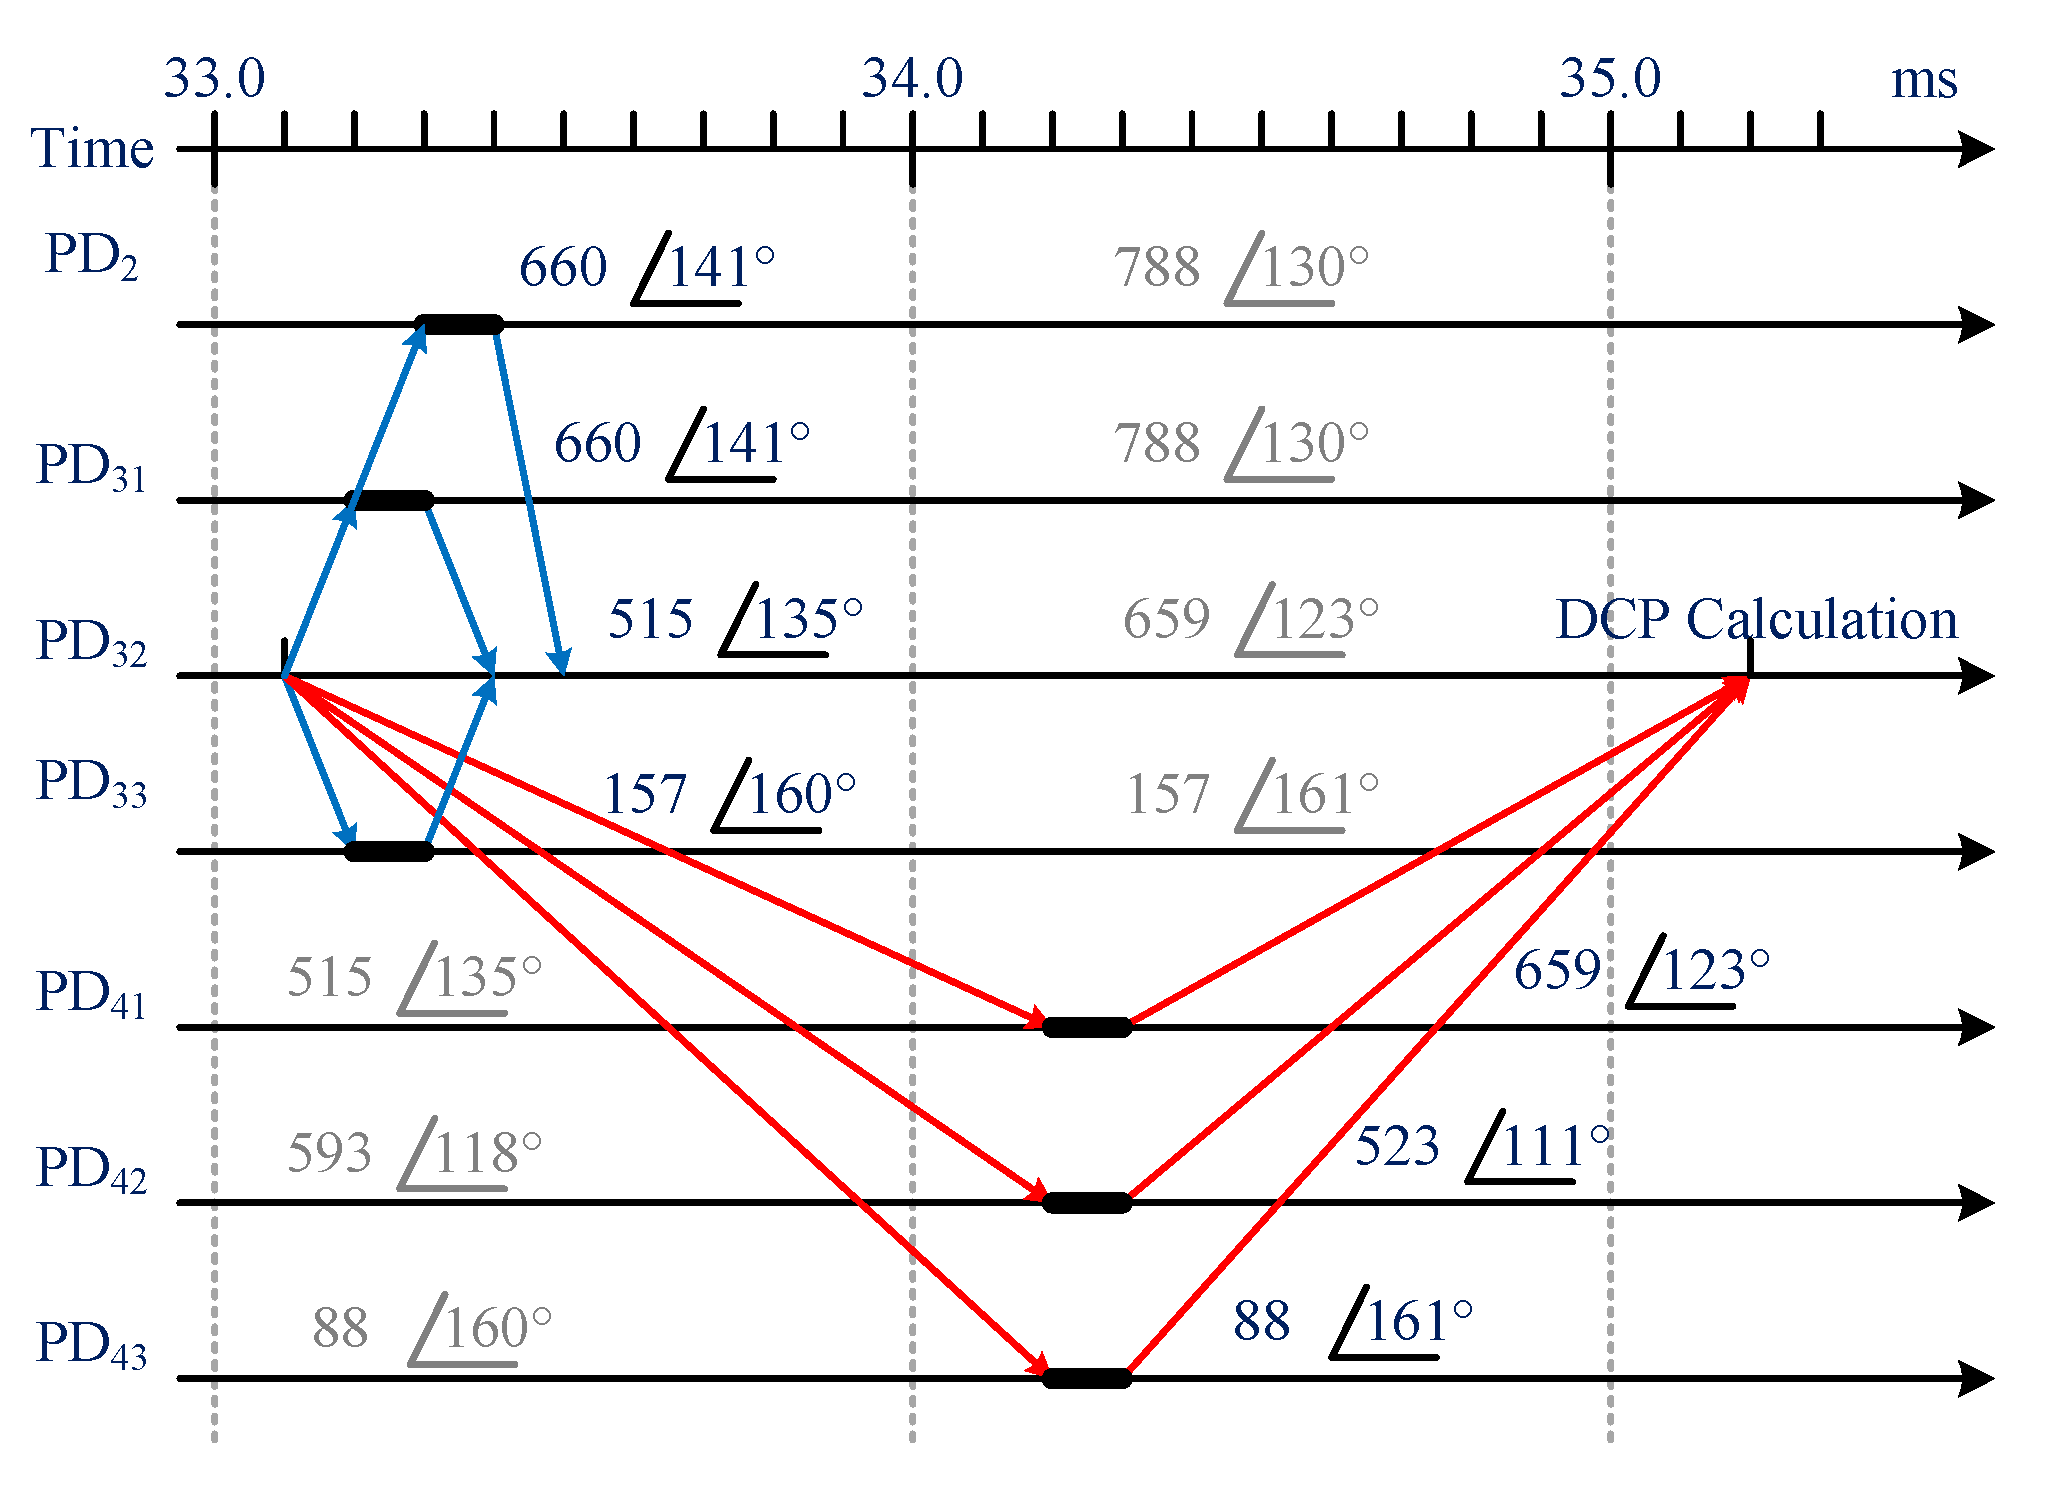
Moreover, when the communication fault is located at line RMU1-S2, S2-RMU3, RMU3-RMU4, or RMU4-RMU5, PDs connected to these communication lines are triggered and isolate the non-fault line, resulting in the maloperation. PD32 is chosen for analysis here when RMU3-RMU4 communication fails. The LCDP calculation process of PD32 and the communication sequence are shown in Figure 10. From this figure one can see that the data request frames from PD32 to PD2 and PD33 are answered within 0.5 ms. Conversely, due to the interruption of communication between IES3 and IES4, the data request frames from PD32 to PD41, PD42 and PD43 must be forwarded 11 times to reach the target PD. Such multiple transfers increase the time delay, causing the returned data to be mismatch in time synchronization.
The LCDP calculation result of PD32 is shown in Table 5. The proportion of fault current (PFC) [30] of the upstream protection zone composed of PD31, PD32, and PD33 is smaller than the threshold S0, and the upstream verification zone composed of PD2, PD32, and PD33 is the same. According to the LCPD algorithm, there is no fault on the upstream line of PD32. In contrast, the PFC values of the downstream protection and verification zones are 23.3 and 22.9, both of which are seriously affected by time asynchronization. So PD32 has judged that a short circuit fault occurred on the downstream line, resulting in the maloperation.
The simulation result of communication system can be used to analyze the maloperation of PDs and evaluate the relation of each part of the communication system. Figure 11a shows the time delay of each IES when PD32 requests data from PD41. When the data request frame is transmitted from PD32 to PD41, the delay values of IES1 and IES0 are high. Correspondingly, the return data frames have a high latency in IES9 and IES10, because both the data exchanged between PDs and the data uploaded to the server have to pass these IESs. A large number of data arrive at these routers in a short time, resulting in the delay. Figure 11b shows the time delay of each IES when PD41 requests data from PD32. As the above analysis, the request frame delivered from PD41 also has a delay on IES7, IES8, IES9, and IES10. Unlike Figure 11a, the return frames from PD32 to PD41 have a short latency on all IESs. The reason is that the starting time of return frames is 34.7 ms, which is later than other PDs, so the congestion time of the network can be avoided.
By co-simulation, the reasons for the maloperation of PDs are revealed, and the protection strategy can be improved accordingly. More specifically, the time synchronization is very important for LCDP. Secondly, enabling VLAN data frame priority management and setting the communication frames between PDs to the highest level can significantly reduce the latency of protection data frames. In addition, increasing the restraint coefficient of the PFC can eliminate maloperation, but the sensitivity of LCPD will be affected. After adding the time synchronization method mentioned above, the co-simulation is executed again. Table 6 shows the results, where one can see that maloperation has been avoided.
5. Conclusions
In this paper, the design method and parameter determination of distribution communication networks suitable for the LCDP algorithm are proposed. From the four aspects of communication mode, topology, communication protocol, and synchronization, the communication design methods are discussed. After that, through the analysis of the impacts of time delay, data loss, and jitter on the LCDP algorithm, the parameter determination method is studied. Based on previous studies, a distribution network is built in a cyber-physical co-simulation environment, and the impacts of electrical fails and communication fails are studied. The result shows that the design method is practicable and effective. Furthermore, the co-simulation is a useful analytical tool, and the results of it can be utilized to support the design of real-world projects.
Author Contributions
Conceptualization, Y.D., L.L., Y.L. and Y.C.; methodology, Y.D. and Y.L.; software, Y.D.; validation, Y.D., L.L. and Y.L.; investigation, Y.D.; resources, L.L. and Y.L.; writing—original draft preparation, Y.D.; writing—review and editing, Y.L. and Y.C.; supervision, L.L. and Y.L.; project administration, Y.L.; funding acquisition, L.L. and Y.L. All authors have read and agreed to the published version of the manuscript.
Funding
This work was supported in part by the Key Research and Development Program of Hunan Province of China under Grant 2018GK2031, in part by the National Natural Science Foundation of China (NSFC) under Grant 51822702, and in part by the Excellent Innovation Youth Program of Changsha of China under Grant KQ1802029.
Conflicts of Interest
The authors declare no conflict of interest.
References
- Zhang, F.; Mu, L. New protection scheme for internal fault of multi-microgrid. Prot. Control Mod. Power Syst. 2019, 4, 159–170. [Google Scholar] [CrossRef]
- Khond, S.V.; Dhomane, G.A. Optimum coordination of directional overcurrent relays for combined overhead/cable distribution system with linear programming technique. Prot. Control Mod. Power Syst. 2019, 4, 114–120. [Google Scholar] [CrossRef] [Green Version]
- Thirumalai, A.; Liu, X.; Karady, G.G. Ultra fast pilot protection of a looped distribution system. In Proceedings of the PIEEE Trondheim PowerTech, Trondheim, Norway, 19–23 June 2011; pp. 1–8. [Google Scholar]
- Tang, J.; Gong, Y.; Schulz, N.; Steurer, M.; McLaren, P.G. Implementation of a ship-wide area differential protection scheme. IEEE Trans. Ind. Appl. 2008, 4, 1864–1871. [Google Scholar] [CrossRef]
- Tatcho, P.; Li, H.; Jiang, Y.; Qi, L. A novel hierarchical section protection based on the solid state transformer for the future renewable electric energy delivery and management. IEEE Trans. Smart Grid 2013, 4, 1096–1104. [Google Scholar] [CrossRef]
- Gao, H.; Li, J.; Xu, B. Principle and implementation of current differential protection in distribution networks with high penetration of DGs. IEEE Trans. Power Deliv. 2017, 32, 565–574. [Google Scholar] [CrossRef]
- Han, B.; Wang, G. An improved pilot protection for distribution network with inverter-interfaced distributed generations. In Proceedings of the IEEE PES Asia-Pacific Power and Energy Conference, Xi’an, China, 25–28 October 2016; pp. 2555–2559. [Google Scholar]
- Weng, J.D.; Liu, D.; Zhao, Q. Current mutation and phase differential fault identification algorithm based on supply area sampling calibration method for active distribution network. In Proceedings of the CIRED, Helsinki, Finland, 14–15 June 2016; pp. 1–4. [Google Scholar]
- Abdulwahid, A.H.; Wang, S. A new differential protection scheme for microgrid using Hilbertspace based power setting and fuzzy decision processes. In Proceedings of the IEEE 11th Conference on Industrial Electronics and Applications, Hefei, China, 5–7 June 2016; pp. 6–11. [Google Scholar]
- Csagrande, E.; Woon, W.L.; Zeineldin, H.H.; Svetinovic, D. A differential sequence component protection scheme for microgrids with inverter-based distributed generators. IEEE Trans. Smart Grid 2014, 5, 29–37. [Google Scholar] [CrossRef]
- Yip, T.; Wang, J.; Xu, B.; Fan, K.; Li, T. Fast self-healing control of faults in MV networks using distributed intelligence. CIRED 2017, 2017, 1131–1133. [Google Scholar] [CrossRef] [Green Version]
- Nafi, N.S.; Ahmed, K.; Datta, M.; Gregory, M.A. A novel Zigbee based pilot protection scheme for smart distribution grid. In Proceedings of the Australasian Telecommunication Networks and Applications Conference, Southbank, VIC, Australia, 26–28 November 2014; pp. 146–151. [Google Scholar]
- Eissa, M.M. Protection technique for complex distribution smart grid using wireless token ring protocol. IEEE Trans. Smart Grid 2012, 3, 1106–1117. [Google Scholar] [CrossRef]
- Geiger, S.; Smit, A.; Bowman, D. Distributed synchronous coordination field testing of an actual automated distribution feeder system. In Proceedings of the CIRED, Helsinki, Finland, 14–15 June 2016; pp. 1–4. [Google Scholar]
- Guo, R.; Vankayala, V.; Qu, C.; Crozier, E.; Allen, S.; Adeleye, K.; Dabic, V.; Found, P.; Shah, N. Fault Location, Isolation and Service Restoration—Optimizing Field Operations for Utilities. In Proceedings of the IEEE Rural Electric Power Conference, Westminster, CO, USA, 15–18 May 2016; pp. 1–9. [Google Scholar]
- Che, L.; Khodayar, M.E.; Shahidehpour, M. Adaptive protection system for microgrids. IEEE Electrif. Mag. 2014, 2, 66–80. [Google Scholar] [CrossRef]
- MV Public Distribution Networks throughout the World. Available online: http://studiecd.dk/cahiers_techniques/MV_public_distribution_networks.pdf (accessed on 29 February 2020).
- Apostolov, A. To GOOSE or not to GOOSE?—That is the question. In Proceedings of the Annual Conference for Protective Relay Engineers, College Station, TX, USA, 30 March–2 April 2015; pp. 583–596. [Google Scholar]
- Wang, J.; Costa, L.M.; Cisse, B.M. From Distribution Feeder to MicroGrid: An Insight on Opportunities and Challenges. In Proceedings of the IEEE International Conference on Power System Technology, Wollongong, NSW, Australia, 28 September–1 October 2016; pp. 1–6. [Google Scholar]
- Li, W.; Li, Y.; Chen, C.; Tan, Y.; Cao, Y.; Zhang, M.; Peng, Y.; Chen, S. A full decentralized multi-agent service restoration for distribution network with DGs. IEEE Trans. Smart Grid 2019. [Google Scholar] [CrossRef]
- Hunt, R.; Flynn, B.; Smith, T. The Substation of the Future-Moving toward a Digital Solution. IEEE Power Energy Mag. 2019, 17, 47–55. [Google Scholar] [CrossRef]
- Seewald, M.G. Scalable network architecture based on IP-Multicast for power system networks. In Proceedings of the Innovative Smart Grid Technologies Conference, Washington, DC, USA, 19 May 2014; pp. 1–5. [Google Scholar]
- Fan, Y.; Wang, Q.; Peng, H.; Lin, S.; Fan, K.; Chen, Y. GOOSE over UDP transmission mechanism for real-time data fast transmission in distribution network. In Proceedings of the International Green and Sustainable Computing Conference, Hangzhou, China, 7–9 November 2016; pp. 1–5. [Google Scholar]
- Rinaldi, S.; Bonafini, F.; Ferrari, P.; Flammini, A.; Sisinni, E.; Cara, D.D.; Panzavecchia, N.; Tinè, G.; Cataliotti, A.; Cosentino, V.; et al. Characterization of IP-Based Communication for Smart Grid Using Software-Defined Networking. IEEE Trans. Instrum. Meas. 2018, 67, 2410–2419. [Google Scholar] [CrossRef]
- Rinaldi, S.; Giustina, D.D.; Ferrari, P.; Flammini, A. Time synchronization over heterogeneous network for smart grid application: Design and characterization of a real case. Ad Hoc Netw. 2016, 50, 47–57. [Google Scholar] [CrossRef]
- Rinaldi, S.; Ferrari, P.; Flammini, A. Analysis of IEEE 1588-based Cyber Physical System for micro grid automation. In Proceedings of the IEEE International Symposium on Precision Clock Synchronization for Measurement, Control, and Communication, Beijing, China, 11–16 October 2015; pp. 31–36. [Google Scholar]
- Ganeriwal, S.; Kumar, R.; Srivastava, M. Timing-sync Protocol for Sensor Networks. In Proceedings of the First ACM Conference on Embedded Networked Sensor Systems, Los Angeles, CA, USA, 5–7 November 2003; pp. 1–12. [Google Scholar]
- Szigeti, T.; Hattingh, C. End-To-End QoS Network Design: Quality of Design in LANs WANs, and VPNs; Cisco Press: San Jose, CA, USA, 2004; pp. 7–10. [Google Scholar]
- Xu, X.; Ni, Y. Analysis of networking mode caused by GOOSE delay of smart substation. In Proceedings of the International Conference on Software Engineering and Service Science, Beijing, China, 23–25 May 2013; pp. 503–506. [Google Scholar]
- Li, W.; Tan, Y.; Li, Y.; Cao, Y.; Chen, C.; Zhang, M. A new differential backup protection strategy for smart distribution networks: A fast and reliable approach. IEEE Access 2019, 7, 38135–38145. [Google Scholar] [CrossRef]
- Duan, Y.; Luo, L.; Li, Y.; Cao, Y.; Rehtanz, C.; Kuech, M. Co-simulation of distributed control system based on JADE for smart distribution networks with distributed generations. IET Gener. Transm. Distrib. 2017, 11, 3097–3105. [Google Scholar] [CrossRef]
- Homepage of the Co-Simulation Environment for Cyber-Physical Smart Energy Systems. Available online: https://github.com/CS4CPS/ (accessed on 7 February 2020).
| 1 | BB1-RMU1 |
Figure 1.
The communication mode (a) integration with Ethernet passive optical network (EPON) and (b) integration with industrial Ethernet system (IES).
Figure 1.
The communication mode (a) integration with Ethernet passive optical network (EPON) and (b) integration with industrial Ethernet system (IES).

Figure 2.
The topology of the communication system for (a) open loop connection from same substation, (b) open loop connection from different substations, (c) double shunt connection, (d) overhead line with multiple sources, and (e) lattice type loop connection.
Figure 2.
The topology of the communication system for (a) open loop connection from same substation, (b) open loop connection from different substations, (c) double shunt connection, (d) overhead line with multiple sources, and (e) lattice type loop connection.
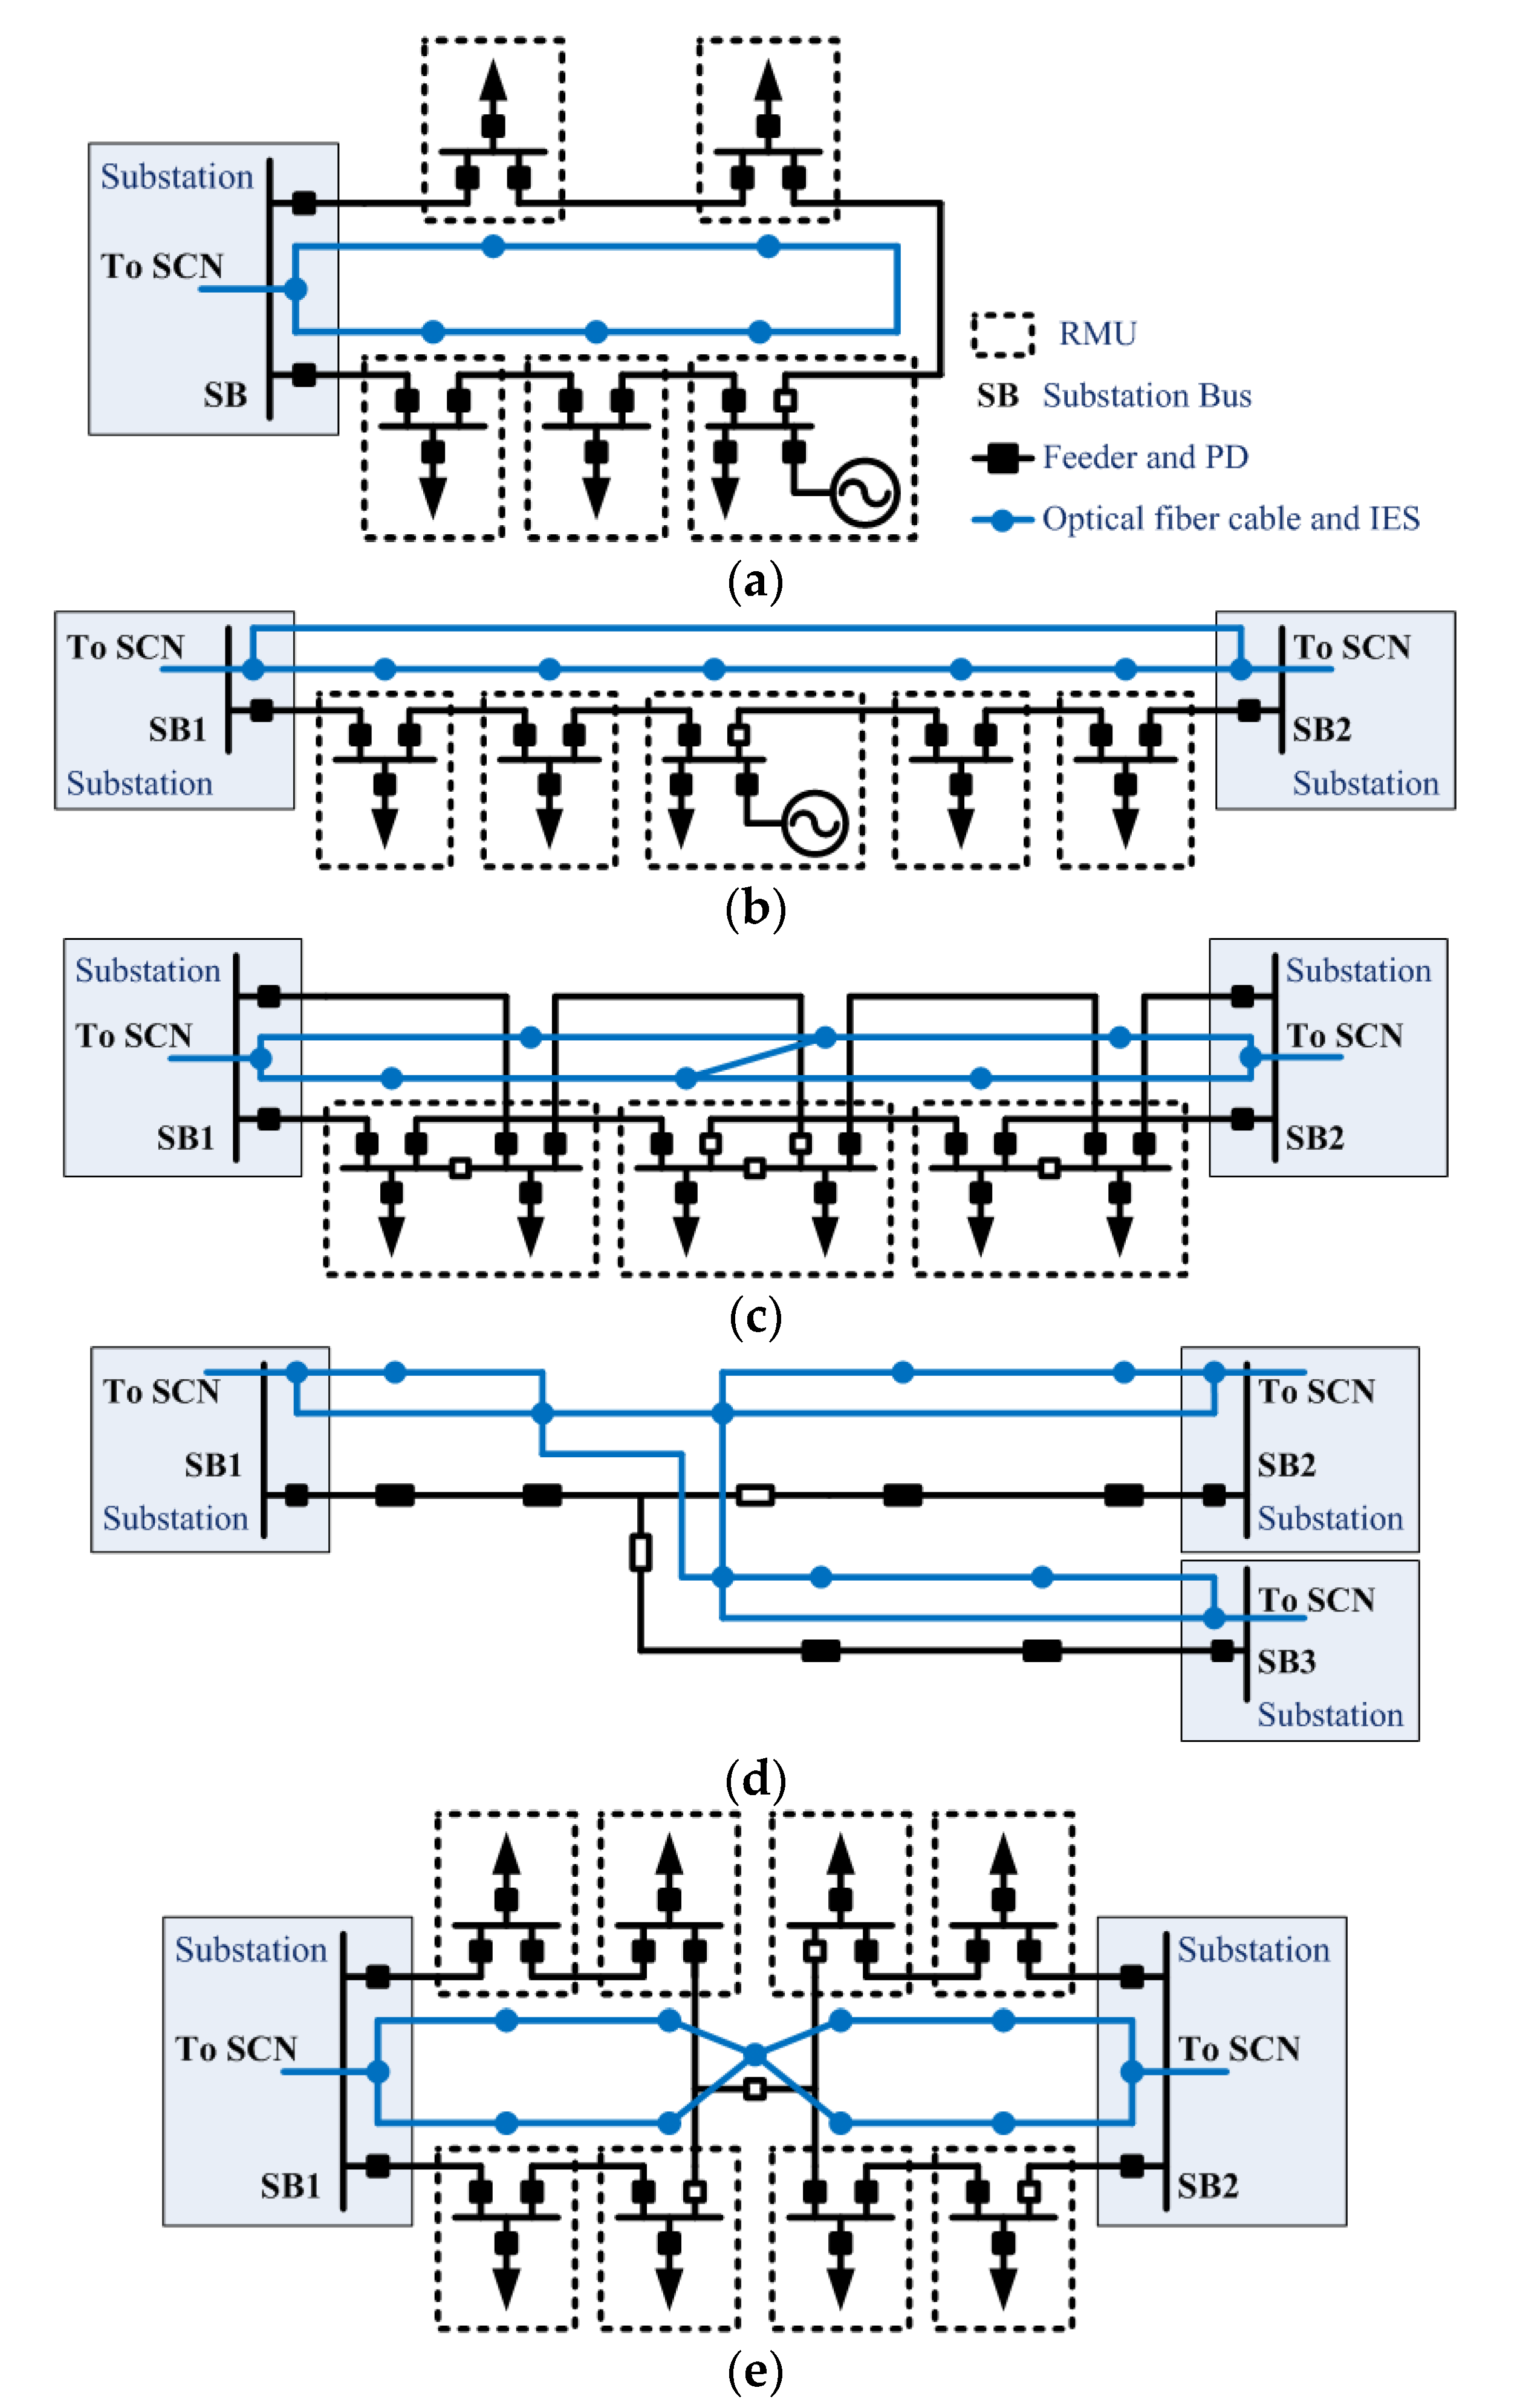
Figure 3.
The flow chart of data synchronization method for line current differential protection (LCDP) algorithm.
Figure 3.
The flow chart of data synchronization method for line current differential protection (LCDP) algorithm.

Figure 4.
The communication process of the LCDP.
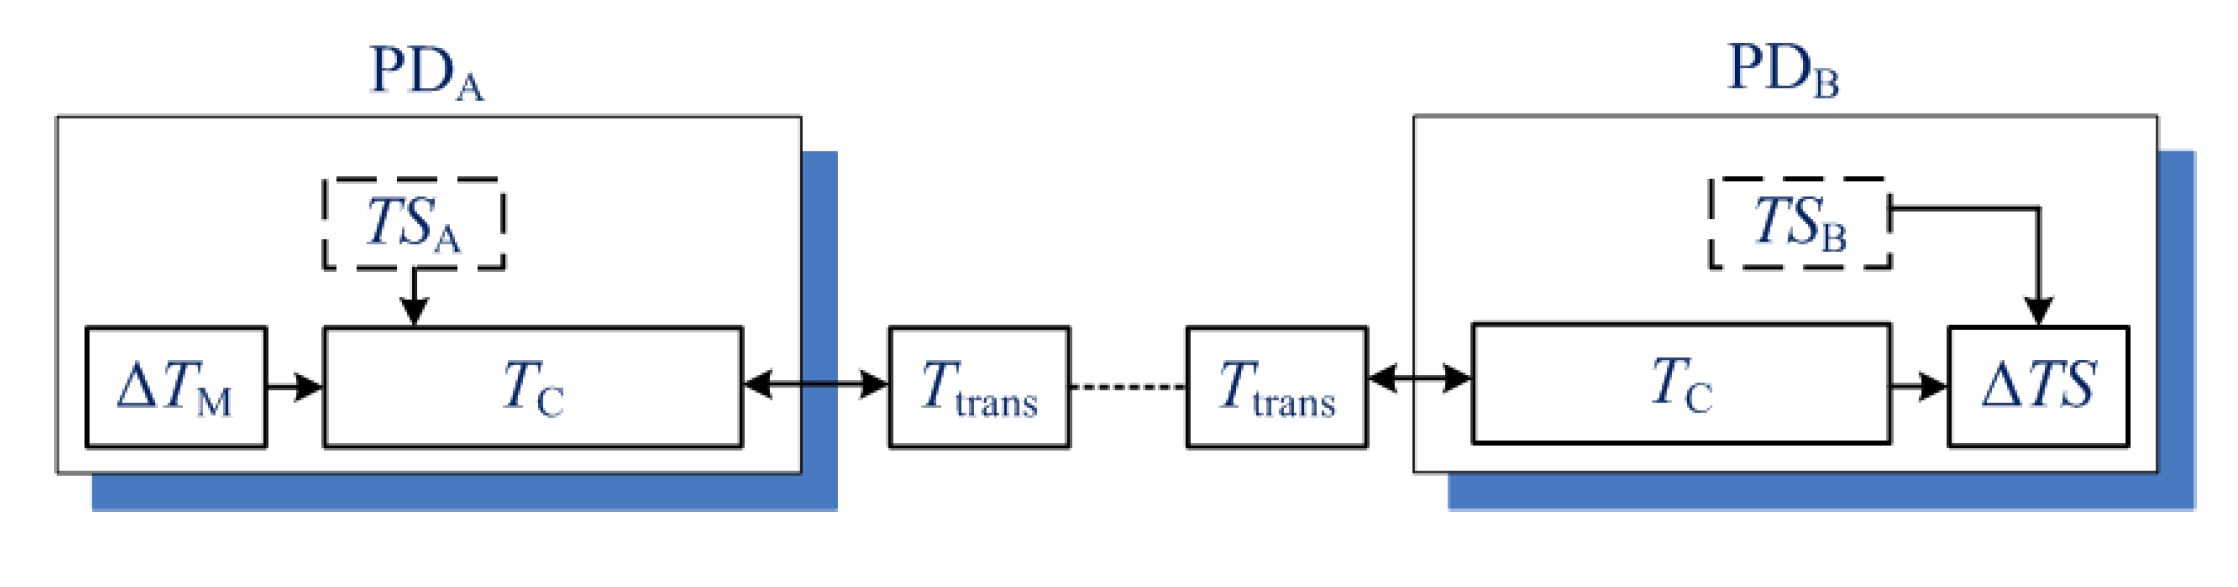
Figure 5.
The communication process of two protection devices (PDs).
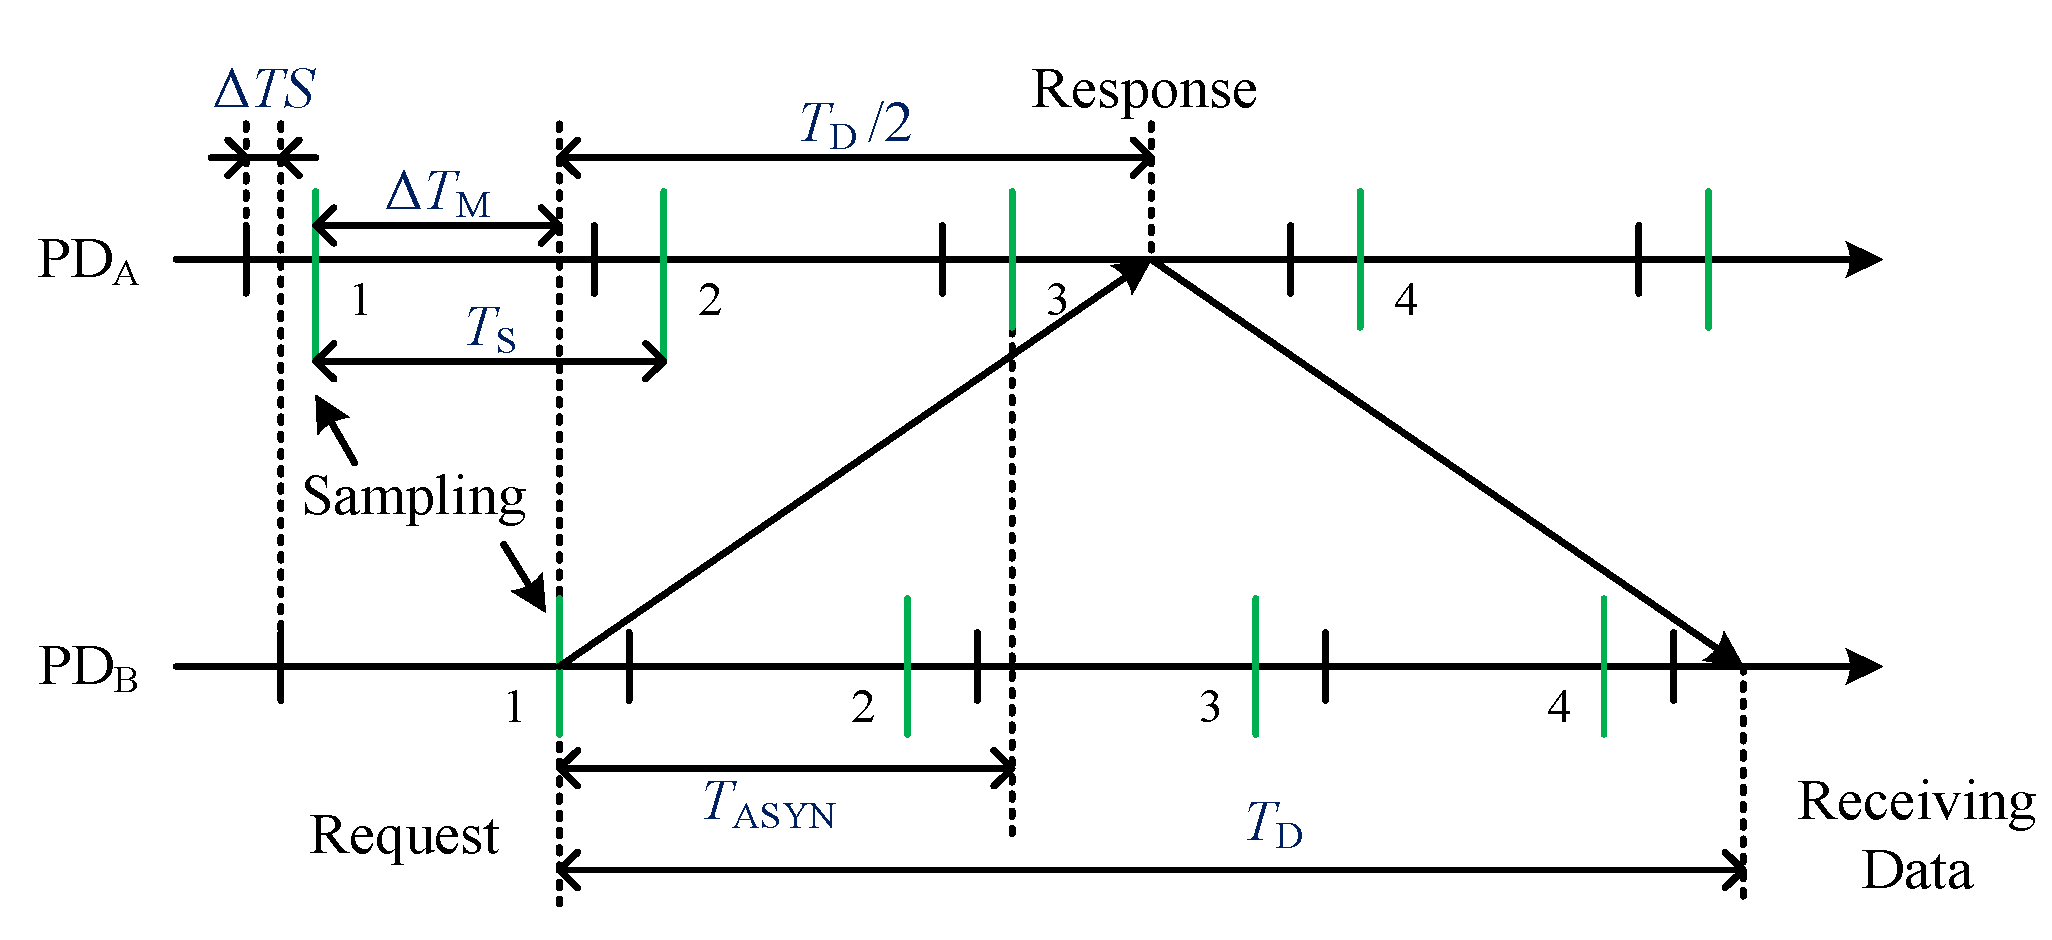
Figure 6.
The retransmission mechanism of the generic object-oriented substation event (GOOSE).
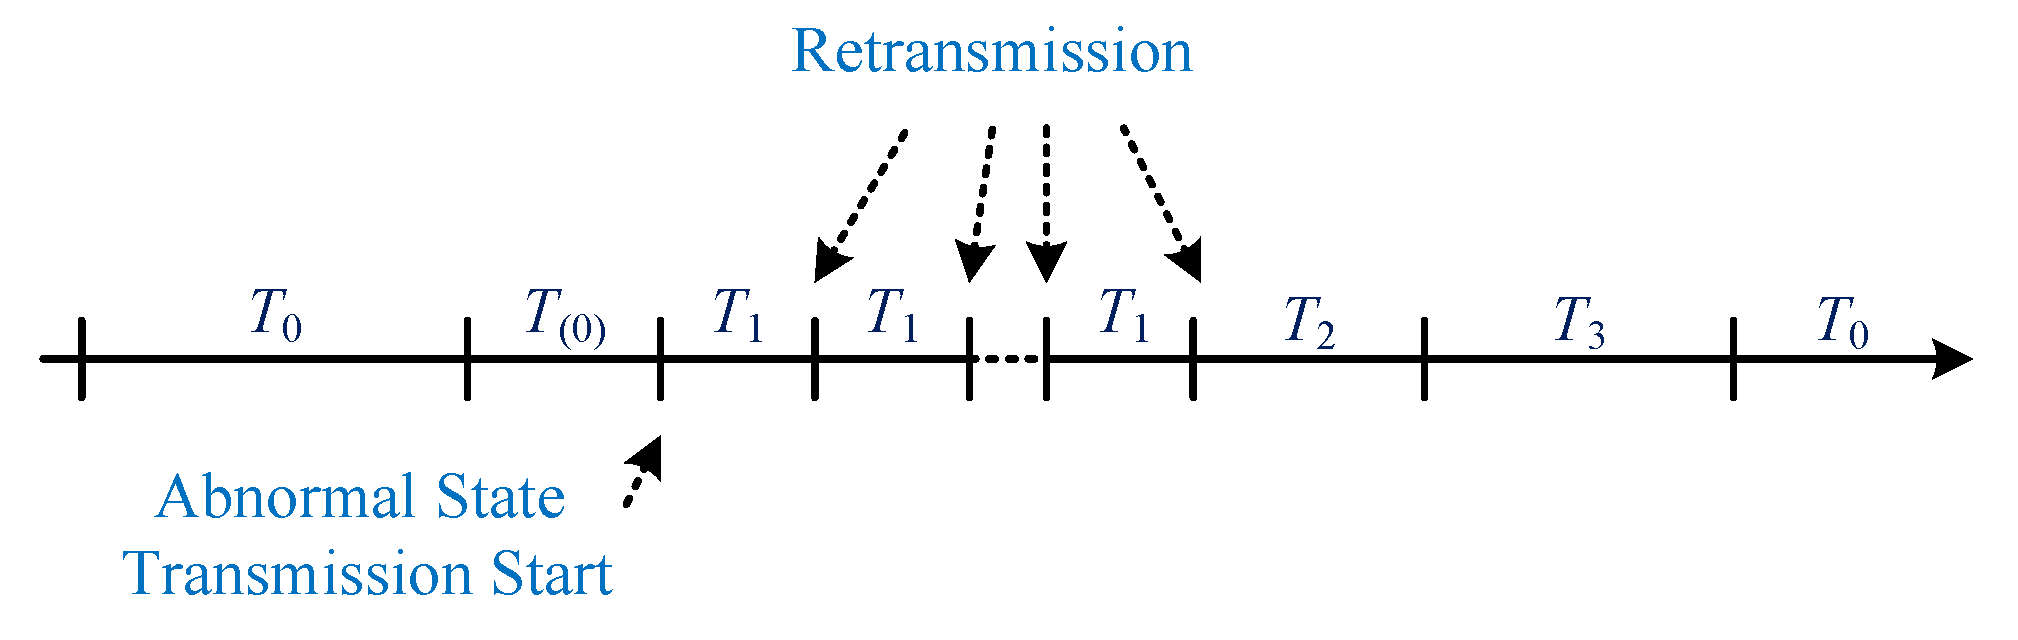
Figure 7.
The co-simulation test system (a) architecture and (b) simulation server and PDs.

Figure 8.
The topology of the distribution network and the communication network.
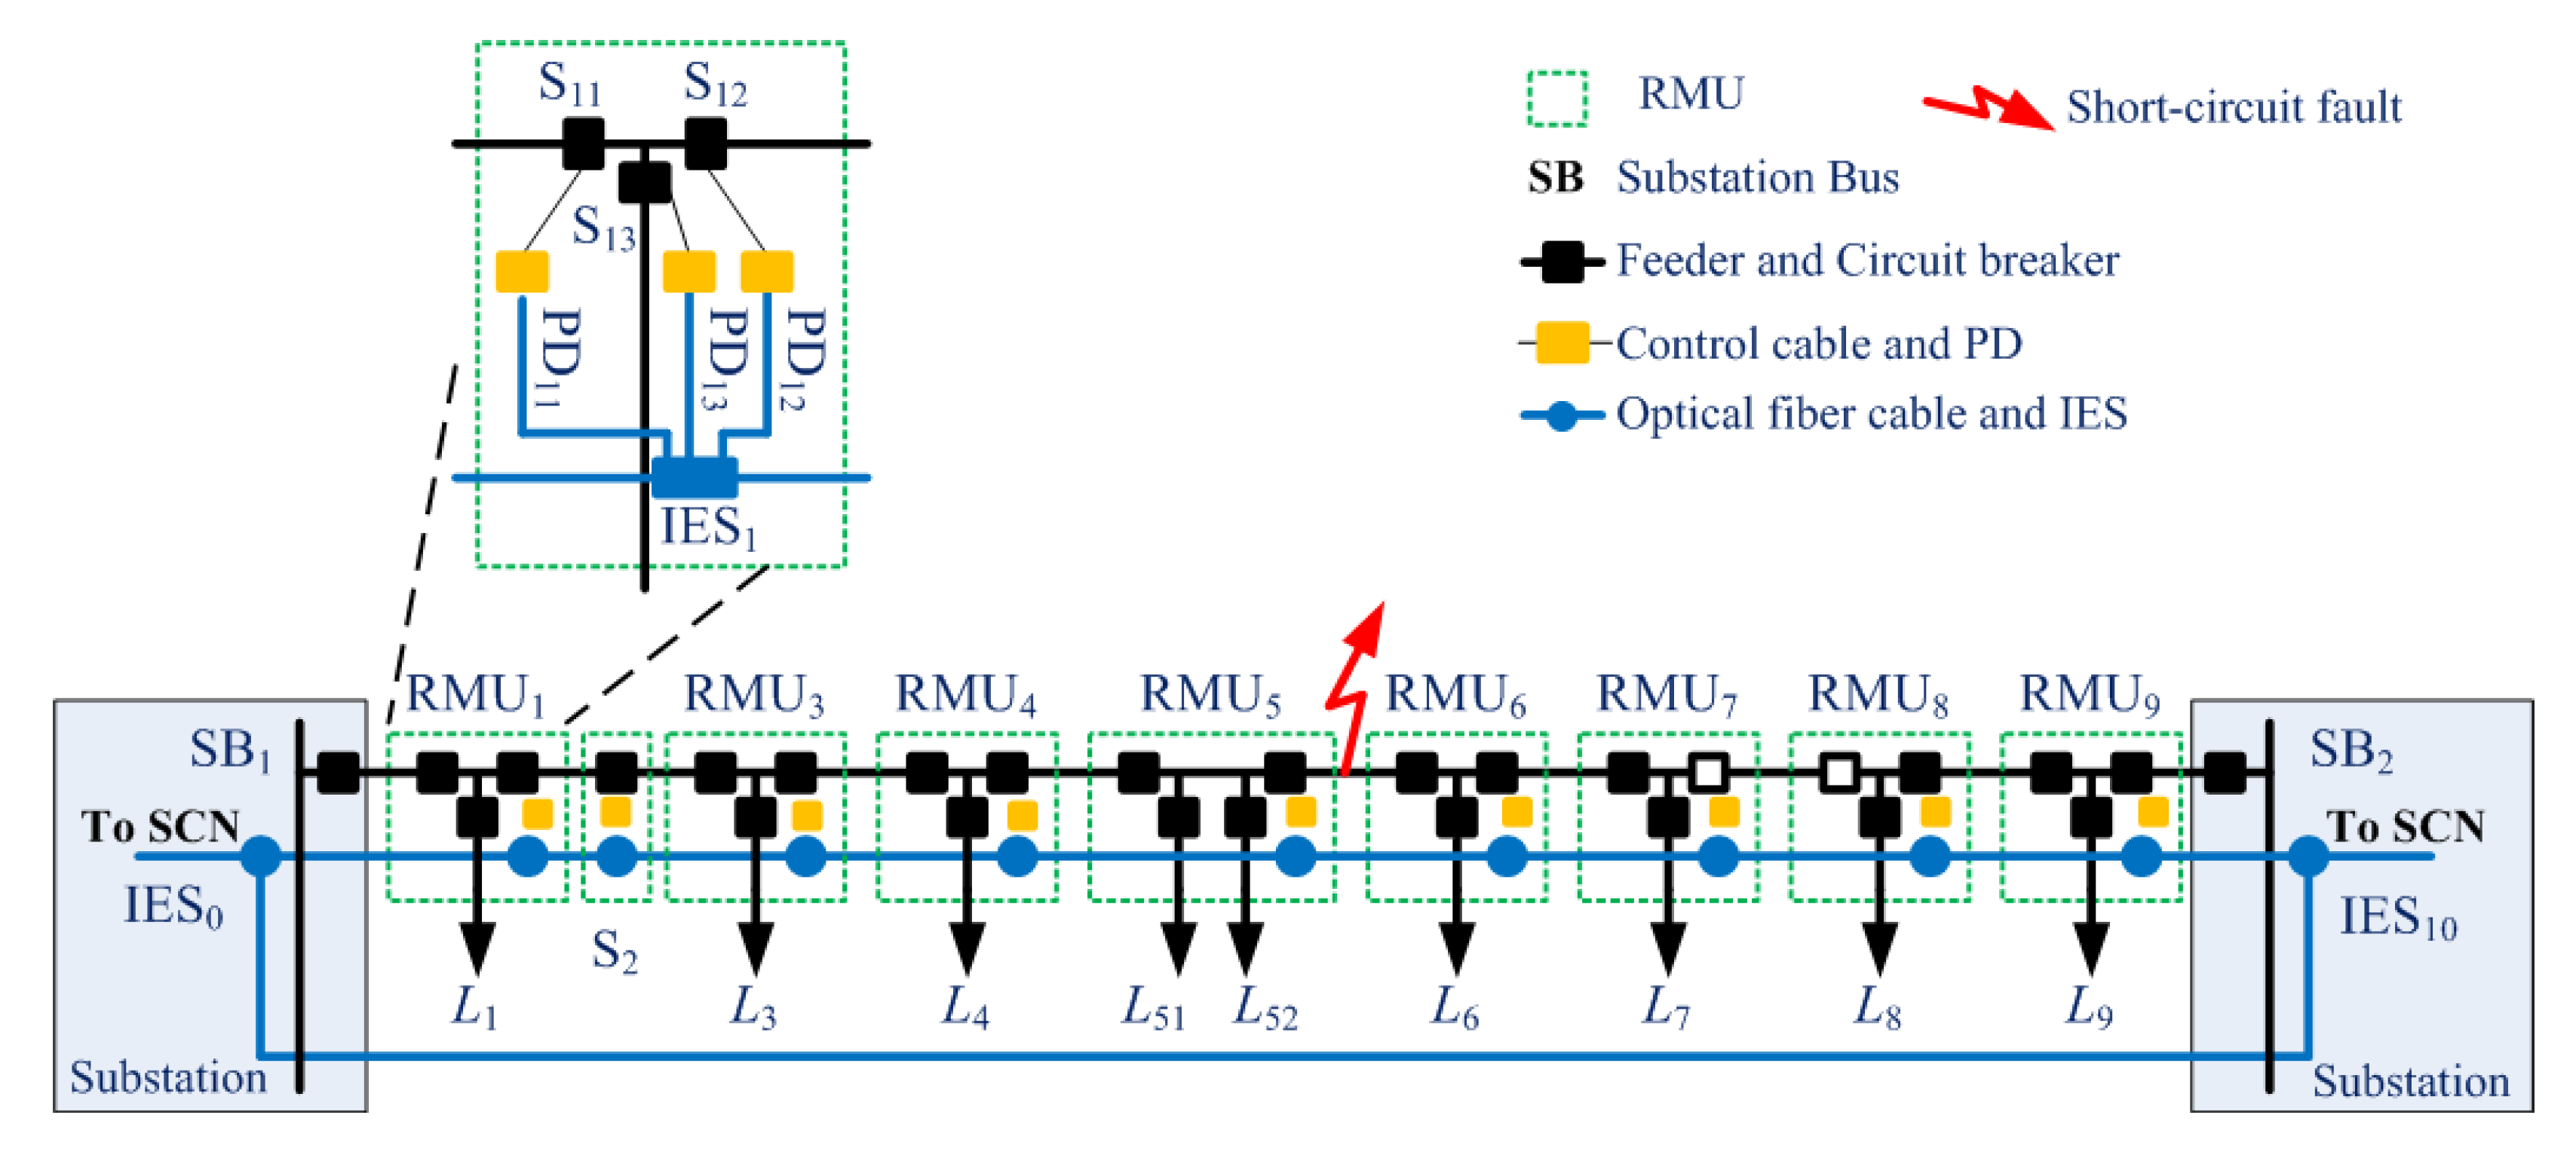
Figure 9.
The time delay evaluation: (a) the time delay under different communication network topologies and (b) the time delay of each IES.
Figure 9.
The time delay evaluation: (a) the time delay under different communication network topologies and (b) the time delay of each IES.
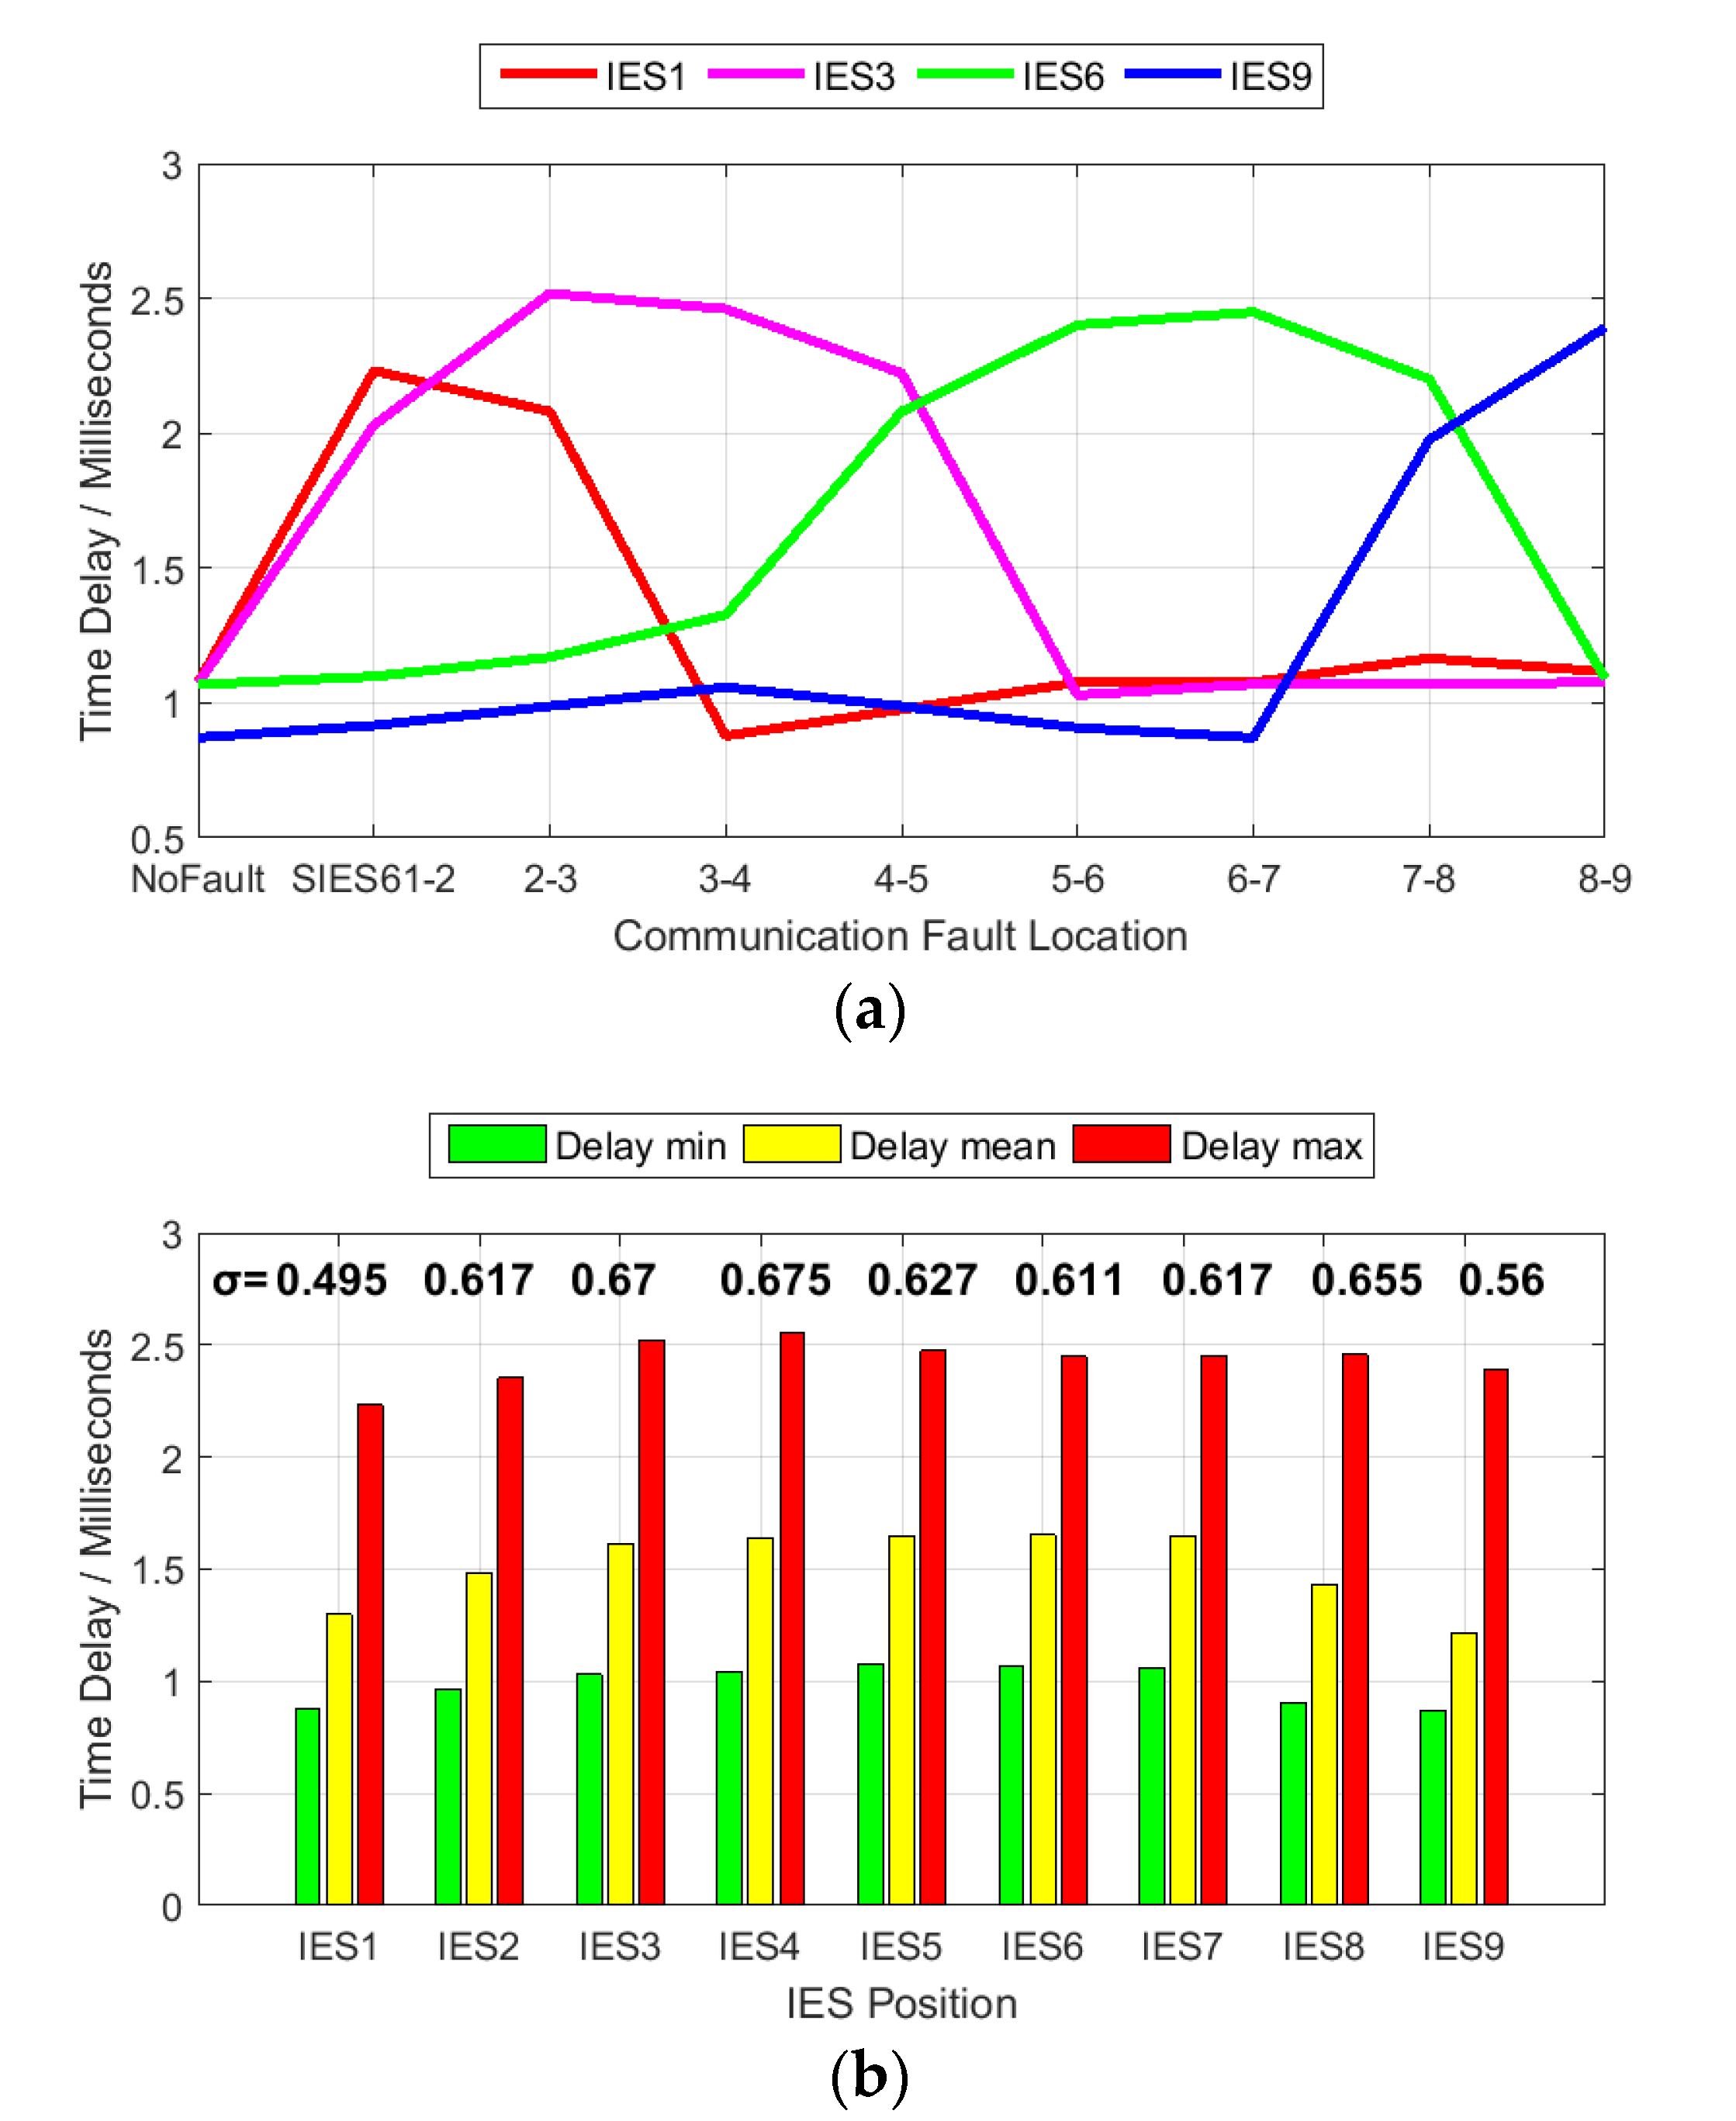
Figure 10.
Communication sequence of PD32.

Figure 11.
The time delay of each IES when PD32 (a) and PD41 (b) communicate.


Table 1.
Parameters of distribution network.
| No. | Sending–Receiving Bus | Distance (km) | Line Impedance (ohm) | Load at Receiving Bus (MVA) |
|---|---|---|---|---|
| 1 | BB1-RMU1 | 0.300 | 0.019 + j0.023 | 0 |
| 2 | RMU1-S2 | 1.081 | 0.141 + j0.497 | 0 |
| 3 | S2-RMU3 | 0.763 | 0.065 + j0.149 | 2.59 |
| 4 | RMU3-RMU4 | 0.340 | 0.022 + j0.026 | 1.45 |
| 5 | RMU4-RMU5 | 0.195 | 0.012 + j0.015 | 1.52 |
| 6 | RMU5-RMU6 | 0.717 | 0.046 + j0.054 | 2.87 |
| 7 | RMU6-RMU7 | 0.955 | 0.061 + j0.072 | 0.50 |
| 8 | RMU7-RMU8 | 0.645 | 0.041 + j0.049 | 3.83 |
| 9 | RMU8-RMU9 | 0.215 | 0.014 + j0.016 | 0.74 |
| 10 | RMU9-BB2 | 0.935 | 0.060 + j0.070 | 0 |
Table 3.
Results of round-trip tests.
| d (bytes) | d/R (us) | TRT (us, N = 2) | TRT (us, N = 6) | TC (us) | tr (us) |
|---|---|---|---|---|---|
| 64 | 5.12 | 145 | 215 | 27.5 | 3.63 |
| 128 | 10.24 | 185 | 285 | 33.75 | 2.26 |
| 192 | 15.35 | 225 | 375 | 36.25 | 3.39 |
| 256 | 20.48 | 275 | 465 | 45 | 3.27 |
| 320 | 25.6 | 305 | 535 | 47.5 | 3.15 |
| 384 | 30.72 | 355 | 635 | 53.75 | 4.28 |
| 448 | 35.84 | 395 | 705 | 60 | 2.91 |
| 512 | 49.96 | 435 | 785 | 65 | 2.79 |
Table 4.
Results of different communication line faults.
| Fault Line | Action Switch (Trigger Time/ms) |
|---|---|
| No Fault | S52 (32.8 ms), S61 (34.1 ms) |
| RMU1-S2 | S52 (32.8 ms), S61 (34.1 ms), S2 (36.1 ms) |
| S2-RMU3 | S52 (32.8 ms), S61 (34.1 ms), S31 (35.8 ms) |
| RMU3-RMU4 | S52 (32.8 ms), S61 (34.0 ms), S32 (35.2 ms), S41 (35.5 ms) |
| RMU4-RMU5 | S52 (33.1 ms), S61 (34.0 ms), S42 (35.1 ms), S51 (35.1 ms) |
| RMU5-RMU6 | S52 (33.5 ms), S61 (35.1 ms) |
| RMU6-RMU7 | S52 (32.8 ms), S61 (35.8 ms) |
| RMU7-RMU8 | S52 (32.8 ms), S61 (33.9 ms) |
| RMU8-RMU9 | S52 (32.8 ms), S61 (33.9 ms) |
Table 5.
The LCDP calculation result of PD32.
| Fault Line Location | Upstream | Downstream |
|---|---|---|
| Protection Zone | <PD31, PD32, PD33> | <PD32, PD41> |
| Proportion of Fault Current (PCF) | 1.82 × 10⁻⁶ | 23.3 |
| Verification Zone | <PD2, PD32, PD33> | <PD32, PD42, PD43> |
| PCF | 1.18 × 10⁻² | 22.9 |
| S0 | 10 | 10 |
| Conclusion | No fault | Short-circuit fault occurs |
Table 6.
Results of different communication line faults.
| Fault Line | Action Switch (Trigger Time/ms) |
|---|---|
| No Fault | S52 (32.8 ms), S61 (33.8 ms) |
| RMU1-S2 | S52 (32.8 ms), S61 (33.8 ms) |
| S2-RMU3 | S52 (32.8 ms), S61 (33.8 ms) |
| RMU3-RMU4 | S52 (32.8 ms), S61 (33.8 ms) |
| RMU4-RMU5 | S52 (33.1 ms), S61 (33.8 ms) |
| RMU5-RMU6 | S52 (33.3 ms), S61 (34.4 ms) |
| RMU6-RMU7 | S52 (32.8 ms), S61 (34.5 ms) |
| RMU7-RMU8 | S52 (32.8 ms), S61 (33.8 ms) |
| RMU8-RMU9 | S52 (32.8 ms), S61 (33.8 ms) |
Table 2.
Background traffic of the communication network.
| Background Traffic Type | Priority | Packet Size (bytes) | Generation Period (s) |
|---|---|---|---|
| Phasor Measurement | 1 | 120 | 0.02 |
| Time Synchronization | 1 | 88 | 1 |
| Electric Information Acquisition | 2 | 100 | 15 |
| Distributed Generation Management | 2 | 111 | 0.02 |
| Electric Vehicle Management | 2 | 100 | 0.02 |
| DSCADA | 3 | 152 | 300 |
| Video Monitoring | 3 | 437 | 0.0001 |
© 2020 by the authors. Licensee MDPI, Basel, Switzerland. This article is an open access article distributed under the terms and conditions of the Creative Commons Attribution (CC BY) license (http://creativecommons.org/licenses/by/4.0/).
Share and Cite
MDPI and ACS Style
Duan, Y.; Luo, L.; Li, Y.; Cao, Y. The Communication System and its Impacts on Line Current Differential Protection in Distributed Feeder Automation. Energies 2020, 13, 1298. https://doi.org/10.3390/en13061298
AMA Style
Duan Y, Luo L, Li Y, Cao Y. The Communication System and its Impacts on Line Current Differential Protection in Distributed Feeder Automation. Energies. 2020; 13(6):1298. https://doi.org/10.3390/en13061298
Chicago/Turabian StyleDuan, Yilong, Longfu Luo, Yong Li, and Yijia Cao. 2020. "The Communication System and its Impacts on Line Current Differential Protection in Distributed Feeder Automation" Energies 13, no. 6: 1298. https://doi.org/10.3390/en13061298
Note that from the first issue of 2016, this journal uses article numbers instead of page numbers. See further details here.