European Cities in the Energy Transition: A Preliminary Analysis of 27 Cities

 ,
,  , and
, and
Abstract
:1. Introduction
- -
- What are the difficulties in describing the current situation?
- -
- How can these difficulties help other authorities in their energy transition?
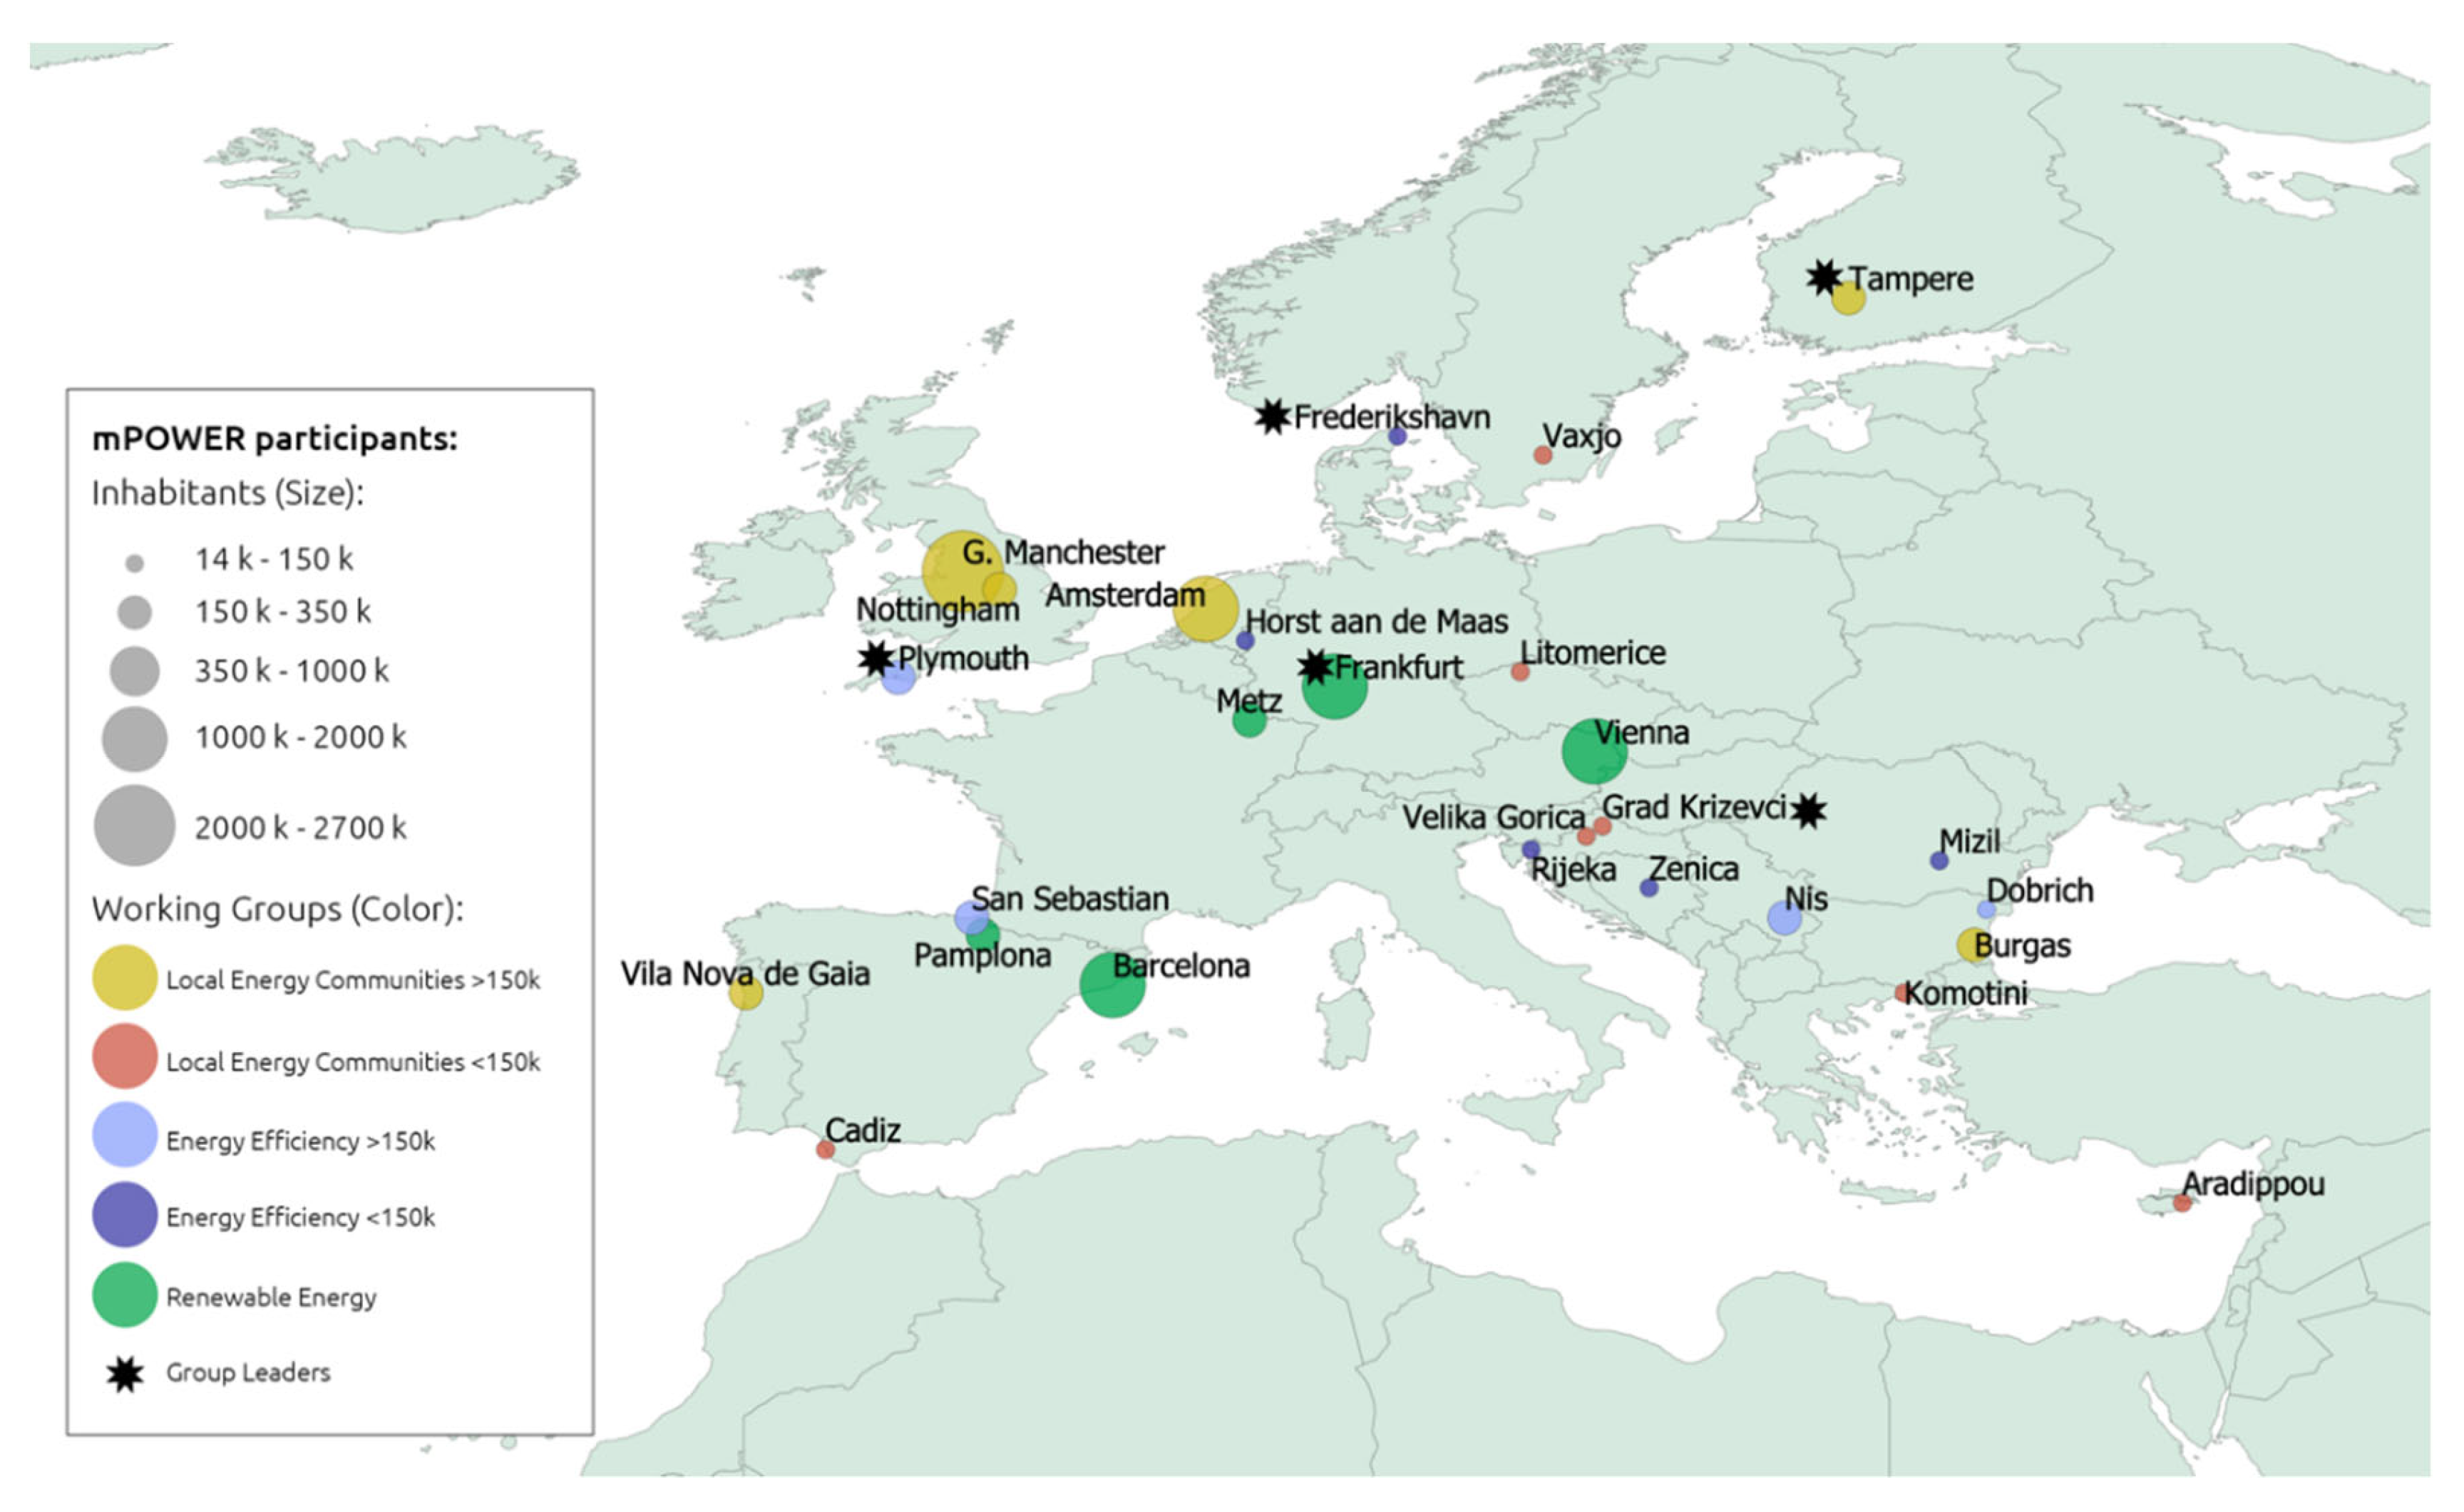
2. The mPOWER Project
3. Methodology of the Research Baseline
- To increase energy savings;
- To increase renewable energy production;
- To increase the capabilities of public authorities on energy supply and production management;
- To create city-based strategies for encompassing energy transition.
3.1. Survey Data Standardisation Methodology
3.2. Survey Data Assessment Methodology
4. Results and Discussion
4.1. Survey Data Standardisation
4.2. Survey Data Assessment
5. Conclusions
Author Contributions
Funding
Acknowledgments
Conflicts of Interest
Appendix A. Online Survey
- Yes
- No
- 0
- 1–5
- 6–10
- 15+
- 0
- 1–5
- 6–10
- 15+
Appendix B. Standardised Data of the Research Project

| City | Data Type | Received Value | Considered Value | Reason |
|---|---|---|---|---|
| Metz | Installed RES electric (MW) | 13,100 | 131.00 | Received data is quite high and presents no proportionality with the energy generation indicated |
| Horst aan de Maas | Installed RES thermal (MW) | 3.07 PJ/year | 852,777 MWh | Unit change from International System to required (MWh) is applied. Data is allocated in the energy column |
| Horst aan de Maas | Installed RES electric (MW) | 3.45 PJ/year | 958,333 MWh | Unit change from International System to required (MWh) is applied. Data is allocated in the energy column |
| Manchester | Installed RES thermal (MW) | 53.82017 | 53.8 | The last 4 digits refer to the year of the data |
| G. Manchester | Installed RES electric (MW) | 1,262,017 | 126 | The last 4 digits refer to the year of the data |
| G. Manchester | Consumption Electricity (MWh/year) | 139,322,016 | 13,932 | The last 4 digits refer to the year of the data |
| G. Manchester | Consumption Gas (MWh/year) | 216,720,002,016 | 21,672,000 | The last 4 digits refer to the year of the data |
| G. Manchester | Consumption Coal (MWh/year) | 5,162,016 | 516 | The last 4 digits refer to the year of the data |
| Mizil | Installed RES electric (MW) | 1735 | 1.735 | Based on data given in a preliminary survey 1.735 MW PV |
| Mizil | Production RES electric (MWh) | 0.67 | 670 | Produced energy-power ratio is logical with this figure (value was introduced in GWh) |
| Nottingham | Production RES electric (MWh) | - | 6 | Based on data given in a preliminary survey: 6 MW PV |
| Pamplona | Production RES electric (MWh) | 190 | 0.19 | Produced energy-power ratio is logical with this figure (value was introduced in GWh) |
| Tampere | Production RES thermal (MW) | - | 315 | Based on data given in a preliminary survey: 83 MW Biomass, 232 CHP |
| Tampere | Production RES electric (MW) | - | 16 | Based on data given in a preliminary survey: 16 MW Hydro |
| Zenica | Produced RES electric (MWh) | 0.9 | 900 | Produced energy-power ratio is logical with this figure (value was introduced in GWh) |
| Zenica | Produced RES thermal (MWh) | 0.2 | 200 | Produced energy-power ratio is logical with this figure (value was introduced in GWh) |
| Energy Consumption (MWh/Year) | RES Installation and Production | |||||||||
|---|---|---|---|---|---|---|---|---|---|---|
| City | GHG (t CO2 eq/Year) | Electricity | Gas | Liquid Fuels | Coal | Total | Thermal Power (MW) | Thermal Energy (MWh/Year) | Electric Power (MW) | Electric Energy (MWh/Year) |
| Amsterdam | 4500 | 5,787,800 | 11,386,400 | 6,123,200 | 437,723 | 23,735,122 | - | - | - | - |
| Aradippou | 98,383 | 77,482 | 8737 | 94,480 | 2103 | 182,802 | - | 9675 | 1.08 | 1742 |
| Barcelona | 3,413,260 | 6,825,200 | 4,755,340 | 3,414,760 | 0 | 15,145,912 | 101.00 | 81,268 | 13.00 | 16,414 |
| Burgas | 1,192,800 | 1,041,600 | 558,600 | 1,146,600 | 136,416 | 2,883,216 | - | - | - | - |
| Cadiz | 611,660 | 374,036 | 84,169 | 921,060 | 0 | 1,379,264 | - | - | 1.07 | 1385 |
| Dobrich | 585,040 | 510,880 | 145,710 | 562,380 | 0 | 1,218,970 | 0.00 | 0.00 | 0.00 | 0.00 |
| Frankfurt | 9,467,655 | 4,699,832 | 2,708,405 | 6,045,000 | 745,125 | 14,198,362 | 64.44 | 10,697 | 31.00 | 25,181 |
| Frederikshavn | 458,000 | 420,277 | 326,944 | 697,222 | 0 | 1,444,443 | 418.30 | - | 42.30 | 330,408.56 |
| Horst aan de Maas | 695,050 | 286,111 | 1,269,444 | 486,111 | 0 | 2,041,666 | - | 852,777.78 | - | 958,333.33 |
| Komotini | 350,415 | 329,450 | 75,474 | 373,776 | 0 | 778,700 | - | - | - | - |
| Krizevci | 79,800 | 21,211 | 47,153 | 81,000 | 8 | 149,371 | 0.00 | 0.00 | 0.03 | 29.60 |
| Litomerice | 81,765 | 161,500 | 142,250 | 168,750 | 78,035 | 550,535 | 1.57 | - | 0.68 | 672 |
| G. Manchester | 13,500,000 | 13,581,000 | 21,671,998 | 19,521,000 | 516 | 54,774,514 | 53.80 | - | 126.00 | - |
| Metz | 869,712 | 953,885 | 1,1163,280 | 1,689,420 | 0 | 3,806,585 | 45.00 | 94,454 | 131.00 | 179,347 |
| Mizil | 49,376 | 38,499 | 45,655 | 47,945 | 5295 | 137,395 | - | - | 1.74 | 670 |
| Nis | 1,679,600 | 1,201,200 | 442,000 | 868,400 | 311,451 | 2,823,051 | - | - | - | - |
| Nottingham | 1,257,583 | 1,240,386 | 2,333,802 | 1,395,843 | 8713 | 4,978,744 | - | - | - | - |
| Pamplona | 1,028,000 | 667,975 | 1,223,742 | 2,747,484 | 14,394 | 4,653,595 | 0.20 | 350 | 0.19 | 225 |
| Plymouth | 1,053,000 | 904,000 | 1,557,000 | 1,879,800 | 17,000 | 4,357,800 | 1.80 | - | 7.30 | - |
| Rijeka | 486,400 | 508,160 | 524,800 | 753,920 | 0 | 1,786,880 | 0.00 | 0.00 | 0.11 | 86.43 |
| San Sebastian | 1,170,181 | 680,702 | 732,568 | 1,400,855 | 0 | 2,814,125 | 7.34 | 9159 | 1.63 | 1,630 |
| Tampere | 1,920,960 | 3,589,040 | 283,040 | 1,939,520 | 263,065 | 6,074,664 | 99.00 | - | - | - |
| Vaxjo | 268,000 | 670,000 | 0 | 718,000 | 100 | 1,388,100 | - | 670,000 | - | 235,000 |
| Velika Gorica | 241,365 | 252,162 | 257,800 | 374,115 | 0 | 884,077 | - | - | 0.15 | - |
| Vienna | 8,356,000 | 7,815,00 | 17,314,000 | 12,621,000 | 8,007 | 37,758,006 | 283.00 | 1,270,000 | 256.00 | 1,401,000 |
| Vila Nova de Gaia | 1,640,837 | 1,750,868 | 1,225,720 | 2,801,294 | 0 | 5,777,882 | - | - | 6.50 | 32,040 |
| Zenica | 253,085 | 132,156 | 0 | 379,489 | 124,534 | 636,179 | 3.00 | 200 | 1.44 | 900 |
| City | Council Led Campaigns | Staff on Energy (# of FTE Staff) | Staff on Transition/Reducing Energy Use/RES (# of FTE Staff) | Annual Budget Dedicated to Energy Transition (€) | Plans for RES Investment (MW for 2020) |
|---|---|---|---|---|---|
| Amsterdam | >15 | - | - | 87,500,000 | - |
| Aradippou | 1–5 | 2 | 2 | 70,000 | 6.00 |
| Barcelona | >15 | 15 | 55 | - | 1.50 |
| Burgas | - | - | - | - | - |
| Cadiz | 1–5 | 1 | 1 | 70,000 | - |
| Dobrich | 1-5 | 3 | 3 | 200,000 | - |
| Frankfurt | >15 | 23 | 13 | 1,800,000 | - |
| Frederikshavn | 6–10 | 8 | 2 | 58,000 | - |
| Horst aan de Maas | 1–5 | 5,5 | 3,5 | 60,000 | <1 |
| Komotini | 1–5 | 8 | 2 | 500,000 | - |
| Krizevci | 1–5 | 1 | 1 | 792,000 | - |
| Litomerice | 1–5 | 2 | 2 | 200,000 | - |
| G. Manchester | 6–10 | 15 | 15 | 7,020,000 | 10.00 |
| Metz | >15 | 1 | 5 | 500,000 | Yes |
| Mizil | 1–5 | 4 | 4 | 1,000,000 | - |
| Nis | - | 6 | 3 | 20,000 | 1.00 |
| Nottingham | - | - | - | - | Yes |
| Pamplona | 1–5 | 3 | 1 | 100,000 | - |
| Plymouth | 6–10 | 16 | 16 | 589,000 | Yes |
| Rijeka | 0 | 1 | 1 | - | - |
| San Sebastian | 1–5 | 4 | 11 | 400,000 | 0.07 |
| Tampere | - | - | - | - | - |
| Vaxjo | - | - | - | - | Yes |
| Velika Gorica | 1–5 | 1 | 1 | 40,000 | - |
| Vienna | >15 | 25 | - | - | Yes |
| Vila Nova de Gaia | 1–5 | 10 | - | 5,000,000 | 0.50 |
| Zenica | 1–5 | 1 | 0 | 250,000 |
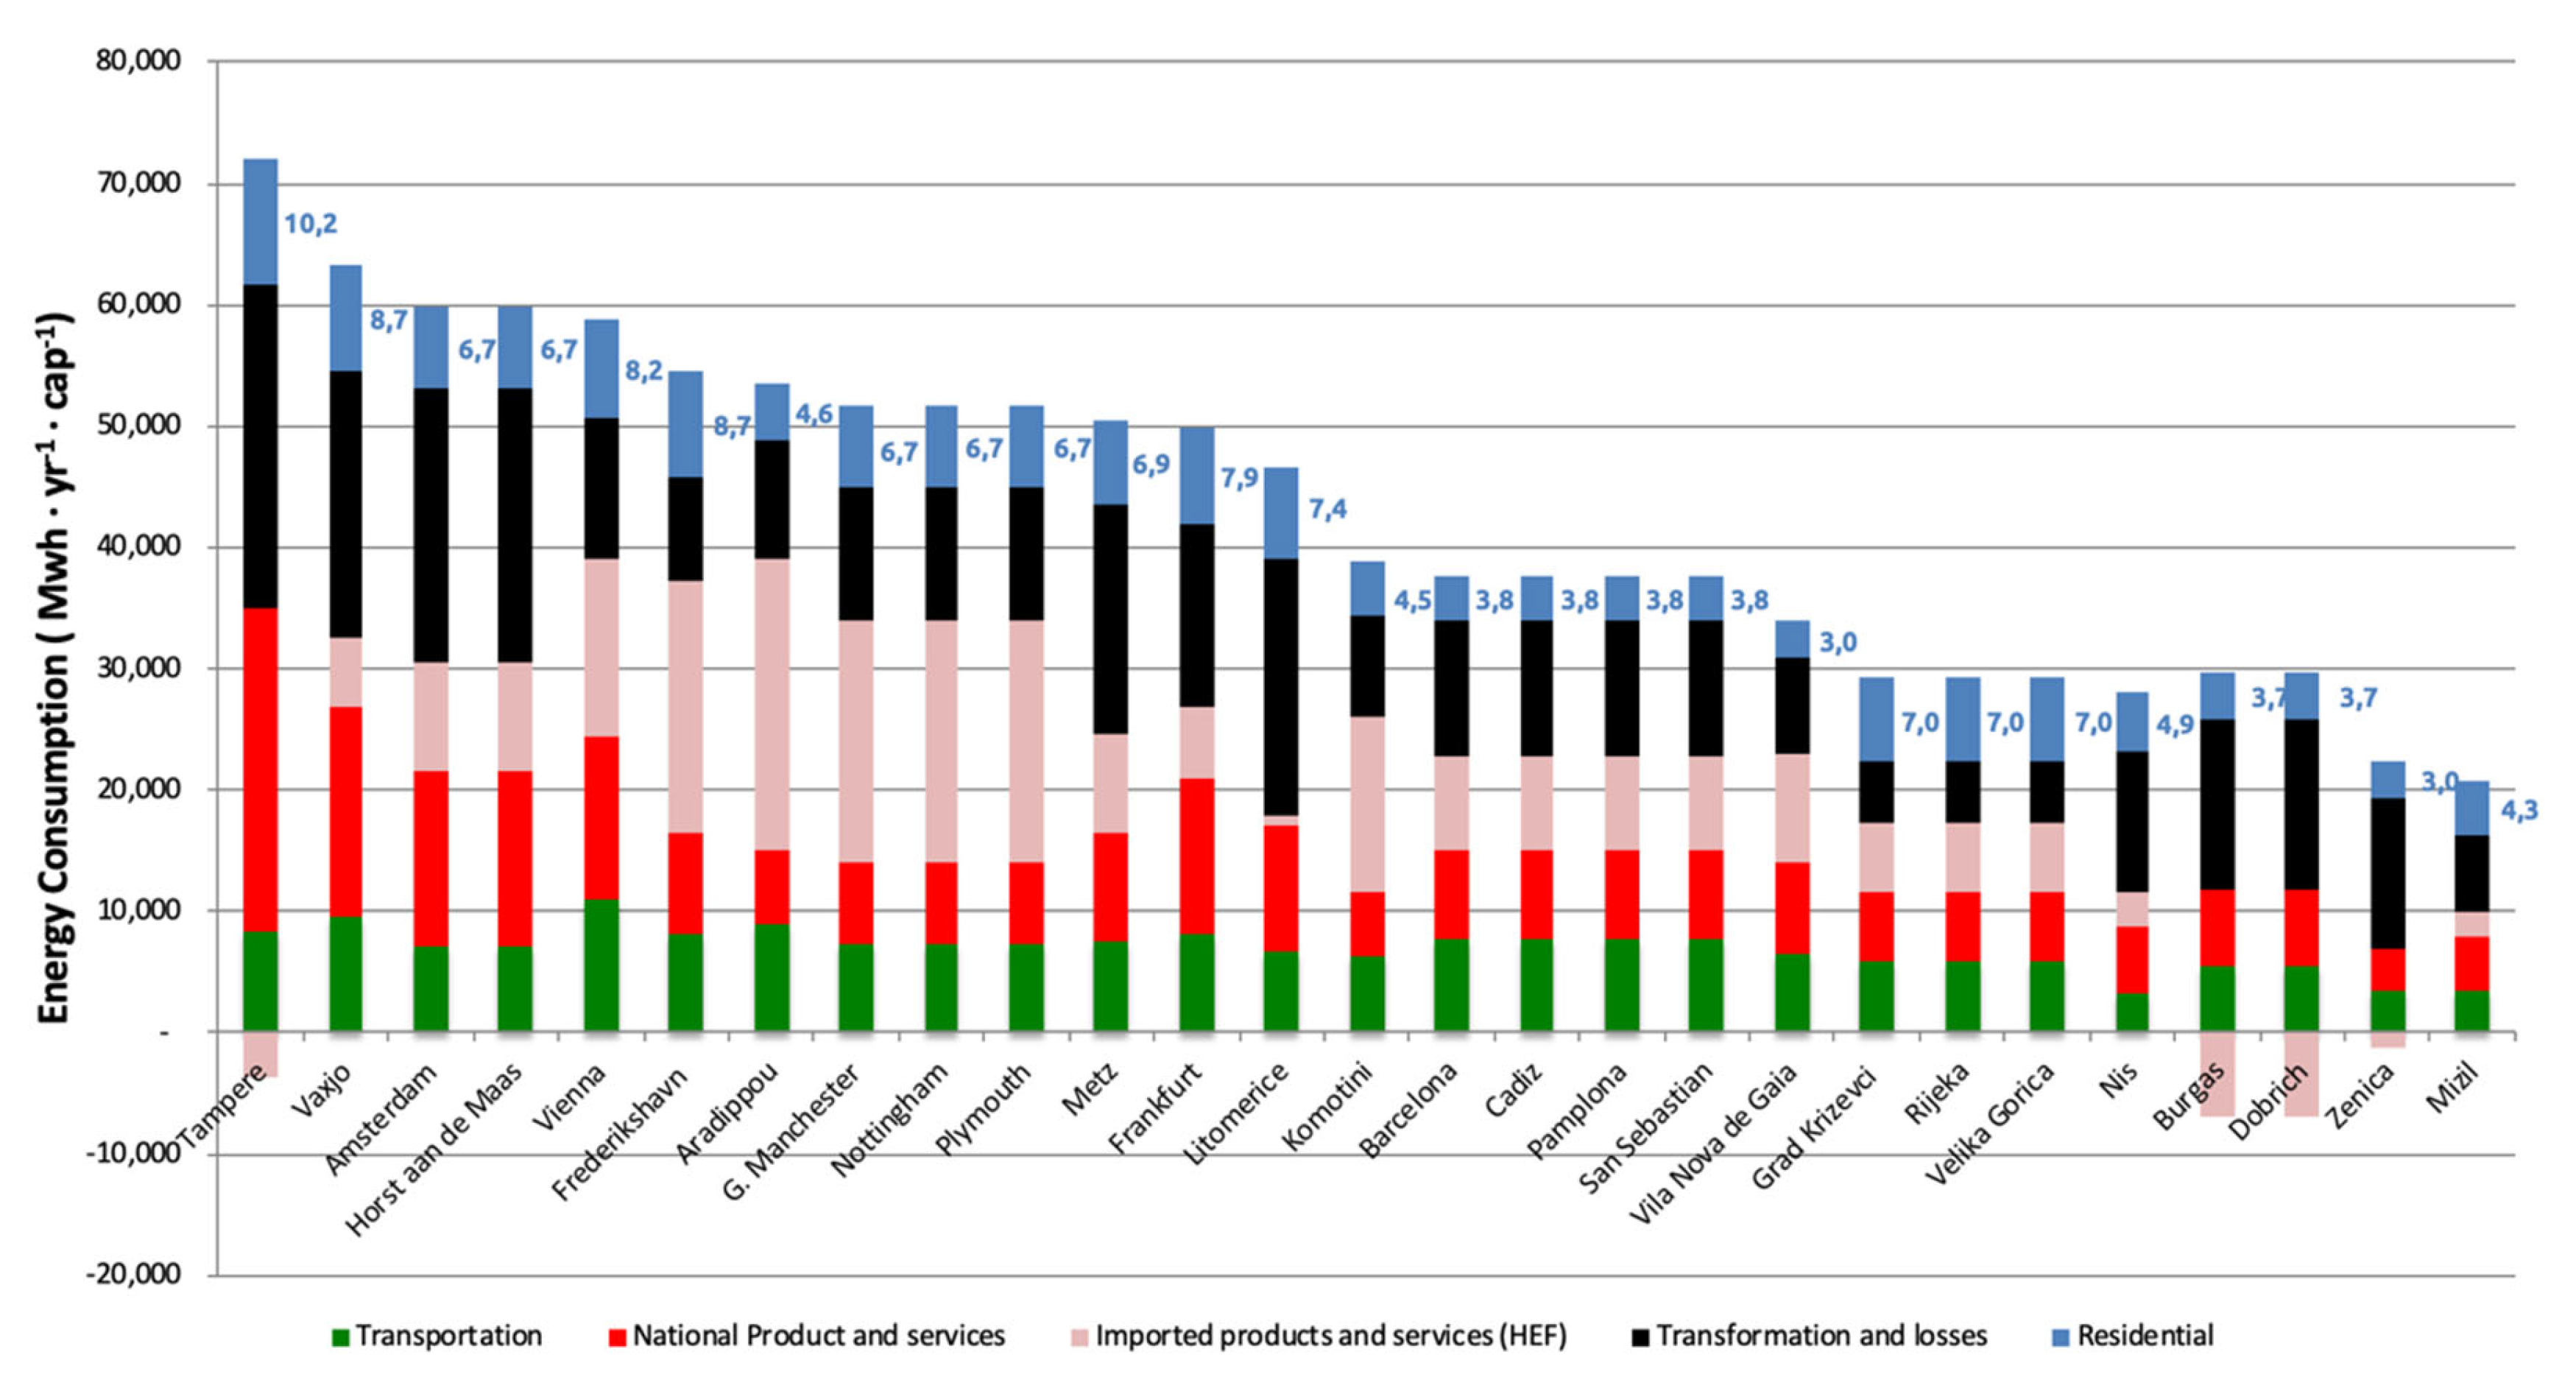
| Country | City | Transportation | National Products and Services | Imported Products and Services (HEF) | Transformation and Losses | Residential | TOTAL (MWh/yr/Cap) |
|---|---|---|---|---|---|---|---|
| Netherlands | Amsterdam | 7.12 | 14.40 | 8.91 | 22.68 | 6.74 | 59.85 |
| Cyprus | Aradippou | 8.88 | 6.25 | 23.92 | 9.82 | 4.58 | 53.46 |
| Spain | Barcelona | 7.74 | 7.29 | 7.68 | 11.17 | 3.81 | 37.69 |
| Bulgaria | Burgas | 5.46 | 6.38 | 6.87 | 14.07 | 3.74 | 22.79 |
| Spain | Cadiz | 7.74 | 7.29 | 7.68 | 11.17 | 3.81 | 37.69 |
| Bulgaria | Dobrich | 5.46 | 6.38 | 6.87 | 14.07 | 3.74 | 22.79 |
| Germany | Frankfurt | 8.06 | 12.86 | 5.99 | 14.98 | 7.94 | 49.84 |
| Denmark | Frederikshavn | 8.06 | 8.35 | 20.91 | 8.54 | 8.65 | 54.52 |
| Netherlands | Horst aan de Maas | 7.12 | 14.40 | 8.91 | 22.68 | 6.74 | 59.85 |
| Greece | Komotini | 6.24 | 5.35 | 14.49 | 8.30 | 4.53 | 38.91 |
| Croatia | Grad Krizevci | 5.89 | 5.77 | 5.65 | 5.00 | 6.95 | 29.26 |
| Czech Republic | Litomerice | 6.75 | 10.44 | 0.81 | 21.13 | 7.39 | 46.52 |
| UK | G. Manchester | 7.23 | 6.87 | 19.93 | 10.95 | 6.70 | 51.68 |
| France | Metz | 7.61 | 8.95 | 8.07 | 18.98 | 6.91 | 50.51 |
| Romania | Mizil | 3.35 | 4.65 | 1.95 | 6.42 | 4.31 | 20.67 |
| Serbia | Nis | 3.34 | 5.42 | 2.87 | 11.51 | 4.85 | 27.99 |
| UK | Nottingham | 7.23 | 6.87 | 19.93 | 10.95 | 6.70 | 51.68 |
| Spain | Pamplona | 7.74 | 7.29 | 7.68 | 11.17 | 3.81 | 37.69 |
| UK | Plymouth | 7.23 | 6.87 | 19.93 | 10.95 | 6.70 | 51.68 |
| Croatia | Rijeka | 5.89 | 5.77 | 5.65 | 5.00 | 6.95 | 29.26 |
| Spain | San Sebastian | 7.74 | 7.29 | 7.68 | 11.17 | 3.81 | 37.69 |
| Finland | Tampere | 8.36 | 26.63 | 3.74 | 26.75 | 10.25 | 68.25 |
| Sweden | Vaxjo | 9.50 | 17.45 | 5.56 | 22.06 | 8.68 | 63.24 |
| Croatia | Velika Gorica | 5.89 | 5.77 | 5.65 | 5.00 | 6.95 | 29.26 |
| Austria | Vienna | 11.06 | 13.38 | 14.57 | 11.69 | 8.18 | 58.88 |
| Portugal | Vila Nova de Gaia | 6.49 | 7.47 | 9.02 | 7.89 | 3.05 | 33.91 |
| Bosnia and Herzegovina | Zenica | 3.46 | 3.45 | 1.31 | 12.38 | 3.04 | 21.02 |
References
- McGlade, C.; Ekins, P. The geographical distribution of fossil fuels unused when limiting global warming to 2 °C. Nature 2015, 517, 187–190. [Google Scholar] [CrossRef] [PubMed]
- Albuerne, Y.L.; Velez, N.R.B. Beneficios económicos y ambientales con la implementación de una red eléctrica inteligente. DYNA Energ. Sostenibilidad 2019, 8. [Google Scholar]
- Grayson, M. Energy transitions. Nature 2017, 551, S133. [Google Scholar] [CrossRef] [PubMed]
- Akizu, O.; Urkidi, L.; Bueno, G.; Lago, R.; Barcena, I. Tracing the emerging energy transitions in the Global North and the Global South. Int. J. Hydrog. Energy 2017, 42, 18045–18063. [Google Scholar] [CrossRef]
- Bridge, G.; Bouzarovski, S.; Bradshaw, M.; Eyre, N. Geographies of energy transition: Space, place and the low-carbon economy. Energy Policy 2013, 53, 331–340. [Google Scholar] [CrossRef]
- Burke, M.J.; Stephens, J.C. Energy democracy: Goals and policy instruments for sociotechnical transitions. Energy Res. Soc. Sci. 2017, 33, 35–48. [Google Scholar] [CrossRef]
- Van der Schoor, T.; van Lente, H.; Scholtens, B.; Peine, A. Challenging Obduracy: How Local Communities Transform the Energy System. Energy Res. Soc. Sci. 2016, 13, 94–105. [Google Scholar] [CrossRef]
- Creupelandt, D.; Vansintjan, D. Deliverable2.3. REScoop—Mobilizing European Citizens to Invest in Sustainable Energy. H2020-EE-2014-4-PDA- 649767. 2014. [Google Scholar]
- Vita, G.; Ivanova, D.; Dumitru, A.; García-Mira, R.; Carrus, G.; Stadler, K.; Hertwich, E.G. Happier with less? Members of European environmental grassroots initiatives reconcile lower carbon footprints with higher life satisfaction and income increases. Energy Res. Soc. Sci. 2020, 60, 101329. [Google Scholar] [CrossRef] [Green Version]
- Arto, I.; Capellán-Pérez, I.; Lago, R.; Bueno, G.; Bermejo, R. The energy requirements of a developed world. Energy Sustain. Dev. 2016, 33, 1–13. [Google Scholar] [CrossRef] [Green Version]
- Akizu-Gardoki, O.; Bueno, G.; Wiedmann, T.; Lopez-Guede, J.M.; Arto, I.; Hernandez, P.; Moran, D. Decoupling between human development and energy consumption within footprint accounts. J. Clean. Prod. 2018, 202, 1145–1157. [Google Scholar] [CrossRef]
- Akenji, L. Consumer scapegoatism and limits to green consumerism. J. Clean. Prod. 2014, 63, 13–23. [Google Scholar] [CrossRef]
- Grabs, J.; Langen, N.; Maschkowski, G.; Schäpke, N. Understanding role models for change: A multilevel analysis of success factors of grassroots initiatives for sustainable consumption. J. Clean. Prod. 2016, 134, 98–111. [Google Scholar] [CrossRef]
- Kooij, H.J.; Oteman, M.; Veenman, S.; Sperling, K.; Magnusson, D.; Palm, J.; Hvelplund, F. Between grassroots and treetops: Community power and institutional dependence in the renewable energy sector in Denmark, Sweden and the Netherlands. Energy Res. Soc. Sci. 2018, 37, 52–64. [Google Scholar] [CrossRef]
- U.N. Publications (Ed.) Sustainable Development Goals Report 2016; United Nations: New York, NY, USA, 2016. [Google Scholar]
- Sperling, K.; Hvelplund, F.; Mathiesen, B.V. Centralisation and decentralisation in strategic municipal energy planning in Denmark. Energy Policy 2011, 39, 1338–1351. [Google Scholar] [CrossRef]
- Pirgmaier, E.; Steinberger, J.K. Roots, Riots, and Radical Change—A Road Less Travelled for Ecological Economics. Sustainability 2019, 11, 2001. [Google Scholar] [CrossRef] [Green Version]
- Zúñiga, A.R.; Eguino, M.G.; Arto, I. decarbonisation of the public administration by the electrification of urban buses. case study the city of vitoria. DYNA 2019, 94, 632–635. [Google Scholar]
- Comodi, G.; Cioccolanti, L.; Polonara, F.; Brandoni, C. Local authorities in the context of energy and climate policy. Energy Policy 2012, 51, 737–748. [Google Scholar] [CrossRef]
- Emelianoff, C. Local Energy Transition and Multilevel Climate Governance: The Contrasted Experiences of Two Pioneer Cities (Hannover, Germany, and Växjö, Sweden). Urban Stud. 2014, 51, 1378–1393. [Google Scholar] [CrossRef]
- mPOWER—Municipal Power. Available online: https://municipalpower.org/ (accessed on 19 December 2019).
- Tagliapietra, S.; Zachmann, G.; Edenhofer, O.; Glachant, J.-M.; Linares, P.; Loeschel, A. The European union energy transition: Key priorities for the next five years. Energy Policy 2019, 132, 950–954. [Google Scholar] [CrossRef] [Green Version]
- Joas, F.; Pahle, M.; Flachsland, C.; Joas, A. Which goals are driving the Energiewende? Making sense of the German Energy Transformation. Energy Policy 2016, 95, 42–51. [Google Scholar] [CrossRef]
- International Energy Agency. World Energy Balances 2017; International Energy Agency: Paris, France, 2019. [Google Scholar]
- Fanning, A.L.; O’Neill, D.W. The Wellbeing–Consumption paradox: Happiness, health, income, and carbon emissions in growing versus non-growing economies. J. Clean. Prod. 2019, 212, 810–821. [Google Scholar] [CrossRef]
- Mediavilla, M.; Miguel, L.J.; de Castro, C. Un modelo marco para la transición energética. In Proceedings of the 9th International Conference of the European Society of Ecological Economics, Istanbul, Turkey, 14–17 July 2011. [Google Scholar]
- Rao, N.D.; van Ruijven, B.J.; Riahi, K.; Bosetti, V. Improving poverty and inequality modelling in climate research. Nat. Clim. Chang. 2017, 7, 857–862. [Google Scholar] [CrossRef] [Green Version]
- Murakami, K.; Kaneko, S.; Dhakal, S.; Sharifi, A. Changes in per capita CO2 emissions of six large Japanese cities between 1980 and 2000: An analysis using ‘The Four System Boundaries’ approach. Sustain. Cities Soc. 2020, 52, 101784. [Google Scholar] [CrossRef]
- Van den Dobbelsteen, A.; Roggema, R.; Tillie, N.; Broersma, S.; Fremouw, M.; Martin, C.L. 4.6—Urban Energy Masterplanning—Approaches, Strategies, and Methods for the Energy Transition in Cities. In Urban Energy Transition, 2nd ed.; Droege, P., Ed.; Elsevier: Amsterdam, The Netherlands, 2018; pp. 635–660. [Google Scholar]
- Stulz, R.; Tanner, S.; Sigg, R. Chapter 16—Swiss 2000-Watt Society: A Sustainable Energy Vision for the Future. In Energy, Sustainability and the Environment; Sioshansi, F.P., Ed.; Butterworth-Heinemann: Boston, MA, USA, 2011; pp. 477–496. [Google Scholar]
- European Commission. Proposal for a Regulation of the European Parliament and of the Council on the Governance of the Energy Union, Amending Directive 94/22/EC, Directive 98/70/EC, Directive 2009/31/EC, Regulation (EC) No 663/2009, Regulation (EC) No 715/2009, Directive 2009/73/EC, Council Directive 2009/119/EC, Directive 2010/31/EU, Directive 2012/27/EU, Directive 2013/30/EU and Council Directive (EU) 2015/652 and RepealingRegulation (EU) No 525/2013: COM (2016) 759; European Commission: Brussels, Belgium, 2016. [Google Scholar]
- Veum, K.; Bauknecht, D. How to reach the EU renewables target by 2030? An analysis of the governance framework. Energy Policy 2019, 127, 299–307. [Google Scholar] [CrossRef]
- Akerboom, S.; Botzen, W.; Buijze, A.; Michels, A.; van Rijswick, M. Meeting goals of sustainability policy: CO2 emission reduction, cost-effectiveness and societal acceptance. An analysis of the proposal to phase-out coal in the Netherlands. Energy Policy 2020, 138, 111210. [Google Scholar] [CrossRef]
- Chang, K. Emissions reduction targets and wealth distribution effects through interprovincial emissions trading scheme in China. Energy Procedia 2019, 159, 539–544. [Google Scholar] [CrossRef]
- EEA. European Energy Award Gold Municipalities – eea. 2020. Available online: https://www.european-energy-award.org/european-energy-award-gold-municipalities (accessed on 18 February 2020).
- Covenant of Mayors. Available online: https://www.covenantofmayors.eu/ (accessed on 19 December 2019).
- Taylor, N.G.; Szbó, S.; Kona, A.; Ossenbrink, H. Deployment Pathways for Photovoltaics in the EU Towards 2020: Comparing Economic Factors with Policies at Municipal Level. 31st Eur. Photovolt. Sol. Energy Conf. Exhib. 2015, 3034–3041. [Google Scholar] [CrossRef]
- Donnerer, D.; Boyer, F. National Energy and Climate Plans. Energy Cities 2019. Available online: https://energy-cities.eu/publication/national-energy-and-climate-plans-fail-to-acknowledge-cities-leading-role-in-the-european-energy-transition/ (accessed on 14 November 2019).
- European Union. The European Green Deal Sets Out how to Make Europe the First Climate-Neutral Continent by 2050. EEAS—European External Action Service—European Commission. Available online: https://eeas.europa.eu/headquarters/headquarters-homepage/71922/european-green-deal-sets-out-how-make-europe-first-climate-neutral-continent-2050_ro (accessed on 19 December 2019).
- Nieto, J.; Carpintero, Ó.; Miguel, L.J.; de Blas, I. Macroeconomic modelling under energy constraints: Global low carbon transition scenarios. Energy Policy 2019, 111090. [Google Scholar] [CrossRef] [Green Version]
- Bekebrede, G.; van Bueren, E.; Wenzler, I. Towards a Joint Local Energy Transition Process in Urban Districts: The GO2Zero Simulation Game. Sustainability 2018, 10, 2602. [Google Scholar] [CrossRef] [Green Version]
- European Commission H2020. Municipal Action, Public Engagement and Routes TowardsEnergy Transition | mPOWER Project | CORDIS. 2018. Available online: https://cordis.europa.eu/project/rcn/213584/factsheet/en (accessed on 21 November 2019).
- Energy Cities. We Are the European City Network that Defends a Locally Driven Energy Transition. Energy Cities 2019. Available online: https://energy-cities.eu/ (accessed on 11 February 2020).
- Neill, S.P.; Hashemi, M.R. Fundamentals of Ocean Renewable Energy; Elsevier: Amsterdam, The Netherlands, 2018. [Google Scholar]
- IPCC. IPCC—Task Force on National Greenhouse Gas Inventories; Institute for Global Environmental Strategies (IGES): Hayama, Japan, 2006. [Google Scholar]
- Steinberger, J.K.; Roberts, J.T. From constraint to sufficiency: The decoupling of energy and carbon from human needs, 1975–2005. Ecol. Econ. 2010, 70, 425–433. [Google Scholar] [CrossRef]
- Gemeente Horst aan de Maas. Available online: https://www.horstaandemaas.nl/ (accessed on 19 December 2019).
- Cazcarro, I.; Amores, A.F.; Arto, I.; Kratena, K. Bridge matrices for feeding macroeconomic models with consumption survey’s profiles for the EU28 countries. In Proceedings of the 27th International Input-Output Conference (IIOA) Conference, Glasgow, Scotland, 30 June–5 July 2019. [Google Scholar]
- Akizu-Gardoki, O.; Villamor, E.; Bueno, G.; Heinonen, J.; Lopez-Guede, J.M. Measuring energy footprint in bottom-up energy transitions in the Basque Country. In Proceedings of the 27th IIOA Conference, Glasgow, Scotland, 30 June–5 July 2019. [Google Scholar]
- UNDP. Trends in the Human Development Index, 1990-2015. 2015. Available online: http://hdr.undp.org/en/composite/trends (accessed on 11 January 2020).
- World Bank. World Bank National Accounts. GDP Per Capita (Current US$); World Bank: Washington, DC, USA, 2019. [Google Scholar]
- D’Amico, A.; Ciulla, G.; Panno, D.; Ferrari, S. Building energy demand assessment through heating degree days: The importance of a climatic dataset. Appl. Energy 2019, 242, 1285–1306. [Google Scholar] [CrossRef]
- Prag, A.; Röttgers, D.; Scherrer, I. State-Owned Enterprises and the Low-Carbon Transition; International Energy Agency: Paris, France, 2018. [Google Scholar]
- EHAA. 4/2019 LEGEA, Otsailaren 21ekoa, Euskal Autonomia Erkidegoko Jasangarritasun Energetikoari Buruzkoa; EHAA: Basque Country, Spain, 2019; p. 1087. [Google Scholar]
- Kunze, C.; Becker, S. Collective ownership in renewable energy and opportunities for sustainable degrowth. Sustain. Sci. 2015, 10, 425–437. [Google Scholar] [CrossRef]
- Capellán-Pérez, I.; Campos-Celador, Á.; Terés-Zubiaga, J. Renewable Energy Cooperatives as an instrument towards the energy transition in Spain. Energy Policy 2018, 123, 215–229. [Google Scholar] [CrossRef]
- Eichermüller, J.; Furlan, M.; Habersbrunner, K.; Kordić, Z.; Furlan, M.; Habersbrunner, K. Potential of Energy Cooperatives to Meet Emission Targets and Supply Society with Affordable, Safe and Renewable Energy and Gender-Sensitive Participation Opportunities; Women Engage for a Common Future: Utrecht, The Netherlands, 2017. [Google Scholar]
- Lenzen, M.; Murray, J.; Sack, F.; Wiedmann, T. Shared producer and consumer responsibility — Theory and practice. Ecol. Econ. 2007, 61, 27–42. [Google Scholar] [CrossRef]


| Indicator | Impact | Target | Description | Unit | Where |
|---|---|---|---|---|---|
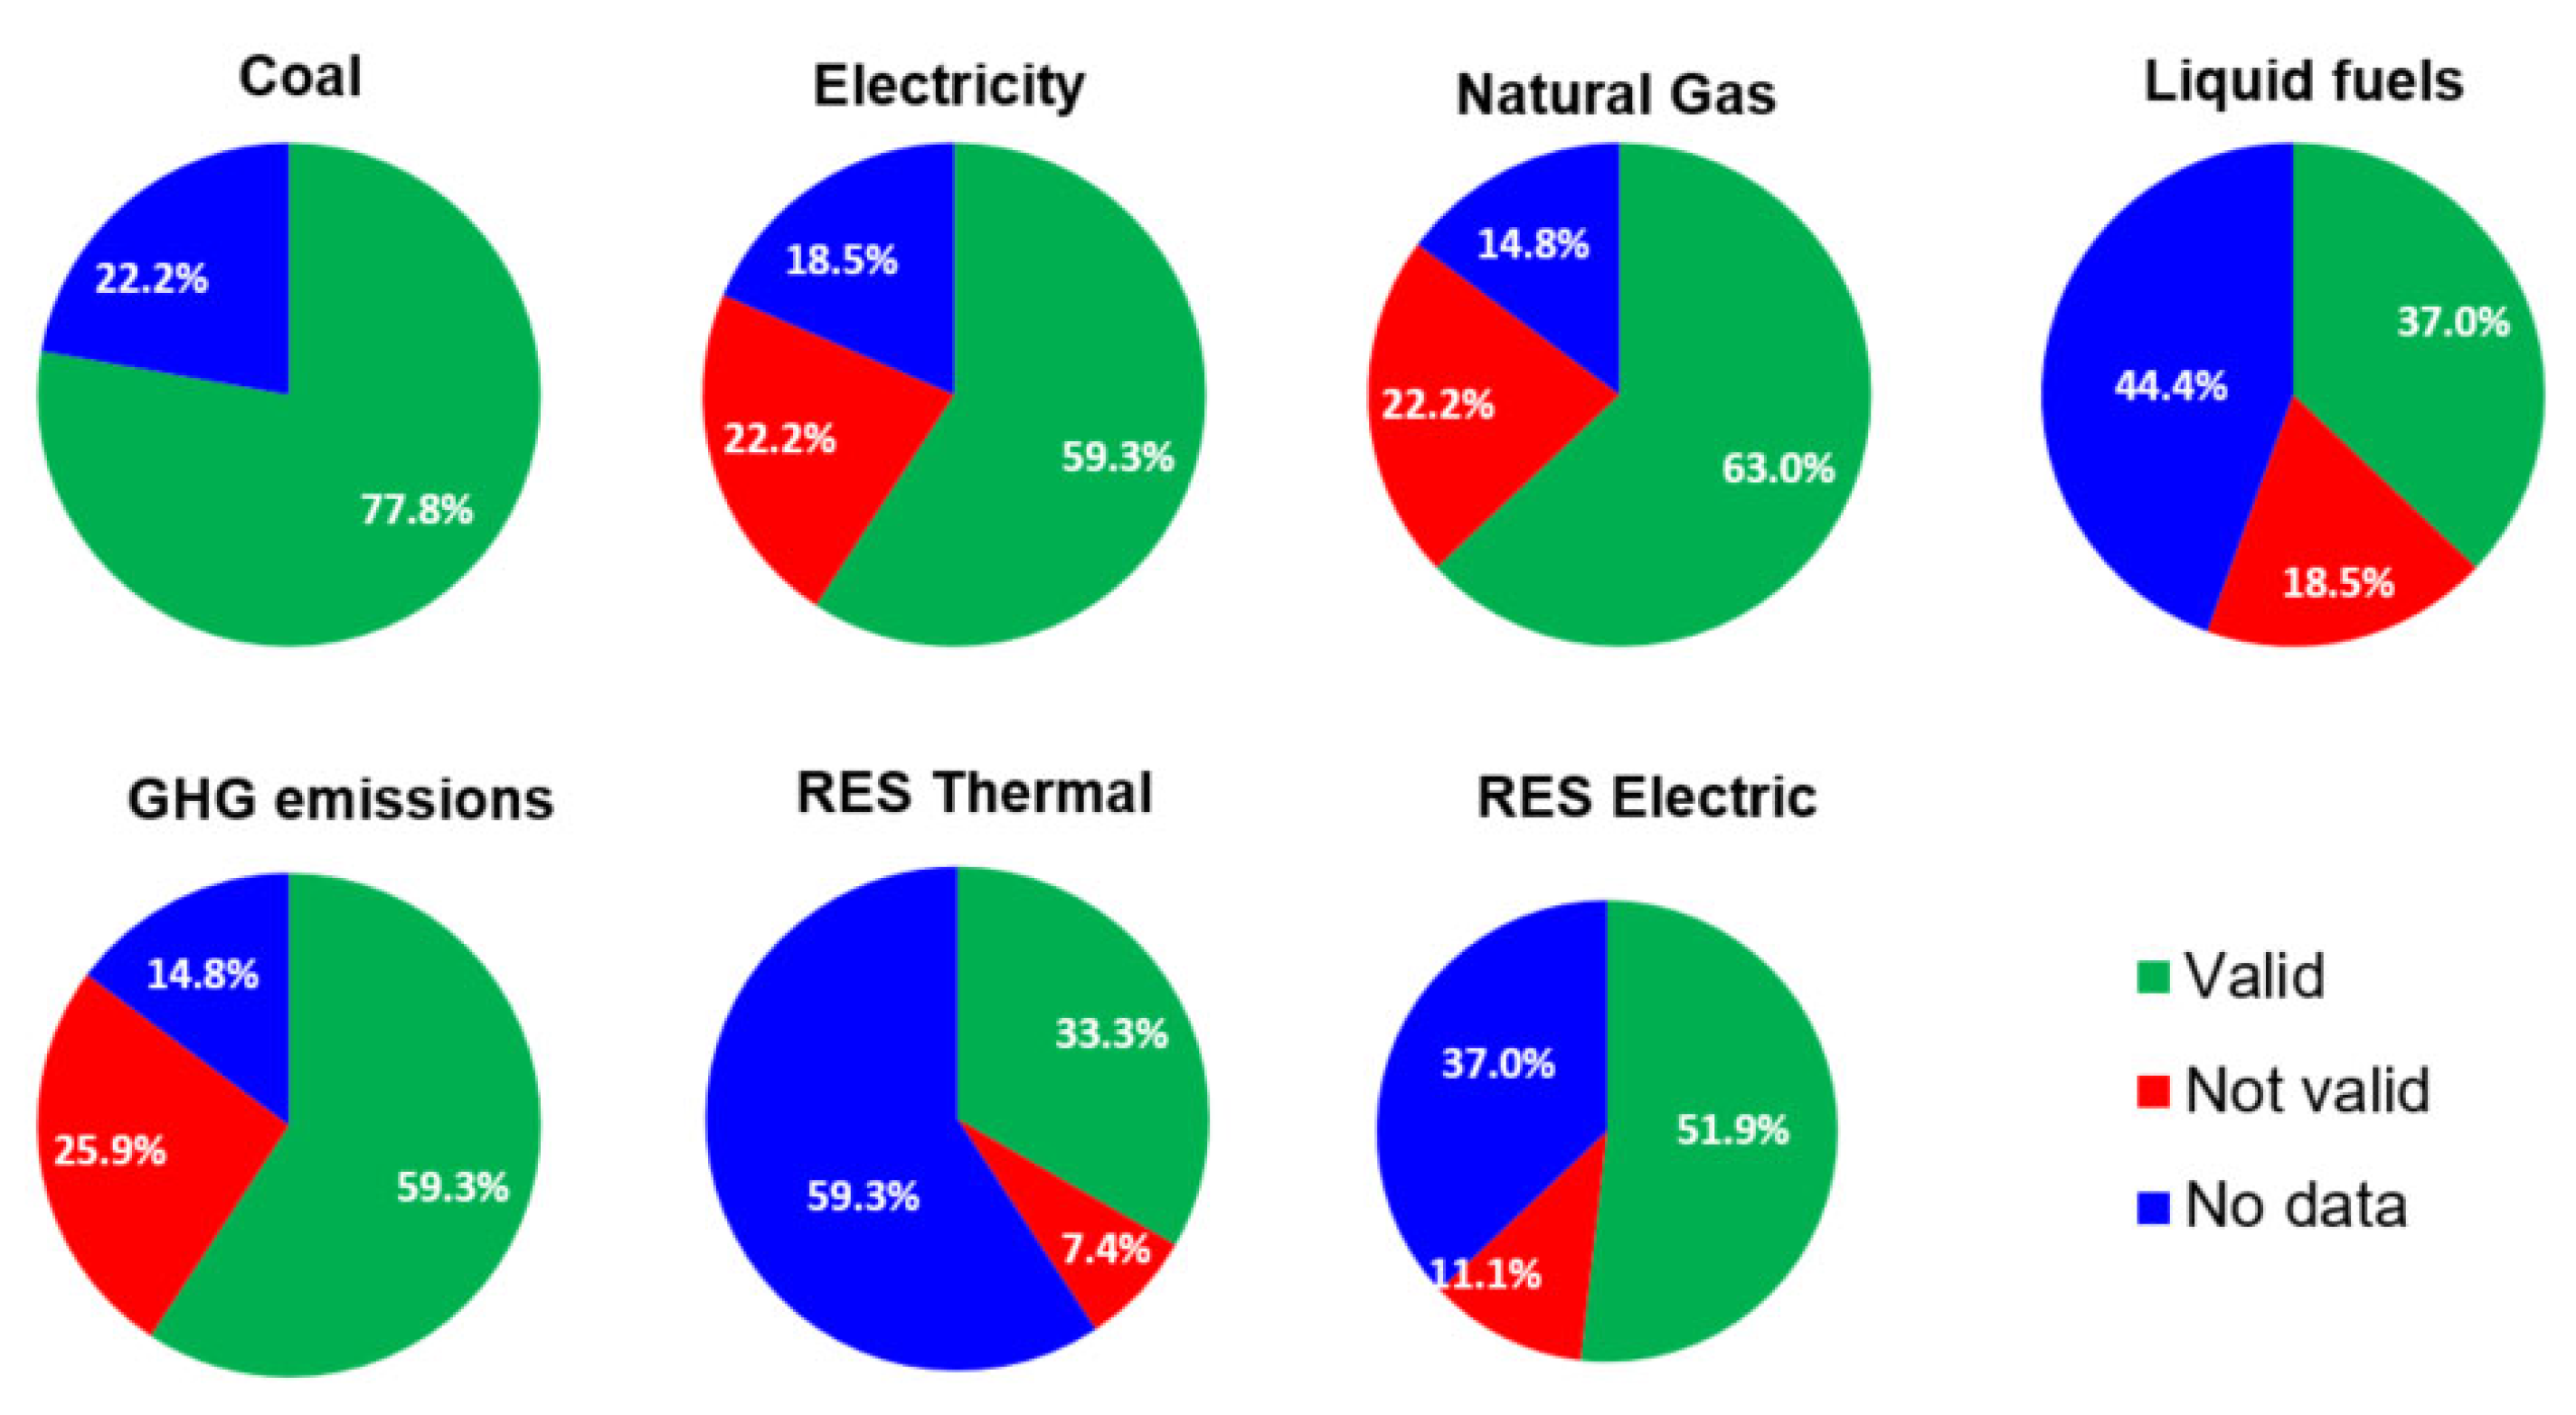
| Validity of the gathered data | 3 | Energy democratisation | Indicates the level of knowledge of public energy employees on municipal energy issues. | % | Figure 2 |
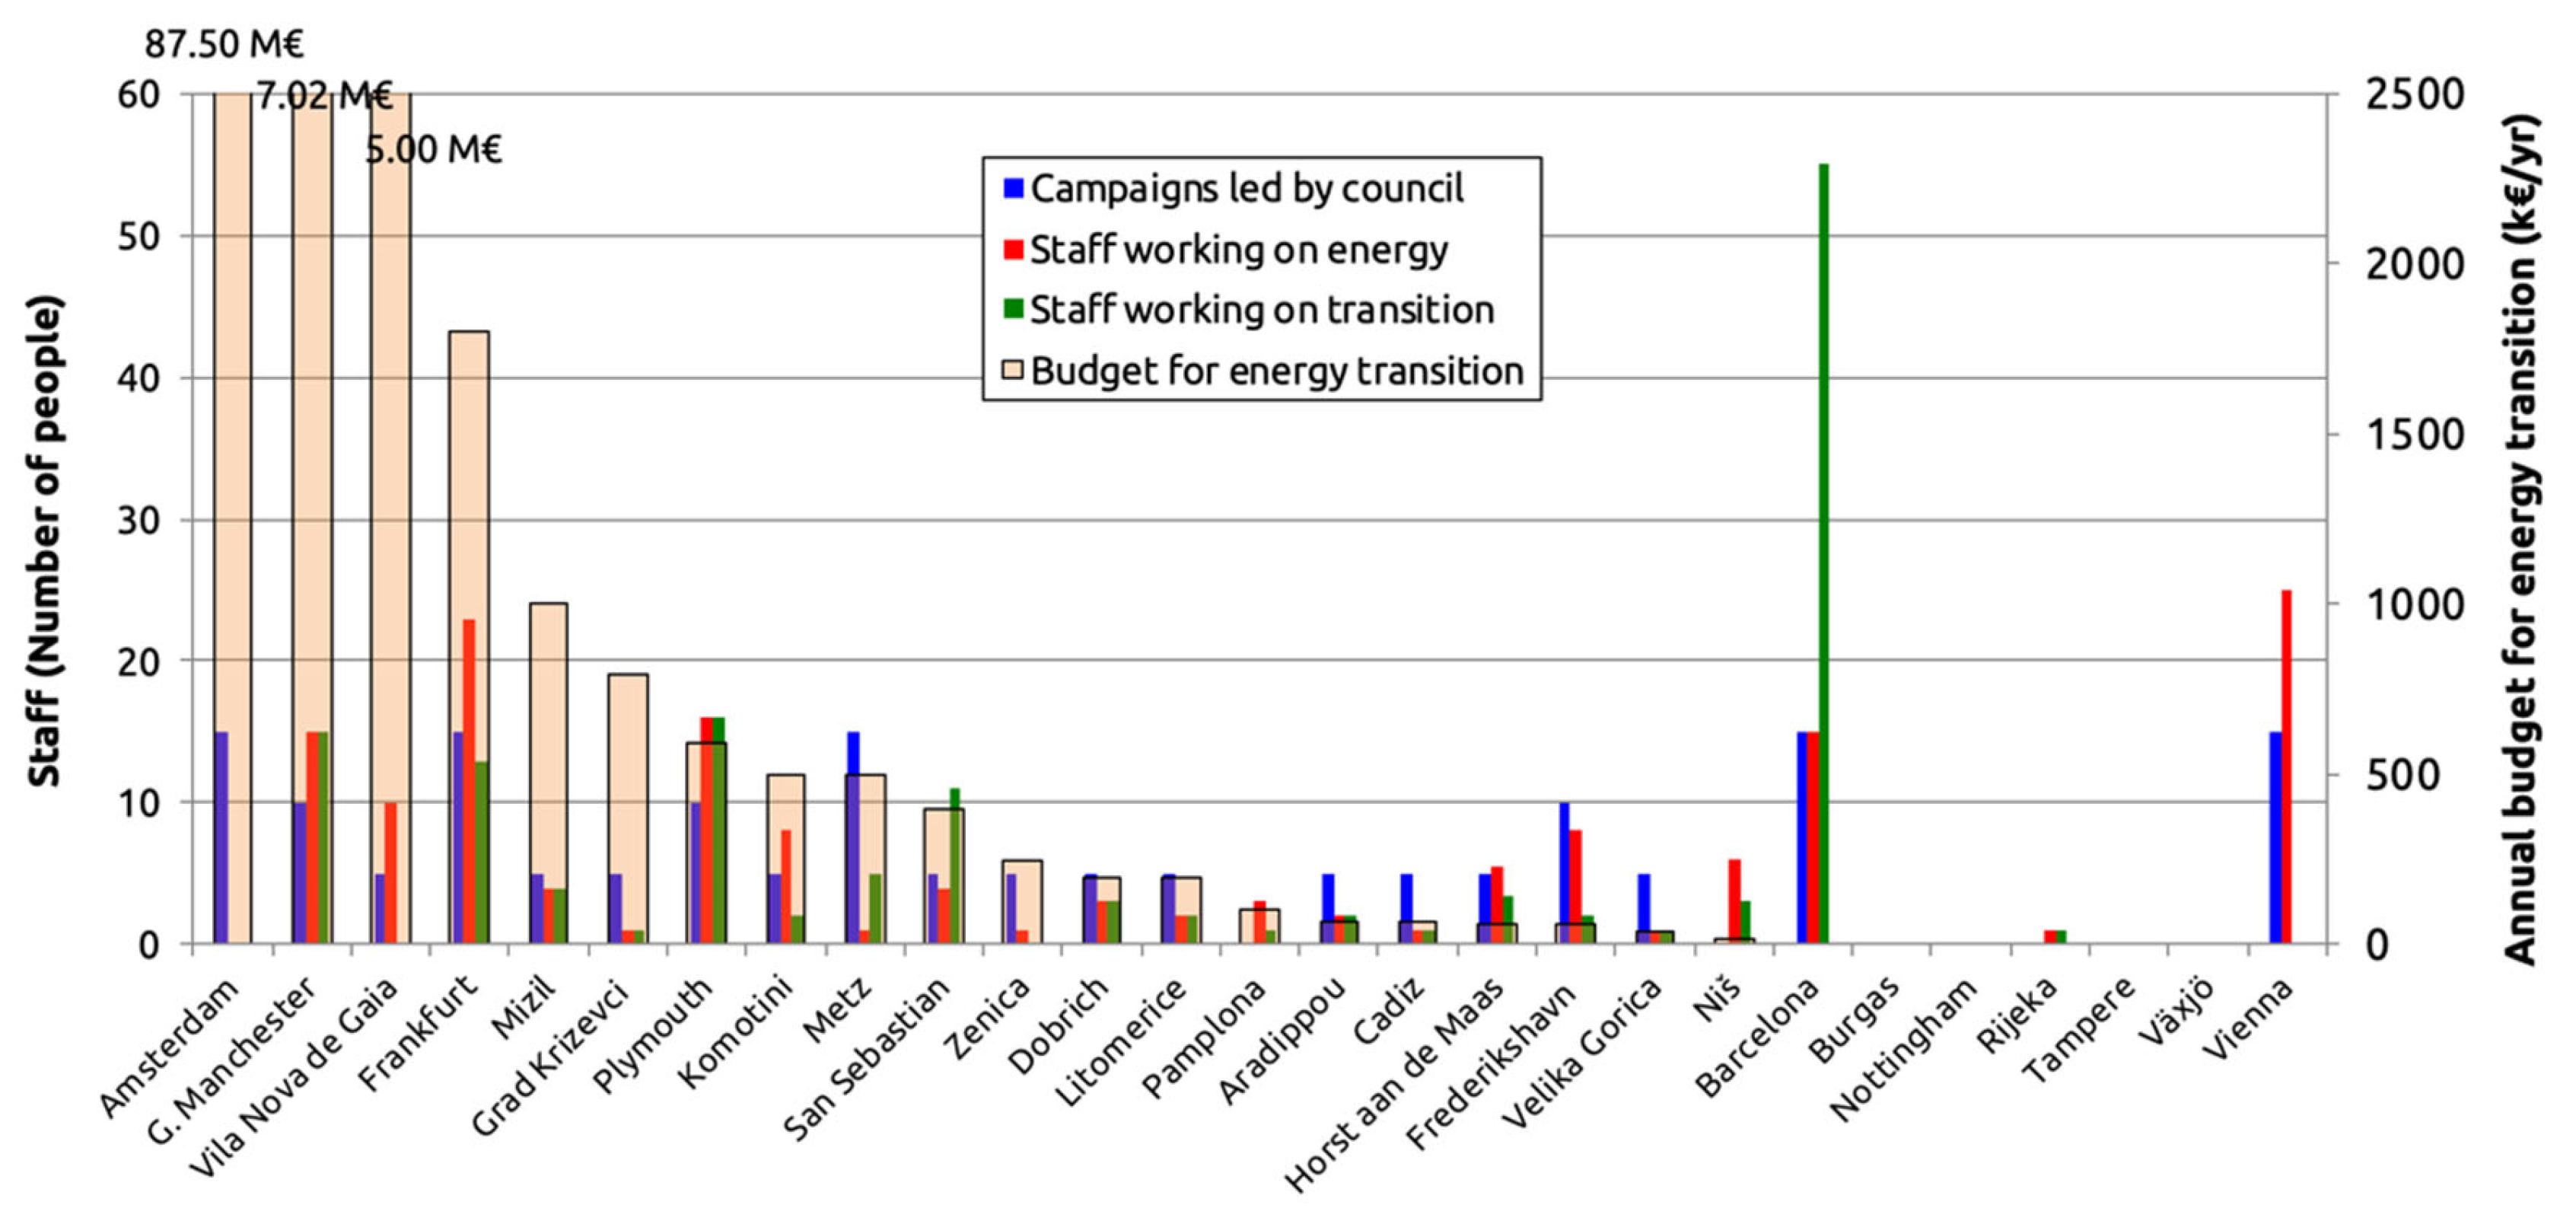
| Municipal campaigns | 4 | Energy democratisation | Indicates the number of campaigns that city has create in order to boost energy transitions. | No. · yr−1 | Figure 4 Table A3 |
| Staff on energy | 3,4 | Energy democratisation | Indicates the human capacity of the cities in energy transition field. | No. · yr−1 | Figure 4 Table A3 |
| Staff on transition | 3,4 | Energy democratisation | Indicates the human capacity of cities in ecological transition field. | No. · yr−1 | Figure 4 Table A3 |
| Budget for transition | 1,2,3,4 | Energy democratisation | Amount of public resources dedicated to boost the energy transition: increase efficiency, increase RES or increase participation. | € · yr−1 | Figure 4 Table A3 |
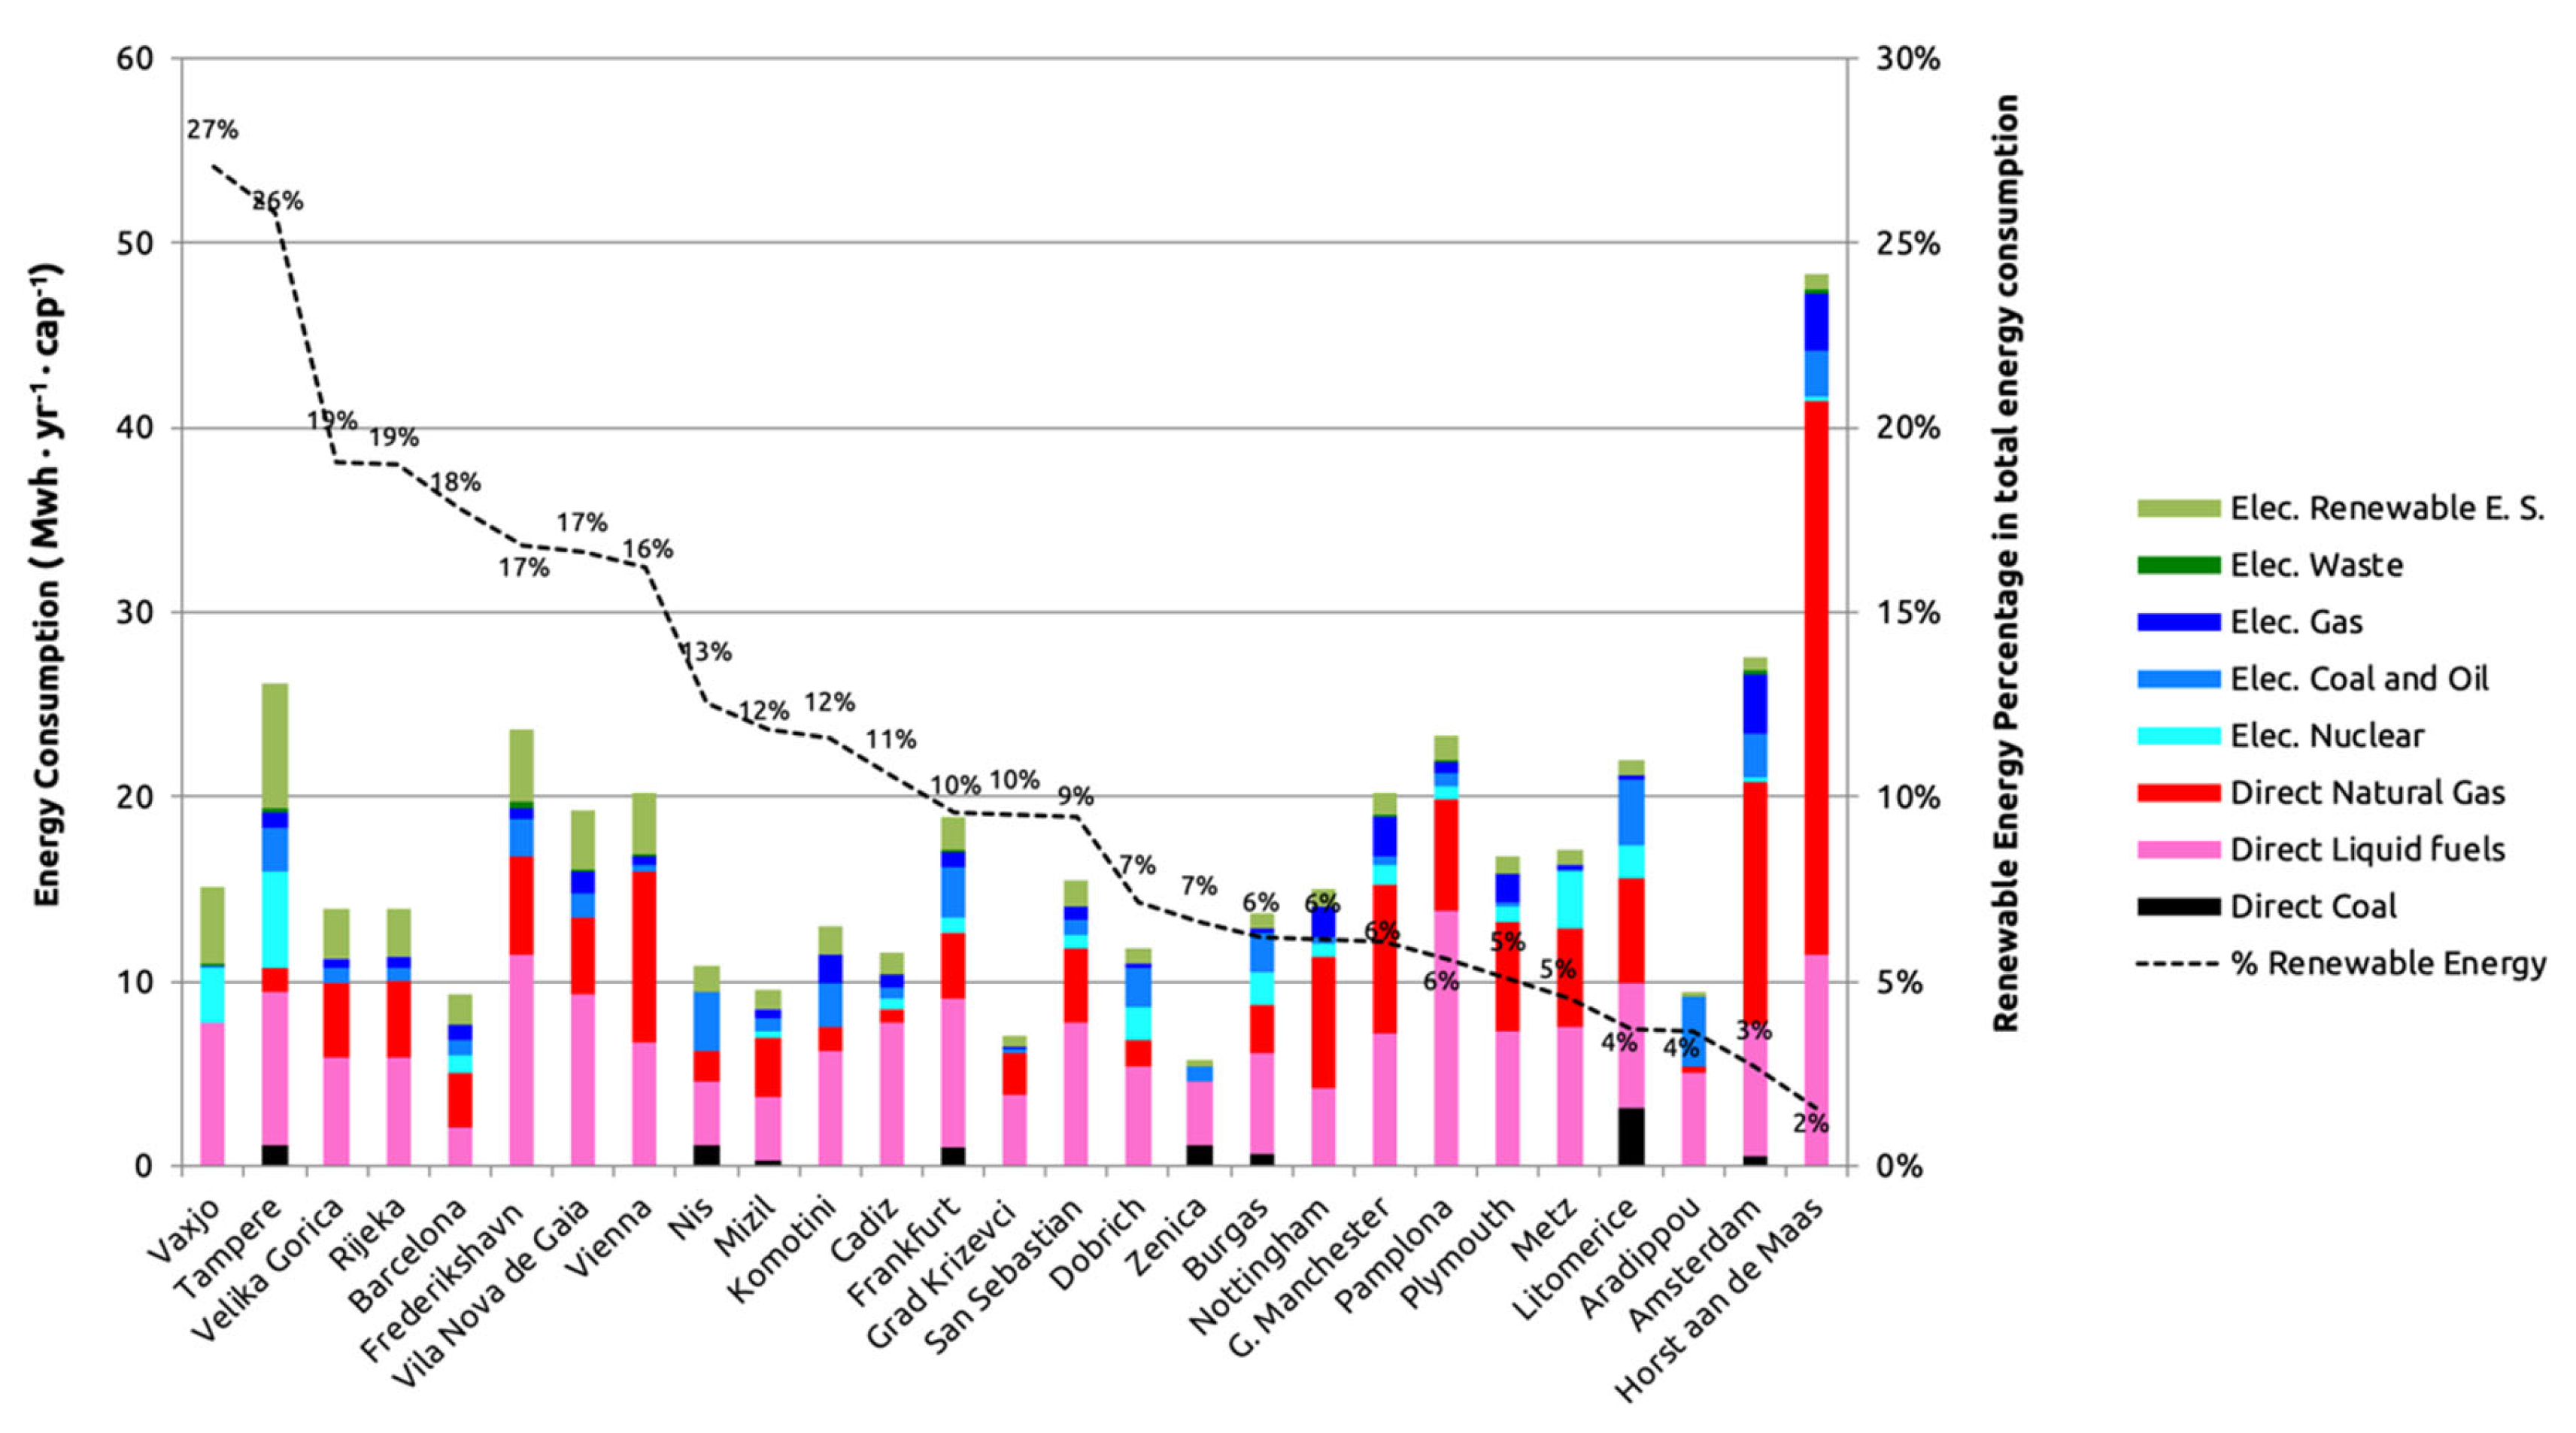
| RES percentage | 2 | Increase of renewable share | RES percentage of the total mapped energy consumption by taking into account the national electricity mix. | % | Figure 5 |
| Installed RES | 2 | Increase of renewable share | Total RES installation of the whole municipality. | MW | Table A2 |
| RES production | 2 | Increase of renewable share | Annual RES production of the whole municipality. | MWh∙yr−1 | Table A2 |
| Plans for RES investment | 2 | Increase of renewable share | A measure of the increase of RES, by comparing the plans to the actual installed | MW for 2020 | Table A3 |
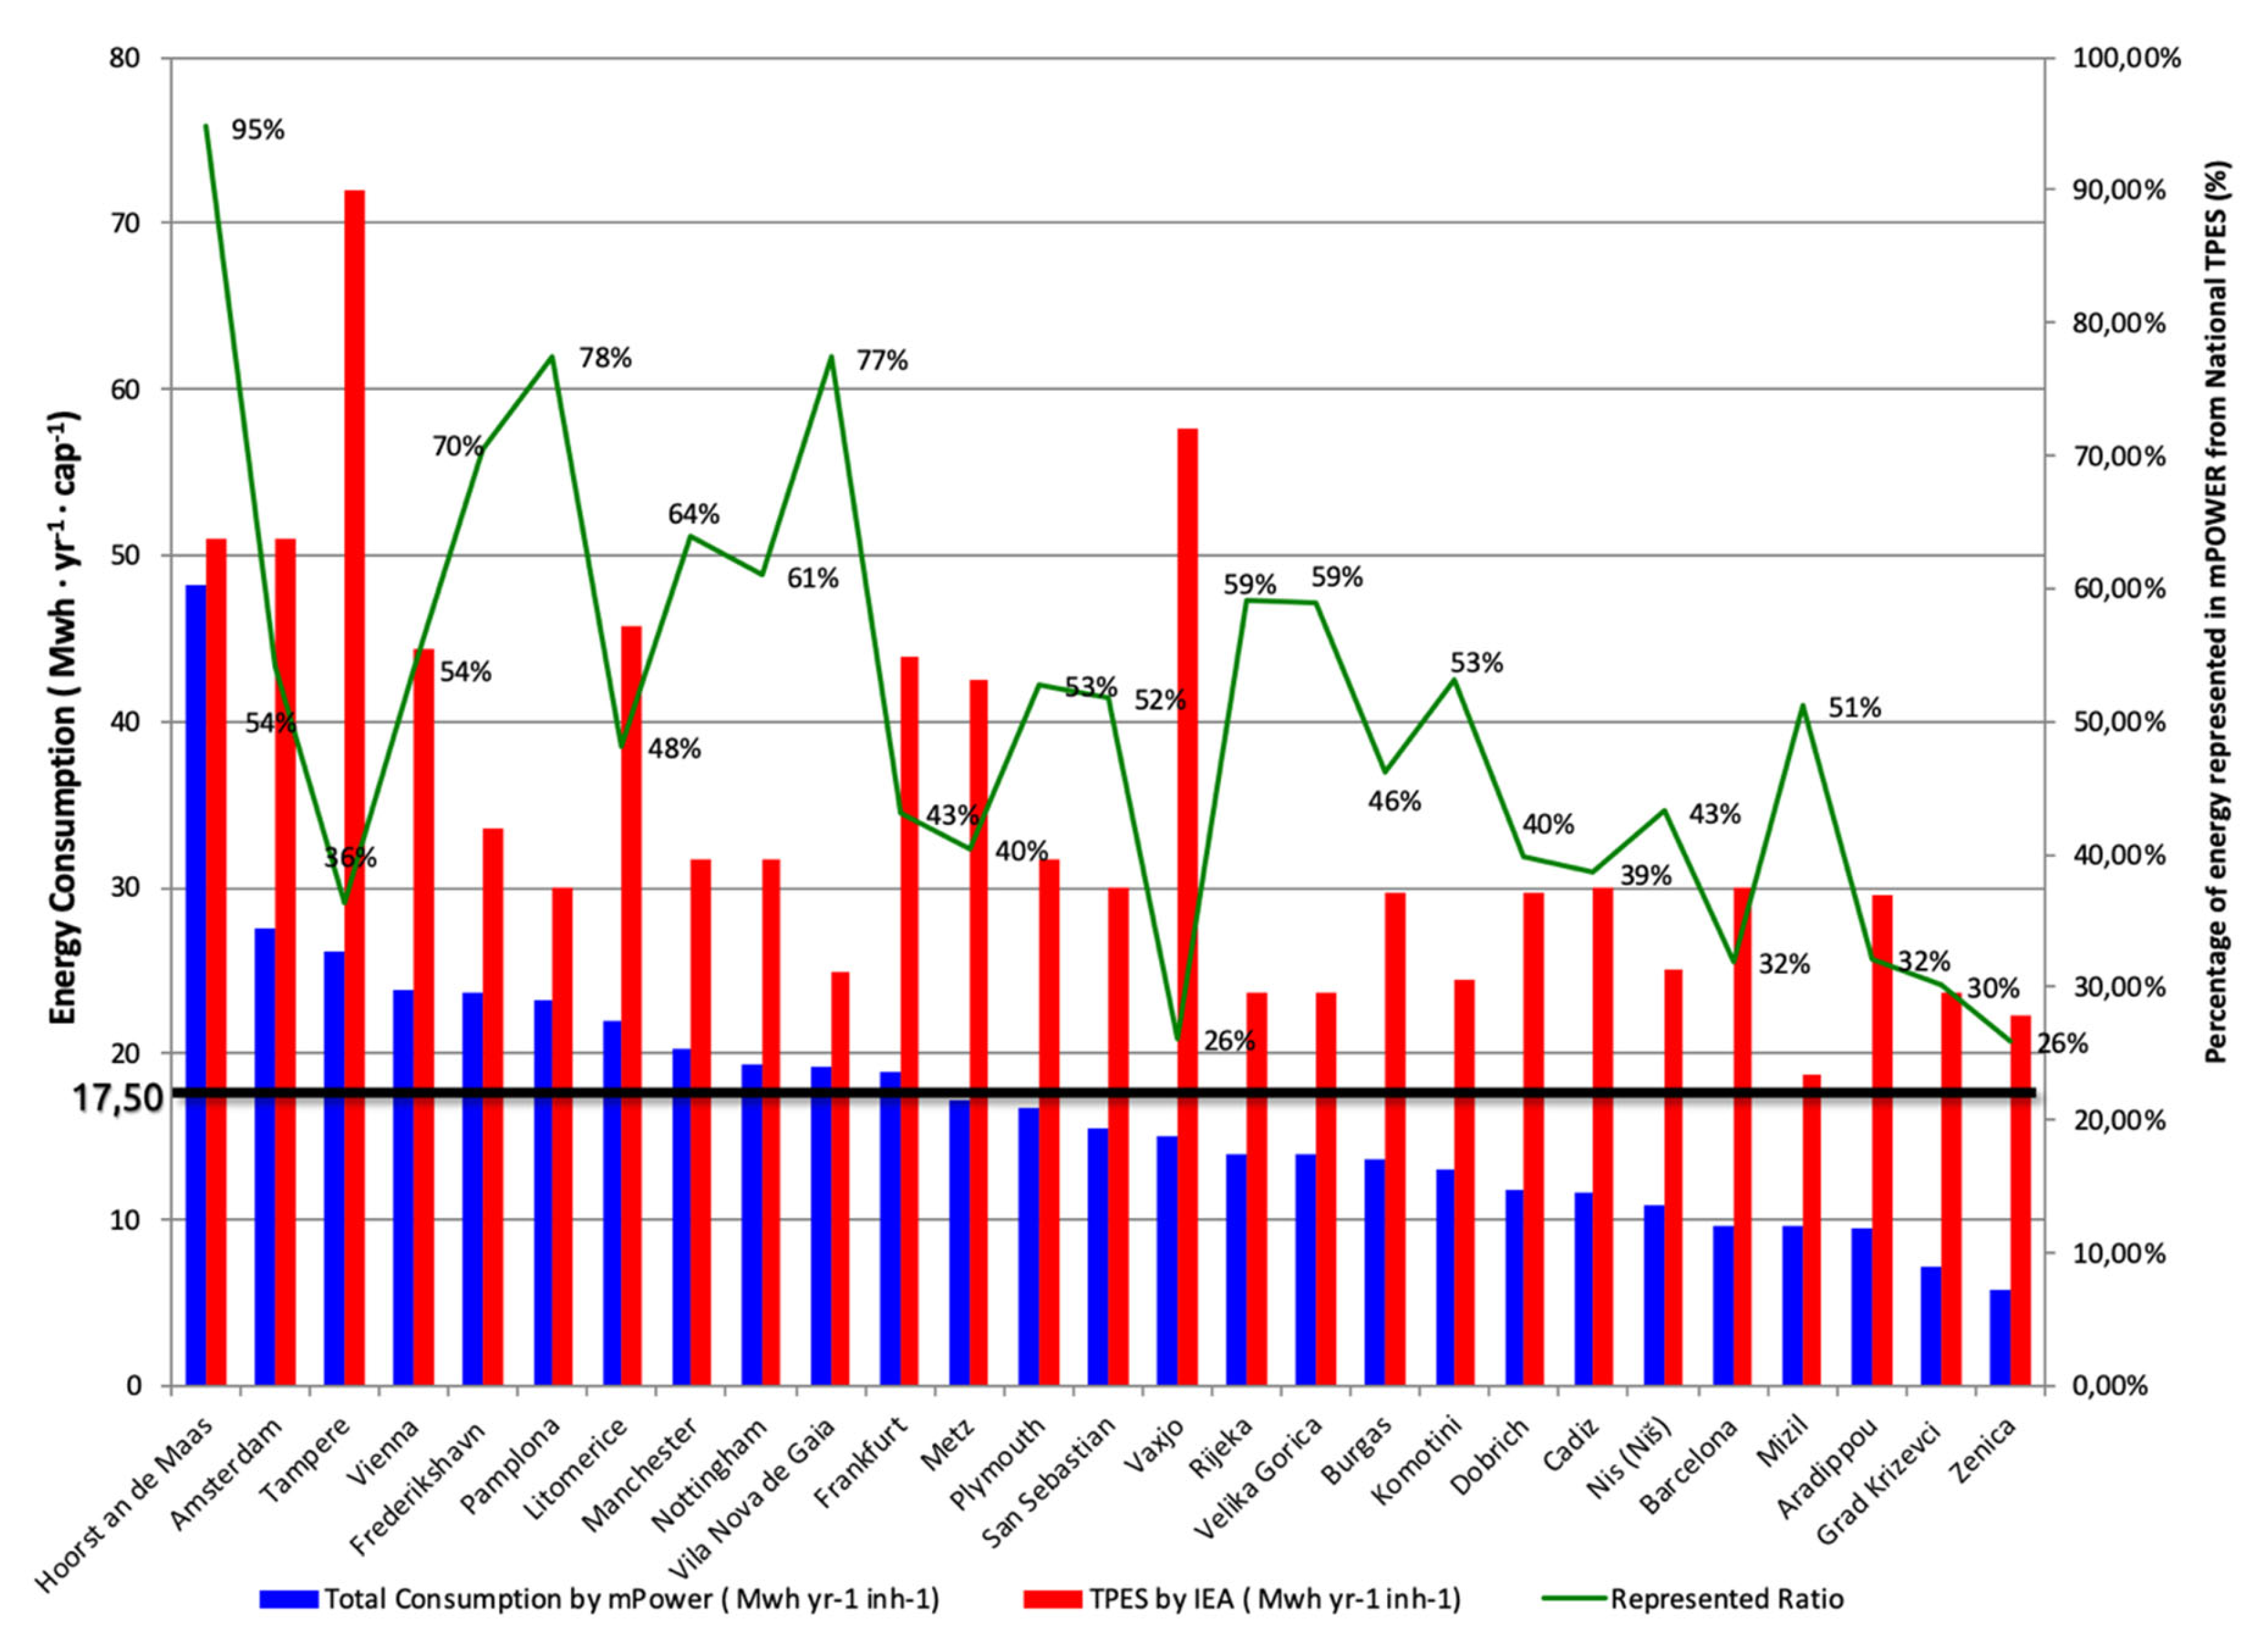
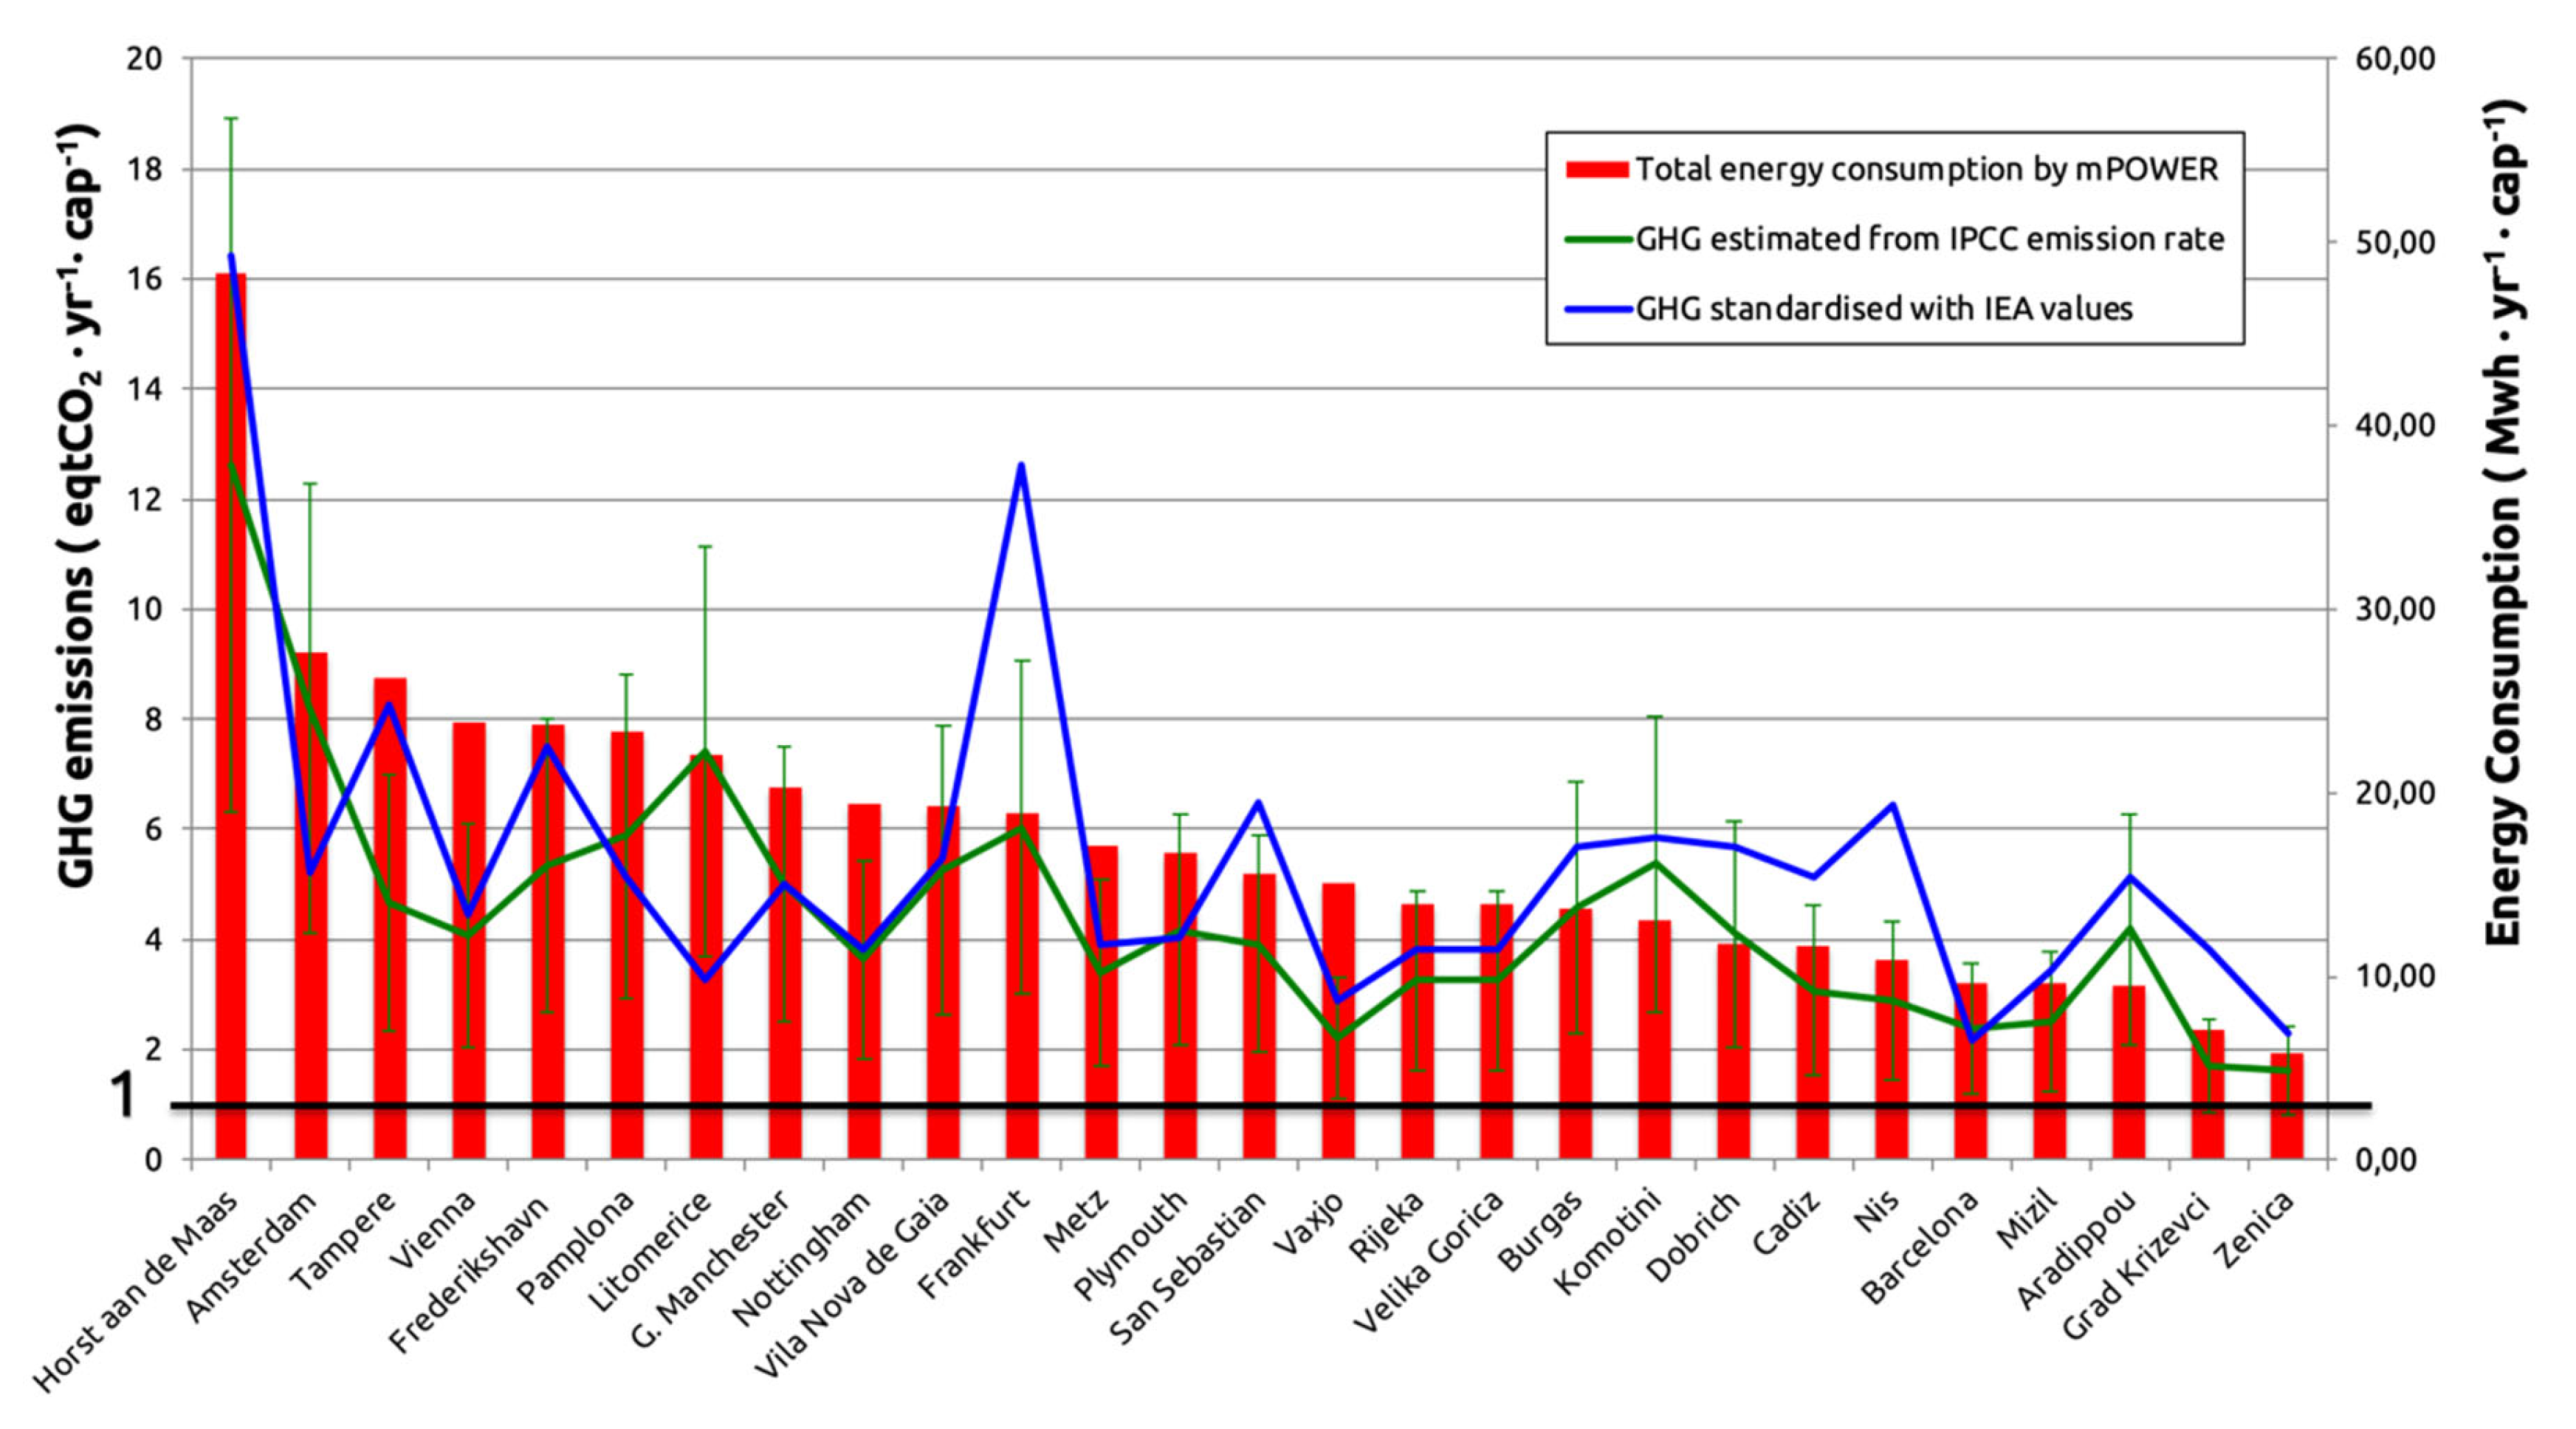
| Total energy consumption | 1 | Reduction of energy consumption | Total consumption of the municipality that mPOWER was able to map. | MWh∙yr−1∙cap−1 | Figure 3, Figure 5 and Figure 7 Table A2 |
| Total Primary Energy Supply | 1 | Reduction of energy consumption | Total average national energy consumption. | MWh∙yr−1∙cap−1 | Figure 6 |
| Total Primary Energy Footprint | 1 | Reduction of energy consumption | Total average national energy consumption, including energy embodied in imported/exported goods and services. | MWh∙yr−1∙cap−1 | Figure 6 |
| Hidden Energy Flows (HEF) | 1 | Reduction of energy consumption | Percentage energy embodied in imported/exported goods and services (HEF = TPEF/TPES). | (%) | Figure 6 Table A4 |
| GHG emissions | 1 | Increase of renewable share | Total GHG emissions of the municipality. | eqtCO2∙yr−1∙cap−1 | Figure 7 Table A2 |
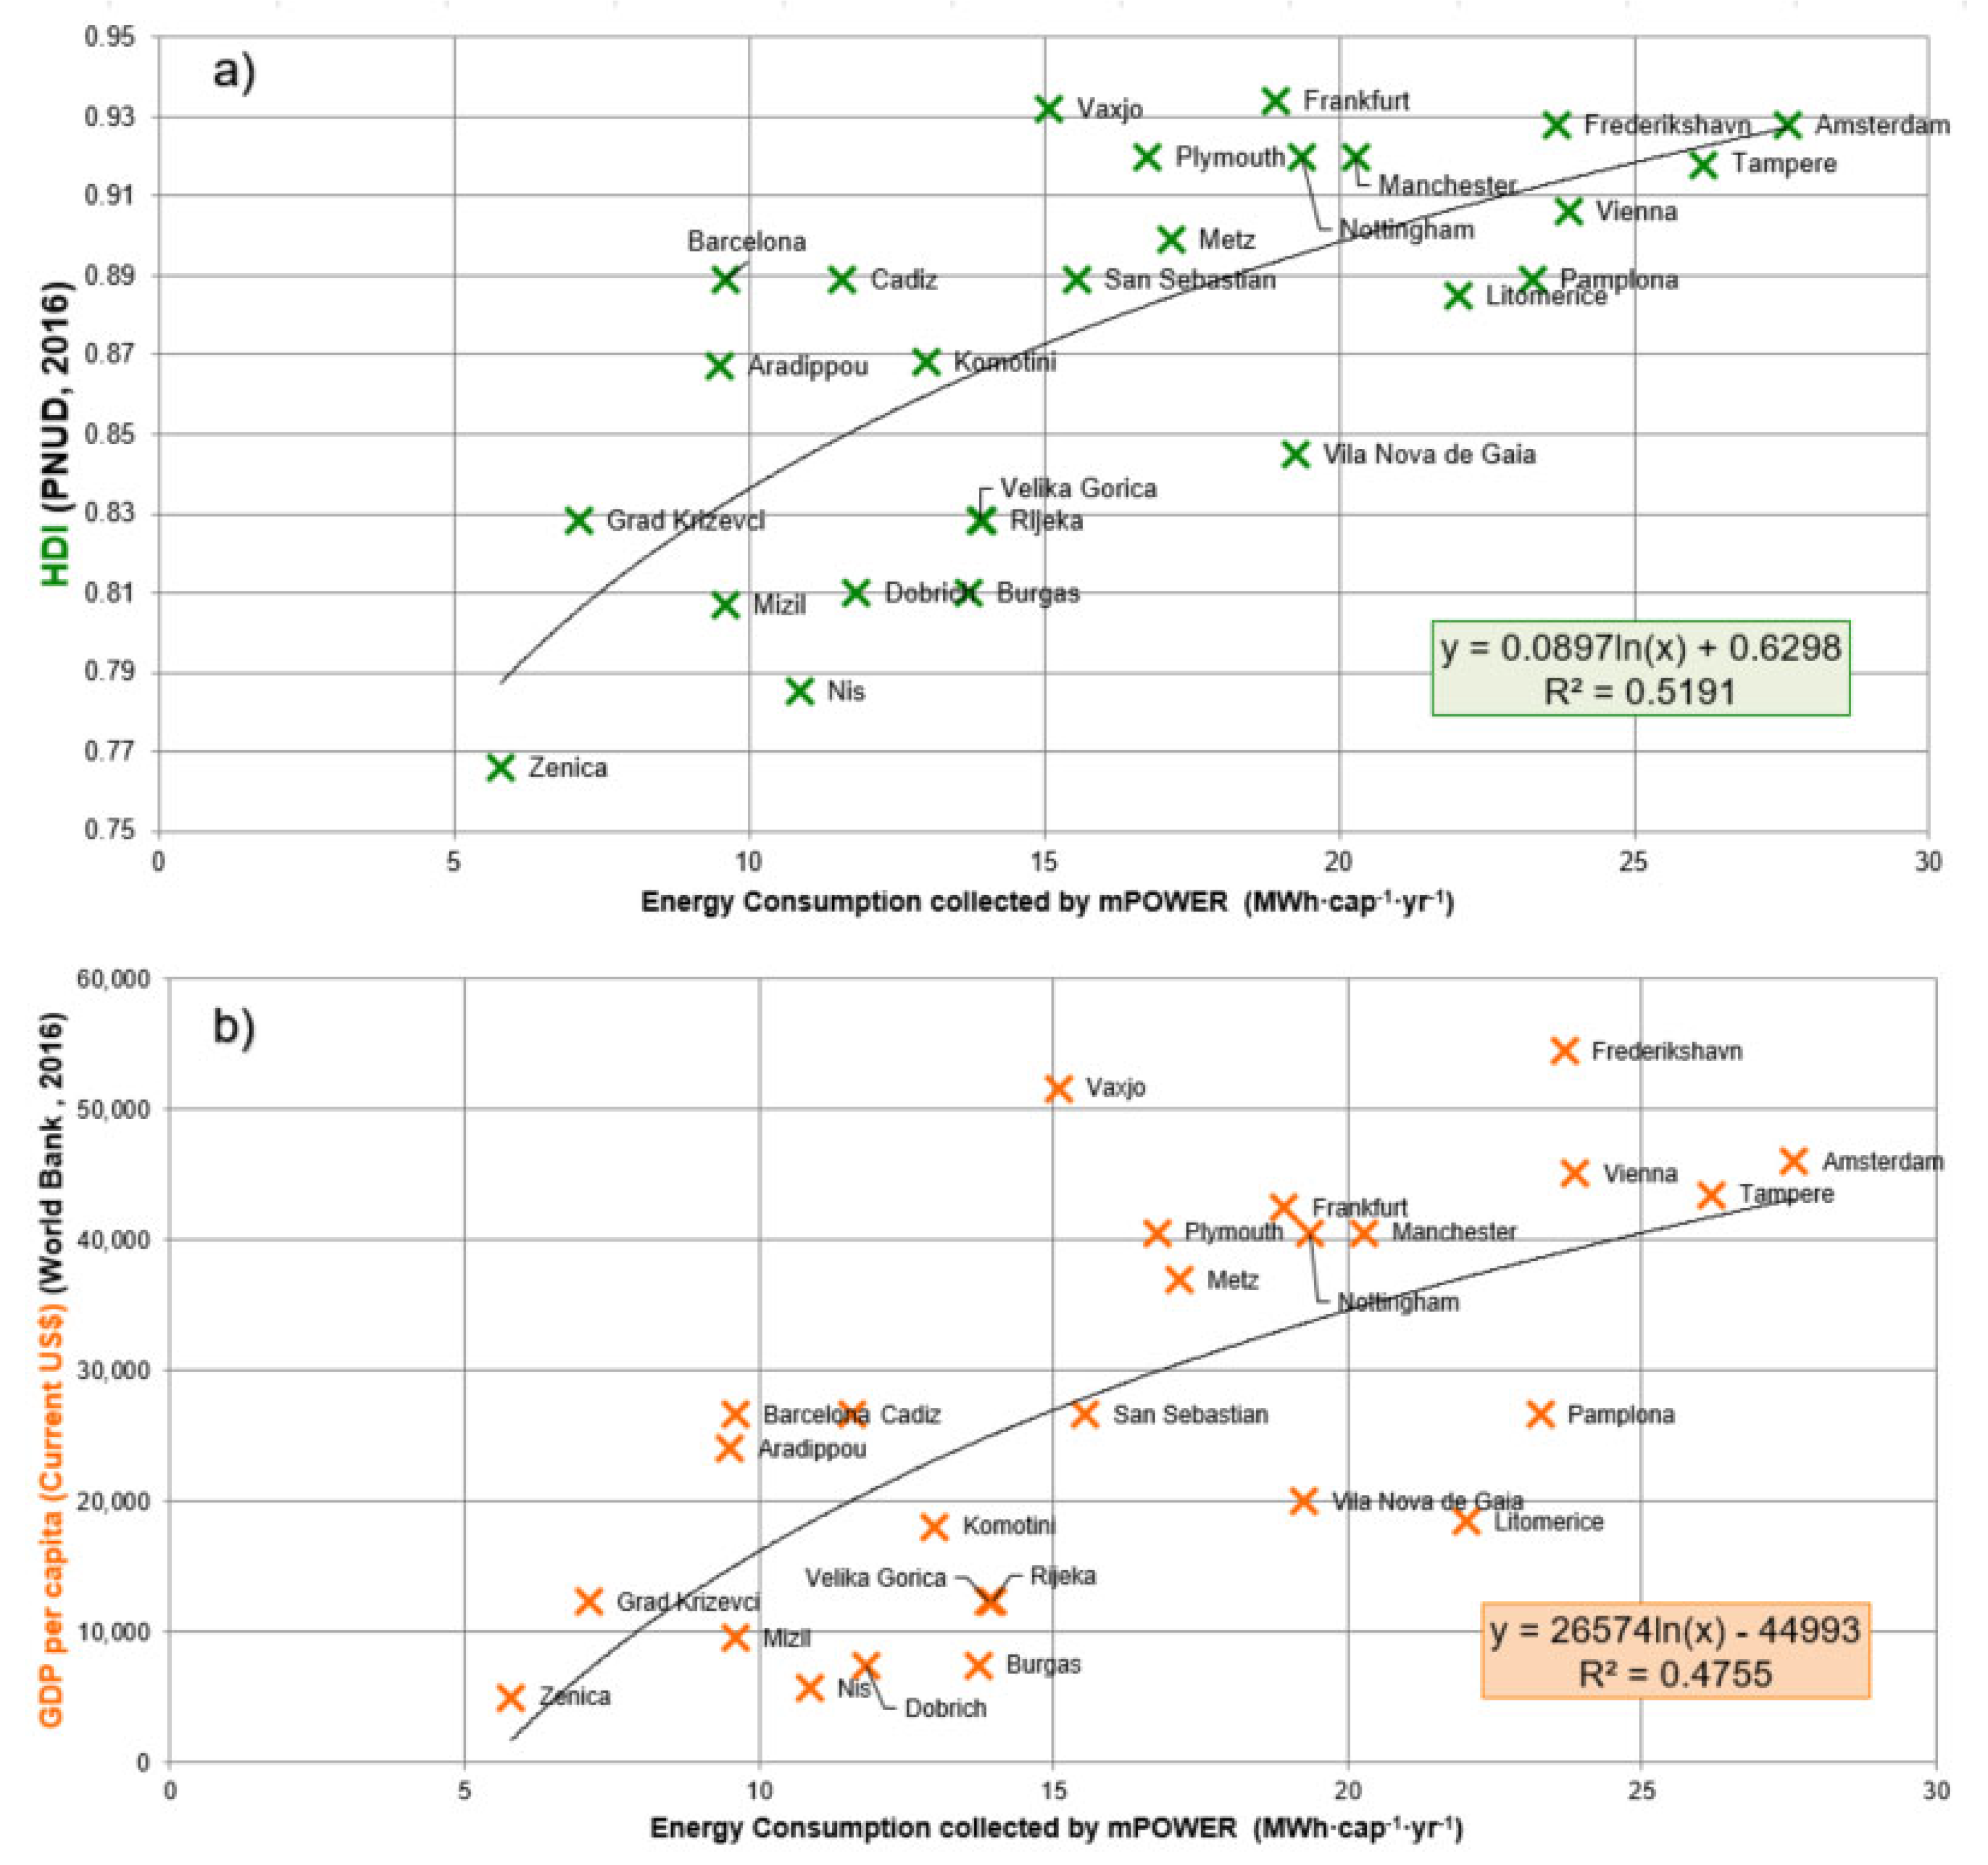
| Human Development Index (HDI) | 3,4 | Reduction of energy consumption | This indicator allows to compare the acquired life quality in comparison of consumed energy. | HDI | Figure 8a |
| Gross Domestic Product (GDP) | 3,4 | Reduction of energy consumption | This indicator allows to compare the acquired national economic development in comparison of consumed energy. | US$∙yr−1∙cap−1 | Figure 8b |
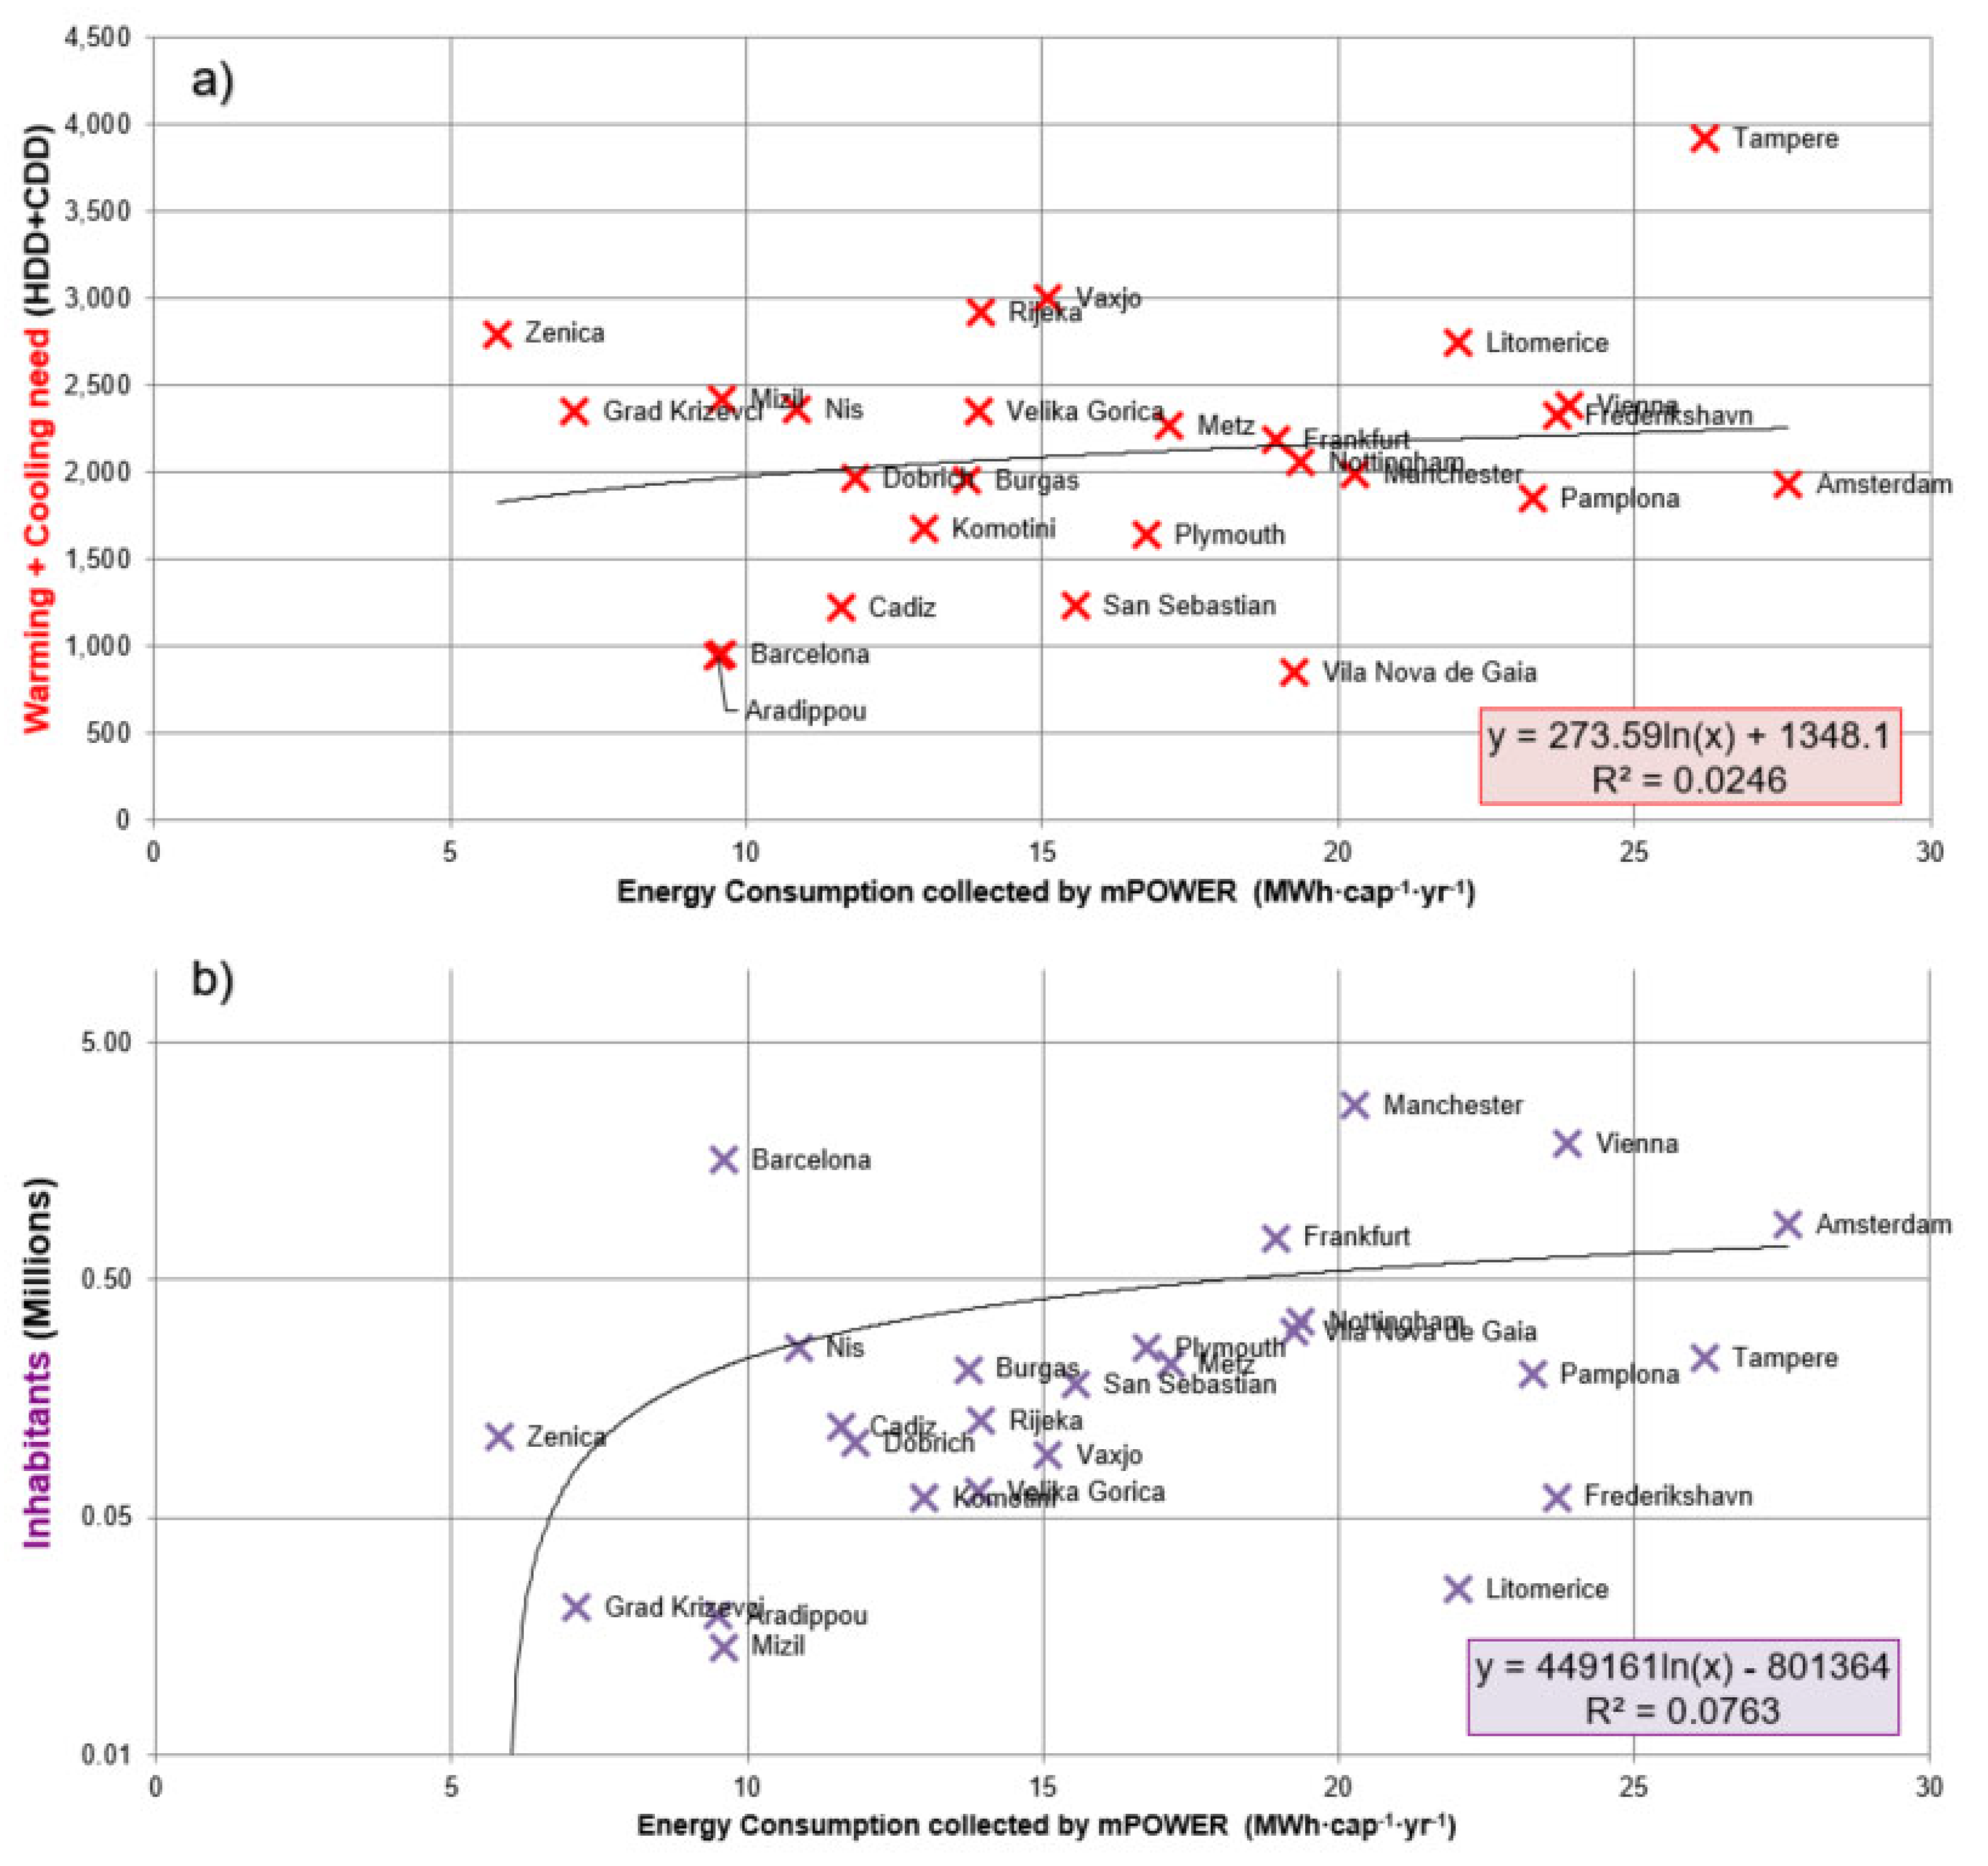
| Heating Degree Day (HDD) and Cooling Degree Day (CDD) | 1 | Reduction of energy consumption | This indicator allows us to compare the consumed energy and need of heating and cooling due to the climate conditions. | Degree Days | Figure 9a |
| Inhabitants | 1 | Reduction of energy consumption | This indicator allows us to compare the energy consumption according the inhabitants of a city. | Number of inhabitants | Figure 9b |
© 2020 by the authors. Licensee MDPI, Basel, Switzerland. This article is an open access article distributed under the terms and conditions of the Creative Commons Attribution (CC BY) license (http://creativecommons.org/licenses/by/4.0/).
Share and Cite
Villamor, E.; Akizu-Gardoki, O.; Azurza, O.; Urkidi, L.; Campos-Celador, A.; Basurko, I.; Barcena Hinojal, I. European Cities in the Energy Transition: A Preliminary Analysis of 27 Cities. Energies 2020, 13, 1315. https://doi.org/10.3390/en13061315
Villamor E, Akizu-Gardoki O, Azurza O, Urkidi L, Campos-Celador A, Basurko I, Barcena Hinojal I. European Cities in the Energy Transition: A Preliminary Analysis of 27 Cities. Energies. 2020; 13(6):1315. https://doi.org/10.3390/en13061315
Chicago/Turabian StyleVillamor, Estitxu, Ortzi Akizu-Gardoki, Olatz Azurza, Leire Urkidi, Alvaro Campos-Celador, Izaro Basurko, and Iñaki Barcena Hinojal. 2020. "European Cities in the Energy Transition: A Preliminary Analysis of 27 Cities" Energies 13, no. 6: 1315. https://doi.org/10.3390/en13061315