Comprehensive Analysis of a High-Power Density Phase-Shift Full Bridge Converter Highlighting the Effects of the Parasitic Capacitances †


Applied Electronics Department, Technical University of Cluj-Napoca, 400027 Cluj-Napoca, Romania
*
Author to whom correspondence should be addressed.
†
This paper is an extended version of our paper published in IEEE Industrial Electronics Society Conference, Lisbon, Portugal, 14–17 October 2019.
Energies 2020, 13(6), 1439; https://doi.org/10.3390/en13061439
Submission received: 7 February 2020
/
Revised: 11 March 2020
/
Accepted: 16 March 2020
/
Published: 19 March 2020
(This article belongs to the Special Issue Power Electronics Technologies and Applications for EV Battery Charging Systems)
Abstract
:A phase-shift full bridge converter is analyzed in detail in continuous conduction mode for one switching cycle for both the leading and lagging legs of the primary bridge. The objective of the study is to determine how the stray capacitance of the transformer, and the capacitances of the diodes in the bridge rectifier affect the converter functionality. Starting from some experimental results, Laplace equivalent circuit models and describing equations are derived for each significant time interval during the switching cycle and are validated through simulations and experimental measurements. The resulting equations are of great interest in the high-power density domain because they can be used to design a clamping circuit for the output rectifier bridge accurately.
1. Introduction
The phase-shift full bridge converter (PSFB) uses parasitic circuits elements, such as capacitances of the semiconductor devices and leakage inductances of the power transformer to provide zero voltage switching (ZVS) without any other active components. During the dead time between switching the transistors of the same leg, the converter can achieve zero voltage ZVS using the energies stored in magnetic components (mainly the power transformer leakage and magnetizing inductance) and the output capacitances of the primary bridge switches. Dead time is usually calculated using a set of predefined conditions, which results in the loss of zero voltage switching condition (ZVS) at light loads [1]. Since the zero voltage switching determines the efficiency of the converter and considering that it depends on the dead time, the relationship between the available energies, the values of the magnetic components and the parasitic capacitances of the semiconductor devices can be determined by analyzing the equivalent circuit models during switching. The values of the magnetic components, the snubbers and the capacitances of the semiconductor devices can be chosen based on this analysis.
When a PSFB is designed for high output voltage, the effect of the stray capacitance of the power transformer together with the parasitic capacitance of the secondary rectifier bridge has a significant effect on its operation [2]. This type of converters are intensely used in many of industrial areas [3], for example: Battery chargers for plug-in-electric vehicles [4,5,6], photovoltaic (PV) power systems (charging batteries or boosting the PV voltage to higher levels) [4], fuel-cell stacks, wind turbines, DC microgrid applications, lighting, etc.
The PSFB topology is represented in Figure 1. As it can be seen, the converter has three modules: The full bridge inverter, the high frequency transformer, and the output rectifier and filter. The converter has a simple topology which can be easily controlled using fixed frequency. Because the description and functional analysis of this type of converter are present in the literature [6,7], in this paper, the effect of the parasitic elements will be emphasized. The main advantages of this topology are: ZVS in a wide load range, simple control methods, low power density, and high efficiency [8].
In most cases, high insulation requirements are needed between the primary and the secondary windings of the power transformer to satisfy the safety standards for this converter. This leads to large leakage inductance in primary and secondary sides. A large number of secondary turns required for high step-up and high voltage applications leads to an increased capacitance between the windings of the transformer, significantly deteriorating the performance of the converter [3,9]. The parallel capacitance of the secondary rectifier diodes adds to the stray capacitance of the transformer further increasing its effects. Another drawback of the converter is the dependency of the ZVS on the load conditions. The loss of ZVS causes not only a decrease in efficiency, but also results in high electromagnetic interference at light load. There are methods to increase the ZVS range by adapting the dead-time based on load condition [10,11]. Moreover, new control methods where used to increase the ZVS at light loads [12,13,14,15]. Modification of the power topology was proposed to extend the ZVS range in References [16,17,18,19]. By properly analyzing the switching behavior of the converter, the ZVS range can be extended without altering the control or the topology of the converter to some extent.
Many studies concentrate on the parasitic elements and how can they degrade the efficiency of the converter. None of these papers considers the stray capacitance of the transformer or the capacitance of the output rectifier. The parasitic elements of the high voltage transformer are analyzed in different papers, but only in predetermined conditions: For example, in Reference [3] only in discontinuous conduction mode (DCM) and for a PSFB converter with pure capacitive filter; in Reference [9] the effect of the transformer capacitance only on the leading leg from current drop perspective; in References [20,21] a discussion on voltage oscillations across secondary diodes in a PSFB converter, but not analyzing in every detail a complete switching interval.
The design of high voltage PSFB converter has many degrees of freedom which complicates the selection of the components [22]. Finding an optimized solution (highest power density, efficiency or lower cost) requires comprehensive analytical models and equations that account for the most harmful parasitic elements. This work concentrates on a detailed analysis of the PSFB converter that accounts parasitic influences, namely: Stray capacitance of the transformer secondary winding and the capacitances of the diodes in the bridge rectifier. The analysis is performed in continuous conduction mode for both the leading and lagging leg of the primary bridge for a complete switching cycle.
2. Motivation
Most articles nowadays start from method explanation and simulations followed by experimental results for validation. In this paper, a different approach is proposed. As presented in Figure 2, one can see the differences between a simulation-based analysis and the waveforms obtained during experimental measurement. Starting from these differences, a mathematical analysis using Laplace equivalent models, together with Spice simulations for the different working time intervals are proposed for better understanding the influence of the parasitic capacitance on the phase shift converter [23]. The Laplace equivalent models emphasize the effects of the parasitic capacitance and provide the designer with an in-depth understanding of how to compensate them in order to provide a better design. The simulations were carried out to validate the theoretical analysis and provide a faster and more intuitive tool for the designers. A complete switching cycle of the converter was considered for the analysis. For an in-depth analysis, this cycle was divided into seven time intervals to better highlight the effect of the parasitic capacitance. For each time interval, Laplace equivalent models are provided in the paper followed by a simulation specific built for each situation. In the simulations, the component values used are the same as for the built experimental model. The results obtained through simulations are compared with the ones obtained during experiments. Comparing the numerical values, it can be seen that the mathematically equivalent model and simulations are validated. In some cases, the small inaccuracies that appear are due to other parasitic elements that were not taken into account intentionally to have a simple equivalent model that can be used with ease. As presented in the paper, the equations obtained can be used for instance as a basis for the design of an active snubber circuit that will increase the efficiency and ease the thermal enclosure design. Choosing the correct components through a minimum number of steps is every designer’s goal.
The experimental model from which the analysis started was used to provide data to check the accuracy of the Laplace equivalent models and simulations.
The phase shift converter was designed for the following specifications: The input voltage of the converter reflected in the secondary is Vin = 250 V, and the output voltage is Vout = 173 V. The primary leakage inductance is Lr_p = 5 µH, the transformer ratio is n = 0.6, and the output inductor is Lout = 280 µH.
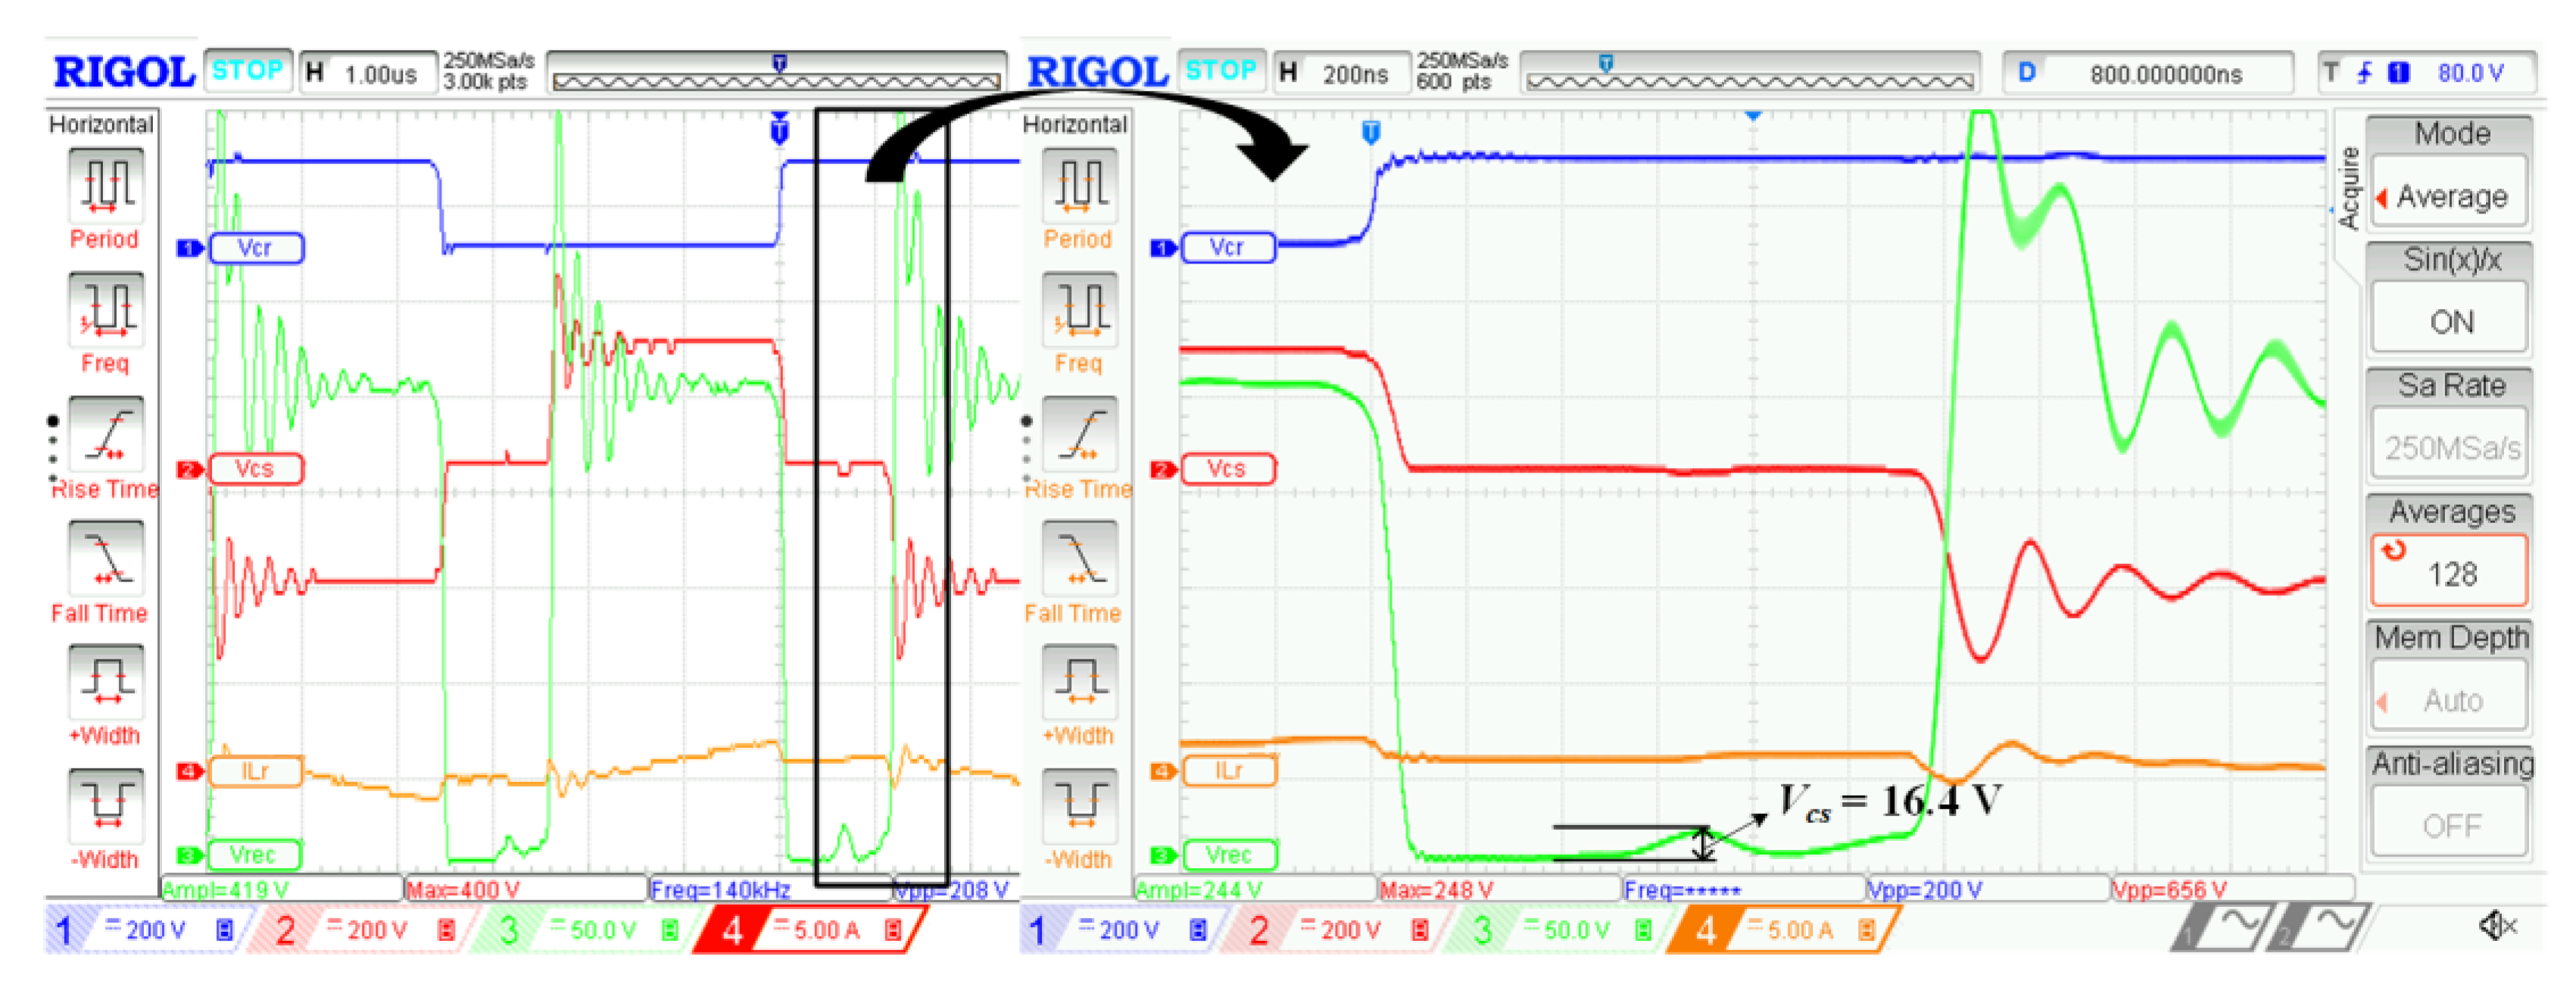
The secondary peak voltage and the oscillations caused by Lr = 14 µH inductance (the sum of the leakage inductances referred to the secondary that will be explained later) and Cs capacitance—total stray capacitance of the transformer and rectifier capacitances (will be demonstrated later) are presented in Figure 3.
As it can be seen from secondary rectified voltage, the frequency of oscillations is fr = 4.167 MHz. Thus, Cs capacitance can be estimated as:
where Lr =14 µH.
Also, the discharge time interval of Cr (the switches equivalent output capacitance equal to 767 pF) can be estimated as:
where Io = 2.3 A is the output current. Equation (2) will be later demonstrated in the article.
The Cr capacitor is fully charged in about 97 ns as can be observed in Figure 4:
Although simulation tools can always be used for simulating the switching converters in a much easier way, the circuit parameters remain in non-closed form, and it is difficult to tell the impact of a certain design parameter on the results. Moreover, experiments often take time, and additional delay will be expected if changes in magnetic components are needed. On the other hand, a mathematical model can give very intuitive information, which can always help the designer to (1) fully understand the operation of the switching states; (2) reduce the number of iterations for optimization in experiments; (3) find worst case/corner case for testing; (4) analyze component tolerance impacts, etc.
3. The Model of the Converter
In Figure 5a, an equivalent electric circuit of a high frequency transformer is presented, with all the elements referred to the secondary side. R’w1 and Rw2 are the resistances and L’lkp, and Llks are the leakage inductances of the primary and secondary windings, Lm is the magnetizing inductance of the secondary, C’1 and C2 are the self-capacitances of the primary and secondary windings, C12 the mutual capacitance between the windings and V’1, V2 are the voltages of the primary and secondary sides. For the analyzed converter, the primary and the secondary inductances of the transformer are small compared to the magnetizing inductance. The voltage drop across these inductances is small; thus, the stray parasitic capacitances can be modeled by a single capacitor, connected as in Figure 5b equal to: Csec ≈ C’1 + C2 with C12 neglected.
If the effects of the winding resistances and of the magnetizing inductance are neglected, then a simplified transformer model is obtained, Figure 5c, where Lr is the sum of the leakage inductances.
Due to design considerations, the transformer ratio is equal to 0.6, resulting in the equivalent circuit of the PSFB converter, Figure 6, where G1, G2, G3 and G4 are the gate drive signals, Vcs is the voltage on the stray capacitance, Ir is the current through the Lr inductance, and Vrec is the secondary rectified voltage. The rectifier capacitances are also included in the total stray capacitance of the transformer Cs = Csec + CDIODES. When Io flows through D1, D4 CDIODES = CD2 + CD3 and vice-versa when D2 and D3 conduct.
Whenever possible, the parasitic elements (leakage inductances of the transformer associated with semiconductor parasitic capacitances) can be used in an advantageous way to facilitate the resonant transition and to achieve ZVS. In Figure 1 the resonant inductor is depicted by Lr_p that can be an external inductor added to the schematic but in this case, the leakage inductances of the transformer will be used as the resonant inductor, Lr, to achieve ZVS: . C’o1, C’o2, C’o3, C’o4 are the output capacitances of the switches and Ir and Vinv are values referred to the secondary.
4. Converter Operation
Figure 7 illustrates the operation waveforms of the converter.
4.1. Operation during [t1-t3]
In the first analysis, the influence of the capacitance Cs is neglected. Before t1, transistors Q1 and Q3 together with diode D1 and D4 are ON. In the same time, the output capacitor C’o2 of the Q2 transistor starts discharging. The output current Io flows through D1, D4, D3 and D2, so that the following relationships can be written.
During t1-t2, if there is enough energy stored in Lr, C’o2 capacitor is completely discharged, and C’o1 is charged to Vin. Thus, at t2, the body diode of Q2 turns ON, allowing ZVS turn ON for Q2. Considering Cr = C’o1 + C’o2 the equivalent output capacitance of Q1 and Q2 transistors and neglecting the secondary parasitic capacitance Cs, the Laplace equivalent circuit corresponding to this time interval is presented in Figure 8.
The equation describing the circuit in Figure 8 is:
If the angular frequency is then the current through Cr is:
Applying the Laplace inverse transform to (5) and shifting to t1, results that Cr is discharged with the current:
The Cr capacitor voltage is:
From (7) results that the completely discharge time interval of Cr can be estimated as:
For the values used in the simulation presented in Figure 9: Lr = 14 µH, Vin = 250 V, Io = 2.3 A, using (8) Δt will be 97 ns. The same result for the time needed to discharge Cr is obtained in simulation, Figure 10. At t1 all the diodes (D1, D2, D3, D4) will start to conduct immediately.
If one considers the influence of the Cs secondary parasitic capacitance, which is assumed to be charged at t1, the Laplace equivalent schematic of the converter is presented in Figure 11. It will be later demonstrated that Cs is charged (for the worst case) at:
For example, if Lr = 14 µH and Lout = 280 µH, then VCs(0) = 16.4 V.
The equations describing the circuit from Figure 11 are:
After simple mathematical manipulations (10) becomes:
From (11), results that the expression of the current through the Cs capacitor is:
In (11) and (12), and .
Applying the Laplace inverse transform to (12) and shifting to t1 results:
From (13) the voltage across the Cs capacitor can be calculated as:
Solving the equation vcs(t) = 0 V one gets: Δt = 30 ns.
The current through the resonant inductor is:
The capacitor Cr will be discharged according to:
After Δt = 30 ns the voltage on Cr will be: Vcap = 157 V and Irt′ = 2.16 A.
As can be seen in Figure 13 the diodes will turn ON immediately after Vcs reaches zero, starting from its initial value before Q1 turns OFF. At this moment t’ = 30 ns the voltage on the Cr capacitor that is also discharging reaches the value of 157 V and the current through the Lr inductor is 2.16 A. The Cr capacitor needs in this case 97 ns to completely discharge from its initial value.
In Figure 14, a detailed set of waveforms is presented for the time interval corresponding to [t1-t2]. It can be observed that the values obtained with the mathematical and simulation model match closely the experimental measurements. Vcr is the voltage measured on the primary of the transformer and corresponds to Vinv from Figure 6, Vcs is the voltage on the secondary, Vrec is the rectified secondary voltage, and ILr is the output current in this case.
At t’ when Cs is discharged, the Laplace equivalent circuit presented in Figure 15 can be used to compute the Cr voltage.
where Vdiff is the difference between the input voltage and the initial voltage of Cr at t′ and Irt′ is the current through Lr at t′.
The diodes D2, D3 will start to conduct after t′ when Cs is completely discharged. At t″ = 97 ns when Vcr(t″) = 0 the resonant inductor current, Ir, is flowing through the body diode Din2 of Q2, decreasing with a slope equal to Vin/Lr. Now Q2 can be switched ON. The current through D1 is decreasing and through D3 is increasing. At t3, D1 current is zero and Ir = Io.
When Cs is charged at a low voltage, its influence on the Cr discharging time is negligible.
4.2. Operation during [t3-t4], immediately after t3
At t3, D1 and D4 diodes turn OFF, and the output current continues to flow through D3 and D2. For a short time after t3 the current through Lout can be considered constant, and this inductance is replaced by a constant current source.
The Laplace equivalent model corresponding to this time interval is presented in Figure 16.
The equations describing the circuit from Figure 16 are:
After simple mathematical manipulation of (21) the expression of the Cs current is:
where .
The voltage across the Cs capacitor can be calculated as:
As it can be deduced from (23), Vcs voltage reaches its maximum value Vcs.max = 2Vin after a time interval equal to T/2 = π/ω. This equation is very useful for designing the output clamping circuit.
Spice simulation for the schematic in Figure 17 describing the converter immediately after t3 is presented in Figure 18.
As it can be observed in Figure 18, immediately after t3 the maximum voltage on the Cs capacitor reaches the double input value, in this case, Vin = 250 V. The value represents the voltage measured on the secondary side of the transformer.
In Figure 19 are highlighted the experimental results for the interval t3-t4 immediately after t3. It can be observed that there is a difference between the simplified model used in the simulation and the experimental values. This difference is due to the fact that the simulation takes into account the worst-case scenario for the maximum possible Vcs voltage (obtained for worst-case R1 = 0 Ω).
For the experimental setup, if a secondary parasitic equivalent resistance R1 = 70 Ω is considered, the damping ratio of the secondary voltage is given by:
From (24) results that secondary peak voltage can be estimated with:
4.3. Operation during [t4-t5]
At t4, Q3 turns off, and the energy transfer from primary to the output stops. The output capacitor C’o3 of Q3 starts to charge, and the output capacitor of Q4 starts to discharge. If one considers Cr = C’o3 + C’o4, then the equivalent schematic of the converter corresponding to this time interval is presented in Figure 20.
Since only D1 and D4 are on, results that Cr starts to be charged with an approximatively constant current (the output current Io), thus in general, this time interval is very narrow.
In this case, the voltage across the Cr capacitor is given by:
From Equation (26), results that the charging time interval of the Cr capacitor can be estimated with (27) supposing that during this time interval the capacitor Cs will remain charged at the approximately same voltage Vin. A detailed analysis which takes into account the influence of Cs can be made, as in Section 4.1.
The equations describing the circuit in Figure 21 are:
The equivalent circuit corresponding to this time interval is presented in Figure 22, supposing that Cr is already charged. During [t4′-t5] time interval, as seen in Figure 23, the energy stored in Cs shall be evacuated through D1 and D4.
From (23) results that Cs current is given by:
Applying the Laplace inverse transform to (29) and shifting to t4′, results that Cs is discharged by a sinusoidal current, as in (22). The equation of the voltage across the Cs capacitor becomes in this case:
As supposed before, the Cr capacitor will start to charge according to Equation (26), while for the first part of this period of time the voltage on the Cs capacitor remains constant at the 250 V in this case. The energy stored in Cs shall be evacuated through the D1 and D4 diodes.
In Figure 24 are highlighted the experimental results for the interval t4-t5. It can be observed that the results match closely the values obtained with the mathematical and simulation models.
4.4. Operation during [t5-t7]
From (30) results that at t5 (after a time interval equal to T/4 = π/2ω), the voltage across Cs reaches zero, and the Ics current reaches its maximum value. After this time interval, due to the reverse voltage polarity on Cs, the energy stored in it shall be evacuated almost instantaneous through D2 and D3, which turn ON and keep the voltage on Cs equal to zero. At t6, Q4 turns ON with ZVS, and the primary output reflected current continues to flow through the body diode Din4 of Q4. The D1 and D4 diodes are turned ON together with D3 and D2 until t7, when the Lr current reaches again the value of the output current reflected in the primary of the transformer. After t7, the output current flows again only through D1 and D4. If one considers that in [t5-t7] time interval the Lr current is approximatively constant and the diode currents iD1 = iD4 and iD3 = iD2, then the equivalent schematic of the converter corresponding to this time interval is presented in Figure 25.
The equations describing the circuit in Figure 25 are:
From (31) results that:
Since this difference between the output current and the reflected primary current is given by the current drop through Cs at t5, results that:
where ID1 and ID2 are the current values through D1 and D2 in t5 and Ics.max is the maximum value of the Cs current.
The diodes D2 and D3 are turning OFF at t7, when the current through Lr reaches the value of the current through Lout.
The equations describing the relation between the Lr and Lout currents are:
Since the Lr and Lout currents are again equal at t7, results that:
From (35) results that [t5-t7] time interval can be estimated as: 1.2 µs.
4.5. Operation during [t7-t8]
At t7, D2 and D3 diodes turn OFF, and D1 and D4 continue to stay ON until t8, when Q2 transistor turns OFF. The equivalent circuit from Figure 26 presents the Laplace model of the converter corresponding to [t7-t8] time interval. In this case, the initial currents through Lr and Lout have no influence.
The voltage across the Cs capacitor in [t7-t8] time interval is:
If is the impedance of the parallel connection Lr-Cs and then (37) becomes:
Applying the Laplace inverse transform to (38), results that the voltage across the Cs capacitor in [t7-t8] is:
Spice simulation for the schematic in Figure 27 describing the converter in [t7-t8] interval is presented in Figure 28. As can be observed the Cs capacitor charges at the voltage deduced with Equation (9). So this is the worst-case values of Vcs(0) for this specific analysis.
As it can be deduced from (39), vcs voltage reaches the maximum value Vcs.max = 16.4 V after a time interval equal to T2/2 = π/ω2:
In Figure 29 can be observed that the voltage across the Cs capacitor in [t7-t8] is Vcs = 16.4 V corresponding with the value obtained with Equation (40).
Equation (40) is used for determining the initial conditions of [t1-t3] time interval, in Section 4.1.
5. Conclusions
This paper presents a detailed analysis of the PSFB converter that accounts for the stray capacitance of the transformer secondary winding and the capacitances of the diodes in the bridge rectifier. The analysis was performed in continuous conduction mode for both, leading and legging leg of the primary bridge and for a complete switching cycle, starting from an equivalent electric circuit of a high frequency transformer, with all the elements referred to the secondary side. The complete switching cycle considered for the analysis was divided into seven time intervals to better highlight the effect of the parasitic capacitance. A simplified Laplace equivalent circuit for each operation time interval was developed and the corresponding equations where derived. The values obtained through mathematical manipulation are compared with the ones obtained with the Spice simulation models created for each time interval. The simulation models validate the mathematical description on each time interval and provide an intuitive and easy to adapt the method for analyzing a phase shift converter in detail. Equations (9) and (23) can be used to design active snubbers. The effect of the stray capacitance can be observed in the experimental waveforms presented in Figure 29. Because of the short amount of time and small value that the Vcs(0) exhibits most of the time, its presence is ignored by designers resulting in flawed designs. The experimental waveforms were measured on the PSFB converter prototype. It can be observed that the experimental measurement prove that the mathematical model and the equivalent simulation circuits are valid and can be used for design optimizations.
6. Discussion
The main objective of the paper is to highlight and better understand the effects of the parasitic capacitances on the PSFB. By using the equations and simulation models presented in Section 4 the design process of such a converter simplifies, and there is no need for implementing new complicated control techniques if the negative effects of the stray capacitance are taken into account. By determining the maximum voltage on the stray capacitance, an active clamping circuit can be designed. As highlighted in the Introduction section, such high power density converters are needed more and more in the automotive industry, due to the development of electric cars and off and on board charging stations. Using active snubbers in this equipment is necessary, due to high-efficiency requirements and space constraints that affect the heat dissipation needed for the passive snubbers approach. This type of analysis, presented in this paper, helps designers and scientist to better understand the effects that appear in high density power converters. If these effects are ignored it can lead to a design with a very high number of iterations between the simulation stage and experimental measurements. Many times the redesign is the solution adopted.
Author Contributions
Conceptualization, D.P.; Formal analysis, D.P.; Investigation, T.P. and I.C.; Methodology, D.P.; Supervision, D.P.; Validation, R.E.; Visualization, I.C.; Writing—original draft, D.P.; Writing—review and editing, R.E. and T.P. All authors have read and agreed to the published version of the manuscript.
Funding
This research was supported by the project “High power density and high efficiency micro-inverters for renewable energy sources”—MICROINV—Contract no. 16/1.09.2016, project co-funded from the European Regional Development Fund through the Competitiveness Operational Program 2014-2020, Romania.
Conflicts of Interest
The authors declare no conflict of interest. The funders had no role in the design of the study; in the collection, analyses, or interpretation of data; in the writing of the manuscript, or in the decision to publish the results.
References
- Zhao, L.; Li, H.; Yu, Y.; Wang, Y. A Novel Choice Procedure of Magnetic Component Values for Phase Shifted Full Bridge Converters with a Variable Dead-Time Control Method. Energies 2015, 8, 9655–9669. [Google Scholar] [CrossRef] [Green Version]
- Hossain, M.Z.; Rahim, N.A. Recent progress and development on power DC-DC converter topology, control, design and applications: A review. Renew. Sustain. Energy Rev. 2018, 81, 205–230. [Google Scholar] [CrossRef]
- Aghaei, M.; Karimi, Y.; Kaboli, S. Analysis of Phase-Shifted Full-Bridge Based dc-dc Converter Considering Transformer Parasitic Elements in Discontinuous Current Mode. In Proceedings of the 5th Annual International Power Electronics, Drive Systems and Technologies Conference (PEDSTC 2014), Tehran, Iran, 5–6 February 2014. [Google Scholar]
- Tie, S.F.; Tan, C.W. A review of energy sources and energy management system in electric vehicles. Renew. Sustain. Energy Rev. 2013, 20, 82–102. [Google Scholar] [CrossRef]
- Un-Noor, F.; Padmanaban, S.; Mihet-Popa, L.; Mollah, M.N.; Hossain, E. A Comprehensive Study of Key Electric Vehicle (EV) Components, Technologies, Challenges, Impacts, and Future Direction of Development. Energies 2017, 10, 1217. [Google Scholar] [CrossRef] [Green Version]
- Gautam, D.S.; Musavi, F.; Edington, M.; Eberle, W.; Dunford, W.G. An Automotive On-Board 3.3 kW Battery Charger for PHEV Application. In Proceedings of the 2011 IEEE Vehicle Power and Propulsion Conference, Chicago, IL, USA, 6–9 September 2011; pp. 1–6. [Google Scholar] [CrossRef]
- Sabate, J.A.; Vlatkovic, V.; Ridley, R.B.; Lee, F.C.; Cho, B.H. Design Considerations for High-Voltage High-Power Full-Bridge Zero-Voltage-Switched PWM Converter. In Proceedings of the IEEE APEC, Los Angeles, CA, USA, 11–16 March 1990. [Google Scholar]
- Han, J.K.; Moon, G.W. Circulating Current-less Phase-Shifted Full-Bridge Converter with New Rectifier Structure. In Proceedings of the 2018 International Power Electronics Conference (IPEC-Niigata 2018-ECCE Asia), Niigata, Japan, 20–24 May 2018; pp. 4054–4058. [Google Scholar] [CrossRef]
- Lin, S.Y.; Chen, C.L. On the leading leg transition of phase-shifted ZVS-FB converters. IEEE Trans. Ind. Electron. 1998, 45, 677–679. [Google Scholar] [CrossRef]
- Kim, D.Y.; Kim, C.E.; Moon, G.W. Variable delay time method in the phase-shifted full-bridge converter for reduced power consumption under light load conditions. IEEE Trans. Power Electron. 2013, 28, 5120–5127. [Google Scholar] [CrossRef]
- Kim, J.W.; Kim, D.K.; Kim, C.E.; Moon, G.W. A simple switching control technique for improving light load efficiency in a phase-shifted full-bridge converter with a server power system. IEEE Trans. Power Electron. 2014, 29, 1562–1566. [Google Scholar] [CrossRef]
- Xu, W.; Chan, N.H.; Or, S.W.; Ho, S.L.; Chan, K.W. A New Control Method for a Bi-Directional Phase-Shift-Controlled DC-DC Converter with an Extended Load Range. Energies 2017, 10, 1532. [Google Scholar] [CrossRef] [Green Version]
- Lai, Y.S.; Su, Z.J.; Chang, Y.T. Novel Phase-Shift Control Technique for Full-Bridge Converter to Reduce Thermal Imbalance under Light-Load Condition. IEEE Trans. Ind. Appl. 2015, 51, 1651–1659. [Google Scholar] [CrossRef]
- Kim, J.H.; Kim, C.E.; Kim, J.K.; Lee, J.B.; Moon, G.W. Analysis on Load-Adaptive Phase-Shift Control for High Efficiency Full-Bridge LLC Resonant Converter under Light-Load Conditions. IEEE Trans. Power Electron. 2016, 31, 4942–4955. [Google Scholar]
- Chen, B.-Y.; Lai, Y. Switching control technique of phase-shift-controlled full-bridge converter to improve efficiency under light-load and standby conditions without additional auxiliary components. IEEE Trans. Power Electron. 2010, 25, 1001–1012. [Google Scholar] [CrossRef]
- Zhao, L.; Xu, C.; Zheng, X.; Li, H. A Dual Half-Bridge Converter with Adaptive Energy Storage to Achieve ZVS over Full Range of Operation Conditions. Energies 2017, 10, 444. [Google Scholar] [CrossRef] [Green Version]
- Pandey, R.; Tripathi, R.N.; Hanamoto, T. Comprehensive Analysis of LCL Filter Interfaced Cascaded H-Bridge Multilevel Inverter-Based DSTATCOM. Energies 2017, 10, 346. [Google Scholar] [CrossRef] [Green Version]
- Lai, Y.-S.; Su, Z. New Integrated Control Technique for Two-Stage Server Power to Improve Efficiency under the Light-Load Condition. IEEE Trans. Ind. Electron. 2015, 62, 6944–6954. [Google Scholar] [CrossRef]
- Wang, C.S.; Li, W.; Wang, Y.F.; Han, F.Q.; Meng, Z.; Li, G.D. An Isolated Three-Port Bidirectional DC-DC Converter with Enlarged ZVS Region for HESS Applications in DC Microgrids. Energies 2017, 10, 446. [Google Scholar] [CrossRef] [Green Version]
- Ruan, X. Soft-Switching PWM Full-Bridge Converters: Topologies, Control, and Design; John Wiley & Sons: Singapore, 2014; pp. 122–123. [Google Scholar]
- Kummari, N.; Chakraborty, S.; Chattopadhyay, S. An isolated high-frequency link microinverter operated with secondary-side modulation for efficiency improvement. IEEE Trans. Power Electron. 2018, 33, 2187–2200. [Google Scholar] [CrossRef]
- Escudero, M.; Kutschak, M.A.; Meneses, D.; Rodriguez, N.; Morales, D.P. A Practical Approach to the Design of a Highly Efficient PSFB DC-DC Converter for Server Applications. Energies 2019, 12, 3723. [Google Scholar] [CrossRef] [Green Version]
- Petreus, D.; Ciocan, I.; Patarau, T.; Etz, R.; Orban, Z. The Effect of Parasitic Capacitances on the Phase-Shift Full Bridge Converter. In Proceedings of the IECON—IEEE Industrial Electronics Society Conference, Lisbon, Portugal, 14–17 October 2019. [Google Scholar]
Figure 1.
Phase-shift full-bridge converter.
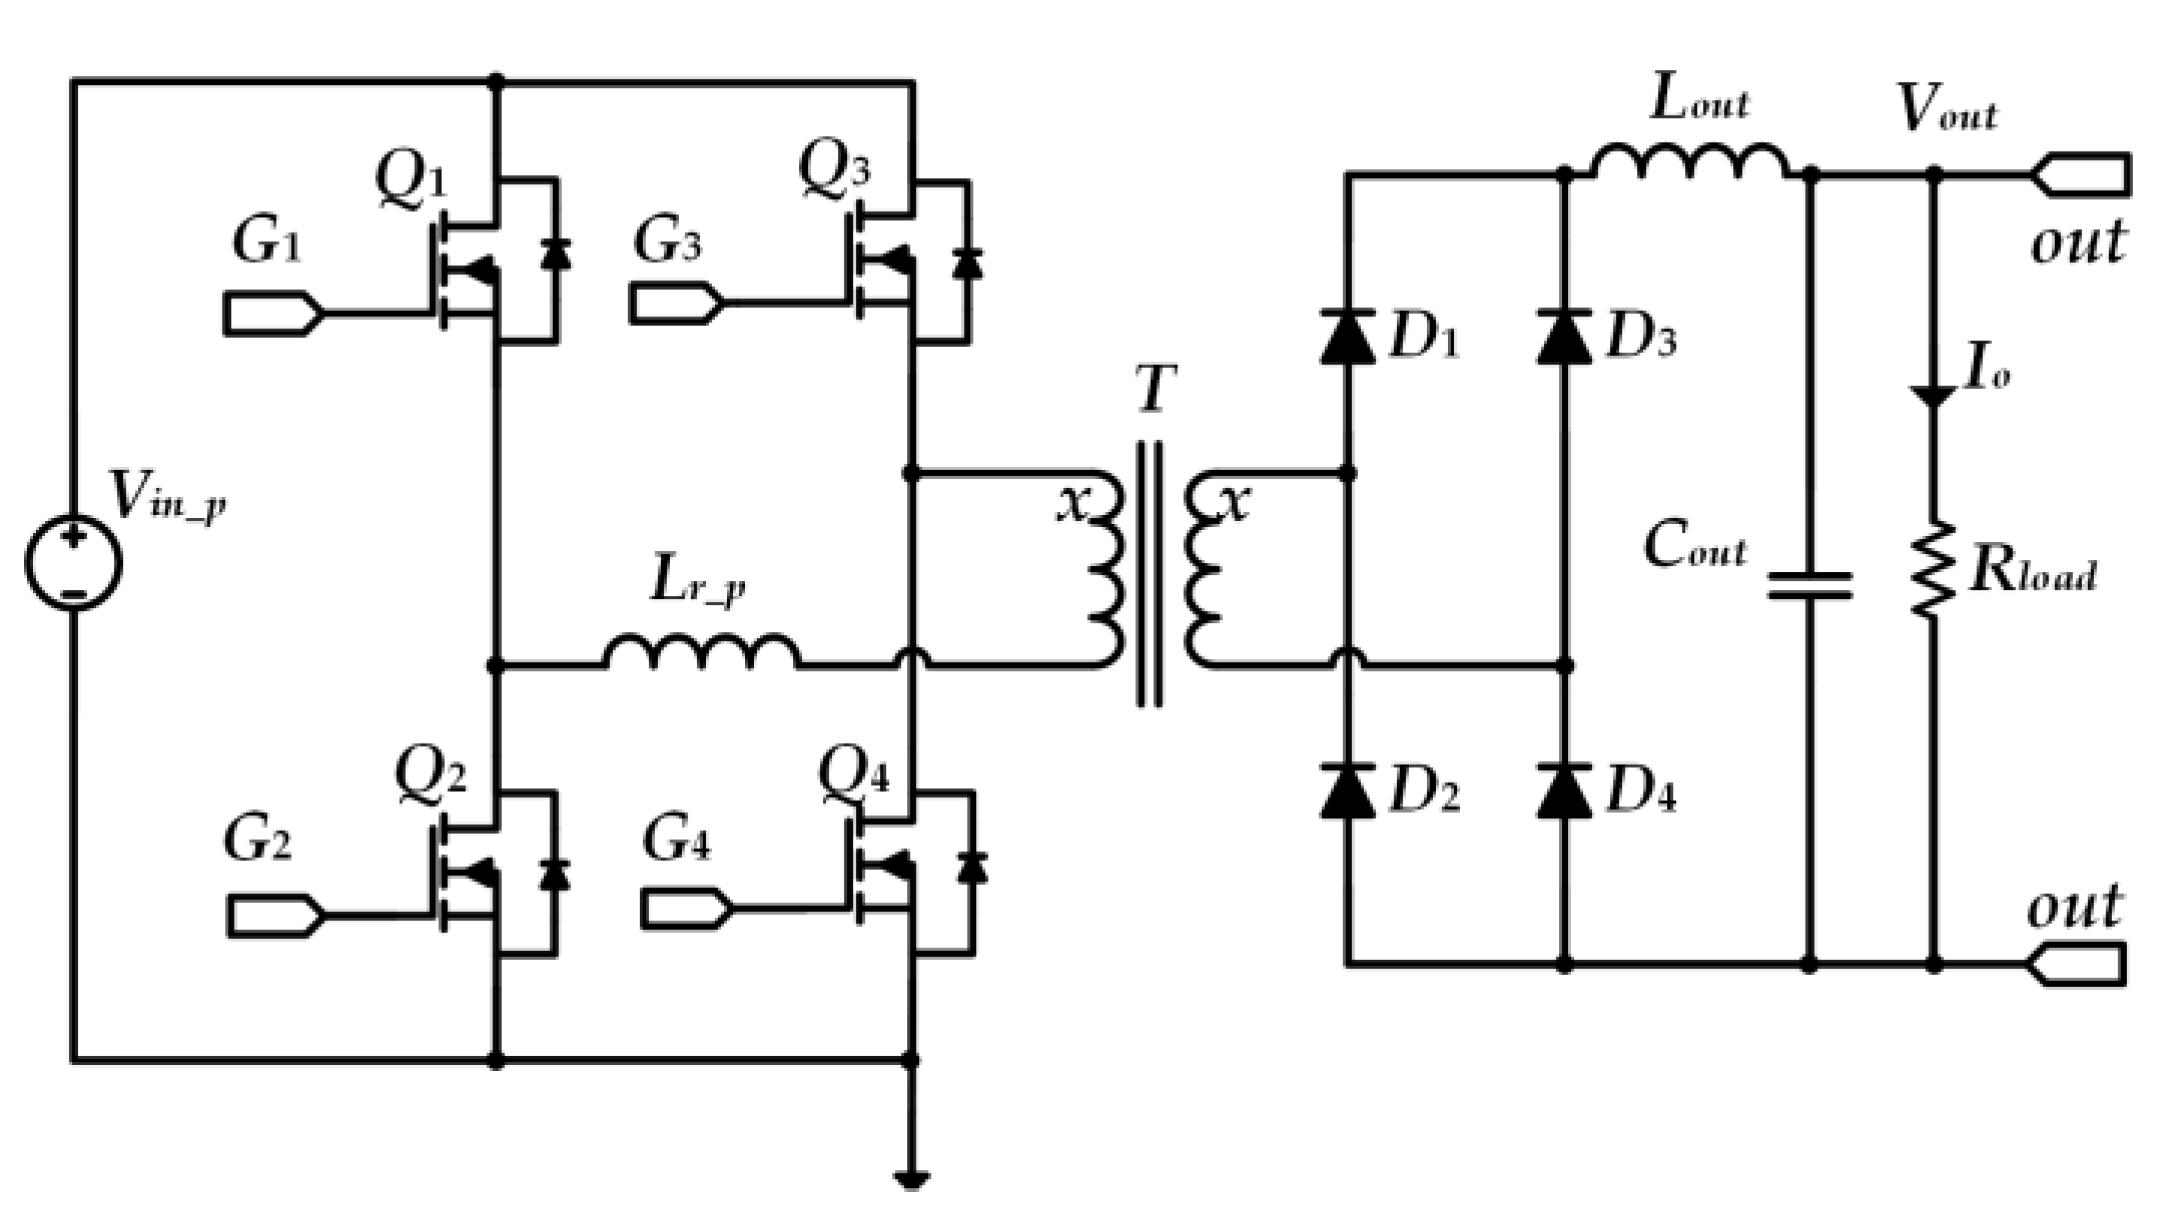
Figure 2.
Phase-shift waveforms obtained: (a) On simulation; (b) experimentally.
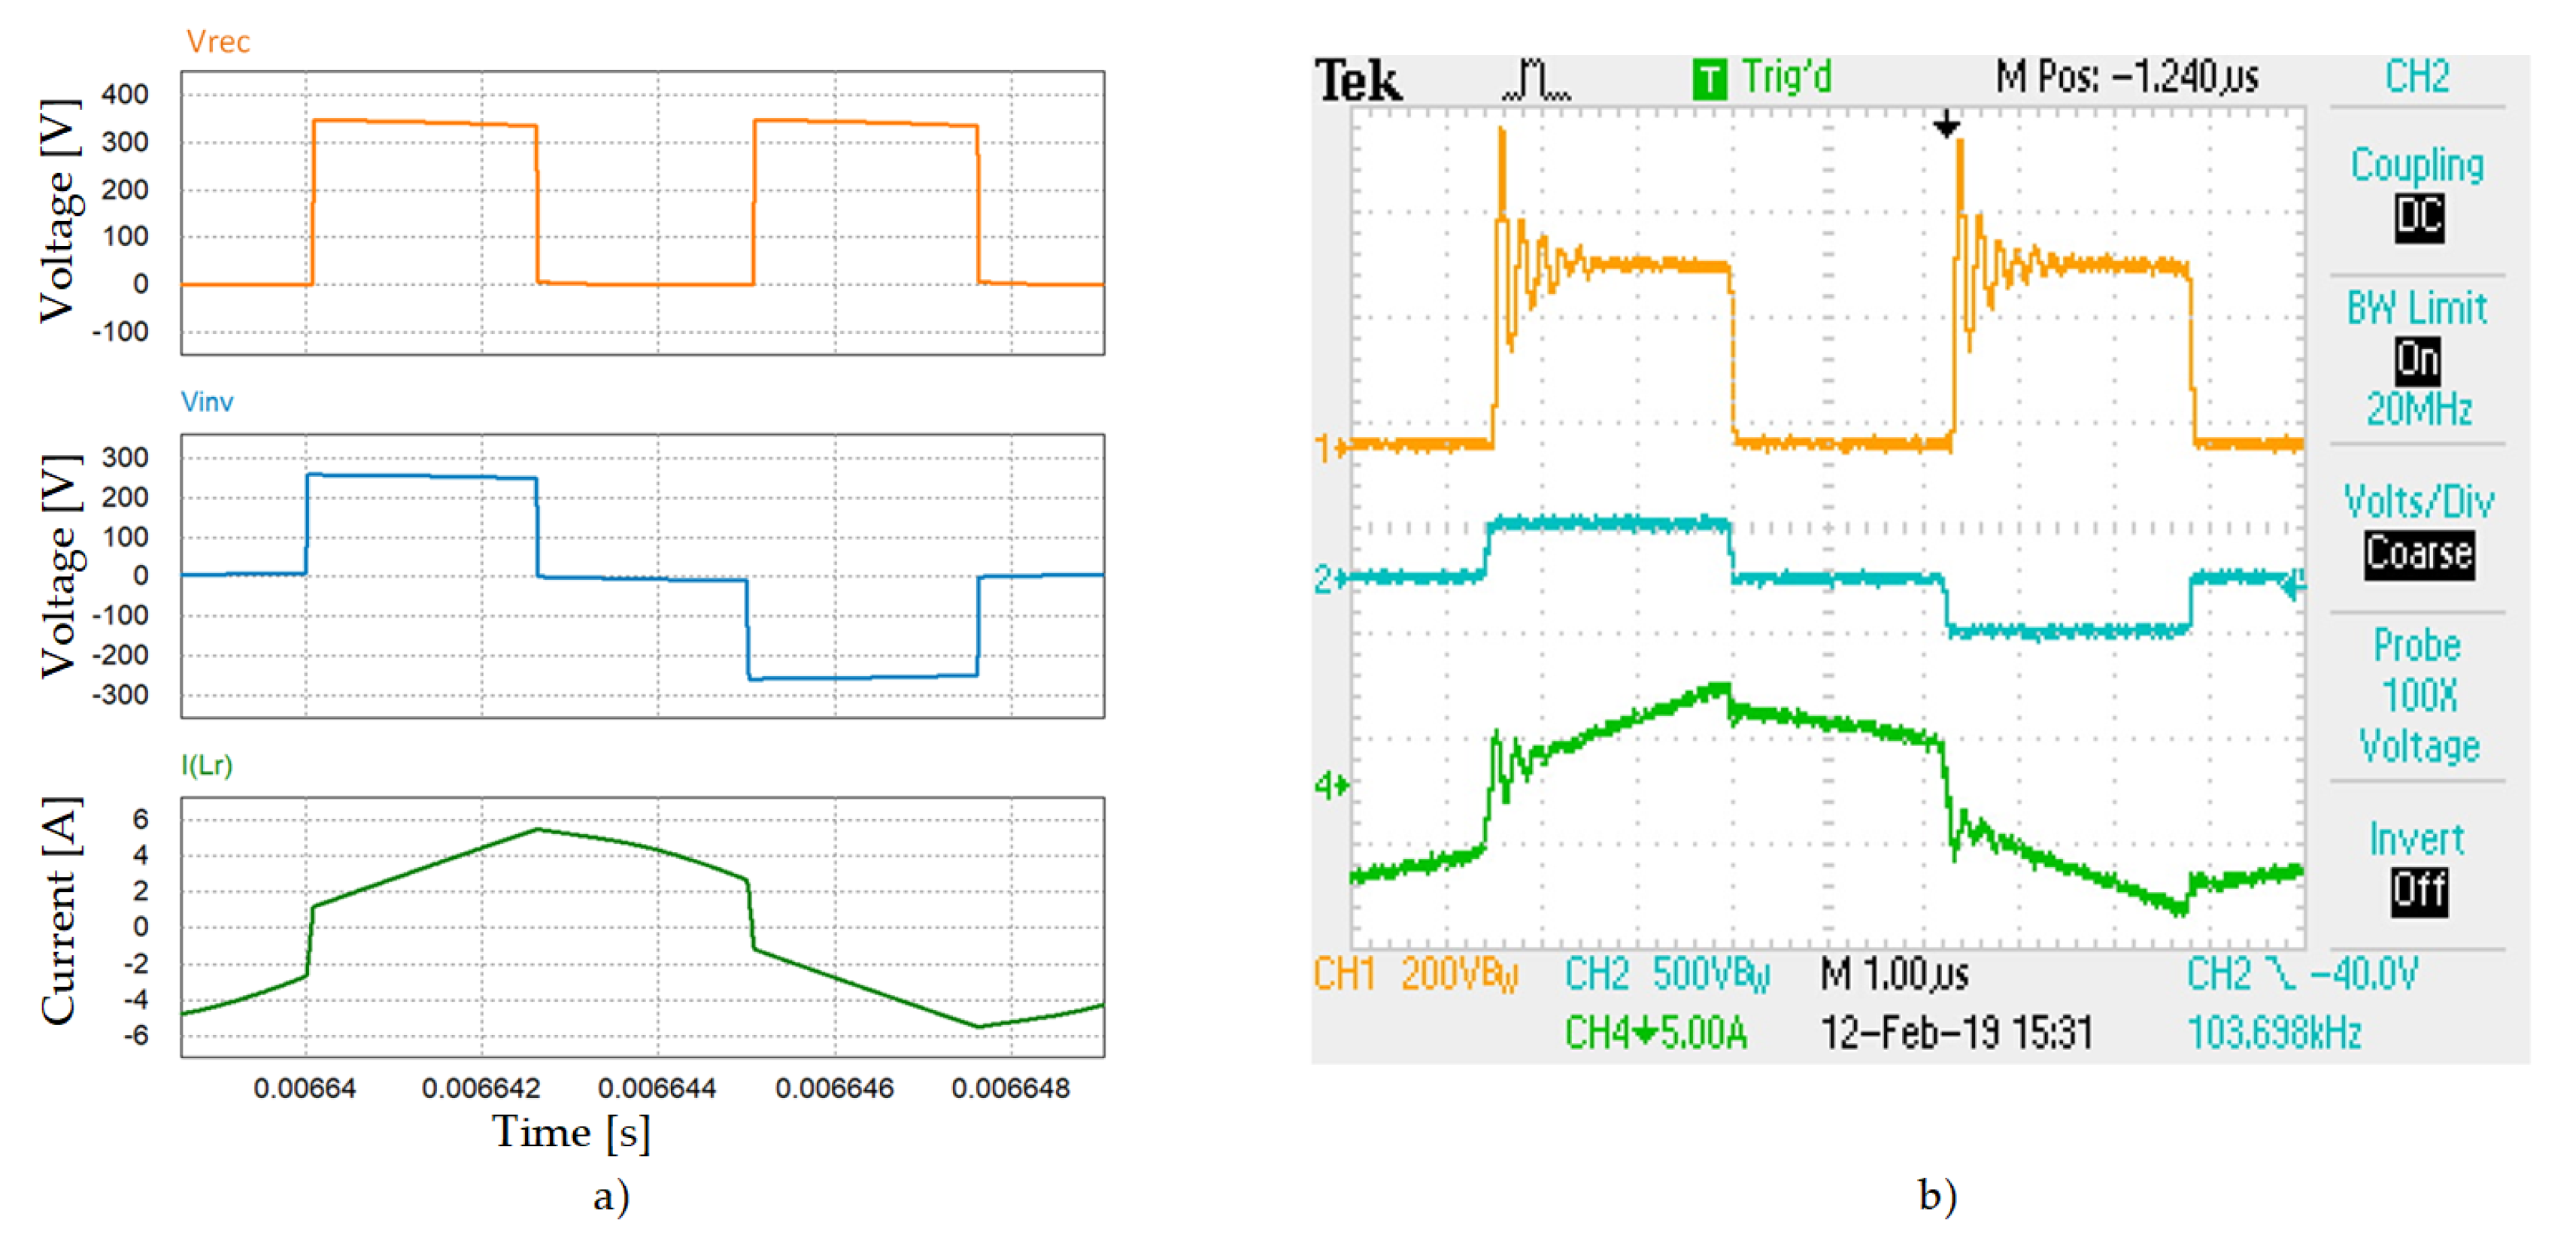
Figure 3.
Measured waveforms for the designed phase-shift full bridge converter (PSFB) converter.
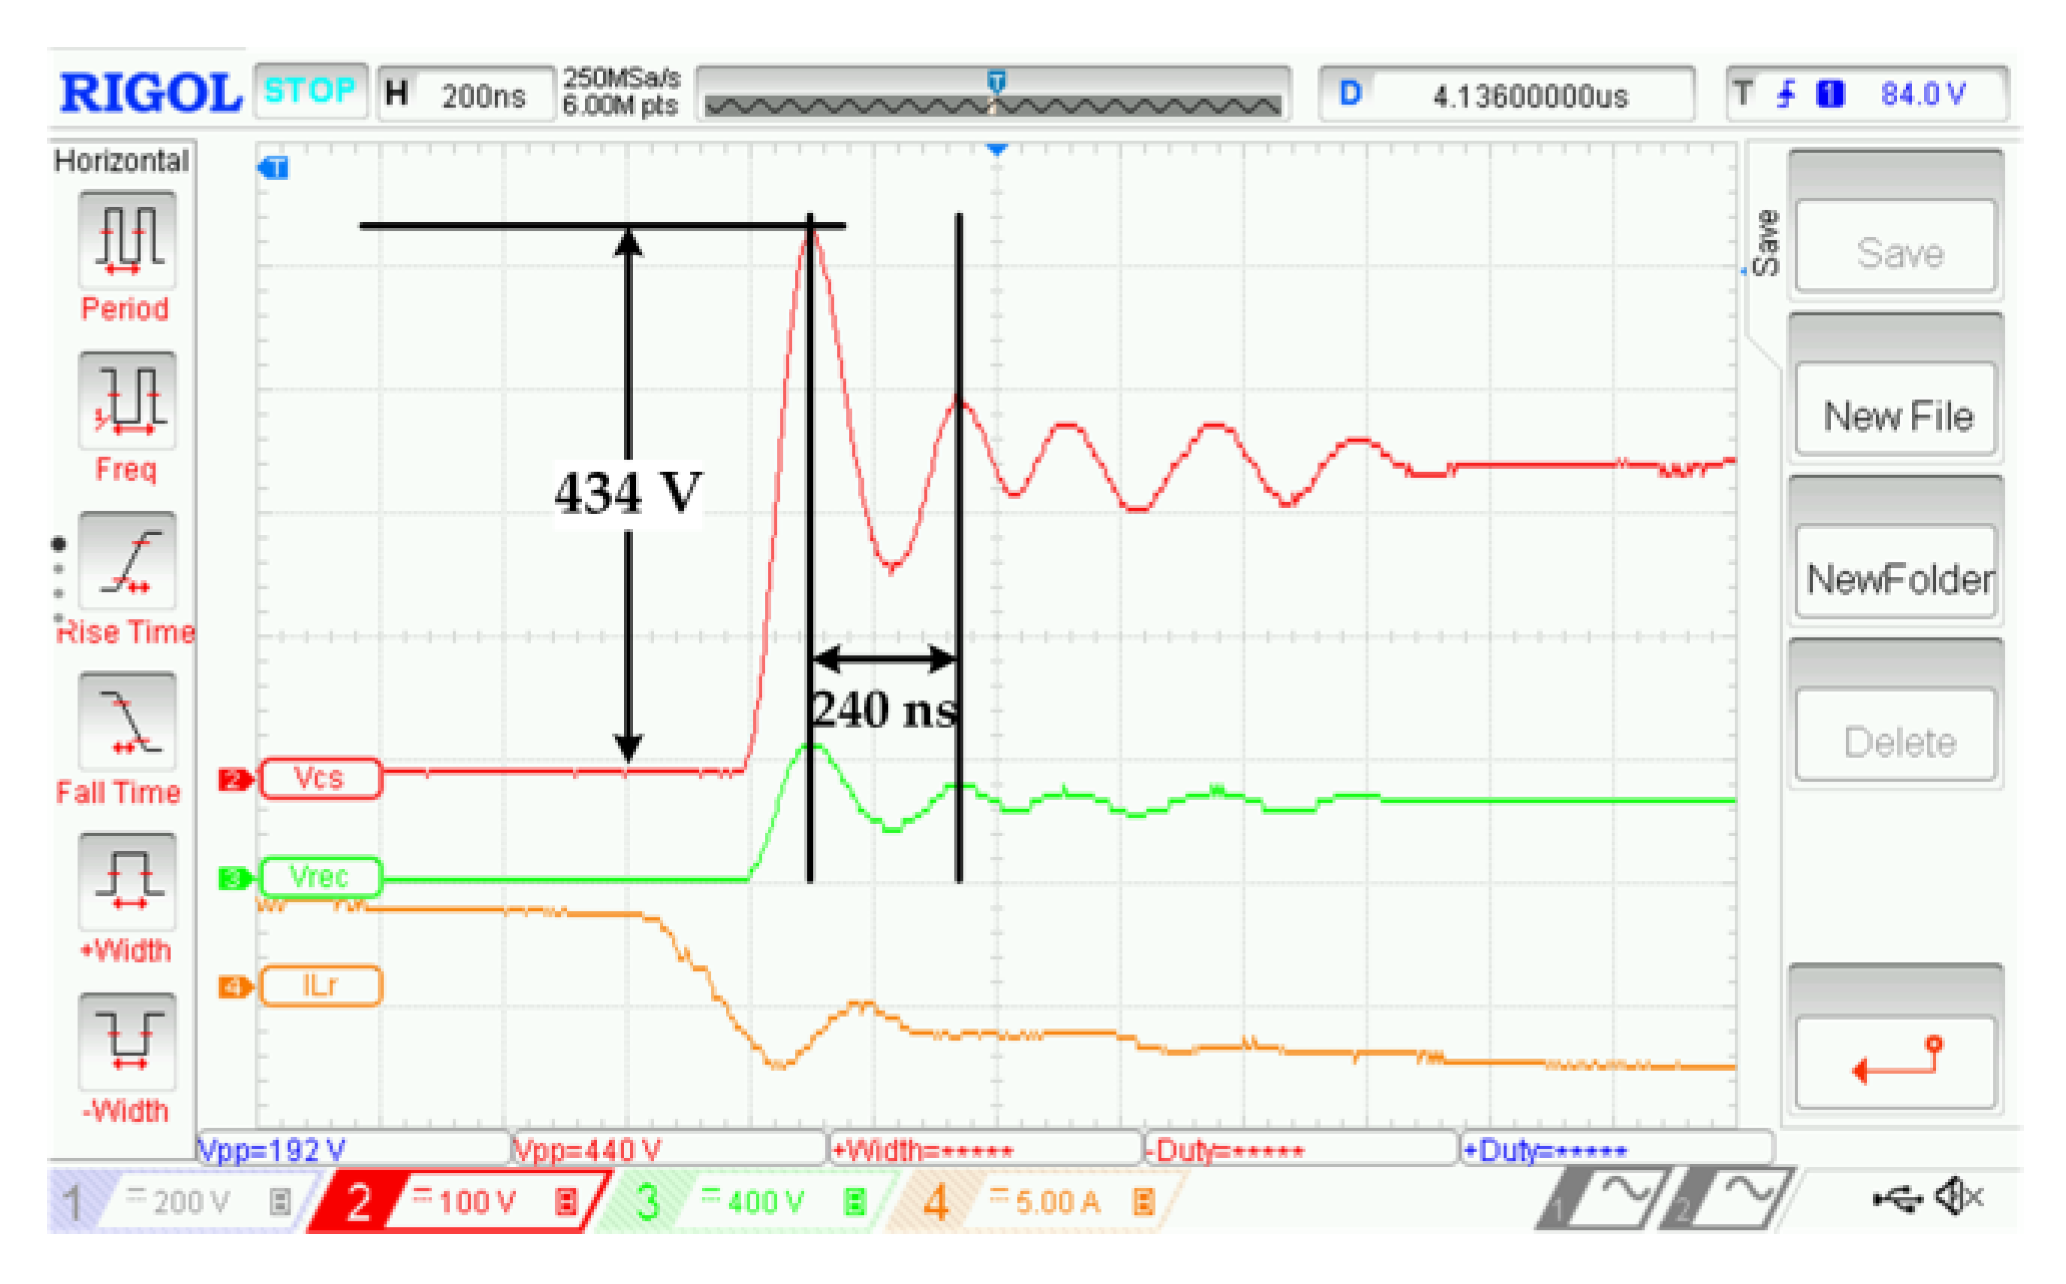
Figure 4.
The time needed to discharge the Cr capacitor.

Figure 5.
Transformer models: (a) Equivalent electric transformer model with all elements referred to the secondary side; (b) simplified model of the transformer with C12 neglected; (c) simplified model of the converter with Lr and Csec introduced.
Figure 5.
Transformer models: (a) Equivalent electric transformer model with all elements referred to the secondary side; (b) simplified model of the transformer with C12 neglected; (c) simplified model of the converter with Lr and Csec introduced.
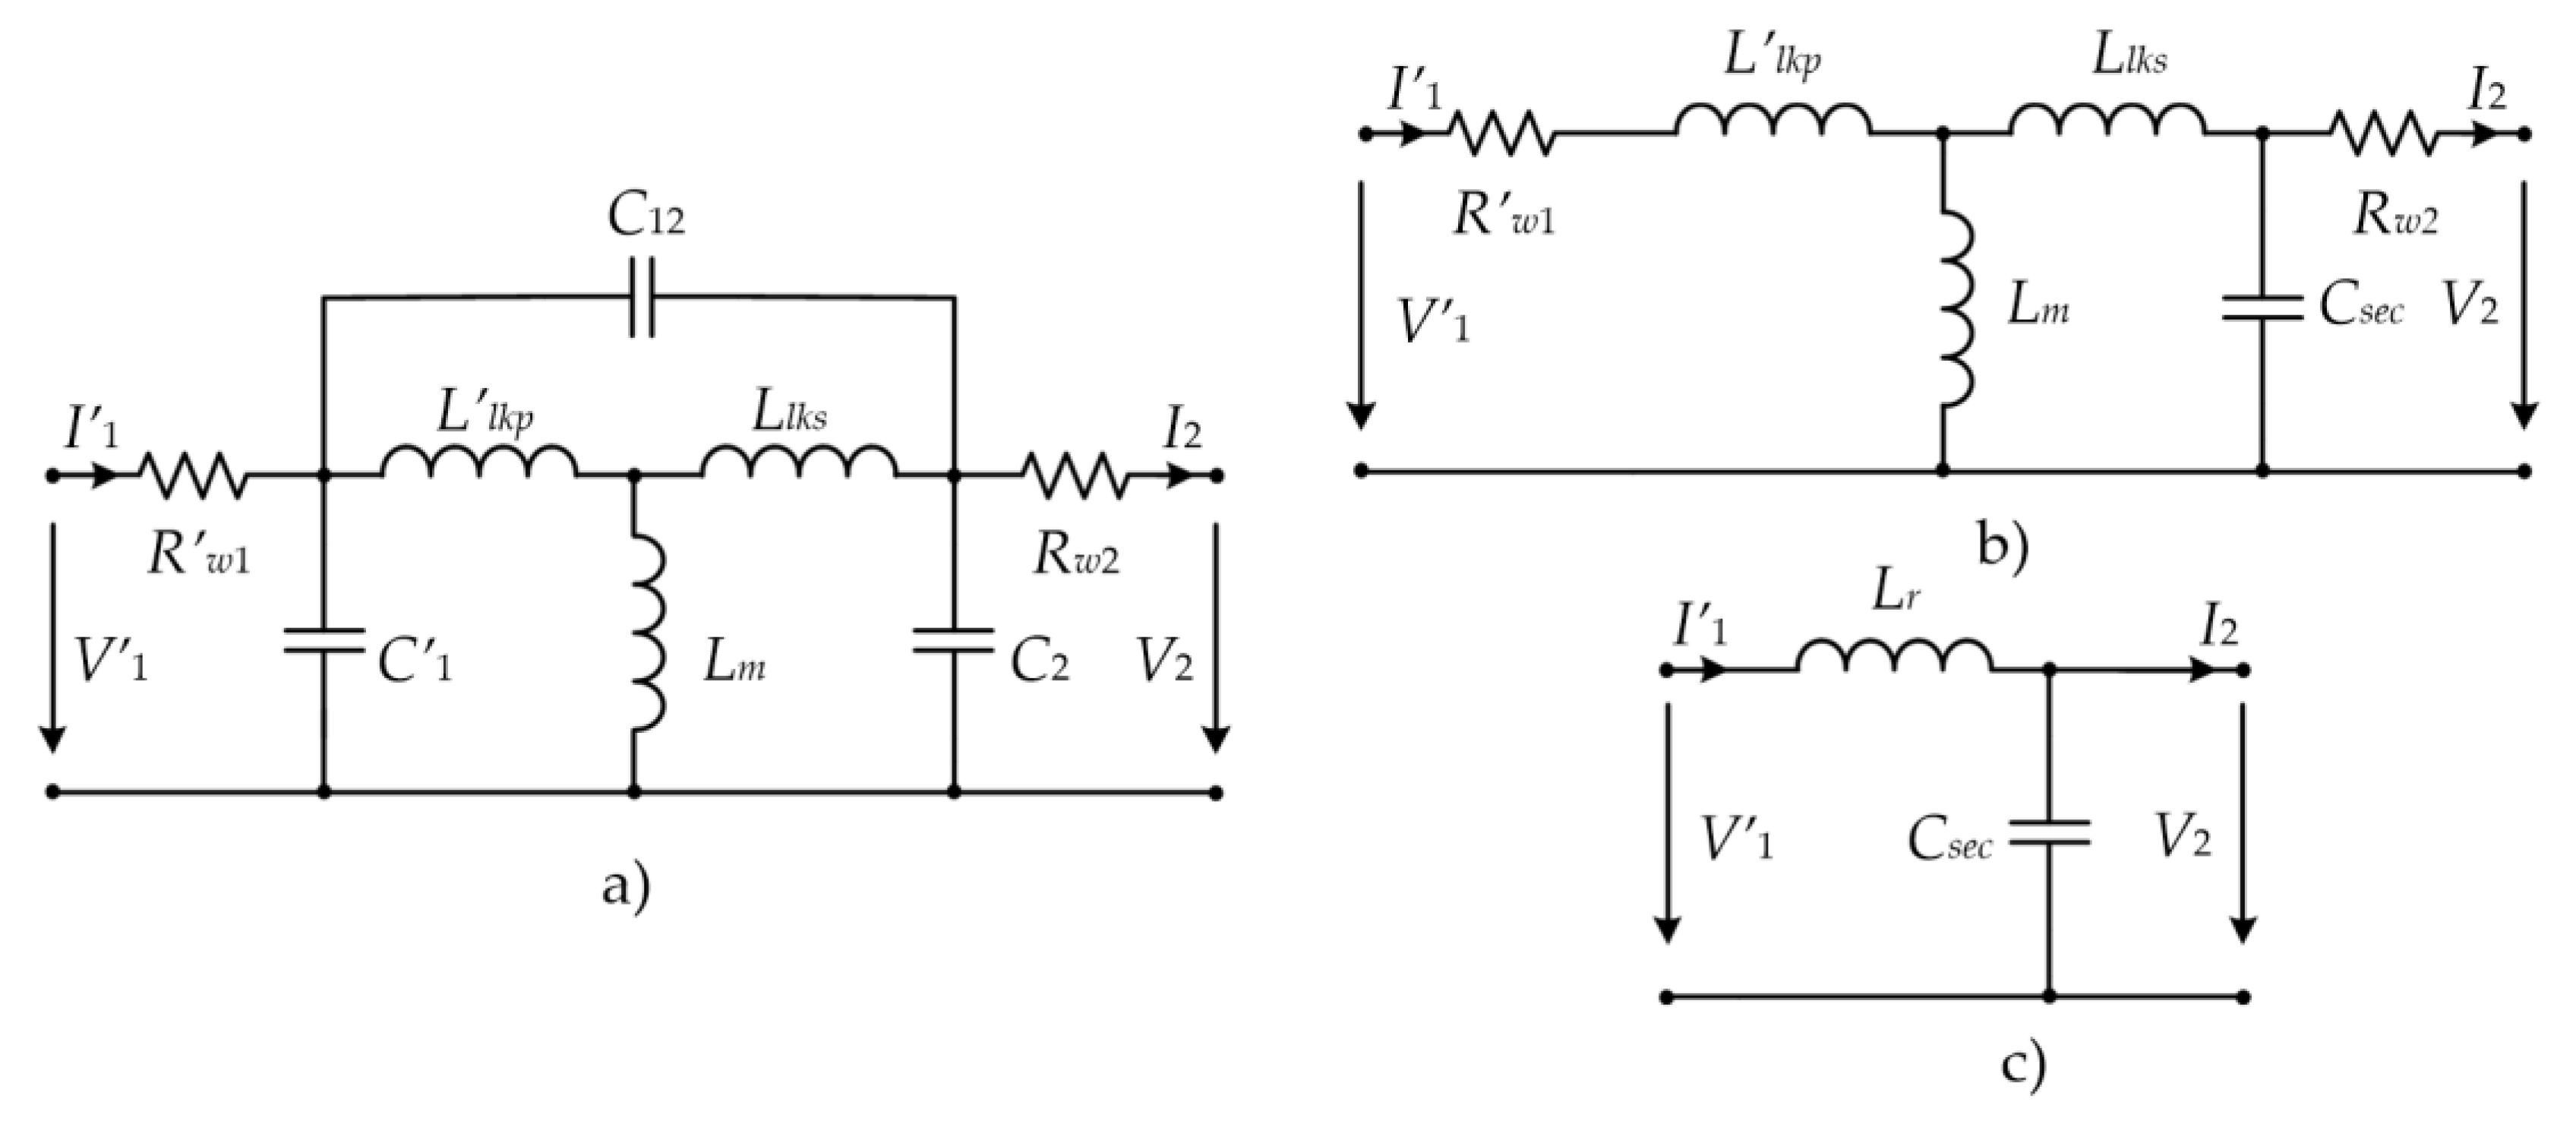
Figure 6.
A simplified model of the PSFB converter.
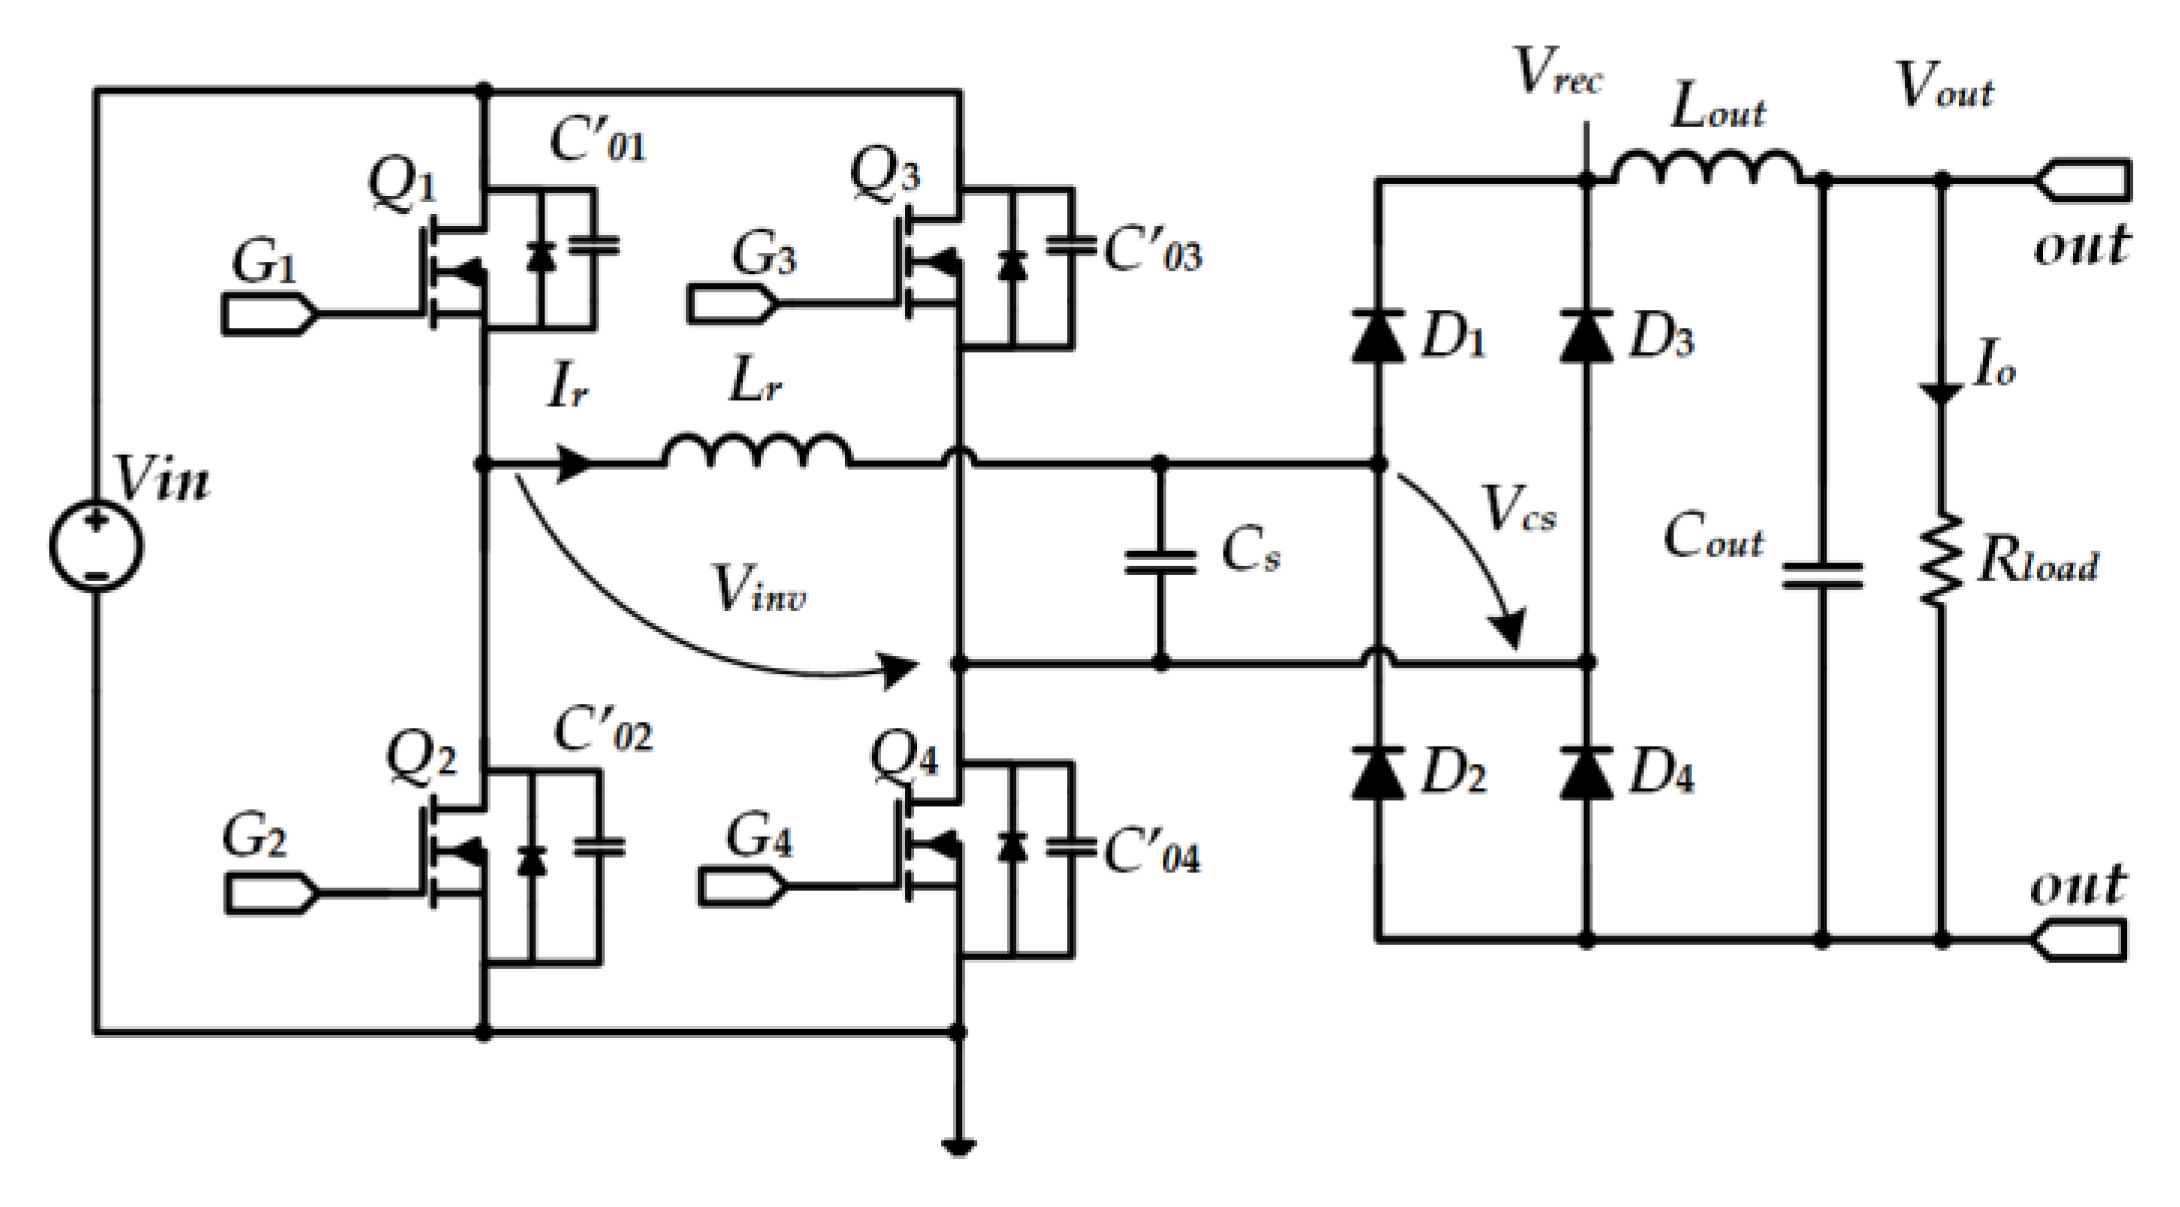
Figure 7.
Qualitative operation waveforms of the converter.
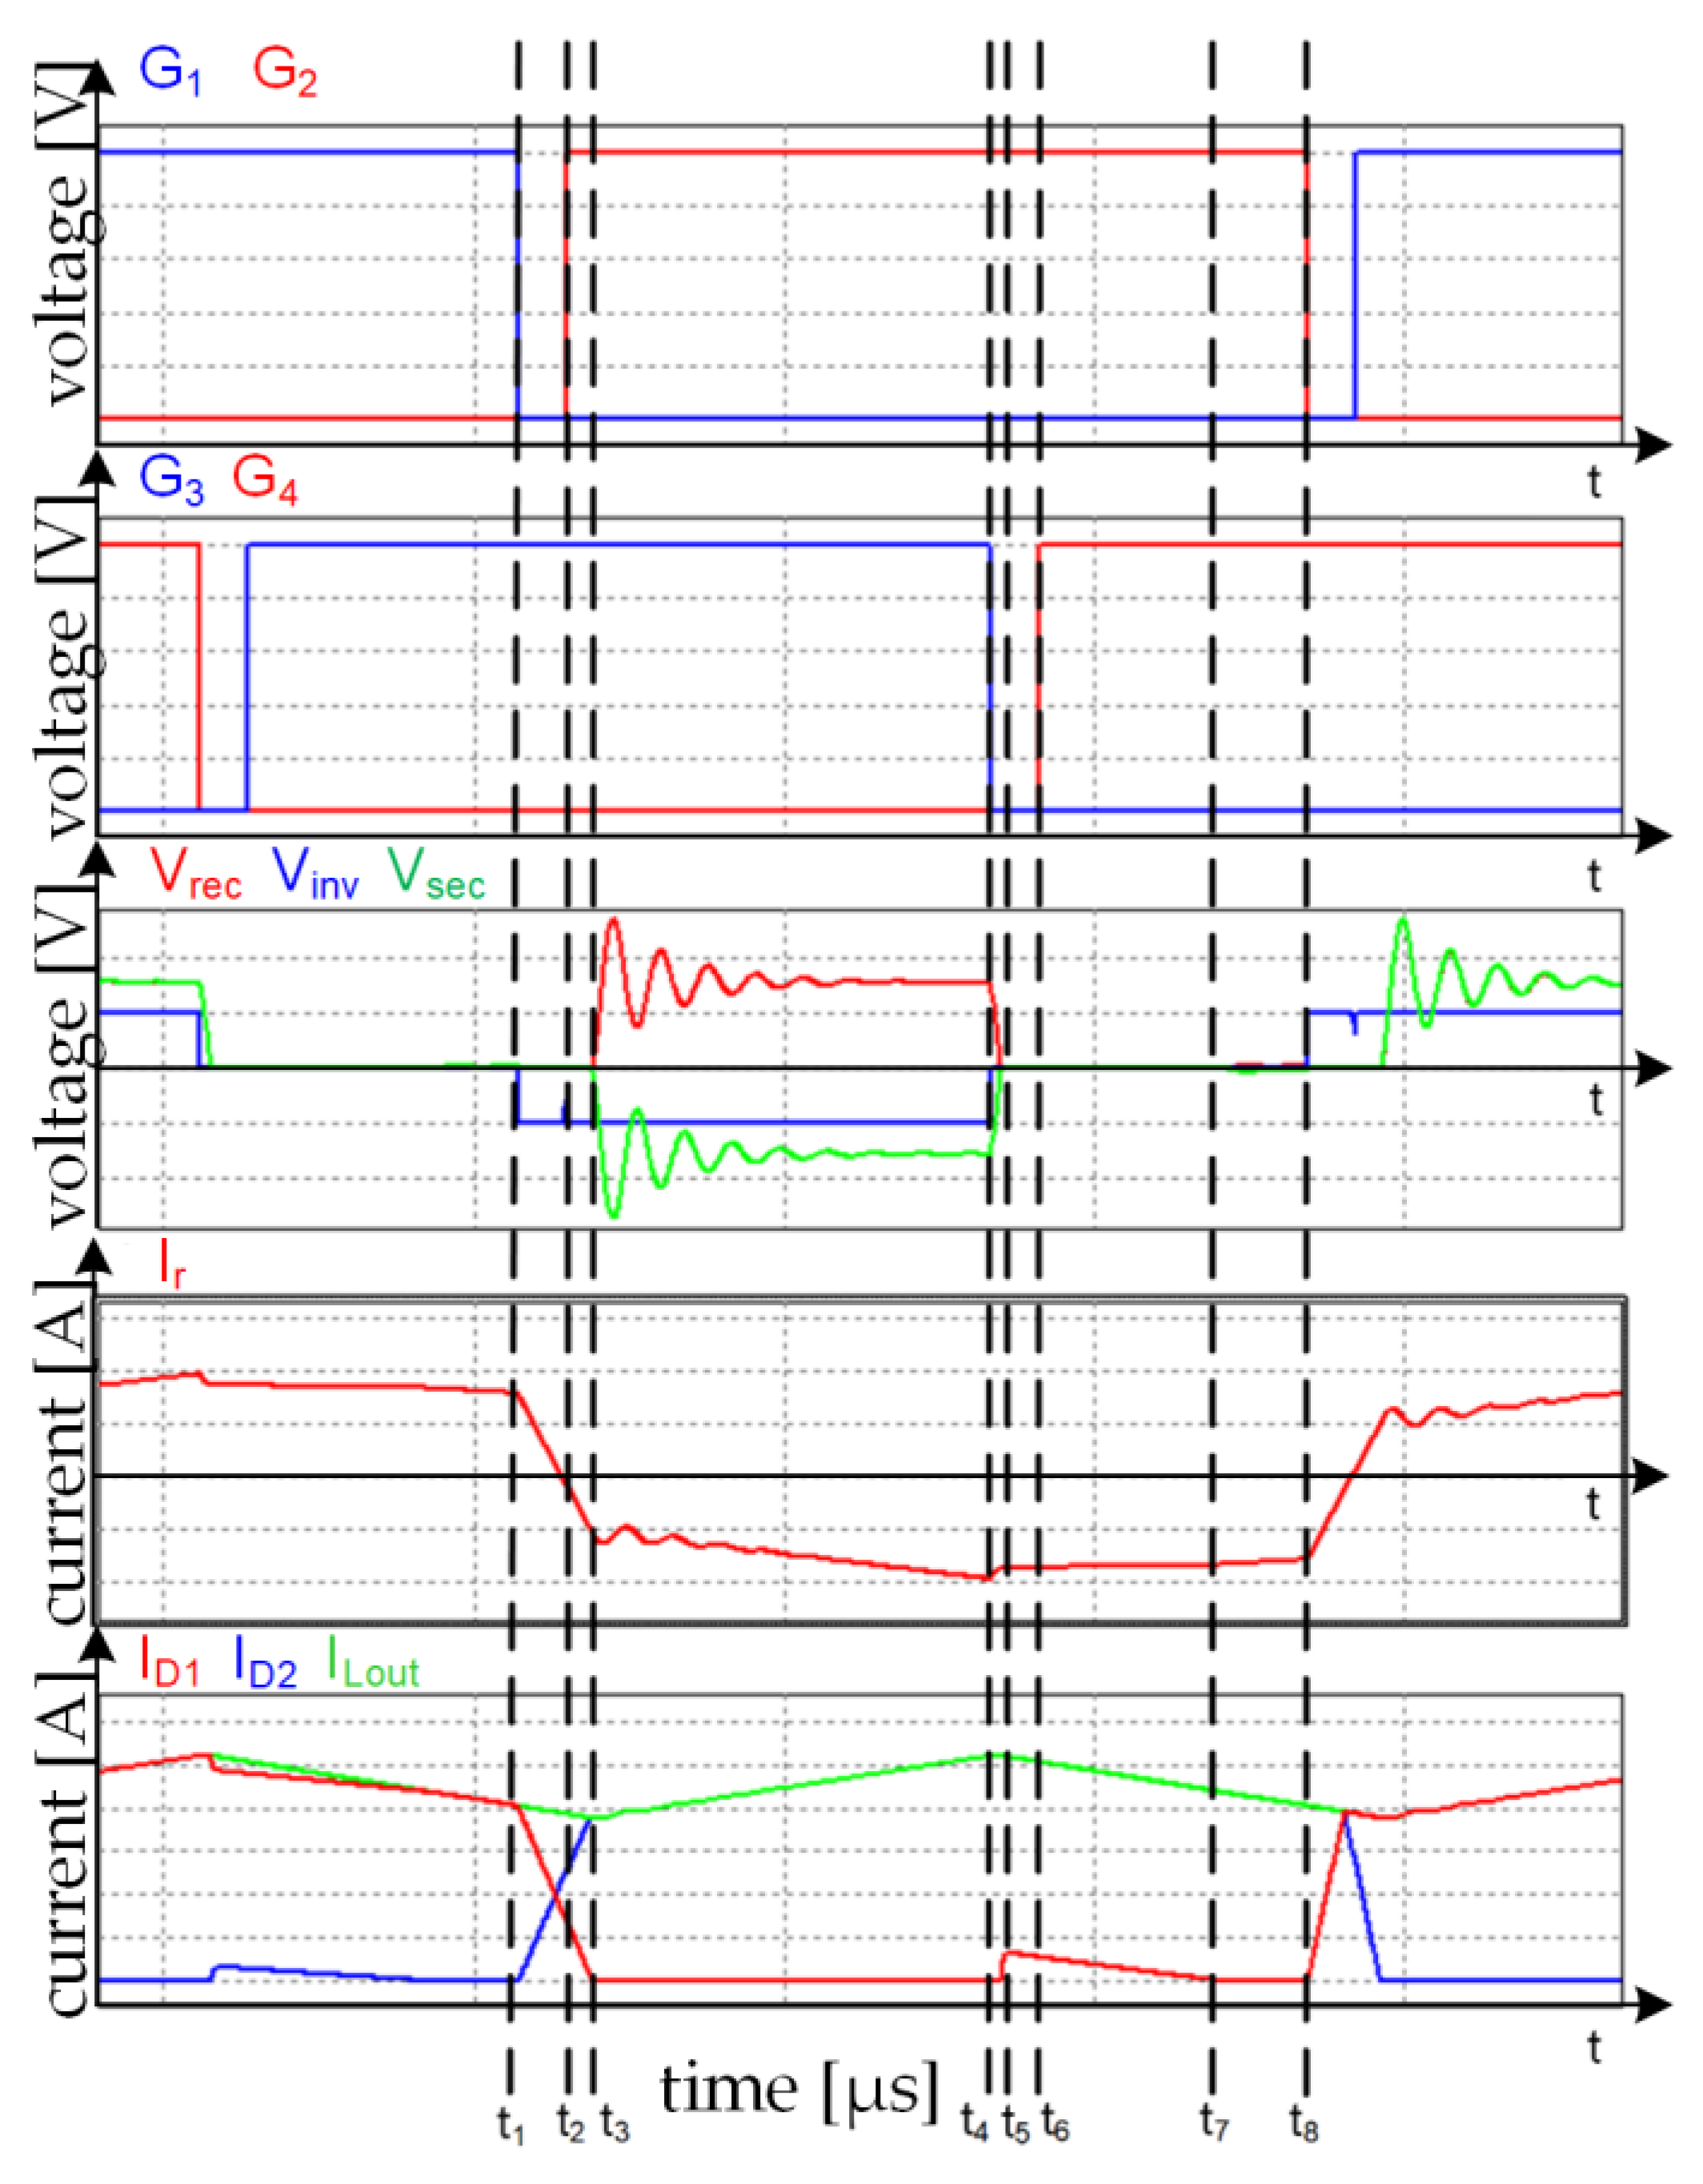
Figure 8.
Laplace equivalent circuit corresponding to the discharge of Cr capacitor.
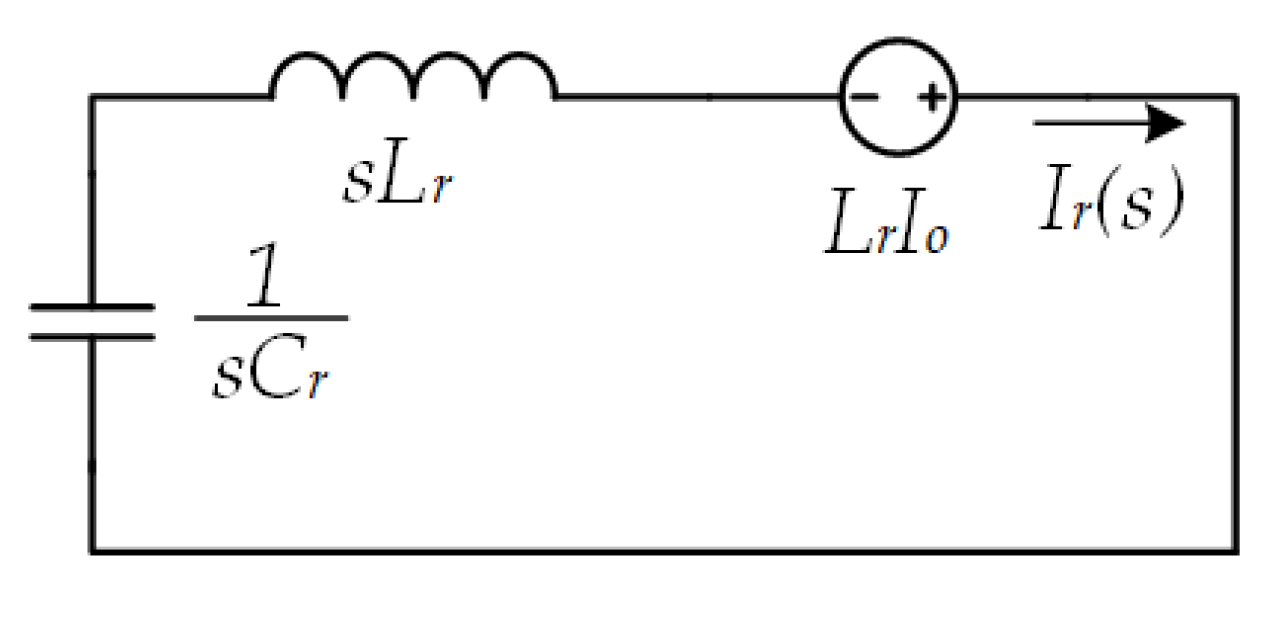
Figure 9.
Spice equivalent schematic for the discharge of Cr.

Figure 10.
Spice simulation results for the discharge of Cr.
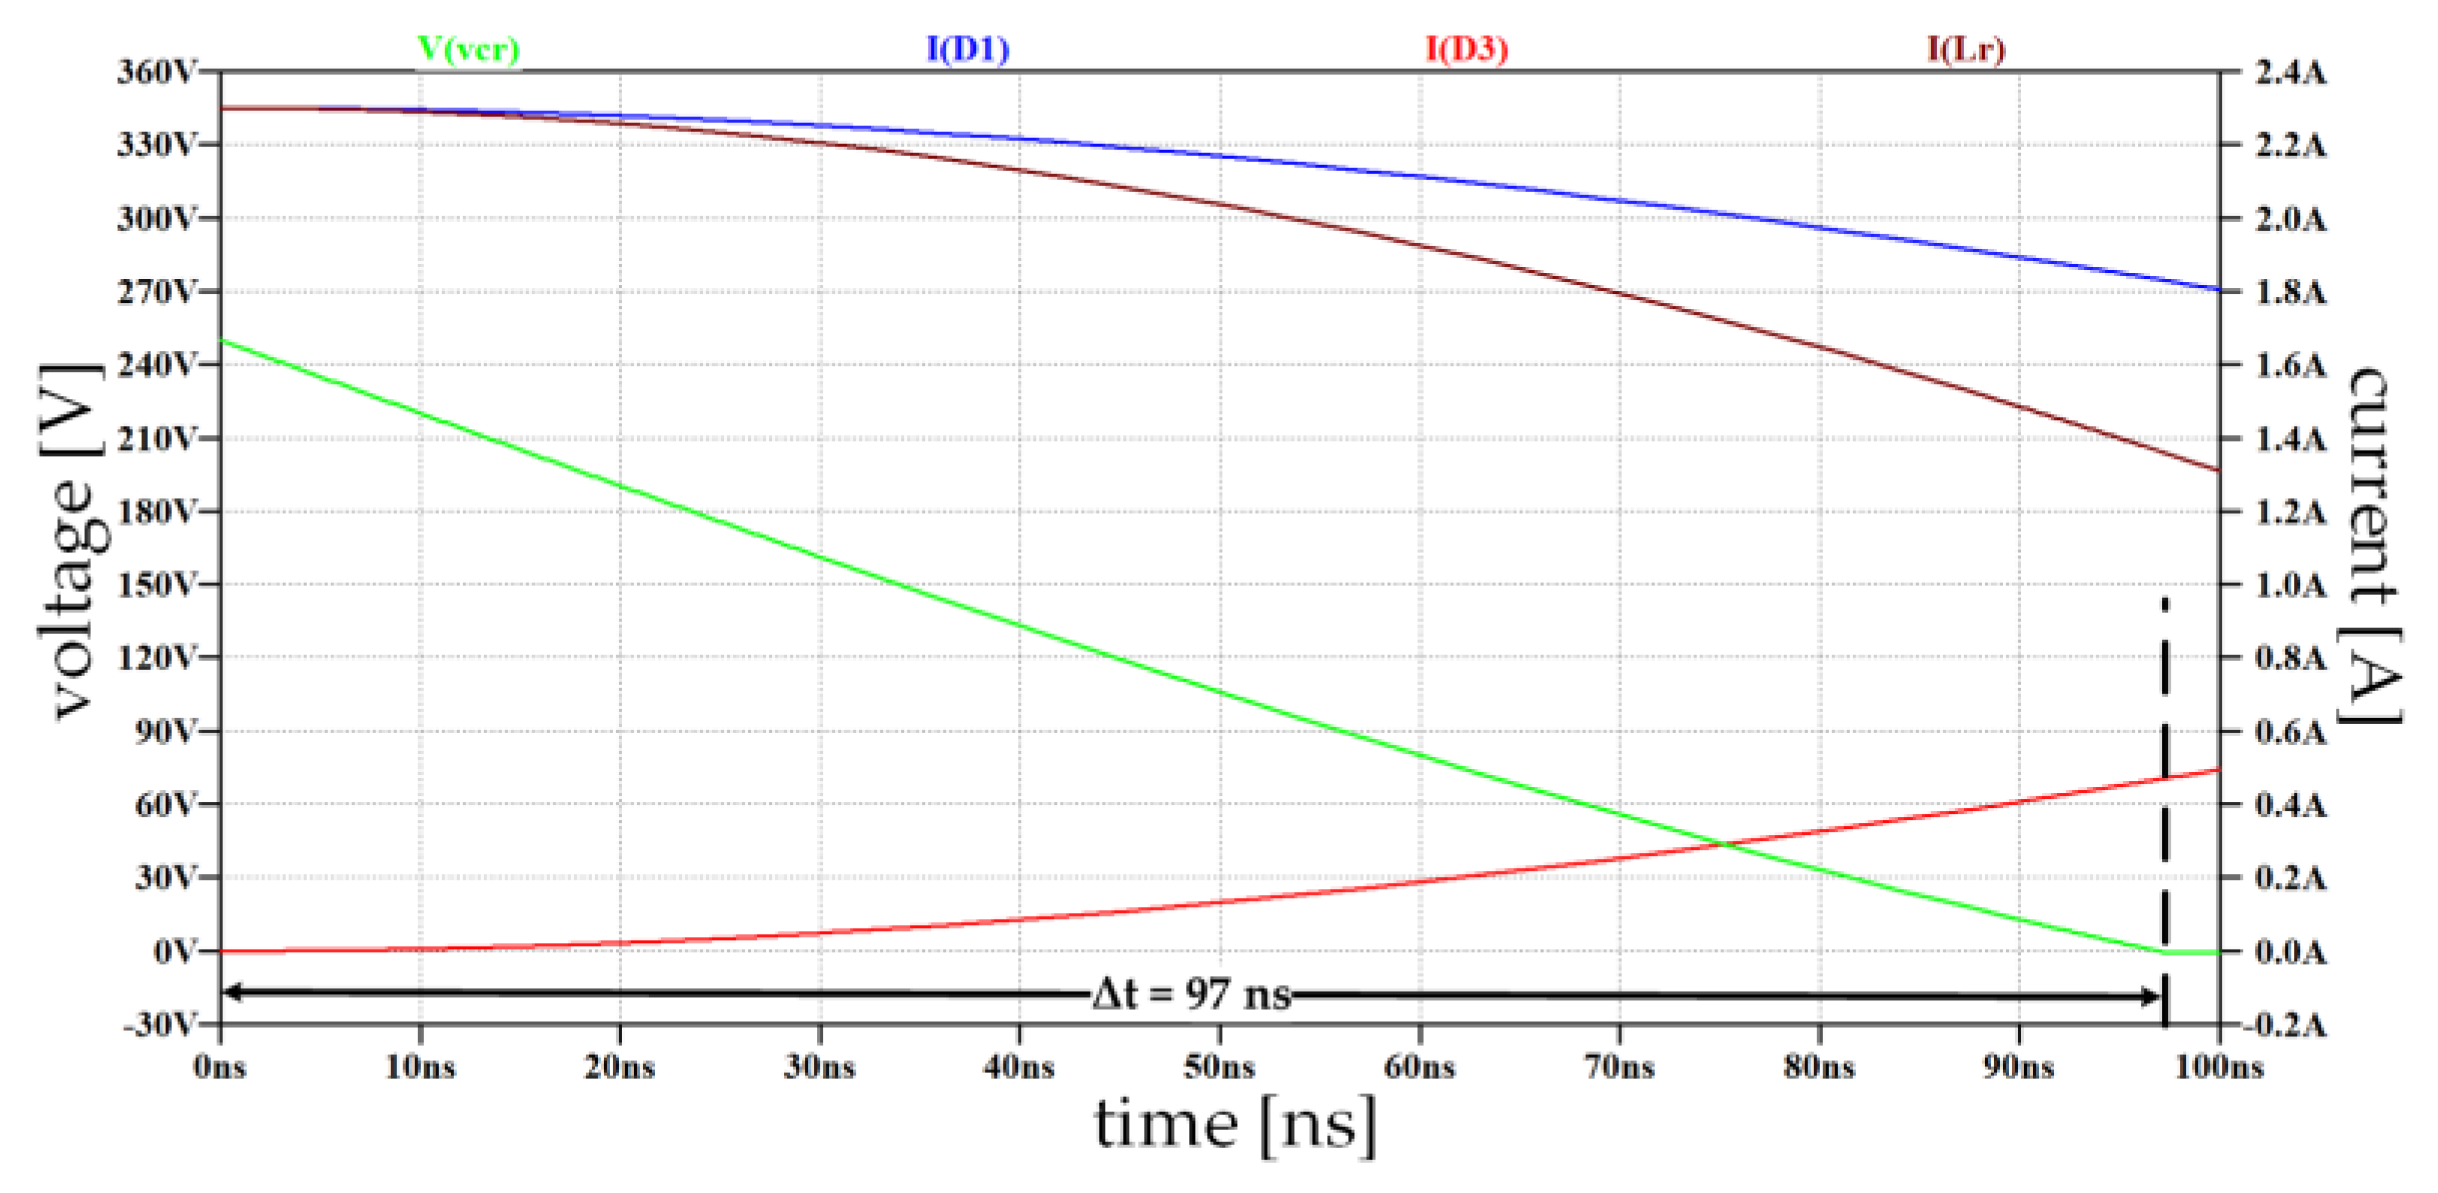
Figure 11.
Laplace equivalent circuit corresponding to the discharge of Cr and Cs.

Figure 12.
Spice equivalent schematic for t1-t2 interval.

Figure 13.
Spice simulation results for t1-t2 interval.
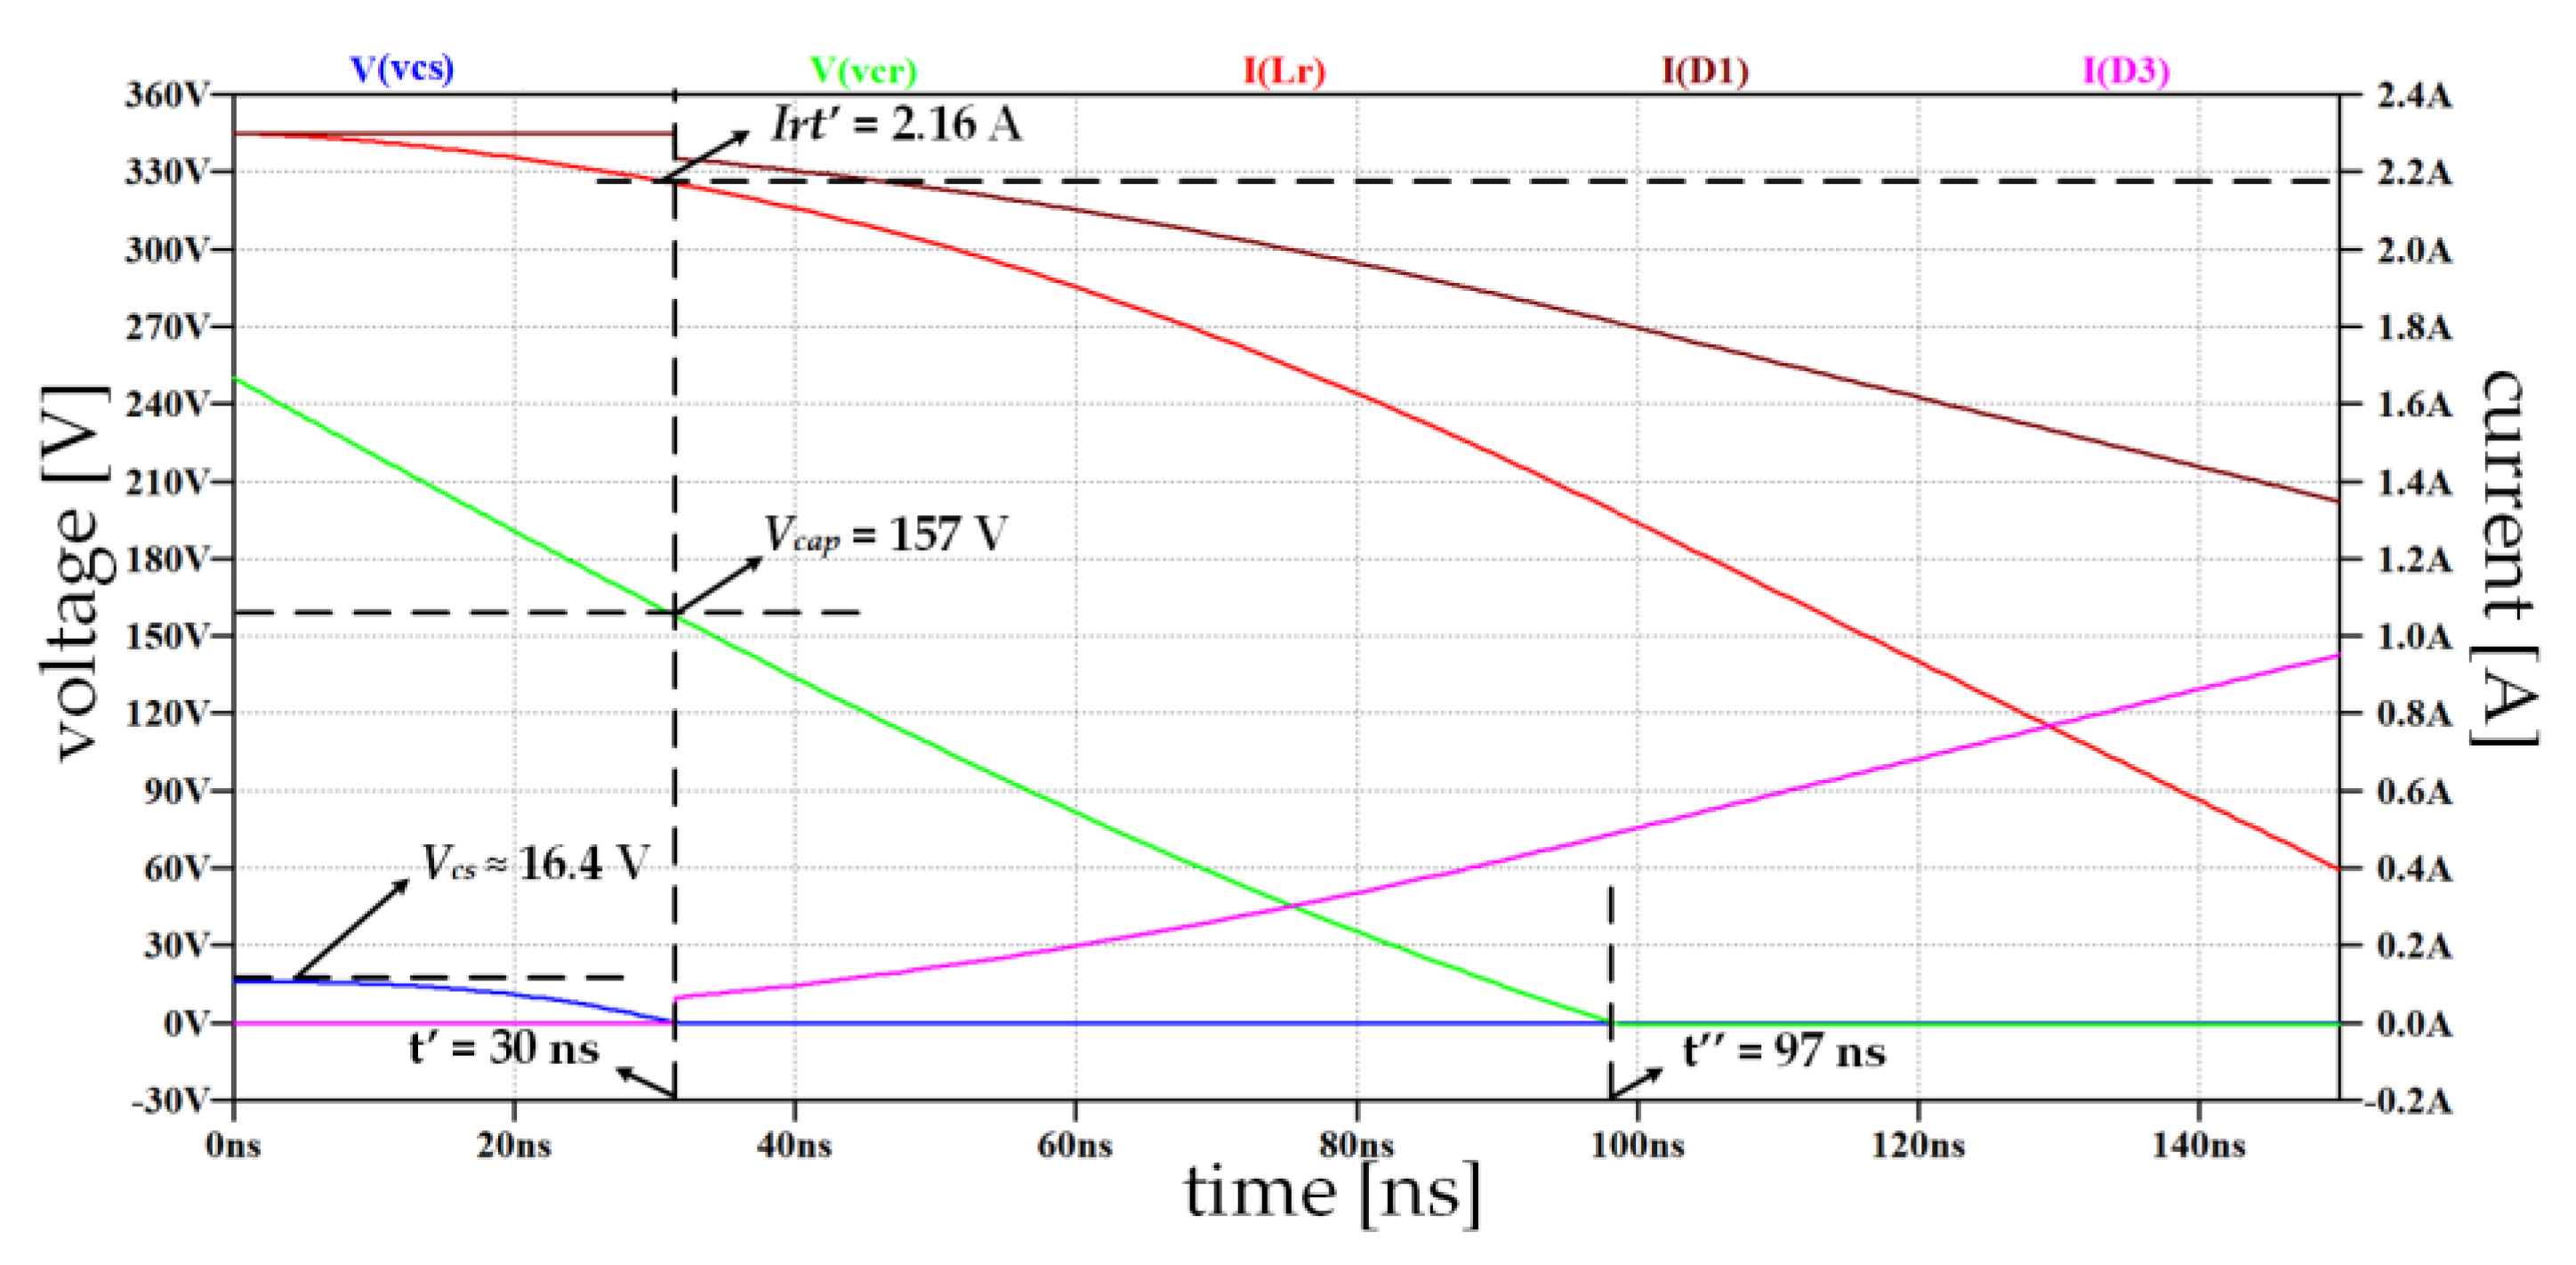
Figure 14.
Experimental results for t1-t2 interval.
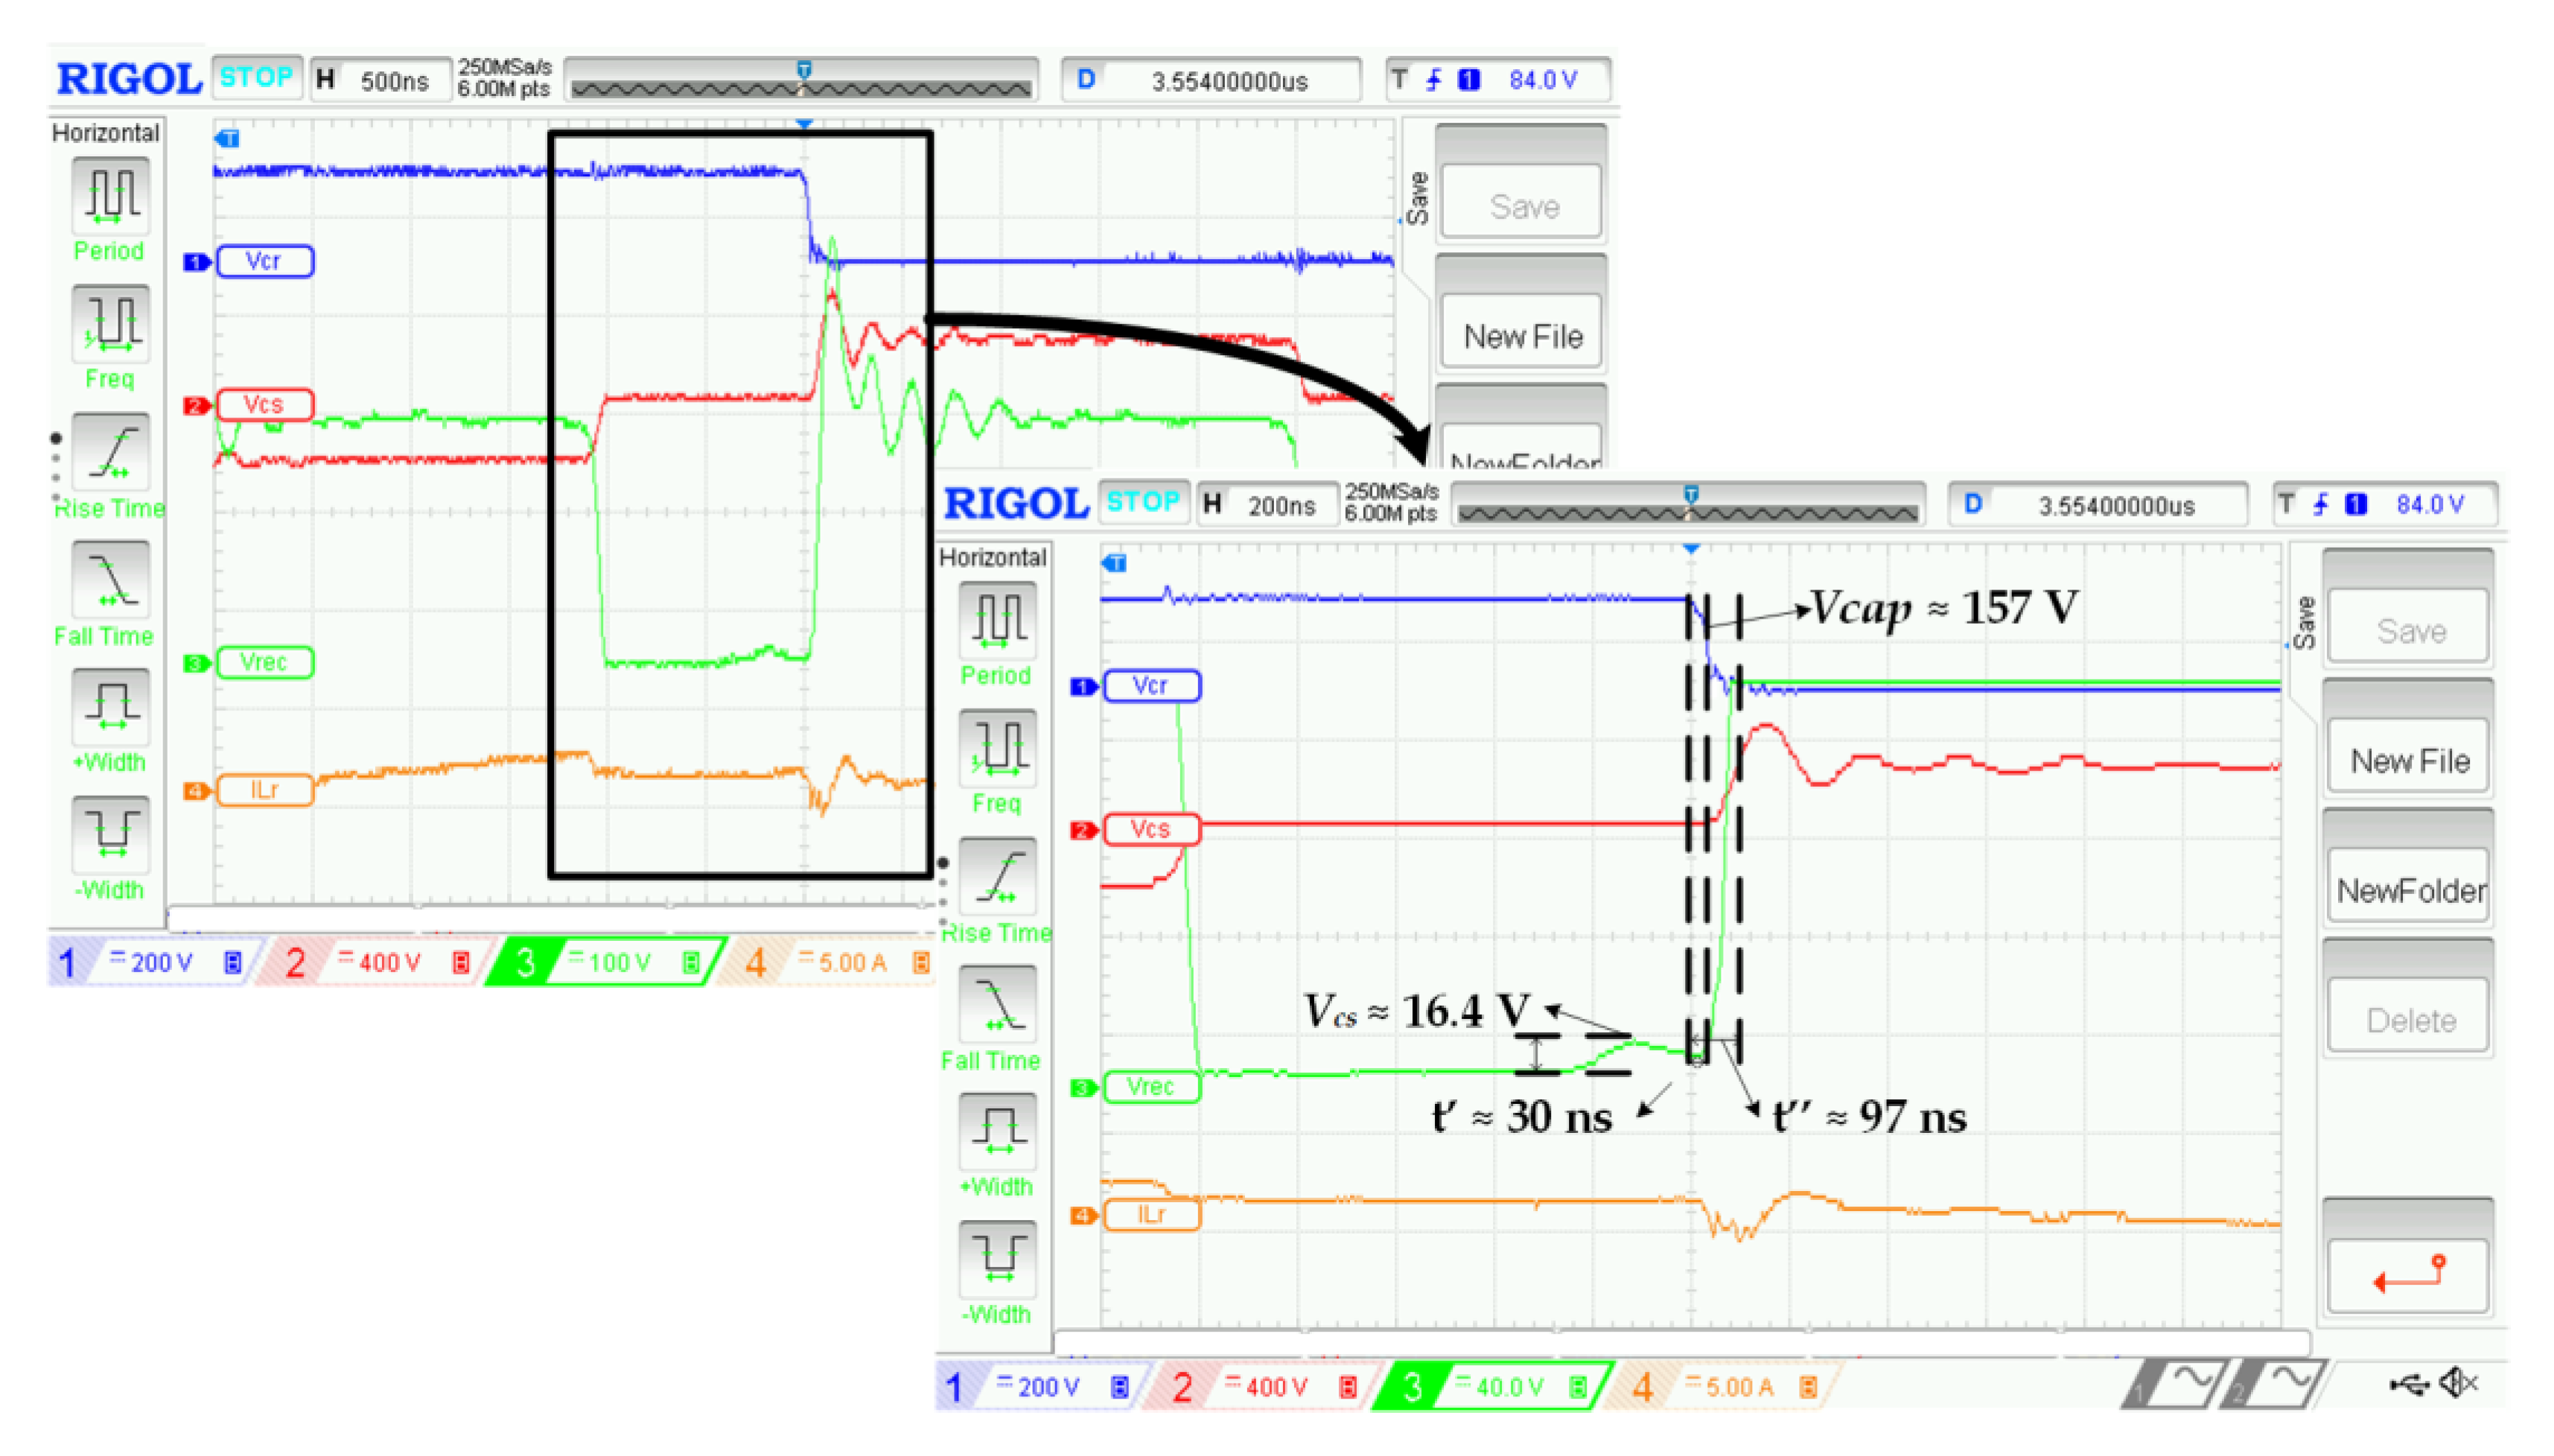
Figure 15.
Laplace equivalent circuit corresponding to Cs discharged.
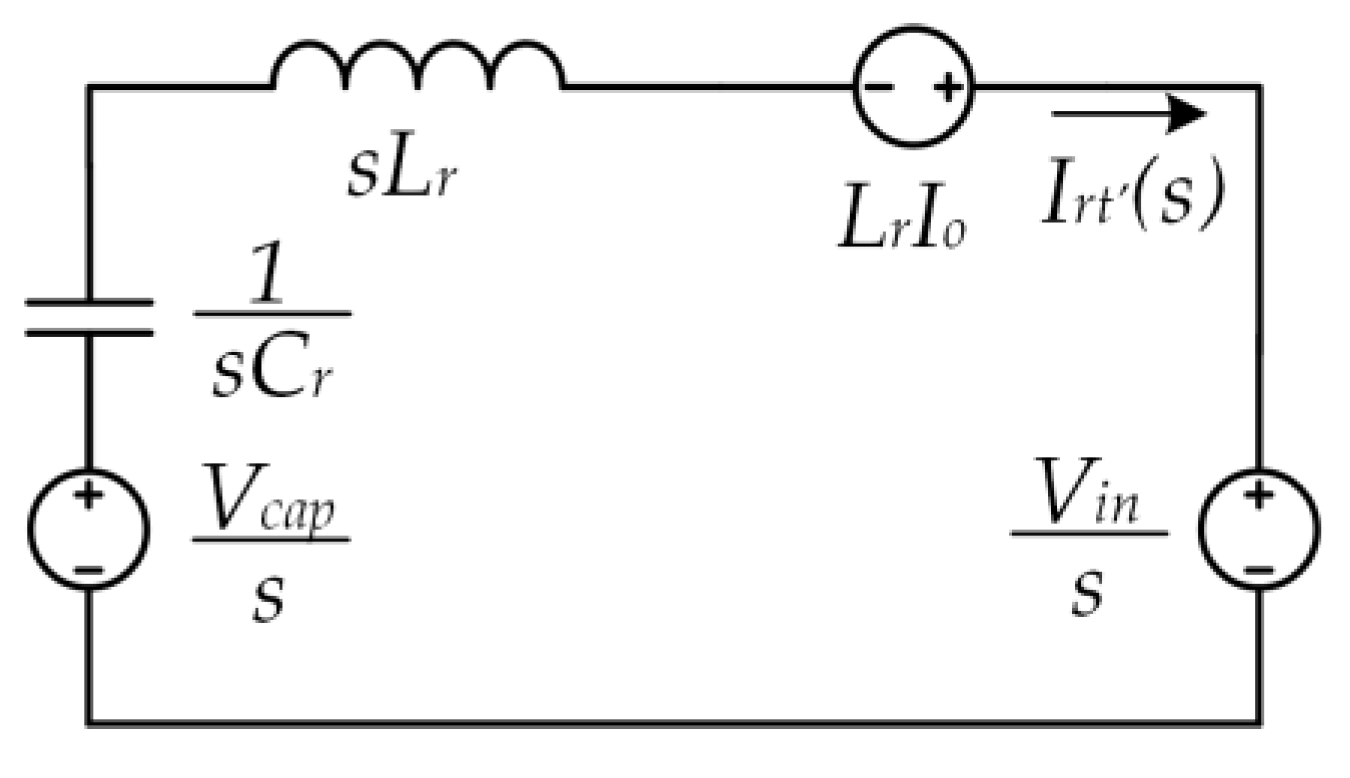
Figure 16.
Laplace equivalent circuit corresponding to [t3-t4] time interval.

Figure 17.
Spice equivalent schematic immediately after t3.

Figure 18.
Spice simulation results immediately after t3.
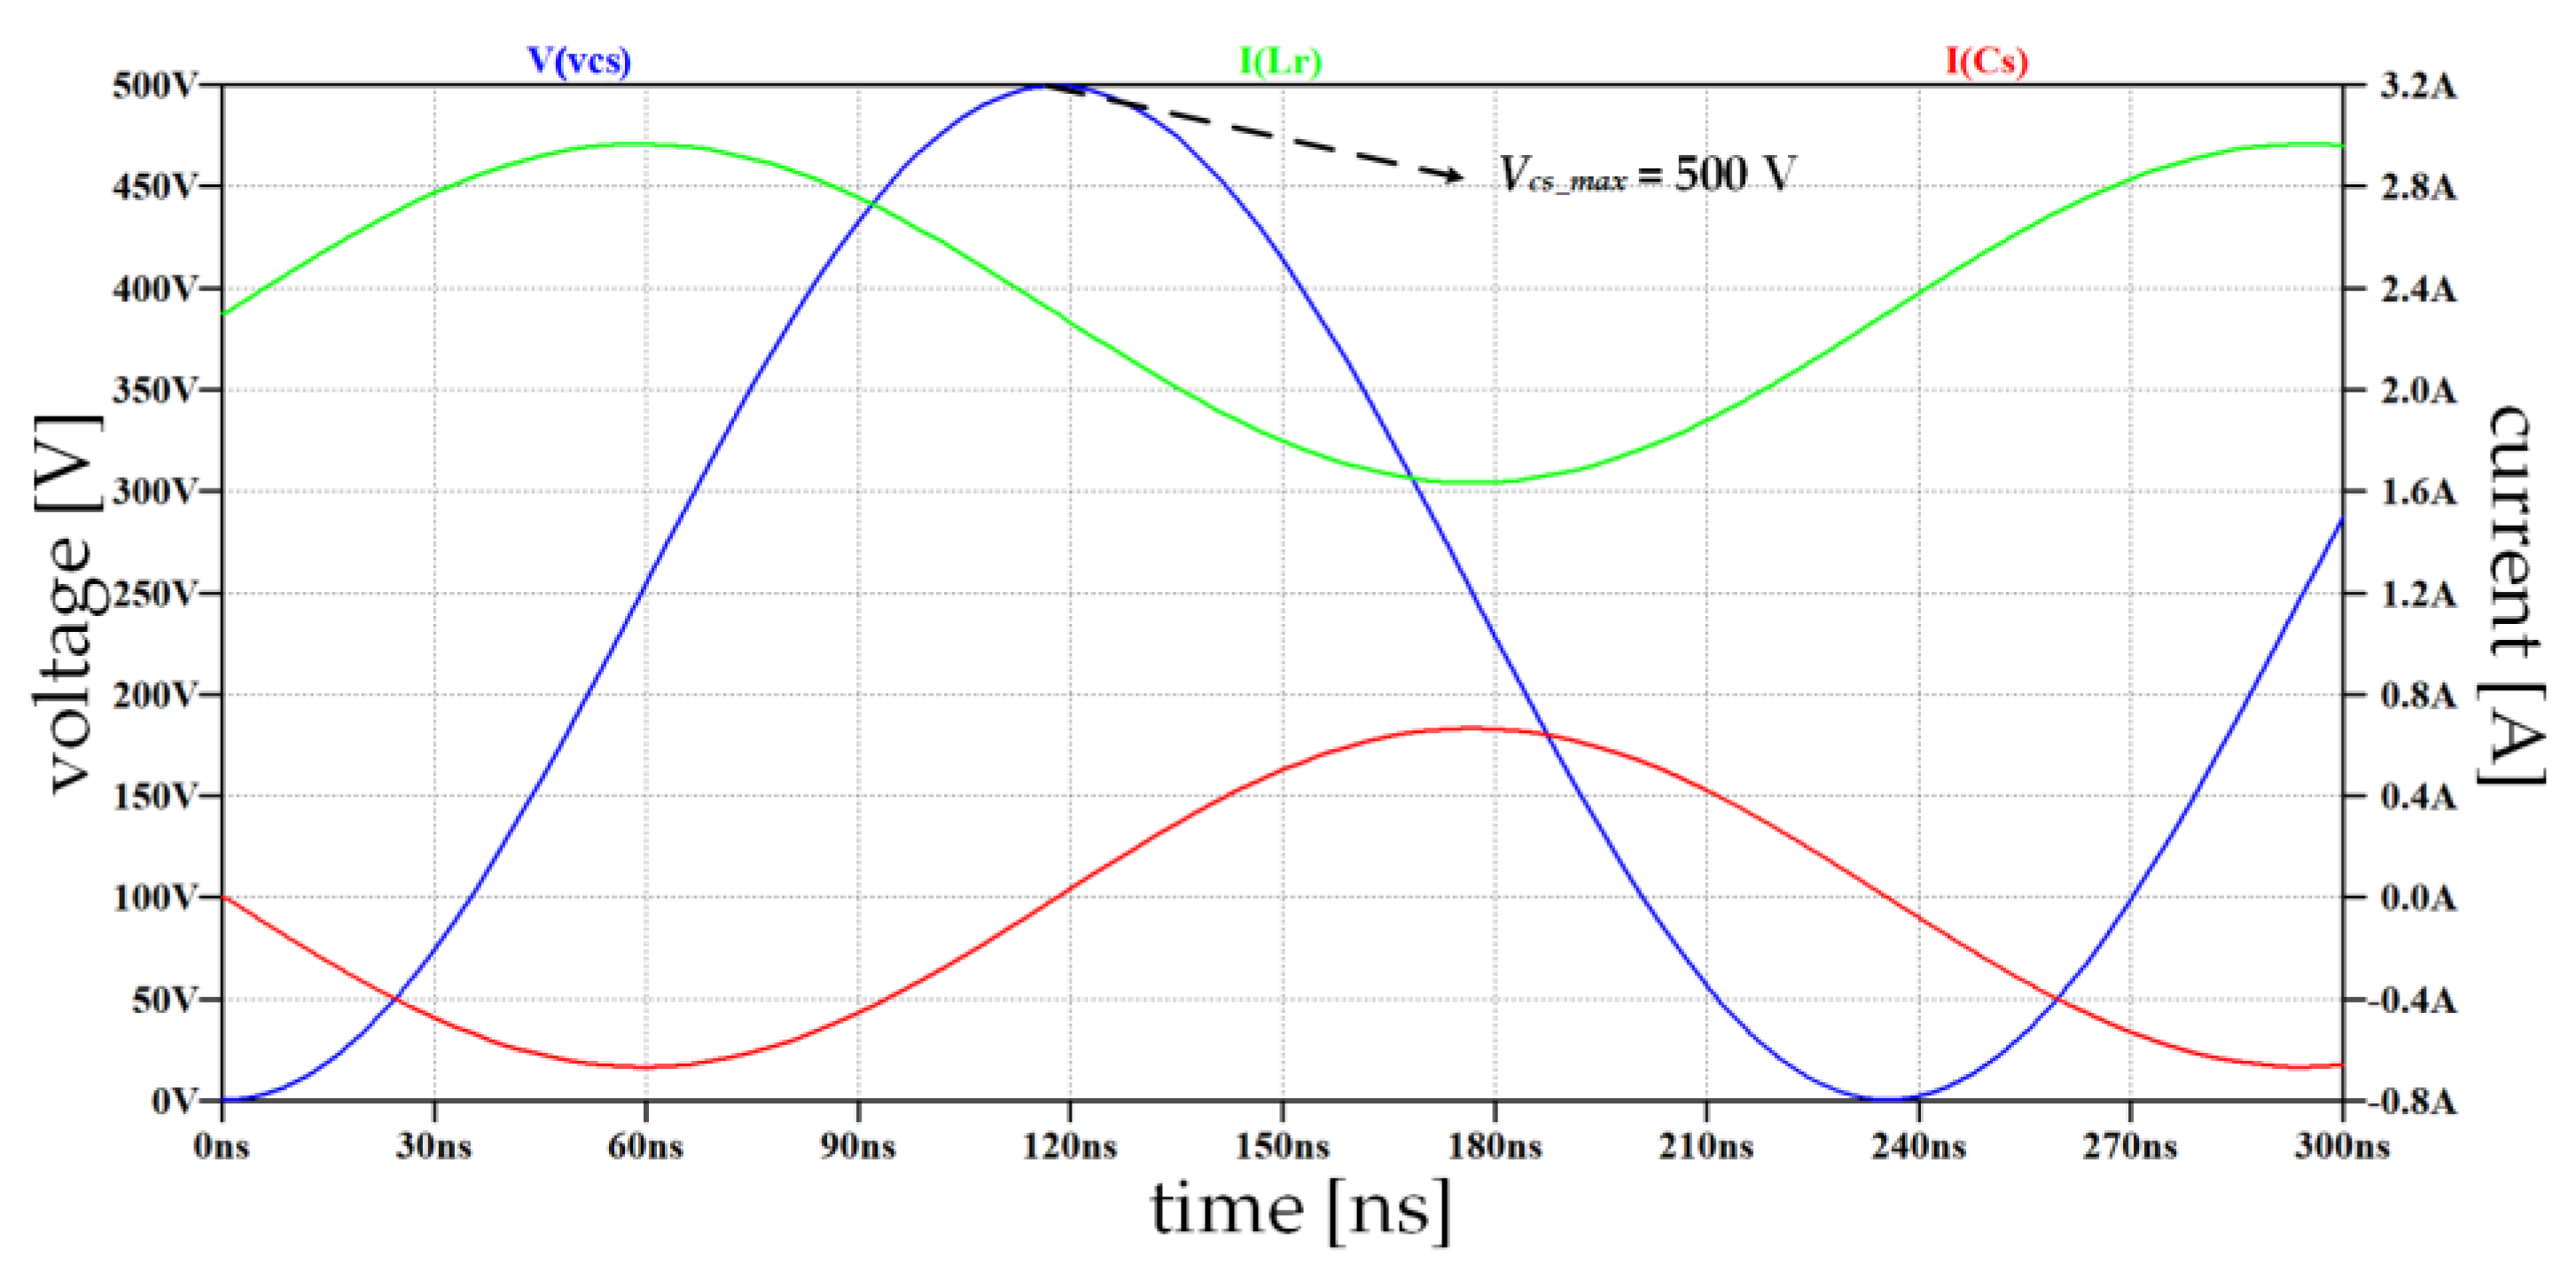
Figure 19.
Measurement results immediately after t3.
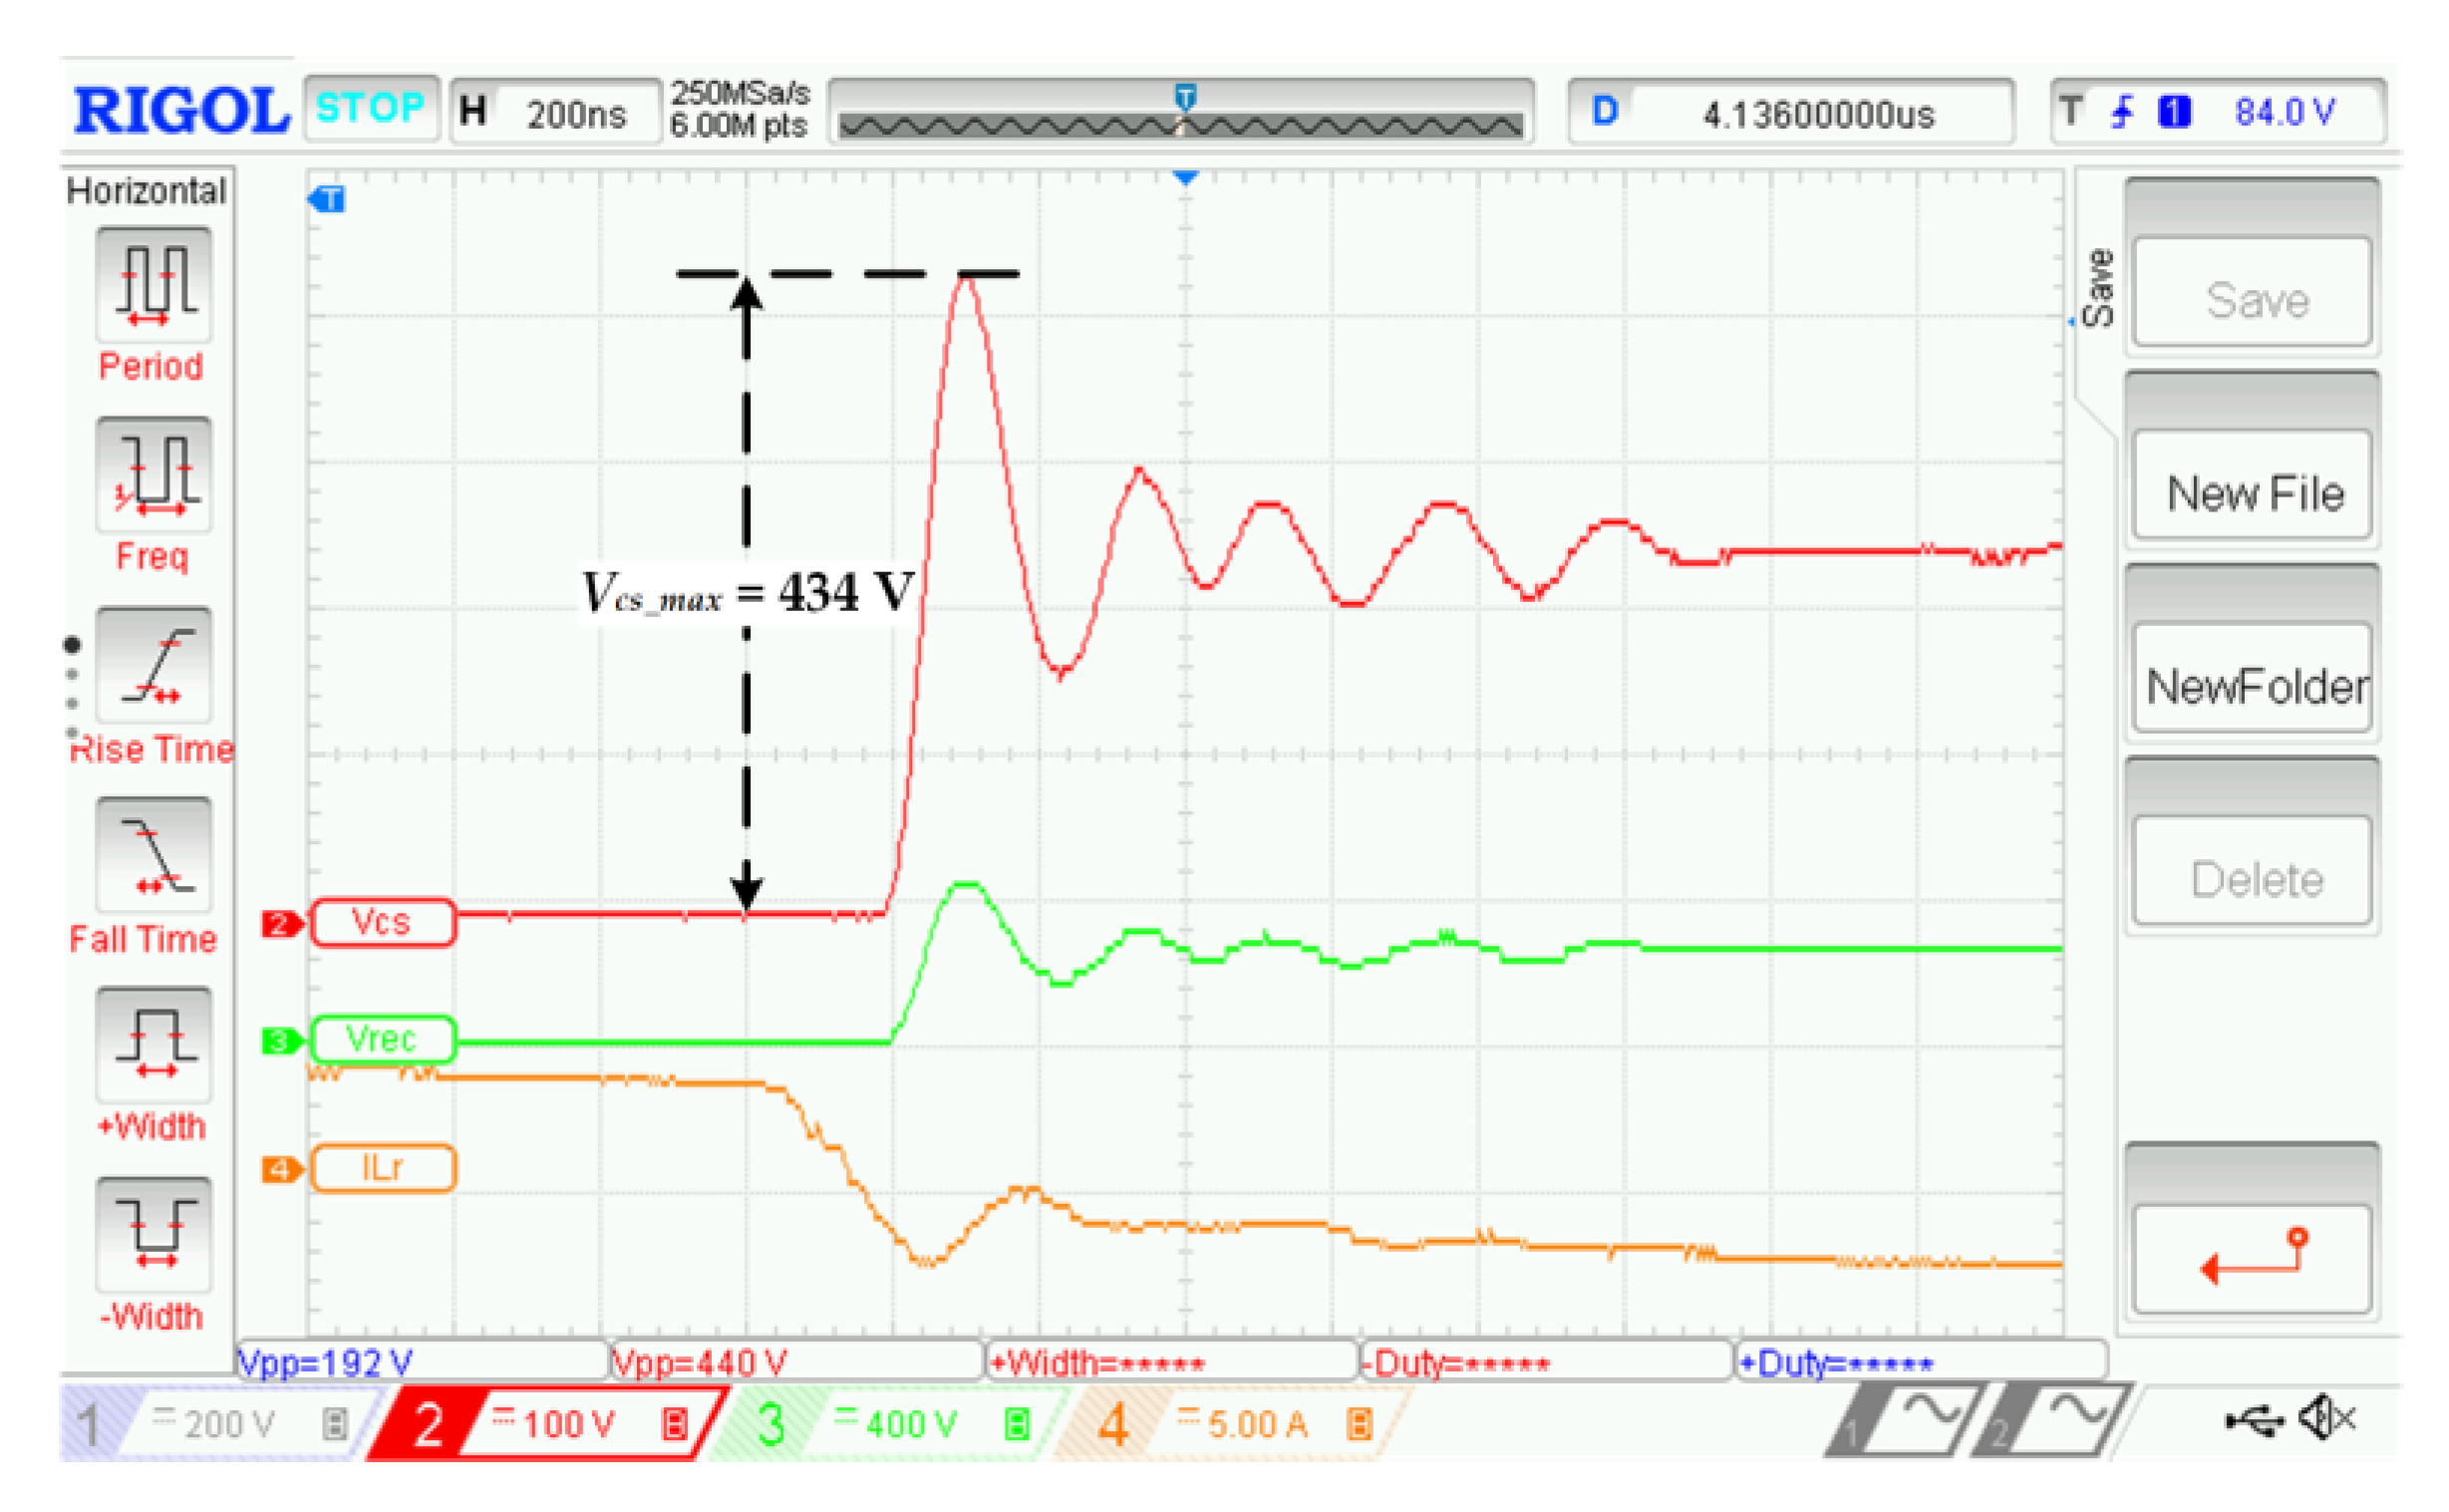
Figure 20.
Equivalent circuit corresponding to [t4-t4′] time interval.
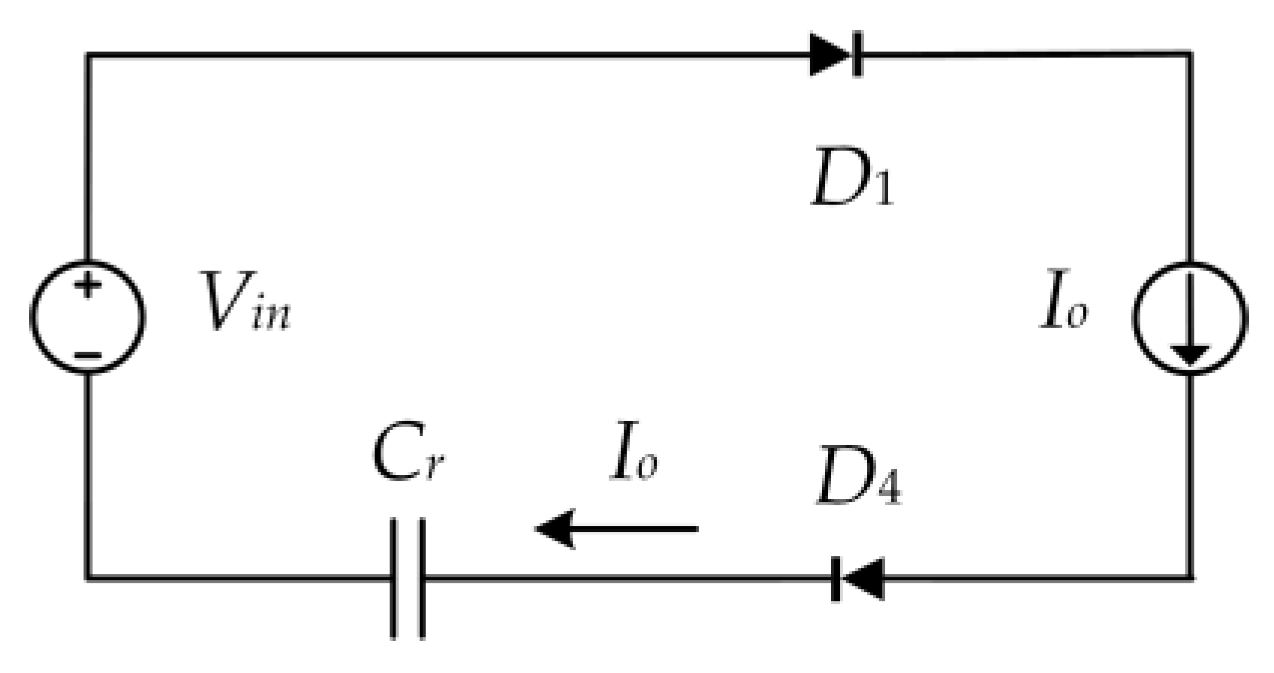
Figure 21.
Laplace equivalent circuit corresponding to [t4′-t5].

Figure 22.
Spice equivalent schematic for t4-t5 interval.
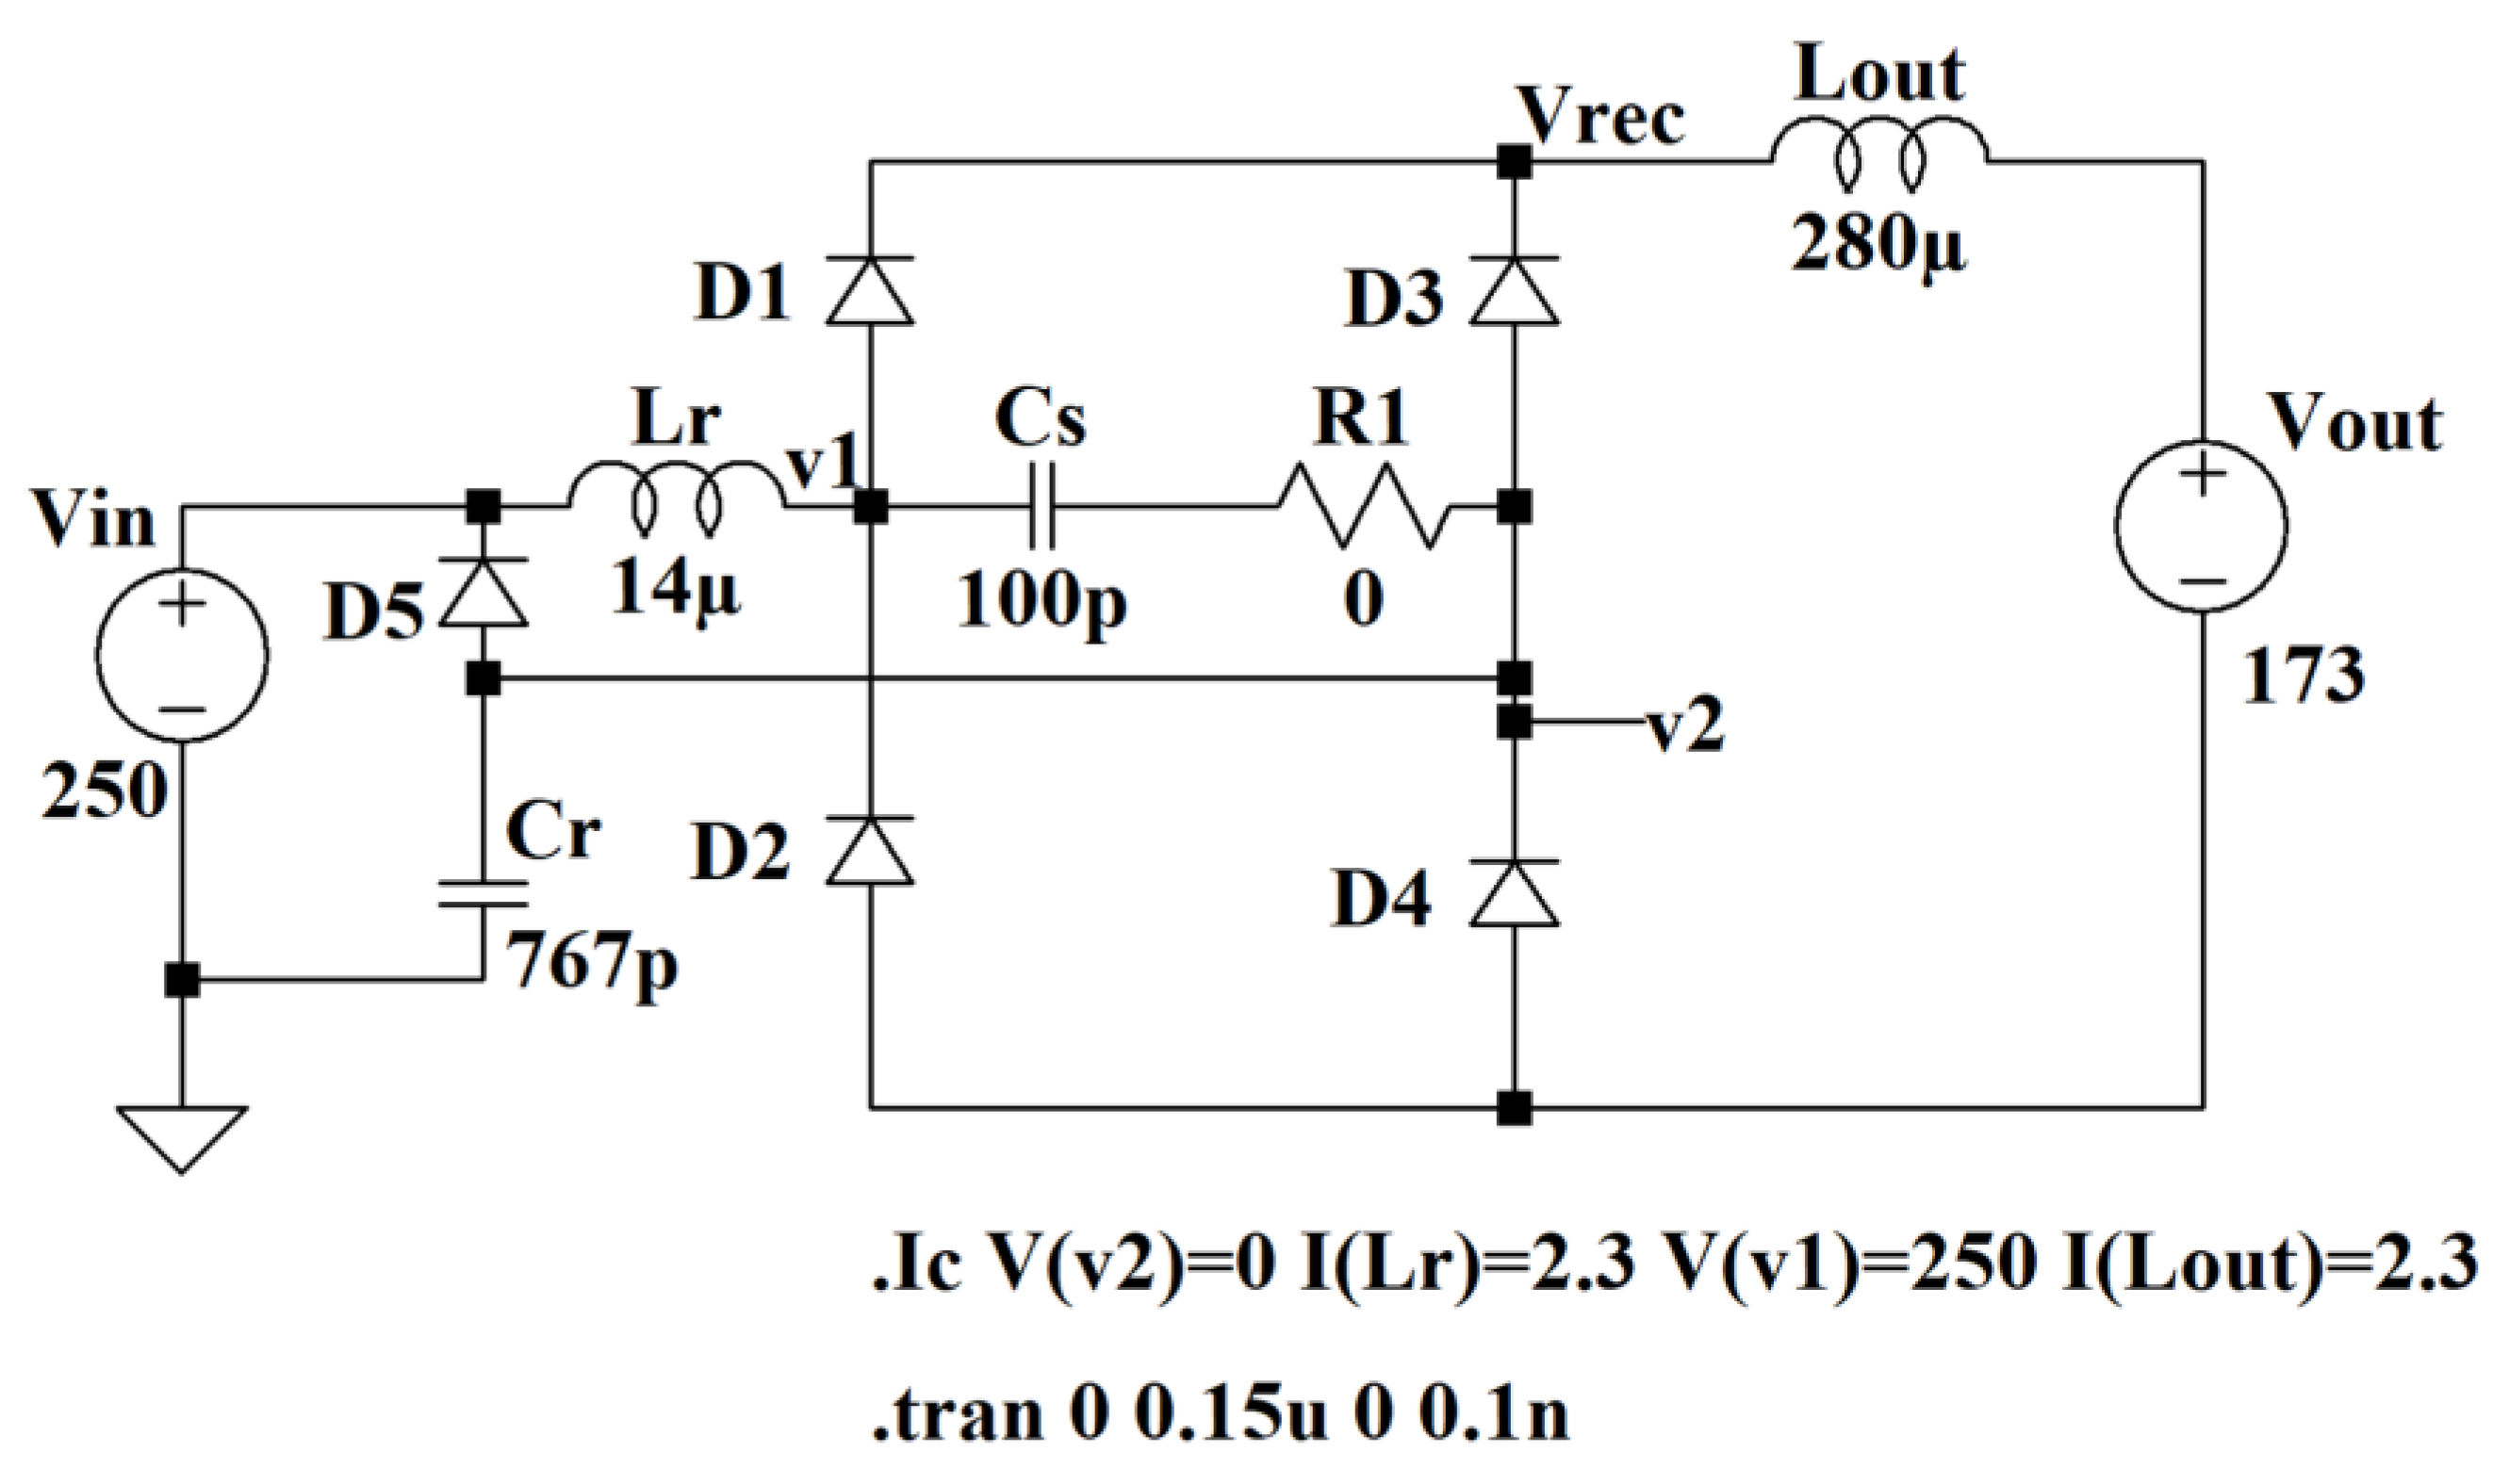
Figure 23.
Spice simulation results for t4-t5 interval.
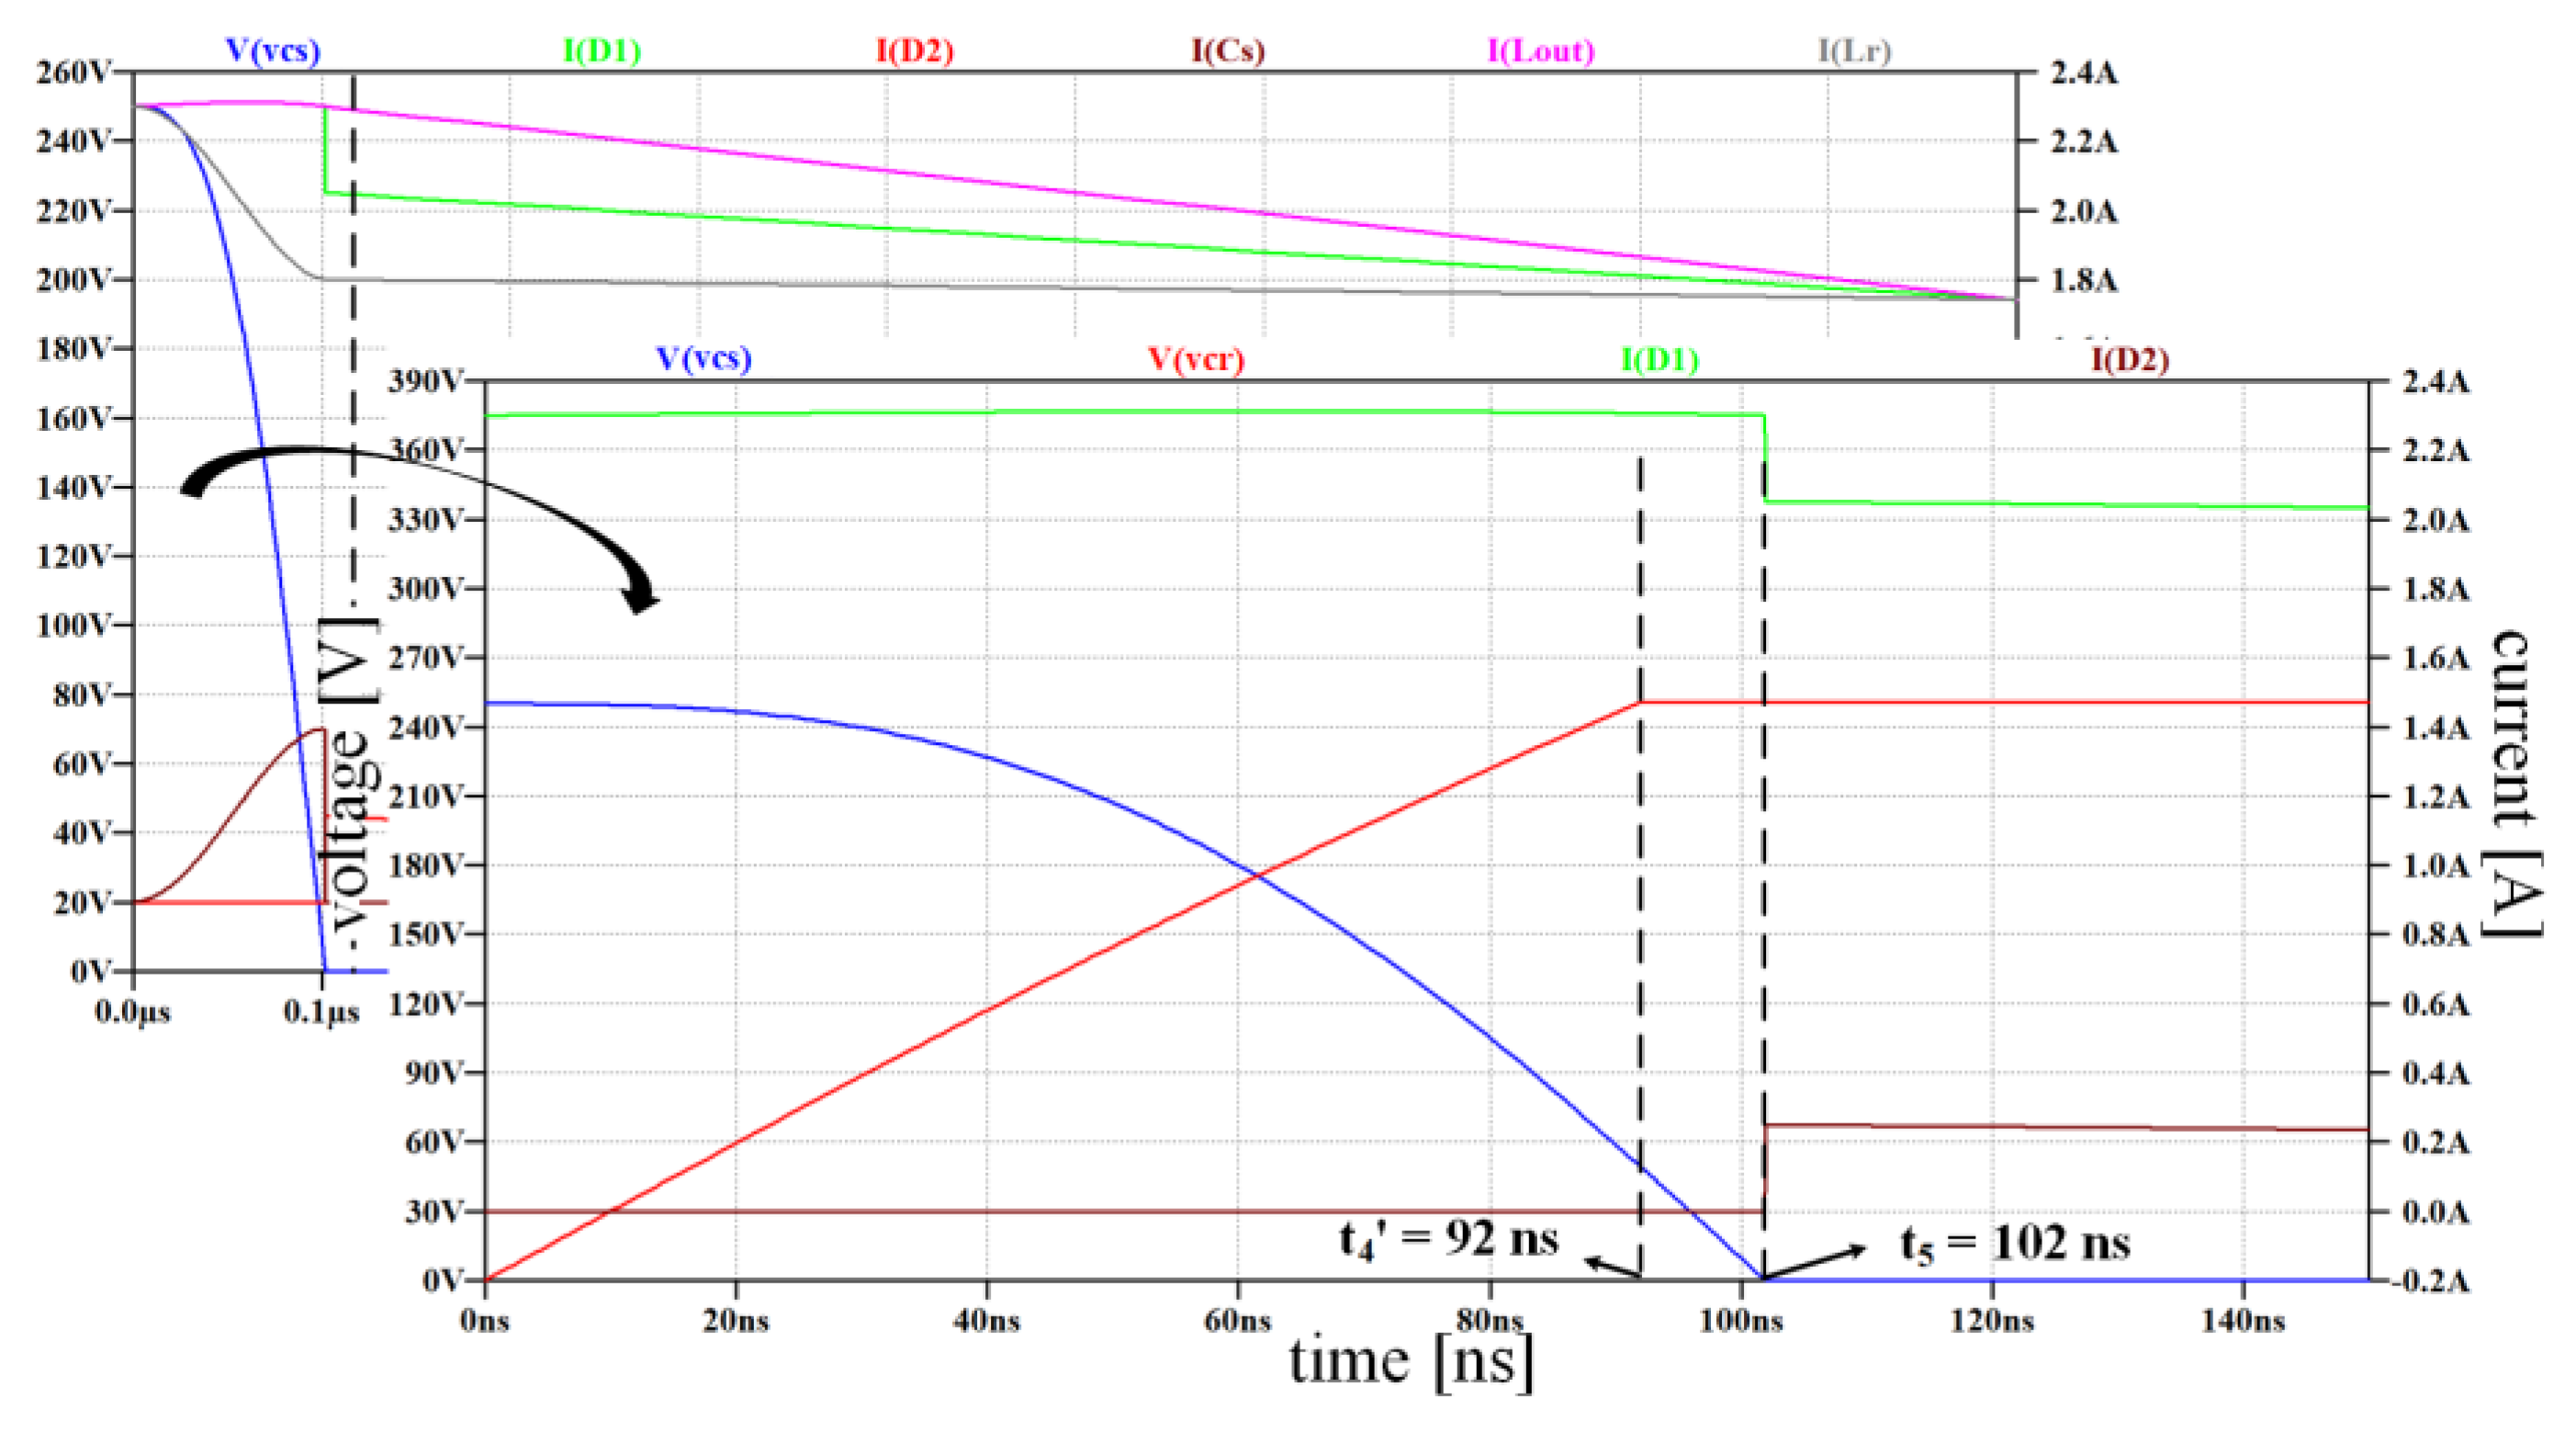
Figure 24.
Experimental results for t4-t5 interval.

Figure 25.
Equivalent schematic of the converter corresponding to [t5-t7] time interval.
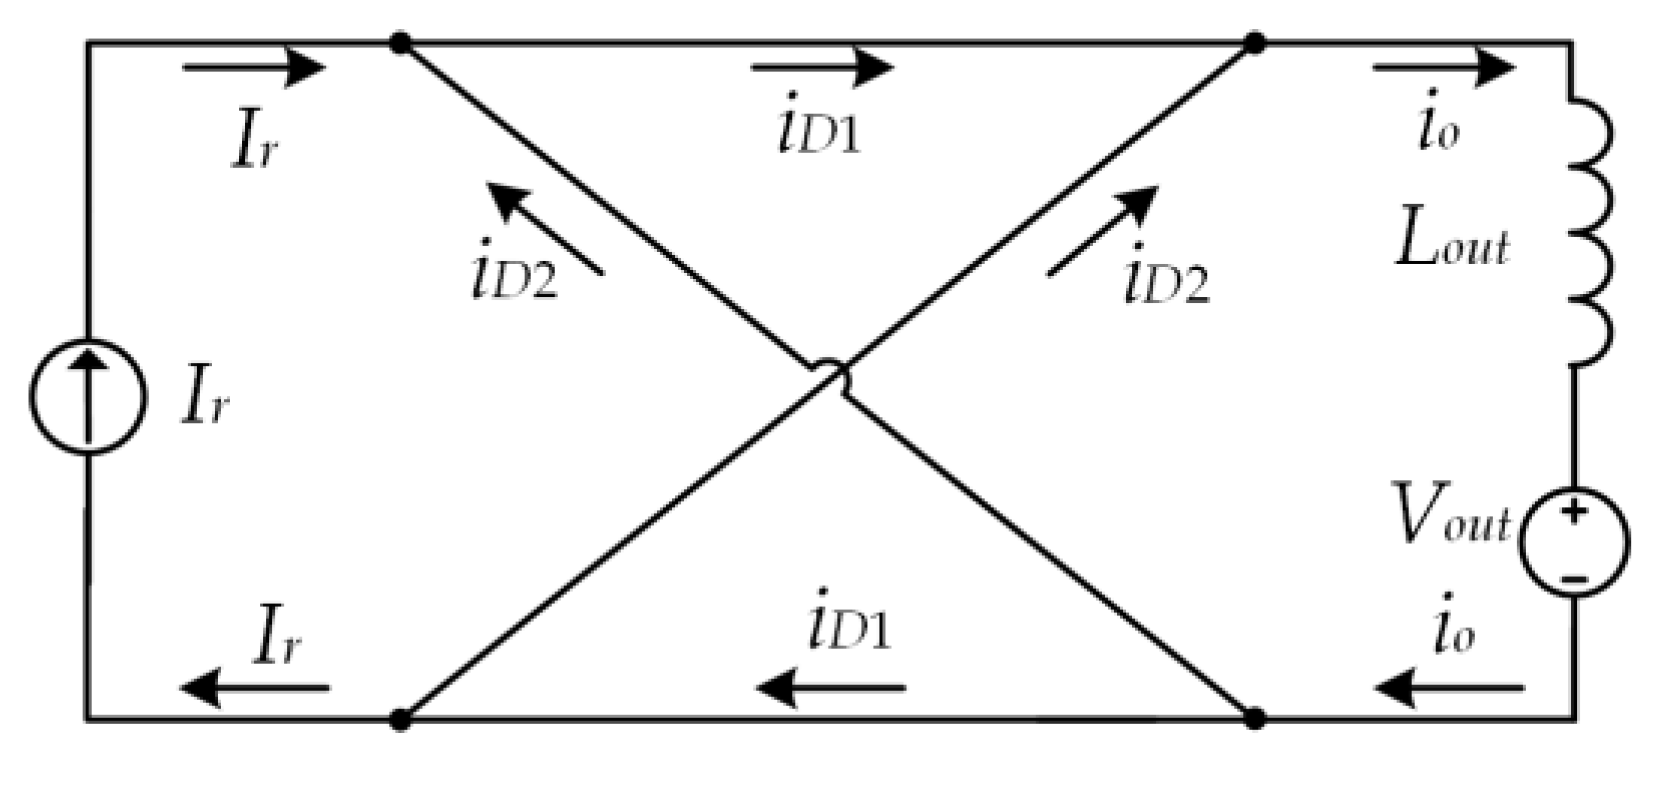
Figure 26.
Laplace equivalent circuit corresponding to [t7-t8] time interval.

Figure 27.
Spice equivalent schematic for t7-t8 interval.
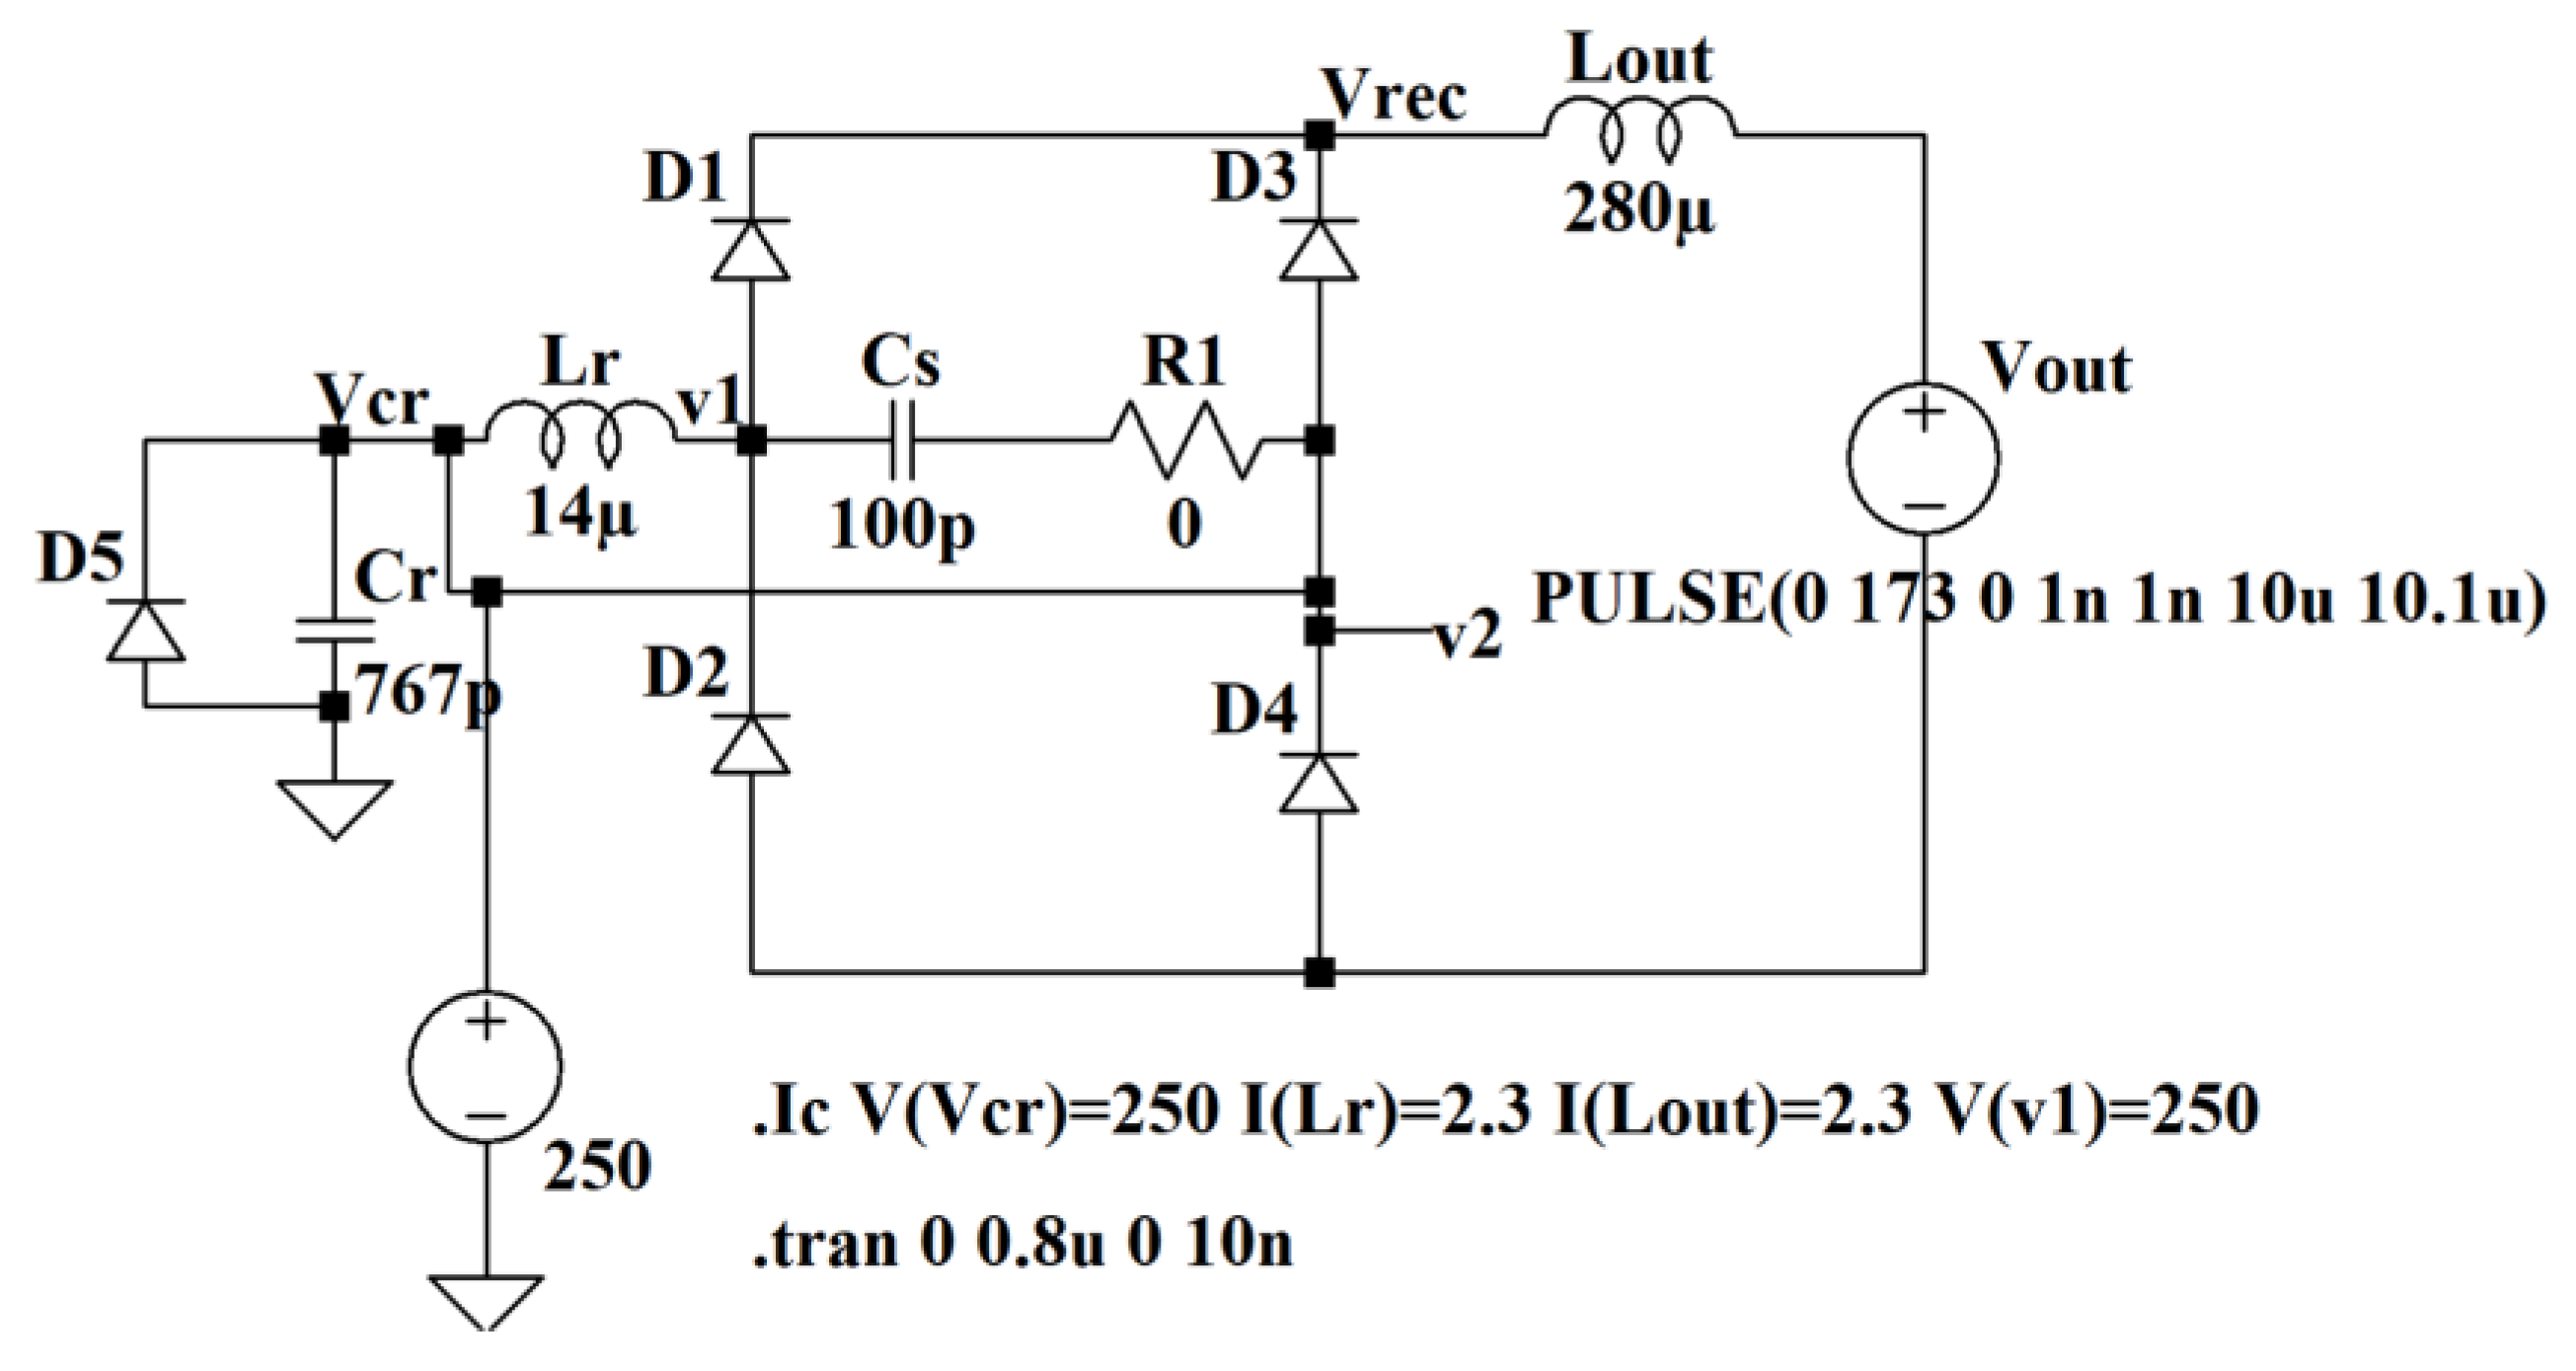
Figure 28.
Spice simulation results for Vcs and ILr immediately after t7.
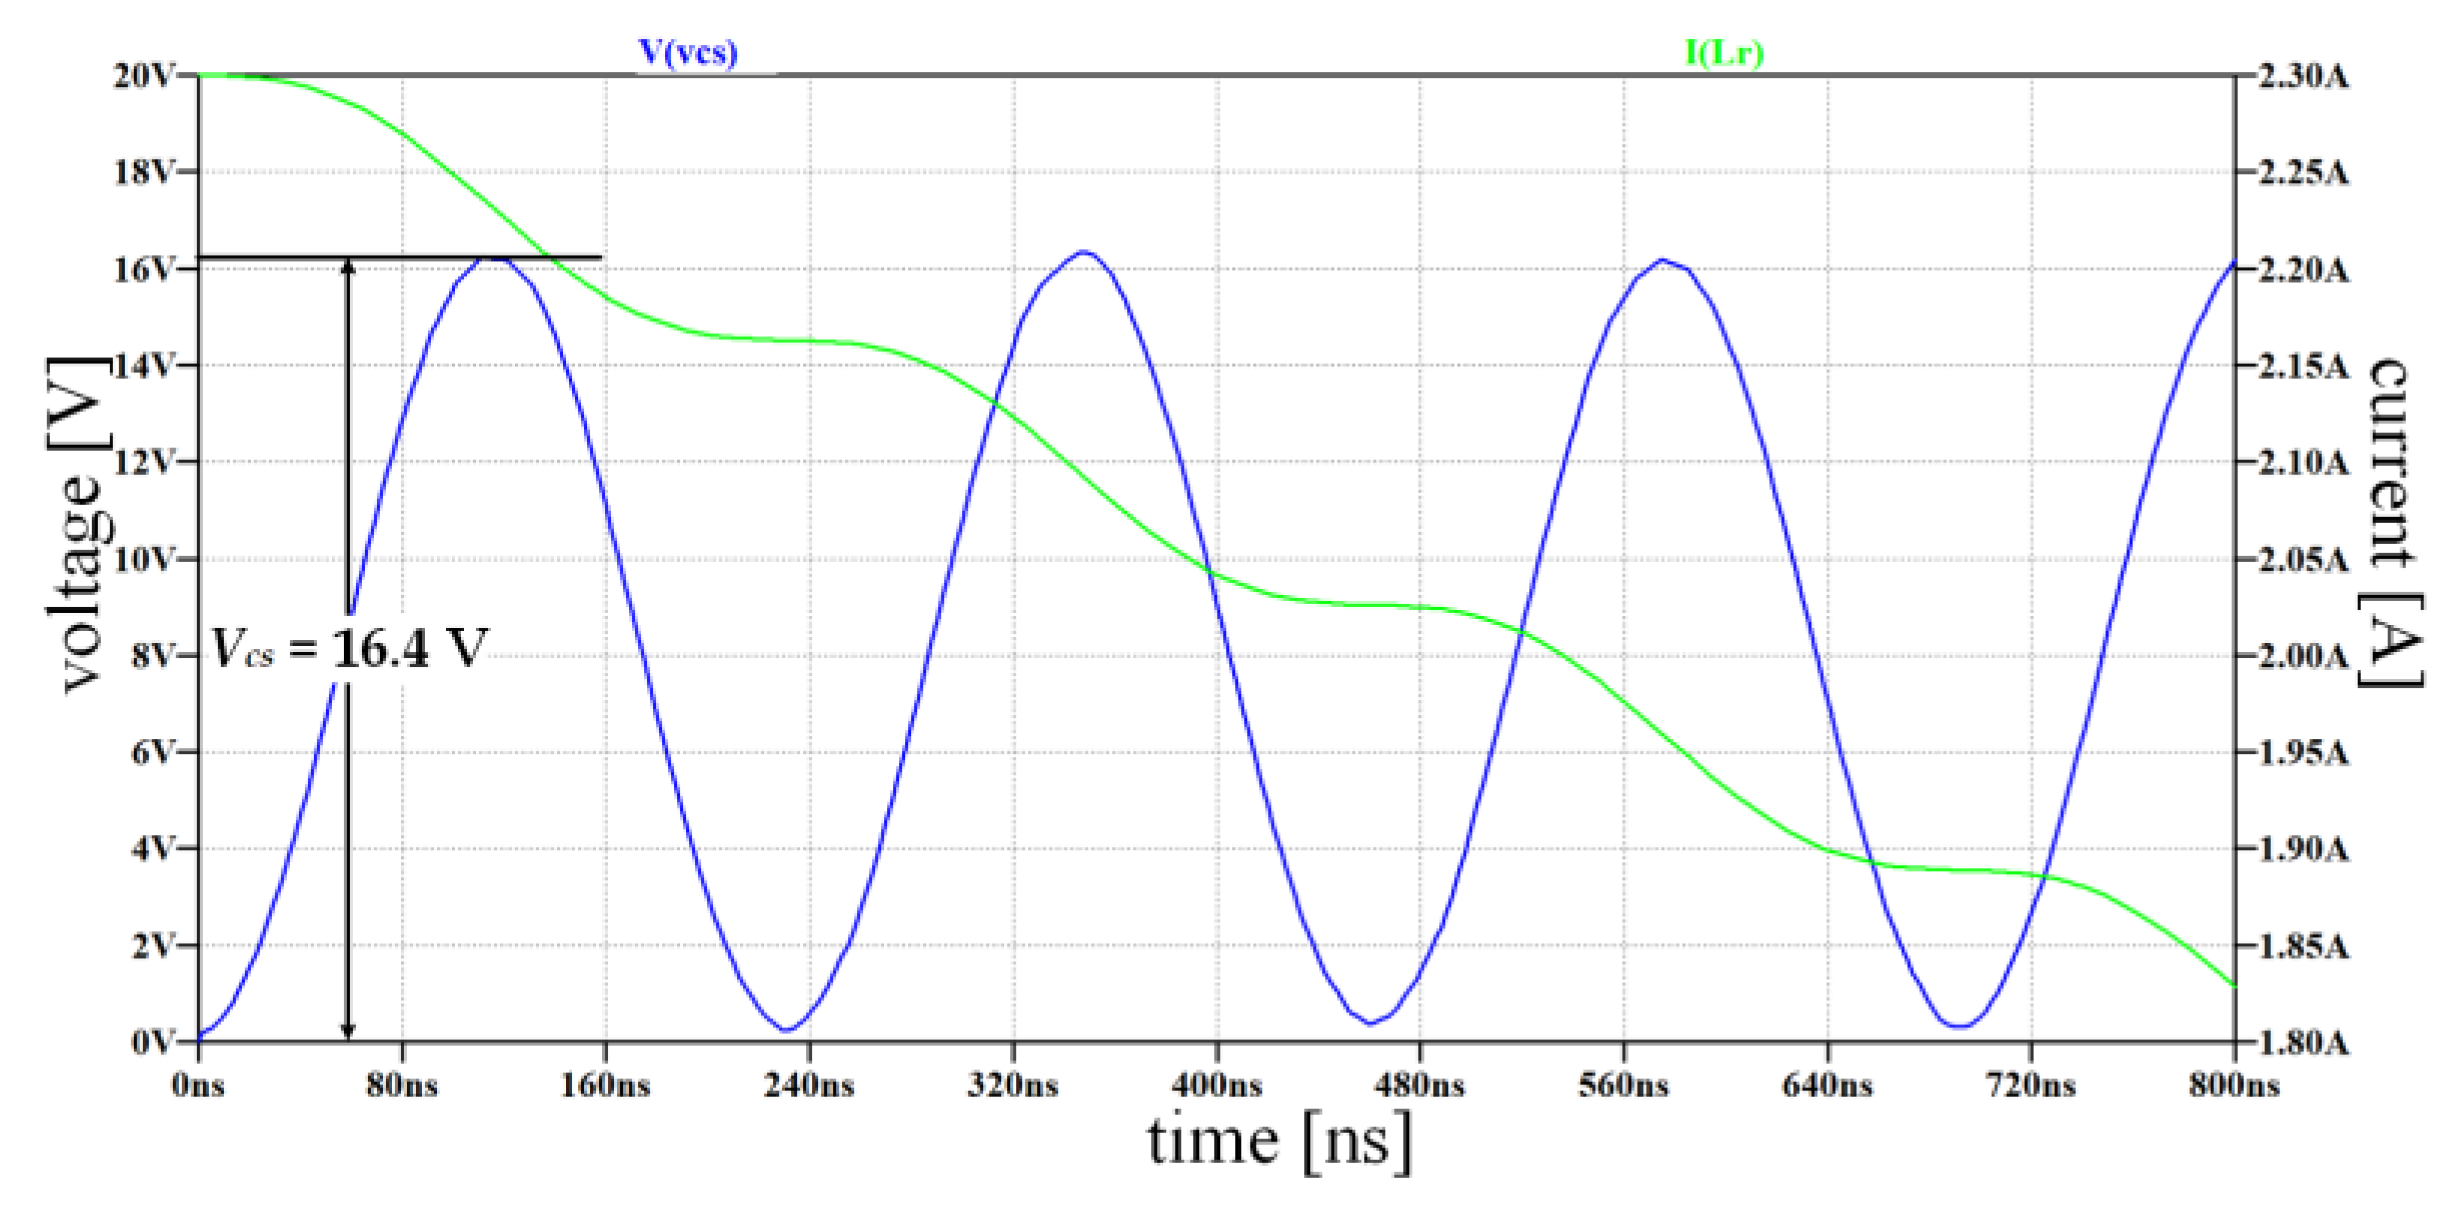
Figure 29.
Measurement results for Vcs and ILr immediately after t7.
© 2020 by the authors. Licensee MDPI, Basel, Switzerland. This article is an open access article distributed under the terms and conditions of the Creative Commons Attribution (CC BY) license (http://creativecommons.org/licenses/by/4.0/).
Share and Cite
MDPI and ACS Style
Petreus, D.; Etz, R.; Patarau, T.; Ciocan, I. Comprehensive Analysis of a High-Power Density Phase-Shift Full Bridge Converter Highlighting the Effects of the Parasitic Capacitances. Energies 2020, 13, 1439. https://doi.org/10.3390/en13061439
AMA Style
Petreus D, Etz R, Patarau T, Ciocan I. Comprehensive Analysis of a High-Power Density Phase-Shift Full Bridge Converter Highlighting the Effects of the Parasitic Capacitances. Energies. 2020; 13(6):1439. https://doi.org/10.3390/en13061439
Chicago/Turabian StylePetreus, Dorin, Radu Etz, Toma Patarau, and Ionut Ciocan. 2020. "Comprehensive Analysis of a High-Power Density Phase-Shift Full Bridge Converter Highlighting the Effects of the Parasitic Capacitances" Energies 13, no. 6: 1439. https://doi.org/10.3390/en13061439
Note that from the first issue of 2016, this journal uses article numbers instead of page numbers. See further details here.