The Influence of Cerium on the Hydrogen Storage Properties of La1-xCexNi5 Alloys


1
Department of Functional Materials and Hydrogen Technology, Military University of Technology, 00-908 Warsaw, Poland
2
Faculty of Materials Science and Engineering, Warsaw University of Technology, 02-507 Warsaw, Poland
*
Author to whom correspondence should be addressed.
Energies 2020, 13(6), 1437; https://doi.org/10.3390/en13061437
Submission received: 12 January 2020
/
Revised: 8 March 2020
/
Accepted: 18 March 2020
/
Published: 19 March 2020
(This article belongs to the Special Issue Hydrides: Science and Technology)
Abstract
:La1-xCexNi5 alloys (x = 0, 0.09, 0.25 and 0.5) were investigated in terms of their structures, phase contents, hydrogen storage properties and microhardness. It was confirmed that a cerium addition to the reference (LaNi5) alloy caused structural changes such as lattice shrinkage and, as a result, changed both the absorption and desorption pressures and the enthalpies of formation and decomposition. The alloy with the highest cerium content was found to possess a two-phase structure, probably as a result of nonequilibrium cooling conditions during its manufacturing process. The microhardness was found to increase to some extent with the cerium content and decrease for samples with the highest cerium content.
1. Introduction
The development of efficient hydrogen storage methods is crucial for the widespread use of hydrogen as a fuel [1,2]. Various studies on the possible storage of this gas in the form of solid-state hydrides has been conducted for the last decades after noticing that some metals and intermetallic alloys can reversibly store significant amounts of hydrogen gas [3,4,5,6,7]. AB5-type materials, characterized by the ability to conduct reversible storage at temperatures and pressures close to an ambient environment, are still one of the best groups of candidates. They usually store from 1% to 1.4% of hydrogen by weight and usually more than 100 kg/m3, which is much more than even liquefied hydrogen at 20K (70kg/m3). The first reports on the ability to store hydrogen by AB5-type intermetallic compounds were published in 1969-70 [8,9]; since then, after tuning the composition of the primarily used alloys, they have become one the most commonly used intermetallic alloys in hydride applications.
The typical representative of this group of materials is LaNi5, which is easy to activate, possesses very good absorption and desorption kinetics [10] and is relatively safe (for a metallic powder) when used. The activation procedure may vary but is usually given in the literature as a long-term exposure under high hydrogen pressure (approximately 50 bar) at a room or elevated temperature [11,12,13], which is also connected with sample evacuations. The described alloy possesses a capacity of ~1.4 wt%. and has a plateau pressure just above 1 bar at room temperature [10,11] depending on the purity and stoichiometry. The storage properties of LaNi5 can be tuned by replacing La or Ni atoms with other elements. This has already been extensively studied and presented in the literature. As the most significant examples, lanthanum or nickel can be substituted with Ce [14,15], Pr [16], Fe [17], Zn [18], Ga [19], Al [20,21], Nd [22], Co [23], Sn [24] and many others, which influences the kinetics of the reaction, cycling stability, equilibrium pressures and susceptibility to surface contamination [25]. Different attempts to modify the properties were also made, including mechanical alloying and plastic deformation [26,27].
Despite the fact that the material has been so extensively studied, there are still some gaps in the literature and sometimes significant inconsistencies. In this work, we try to shed more light on the properties of La-Ce-Ni alloys. This group is very attractive, since cerium replaces the lanthanum in the unit cell, causing the lattice to shrink, and significant changes in the plateau pressures can be obtained. One of the first studies of the La1-xCexNi5 system was carried out by J. H. van Vucht et al. [8]. They focused on the study of this system, because they assumed that LaNi5 and CeNi5 compounds behaved differently in relation to hydrogen. LaNi5 is already able to absorb hydrogen at room temperature and at relatively low pressure; in contrast, 150 bar was not enough to activate the absorption of CeNi5. They stated that, by substituting La with Ce atoms, it is possible to increase the hydrogen density in the alloy and directly tune its properties. Following that discovery, several attempts to investigate cerium-doped alloys were made, including studies of the atypical hysteresis effects in these alloys [14], as well as the role of the cerium valence state [15]. Most recently, Cheng et al. focused on the influence of Ce-doping on the microstructure, microwave absorbing properties and magnetic parameters of those alloys. It was found that the saturation magnetization increases with the Ce content. The minimum absorption peak frequency shifts towards the lower frequency region with increasing Ce concentrations [28].
Despite the given examples, other results can be found in recent literature showing atypical values obtained for the enthalpies of formation and decomposition of the above hydrides [29], and the atypical enthalpy trend changes with changes in the cerium content. Additionally, it is usually stated that cerium substitutes lanthanum in a manner in which a single phase is formed, which is true if the sample is cooled in conditions resulting in an equilibrium crystallization or a heat treatment afterwards [14] but might not be the case knowing the metallurgical process and mass production of the alloys which are offered on the market. In this paper, we have investigated three commercially available cerium-doped LaNi5-based alloys. Their phase composition, lattice parameters and PCT (pressure composition temperature) characteristics were investigated and discussed in relation to the chemical segregation and microhardness measured for the chosen alloys.
2. Materials and Methods
LaNi5, La0.91Ce0.09Ni5, La0.75Ce0.25Ni5 and La0.5Ce0.5Ni5 were purchased from Whole Win (Beijing, China) and were produced by vacuum-induction melting. The received powder with a very broad particle size range (from micrometers to >1 mm) was not heat-treated at our laboratory; rather, it was crushed manually and sieved prior to an XRD analysis to separate and investigate the fine (<40 µm) fraction and obtain a quasi-isotropic sample for proper measurement statistics. The material was subjected to an XRD phase and structural analysis using a Rigaku Ultima IV diffractometer (Co-Ka λ =1,79003 Å) (Rigaku, Tokyo, Japan) with operating parameters of 40 mA and 40 kV in a continuous mode, with a speed of 1 deg/min. Parallel beam geometry was used together with a fast linear detector (DeteX Ultra) and a standard borosilicate glass sample holder. The slit sizes were kept constant during the investigation (fixed slit mode). The phase identification of the base structure was performed with PDXL (Rigaku) software and the PDF4 database. Furthermore, the obtained data and unit cell prototypes of LaNi5 were used to calculate the lattice parameters of cerium-substituted alloys by Rietveld refinement using Match! software with the incorporated Fullproof suite, which was also used for estimation of the amount of the phases based on the XRD spectra.
Absorption and desorption isotherms were measured using an automated Sievert’s apparatus (HTP1-S, Hiden Isochema, Warrington, UK). All samples were tested at three different temperatures: 35°C, 40°C and 45°C, with the use of hydrogen gas in the highest available purity (BIP, Air Products, <100 ppb H2O and O2). Samples, with masses of approximately 200 mg were activated prior to measurement by five absorption and desorption cycles at the pressure regime characteristic for each sample.
For the SEM observations and microhardness tests, samples were put into a conductive thermoset resin and then ground and polished. An FEI Quanta 3d SEM (Hillsboro, OR, USA) was used for sample observation. Linear chemical composition scans and chemical composition maps were performed by using an EDS technique and Hitachi Su-70 FE SEM (Hitachi, Tokyo, Japan).
The microhardness measurements were obtained using a Shimadzu microhardness tester HMV-G (Shimadzu Corporation, Kyoto, Japan) with a 50-g load for each sample; moreover, the measurements were repeated 15 times. In the case of the sample with the highest cerium content, the indentations were performed separately for each visible phase, and the results were treated as a separate result. Since the microhardness was measured on (relatively large but still) powder particles, a proper indentation was defined as having no crack observed at the edge of the indentation.
3. Results and Discussion
3.1. Structural and Phase Analysis by X-ray Diffraction
Figure 1 shows the XRD patterns obtained for the investigated powders. The LaNi5 sample was used as a reference sample. The obtained diffraction pattern shows a full match with the pattern in the PDF4 database, showing that the investigated sample is a single-phase material, with a CaCu5 hexagonal-type structure with unit cell parameters equal to a = 5.017 Å and c = 3.977 Å, which results in a unit cell volume of 86.724 Å3. The obtained parameters are in agreement with the values provided by Van Vucht et al. [8] and slightly larger in all dimensions than those recently provided by Odysseos et al. [29]. The investigation of La0.91Ce0.09Ni5 (with the smallest cerium addition; see Figure 1) results in a very similar pattern, with peaks slightly shifting to higher angles of 2-theta values.
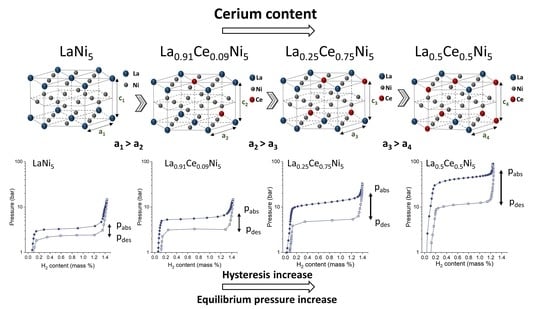
The refined lattice parameters obtained from the spectra are found to be as follows: a = 5.005 Å and c = 3.982 Å, which results in a unit cell volume of 86.424 Å3. It is easy to conclude in such cases that cerium easily substitutes the lanthanum in the intermetallic phase due to being very similar in size and properties, which is in agreement with previous findings [16,30,31]. The single-phase structure is preserved in this case, and only the unit cell is slightly deformed. The deformation, however, seems to be not as intuitive, since the a parameters of the lattice shrink significantly while the c parameter increases. This also seems to be in agreement with most of the literature data [8,32]; however, some of the recent data [29] suggests that the c parameter remains almost unchanged (even the inverse relationship of shrinkage was observed for some of the Ce-substituted alloys).
The described trend was observed for the rest of the alloys. The obtained values for both the lattice parameters and the unit cell volume, as well as the graphical representation of the unit cell volume dependence on the Ce content in the sample, are shown in Table 1 and Figure 2. It is easy to conclude that the unit cell volume is almost linearly dependent on the cerium content in the sample. The small deviation with the highest content of Ce might be related to segregation, which will be discussed shortly. In other words, the real content of cerium in the refined phase is different from the theoretical content, which is described based on the total chemical composition of the sample. The suspected composition of the investigated phase is shown in the figure with a different marker. This issue will be described in more detail in the section related to the chemical composition of the sample. The obtained XRD data show one more important issue. For the sample with the highest cerium content, three phases are found in the XRD pattern. Four Bragg peaks are found in positions that can be evidently matched with the La2NiO4 phase. The presence of this compound might be related to oxygen uptake during the metallurgical process or, less likely, to corrosion of the alloy. Usually, this compound was observed after long-time cyclic absorption and desorption tests due to the presence of residual oxygen in hydrogen gas [33] or after long-time annealing or uptake during casting [34]. The amount of the phase is at a low detection limit (0.8% ± 0.2% estimated by the Rietveld refinement) of the method and should not influence the overall behavior of the alloy; however, since oxygen selectively binds nickel and lanthanum, it may cause the deficit of those elements in the alloy. The dominating phase was identified by PDLX software as a hexagonal CaCu5 type, while the third phase present in the spectrum remained unrecognized. The small number of peaks and their low intensities, as well as low intensity-to-noise ratio, caused that we were not able to determine the exact structure of the remaining phase. The data quality for dominating phase was good enough to perform Rietveld refinement and for obtaining lattice parameters. The amount of the dominating phase was estimated using both the the RIR method (using La0.5Ce0.5Ni5 as a candidate phase and its RIR coefficient from the database) and Rietveld refinement. Several attempts were made with different processing of the patterns. The obtained results were found to be surprisingly consistent, and the average amount of the phase was calculated to be 90.3% ± 1.5% based on 10 different attempts with the use of both methods. Having in mind the estimated amount of the oxide phase, mentioned above, one can conclude that the unknown phase amount can reach up to 8%–9% of the sample.
3.2. Hydrogen Absorption and Desorption PCT Isotherms
The structural changes in the alloys and phase composition of each of them directly influence the hydrogen storage properties of the alloys. The composition itself is found to be very important for LaNix alloys, even without cerium content. It is found that, by changing the x value (where x is an atomic proportion of nickel to lanthanum), one can change the equilibrium pressure at 40 °C from 2.5 bar (for x = 4.9) to more than 9 bar (for x = 5.5) [11]. Figure 3a–d show the hydrogen absorption and desorption isotherms obtained at temperatures of 35, 40 and 45 °C for the investigated alloys.
The character of each set of curves is quite similar and can be described as follows. Each alloy absorbs a relatively small amount of hydrogen proportionally with increasing pressure; then, most of the hydrogen is absorbed in the plateau region with a small change in pressure, and only a very small residual quantity is absorbed above the plateau pressure. This mechanism is well-known and has already been described in the literature many years ago on the example of both AB and AB5 alloys [6,7,10,11,12,13], so it will not be described here. The most important observations regarding the obtained results may be summarized as follows. The cerium content increased results in an equilibrium pressure rise. The exact values measured in the middle of the plateau region are shown in Table 2. It is easy to notice that the absorption pressures are very strongly influenced by composition, while the desorption pressures’ increases seem to be not so drastic. Additionally, with increasing cerium content, the plateau becomes steeper, and the hysteresis increases between the absorption and desorption. This phenomenon has also been observed and extensively explained years ago [14]. The presence of cerium in the alloys is crucial but not enough to cause the untypical hysteresis effect. It can be suppressed by the addition of different elements such as cobalt or aluminum and is very likely connected with the appearance of two hydride phases and different valent states of cerium in alloys. In general, despite many years of investigations, the hysteresis effect (not talking about abnormal hysteresis effect) was not fully understood [2] but is likely to be connected with both the elastic and the plastic accommodation energies in both hydride formation and decomposition [35,36]. Based on the measured equilibrium pressures, with the use of van ’t Hoff plots, the enthalpies of decomposition and formation are calculated (Table 3). The values of the enthalpies of formation and decomposition are found to follow expected tendencies and suggest that the alloy stability decreases with increasing cerium content, as has been already shown by Dayan [14] and Uchida [30]; however, recently, different values were shown by Odysseos et al. [29]. The last mentioned result, however, is very likely caused by a mistake in calculations. The values of equilibrium pressures in their experiment follow the typical trend; however, the enthalpies are totally different from what one may expect. The only deviation from the expected tendency is the desorption enthalpy value for the sample with the highest cerium content. This phenomenon will be discussed later in the section related to the chemical composition of the samples. Here, it should be however underlined that the obtained value for enthalpy (higher enthalpy for higher equilibrium pressure) proves that, for this sample, the van ’t Hoff’s plot-based method seems to be unreliable, as there is no physical explanation for such tendency. By that reason, the enthalpy in case of such samples should be rather measured directly by high-pressure DSC.
3.3. Microstructure and Chemical Compositions
To support the results presented above, microstructural observations and chemical composition measurements were obtained. Figure 4 shows the microphotographs (SEM; BSE mode) of the metallographic cross-sections of the investigated samples. Samples (a) LaNi5, (b) La0.91Ce0.09Ni5 and (c) La0.75Ce0.25Ni5 show very good homogeneity with very few visible areas demonstrating slightly different compositions (segregation). Both the amount of the areas, as well as the degree of segregation, are not sufficient to be visible as a second phase in the XRD pattern.
In fact, the areas are very rare in the sample, and the photographs presented are made to show their occurrence rather than to show the real amount that can be found in the sample (i.e., strong overrepresentation in the photos compared to the actual sample volume). The sample described as La0.5Ce0.5Ni5 (Figure 4d) shows a slightly different appearance. What was observed in the XRD spectra can be directly observed in the micrographs. The presence of at least two distinct phases is evident. The characteristic shapes and occurrences within the volumes of the particles suggest that those phases are formed during the crystallization of the alloy. The phase that can be seen as light gray is likely to be a phase with a lower melting point (this can be judged by the morphology) and knowing the composition of the alloy must contain a lower amount of nickel compared to the dark-gray phase. To shed more light on this, chemical composition maps were obtained, showing the distribution of La, Ce and Ni (Figure 5). As suspected, the light-gray areas are nickel-deficient while having more lanthanum. The cerium distribution is very similar in the whole investigated region.
To show this even more directly, a chemical composition line scan was obtained and is presented in Figure 6. The error bars presented in the graph are the bars presenting the uncertainty of the measurements; however, they only consider the statistical error due to the number of counts obtained for each point. It must be strongly emphasized that the uncertainty of the EDS method itself is likely to be much larger than only the uncertainty caused by statistical error. For this reason, in our opinion, all the EDS results should be treated more qualitatively than quantitatively, although we provide the values of the content on the Y-axis. The reason for the above is a lack of proper quality standards for alloys with compositions similar to the ones investigated; thus, the settings used during the EDS investigation are settings that are more accurate for materials with classical structures rather than these kinds of alloys.
To date, one question remains unsolved. The desorption enthalpy of the sample with the highest cerium content is found to be definitely higher (in negative values) than the values for all other samples. A careful check of the obtained data and repeated results did not show any evidence for any experimental error causing this behavior. In such a case, the only explanation for this phenomenon is that (as shown above) the chemical segregation (not only cerium but also nickel) causes this unexpected behavior in the sample. Keeping in mind the results obtained by Buschow et al. [11], where they show the differences in the alloy behavior just by changing the nickel content, one must admit that nickel deficiency and a two-phase character of the sample may cause the problem when estimating the decomposition enthalpy by the van ’t Hoff plot method. The differences in the nickel content in those two phases (to be more precise, nickel deficit in the unknown phase) is evident (Figure 6) and even more obvious than the slight change of the lanthanum to cerium ratio.
From a practical point of view (to obtain pressure data for the design of a hydrogen storage container), however, the equilibrium pressures at specified temperatures are more practical/direct information that can be directly used by the constructor than the enthalpy value itself. On the other hand, even in practical applications, the enthalpy of formation is important to be able to predict the total amount of heat that needs to be removed from the container effectively to perform the hydrogenation (not even mentioning the thermal conductivity of the powder [37] and hydrogenation kinetics). It is also worthy to note that properly measured values of the enthalpy of formation can be used to extrapolate the equilibrium pressure values in the chosen temperature, which can be further used for the modeling of the heat exchange and design of the storage tanks but, also, more importantly, to compare the results with other researchers.
3.4. Microhardness
Microhardness tests were performed as a supplementary result to the previously presented data. Since alloys are usually used as functional materials, microhardness is usually not of great importance and, to the best of our knowledge, has not been presented in the literature before. In some cases, however, they can serve as supplementary data to other observations. In this case, the idea is to check this in order to be able to predict the wear behavior of the material and, thus, its possible use as a hydrogen storage vessel with improved heat exchange efficiency (by powder movement within the vessel–patent nr PL (11) 231933). The results obtained with a Vickers indenter and a 50-g load are presented in Table 4 and Figure 7. A statistically significant increase in hardness is observed with increasing cerium content in the samples. Again, the trend is changed for the sample with the highest cerium content. The measurements are obtained from indentations made in obviously different regions that correspond to the two phases. The low microhardness values obtained for both phases in comparison to the sample with 25% cerium, despite the evident cerium content in the whole sample, prove two things. First, it is very likely that the hardness of CeNi5 is lower than that of any of the LaCeNi samples, and the maximum hardness value is observed somewhere between a cerium content of 25% and 50%. Second, the second phase, which is very similar structurally and compositionally to the dominant phase, is significantly different (perhaps due to the nickel deficiency), which is more than obvious when observing such great differences in its hardness compared to any other phase in the investigated spectrum of samples. The values obtained for the chosen alloys are not very high and remain in a range typical for most intermetallic alloys.
4. Conclusions
Investigations of La-Ce-Ni alloys are presented. A cerium addition causes an increase in the equilibrium pressures of hydrogen absorption and desorption. Cerium substitutes lanthanum in a LaNi5 lattice, causing the lattice to shrink. The single-phase structure of the alloys remains for low cerium concentrations; however, for high cerium contents, a two-phase structure is observed. The enthalpy of hydride formation for the chosen alloys are calculated based on their equilibrium pressures, and they decrease with increasing cerium contents (hydride becomes less stable). The two-phase structure obtained with the highest cerium content influences the indirect measurement of the enthalpy of decomposition (by van ’t Hoff plot); thus, the obtained value does not correspond well with the obtained properties (low stability and high equilibrium pressures). A chemical composition analysis and phase analysis confirm that, for the highest cerium content, the commercially available alloy is characterized by chemical composition segregation (which can probably be removed by a proper heat treatment), resulting in a change in properties and a slight lowering of the maximum amount of hydrogen that can be stored in the sample.
Author Contributions
Conceptualization, M.P. (Magda Pęska) and M.P. (Marek Polański); methodology, M.P. (Magda Pęska), M.P. (Marek Polański) and J.D.-W.; validation, M.P. (Marek Polanski) and J.D.-W.; formal analysis, M.P. (Marek Polanski); investigation, M.P. (Magda Pęska), J.D.-W. and T.P.; data curation, M.P. (Magda Pęska); writing—original draft preparation, M.P. (Magda Pęska); writing—review and editing, M.P. (Marek Polanski); visualization, M.P. (Magda Pęska) and M.P. (Marek Polanski); supervision, M.P. (Marek Polanski); project administration, M.P. (Marek Polanski) and funding acquisition, M.P. (Marek Polanski) All authors have read and agreed to the published version of the manuscript.
Funding
The work was supported by the statutory research funds of the Department of Functional Materials and Hydrogen Technology, Military University of Technology, Warsaw, Poland.
Conflicts of Interest
The authors declare no conflict of interest. The funders had no role in the design of the study; in the collection, analyses or interpretation of data; in the writing of the manuscript or in the decision to publish the results.
References
- Hirscher, M. Handbook of Hydrogen Storage: New Materials for Future Energy Storage; WILEY-VCH: Weinheim, Germany, 2010. [Google Scholar]
- Varin, R.A.; Czujko, T.; Wronski, Z.S. Introduction. In Nanomaterials for Solid State Hydrogen Storage; Springer: Boston, MA, USA, 2009; pp. 1–81. [Google Scholar]
- Ellinger, F.H.; Holley, C.E.J.; McInteer, B.B.; Pavone, D.; Potter, R.M.; Staritzky, E.; Zachariasen, W.H. The Preparation and Some Properties of Magnesium Hydride. J. Am. Chem. Soc. 1955, 77, 2647–2648. [Google Scholar] [CrossRef]
- Kennelley, J.A.; Varwig, J.W.; Myers, H.W. Magnesium-hydrogen relationships. J. Phys. Chem. 1960, 64, 703–704. [Google Scholar] [CrossRef]
- Stampfer, J.F.J.; Holley, C.E.J.; Suttle, J.F. The magnesium-hydrogen system. J. Am. Chem. Soc. 1960, 82, 3504–3508. [Google Scholar] [CrossRef] [Green Version]
- Reilly, J.J.; Wiswall, R.H.J. Iron Titanium Hydride: Its Formation, Properties and Application; Laboratory, B.N., Ed.; Brookheaven National Laboratory: New York, NY, USA, 1973. [Google Scholar]
- Reilly, J.J.; Wiswall, R.H. Formation and properties of iron titanium hydride. Inorg. Chem. 1974, 13, 218–222. [Google Scholar] [CrossRef]
- Van Vucht, J.H.N.; Kuijpers, F.A.; Bruning, H.C.A.M. Reversible room-temperature absorption of large quantities of hydrogen by intermetallic compounds. Phillips Res. Rep. 1970, 25, 133–140. [Google Scholar]
- Zjilstra, H.; Westendorp, F.F. Influence of hydrogen on the magnetic properties of SmCo5. Solid State Commun. 1969, 7, 857–859. [Google Scholar] [CrossRef]
- Boser, O. Hydrogen sorption in LaNi5. J. Less Common Met. 1976, 46, 91–99. [Google Scholar] [CrossRef]
- Buschow, K.H.J.; Van Mal, H.H. Phase relations and hydrogen absorption in the lanthanum-nickel system. J. Less Common Met. 1972, 29, 203–210. [Google Scholar] [CrossRef]
- Van Mal, H.H.; Buschow, K.H.J.; Miedema, A.R. Hydrogen absorption in in LaNi5 and related compounds: Experimental observations and their explanation. J. Less Common Met. 1974, 35, 65–76. [Google Scholar] [CrossRef]
- Tanaka, S.; Flanagan, T.B. Thermodynamics of the solution of hydrogen in LaNi5 at small hydrogen LaNi5 at small hydrogen contents. J. Less Common Met. 1977, 51, 79–91. [Google Scholar] [CrossRef]
- Dayan, D.; Mintz, M.H.; Dariel, M.P. Hysteresis effects in cerium-containing LaNi5-type compounds. J. Less Common Met. 1980, 73, 15–24. [Google Scholar] [CrossRef]
- Meyer-Liautaud, F.; Pasturel, A.; Allibert, C.H.; Colinet, C. Thermodynamic study of the valence state of cerium and hydrogen storage in Ce(Ni1−xCux)5 compounds. J. Less Common Met. 1985, 110, 119–126. [Google Scholar] [CrossRef]
- Clay, K.R.; Goudy, A.J.; Schweibenz, R.G.; Zarynow, A. The effect of the partial replacement of lanthanum in LaNi5-H with cerium, praseodymium, and neodymium on absorption and desorption kinetics. J. Less Common Met. 1990, 166, 153–162. [Google Scholar] [CrossRef]
- Pandey, S.K.; Srivastava, A.; Srivastava, O.N. Improvement in hydrogen storage capacity in LaNi5 through substitution of Ni by Fe. Int. J. Hydrog. Energy 2007, 32, 2461–2465. [Google Scholar] [CrossRef]
- Rożdżyńska-Kiełbik, B.; Iwasieczko, W.; Drulis, H.; Pavlyuk, V.V.; Bala, H. Hydrogenation equilibria characteristics of LaNi5−xZnx intermetallics. J. Alloys Compd. 2000, 298, 237–243. [Google Scholar] [CrossRef]
- Drašner, A.; Blažina, Ž.Ž. Hydrogen sorption properties of the LaNi5−xGax alloys. J. Alloys Compd. 2003, 359, 180–185. [Google Scholar] [CrossRef]
- Gondek, Ł.; Selvaraj, N.B.; Czub, J.; Figiel, H.; Chapelle, D.; Kardjilov, N.; Hilger, A.; Manke, I. Imaging of an operating LaNi4.8Al0.2–based hydrogen storage container. Int. J. Hydrog. Energy 2011, 36, 9751–9757. [Google Scholar] [CrossRef]
- Guzik, M.N.; Lang, J.; Huot, J.; Sartori, S. Effect of Al presence and synthesis method on phase composition of the hydrogen absorbing La–Mg–Ni-based compounds. Int. J. Hydrog. Energy 2017, 42, 30135–30144. [Google Scholar] [CrossRef] [Green Version]
- Ngameni, R.; Mbemba, N.; Grigoriev, S.A.; Millet, P. Comparative analysis of the hydriding kinetics of LaNi5, La0.8Nd0.2Ni5 and La0.7Ce0.3Ni5 compounds. Int. J. Hydrog. Energy 2011, 36, 4178–4184. [Google Scholar] [CrossRef]
- Van Mal, H.H.; Buschow, K.H.J.; Kuijpers, F.A. Hydrogen absorption and magnetic properties of LaCo5xNi5−5x compounds. J. Less Common Met. 1973, 32, 289–296. [Google Scholar] [CrossRef]
- Borzone, E.M.; Blanco, M.V.; Baruj, A.; Meyer, G.O. Stability of LaNi5−xSnx cycled in hydrogen. Int. J. Hydrog. Energy 2014, 39, 8791–8796. [Google Scholar] [CrossRef]
- Han, J.I.; Lee, J.-Y. Influence of oxygen impurity on the hydrogenation properties of LaNi5, LaNi4.7Al0.3 and MmNi4.5Al0.5 during long-term pressure-induced hydriding-dehydriding cycling. J. Less Common Met. 1989, 152, 329–338. [Google Scholar] [CrossRef]
- Tousignant, M.; Huot, J. Hydrogen sorption enhancement in cold rolled LaNi5. J. Alloys Compd. 2014, 595, 22–27. [Google Scholar] [CrossRef]
- Simičić, M.V.; Zdujić, M.; Jelovac, D.M.; Rakin, P.M. Hydrogen storage material based on LaNi5 alloy produced by mechanical alloying. J. Power Sources 2001, 92, 250–254. [Google Scholar] [CrossRef]
- Cheng, L.; Zhou, H.; Xiong, J.; Pan, S.; Luo, J. Microstructure, electromagnetic and microwave absorbing properties of plate-like LaCeNi powder. J. Mater. Sci. Mater. Electron. 2018, 29, 18030–18035. [Google Scholar] [CrossRef]
- Odysseos, M.; De Rango, P.; Christodoulou, C.N.; Hlil, E.K.; Steriotis, T.; Karagiorgis, G.; Charalambopoulou, G.; Papapanagiotou, T.; Ampoumogli, A.; Psycharis, V.; et al. The effect of compositional changes on the structural and hydrogen storage properties of (La–Ce)Ni5 type intermetallics towards compounds suitable for metal hydride hydrogen compression. J. Alloys Compd. 2013, 580, S268–S270. [Google Scholar] [CrossRef]
- Uchida, H.; Masayoshi, T.; Huang, Y.C. The influence of cerium, praseodymium, neodymium and samarium on hydrogen absorption in LaNi5 alloys. J. Less Common Met. 1982, 88, 81–87. [Google Scholar] [CrossRef]
- Tan, Z.; Yang, Y.; Li, Y.; Shao, H. The performances of La1−xCexNi5 (0≤x≤1) hydrogen storage alloys studied by powder microelectrode. J. Alloys Compd. 2008, 453, 79–86. [Google Scholar] [CrossRef]
- Yuan, X.; Liu, H.-S.; Ma, Z.-F.; Xu, N. Characteristics of LaNi5-based hydrogen storage alloys modified by partial substituting La for Ce. J. Alloys Compd. 2003, 359, 300–306. [Google Scholar] [CrossRef]
- Cao, X.X.; Yang, F.S.; Wu, Z.; Wang, Y.Q.; Zhang, Z.X. Experimental Study on the Hydrogen Storage Properties of LaNi5 Alloy in Repeated Hydriding/Dehydriding Cycles. Adv. Mater. Res. 2013, 815, 25–30. [Google Scholar] [CrossRef]
- An, X.H.; Gu, Q.F.; Zhang, J.Y.; Chen, S.L.; Yu, X.B.; Li, Q. Experimental investigation and thermodynamic reassessment of La–Ni and LaNi5–H systems. Calphad 2013, 40, 48–55. [Google Scholar] [CrossRef]
- Quian, S.; Northwood, D.O. Hysteresis in metal-hydrogen systems: A critical review of the experimental observations and theoretical models. Int. J. Hydrog. Energy 1988, 13, 25–35. [Google Scholar] [CrossRef]
- Quian, S.; Northwood, D.O. Elastic and plastic accommodation effects on hysteresis during hydride formation and decomposition. Int. J. Hydrog. Energy 1990, 15, 649–654. [Google Scholar] [CrossRef]
- Panas, A.J.; Fikus, B.; Płatek, P.; Kunce, I.; Witek, K.; Kuziora, P.; Olejarczyk, A.; Dyjak, S.; Michalska-Domańska, M.; Jaroszewicz, L.; et al. Pressurised-cell test stand with oscillating heating for investigation heat transfer phenomena in metal hydride beds. Int. J. Hydrog. Energy 2016, 41, 16974–16983. [Google Scholar] [CrossRef]
Figure 1.
X-ray diffraction (XRD) patterns of the investigated alloys.

Figure 2.
Dependence of the unit cell volume with cerium content (x) in La1-xCexNi5. The cerium content is given as a cerium content in the sample. The one different point on the graph represents the projected close to real cerium content in the refined phase.
Figure 2.
Dependence of the unit cell volume with cerium content (x) in La1-xCexNi5. The cerium content is given as a cerium content in the sample. The one different point on the graph represents the projected close to real cerium content in the refined phase.

Figure 3.
Absorption and desorption isotherms: (a) LaNi5, (b) La0.91Ce0.09Ni5, (c) La0.75Ce0.25Ni5 and (d) La0.5Ce0.5Ni5.
Figure 3.
Absorption and desorption isotherms: (a) LaNi5, (b) La0.91Ce0.09Ni5, (c) La0.75Ce0.25Ni5 and (d) La0.5Ce0.5Ni5.


Figure 4.
SEM images (BSE mode) of the cross-sections for the powder particles of: (a) LaNi5, (b) La0.91Ce0.09Ni5, (c) La0.75Ce0.25Ni5 and (d) La0.5Ce0.5Ni5.
Figure 4.
SEM images (BSE mode) of the cross-sections for the powder particles of: (a) LaNi5, (b) La0.91Ce0.09Ni5, (c) La0.75Ce0.25Ni5 and (d) La0.5Ce0.5Ni5.


Figure 5.
Chemical composition distribution map of the La0.5Ce0.5Ni5 sample: (a) BSE image, (b) La distribution map, (c) Ce distribution map and (d) Ni distribution map.
Figure 5.
Chemical composition distribution map of the La0.5Ce0.5Ni5 sample: (a) BSE image, (b) La distribution map, (c) Ce distribution map and (d) Ni distribution map.

Figure 6.
Chemical composition line scan for the La0.5Ce0.5Ni5 sample: (a) BSE image of the investigated area and (b) chemical composition as a function of distance along the marked line.
Figure 6.
Chemical composition line scan for the La0.5Ce0.5Ni5 sample: (a) BSE image of the investigated area and (b) chemical composition as a function of distance along the marked line.

Figure 7.
Microhardness values of the investigated samples.


Table 1.
Determined unit cell parameters of the LaNi5, La0.91Ce0.09Ni5, La0.75Ce0.25Ni5 and La0.5Ce0.5Ni5 phases.
Table 1.
Determined unit cell parameters of the LaNi5, La0.91Ce0.09Ni5, La0.75Ce0.25Ni5 and La0.5Ce0.5Ni5 phases.
| Sample La1-xCexNi5 | Parameter a (Å) | Parameter c (Å) | Volume (Å3) | Relative Phase Content (%) | Other Phases Present |
|---|---|---|---|---|---|
| LaNi5 | 5.017 | 3.977 | 86.724 | 100 | none |
| La0.91Ce0.09Ni5 | 5.005 | 3.982 | 86.424 | 100 | none |
| La0.75Ce0.25Ni5 | 4.988 | 3.988 | 85.944 | 100 | none |
| La0.5Ce0.5Ni5 | 4.954 | 3.992 | 84.869 | 90.3 ± 1.5 | La2NiO4, X-unidentified phase |
Table 2.
Determined equilibrium pressures of the LaNi5, La0.91Ce0.09Ni5, La0.75Ce0.25Ni5 and La0.5Ce0.5Ni5 samples.
Table 2.
Determined equilibrium pressures of the LaNi5, La0.91Ce0.09Ni5, La0.75Ce0.25Ni5 and La0.5Ce0.5Ni5 samples.
| Sample La1-xCexNi5 | Peq_abs 35 °C (bar) | Peq_abs 40 °C (bar) | Peq_abs 45 °C (bar) | Peq_des 35 °C (bar) | Peq_des 40 °C (bar) | Peq_des 45 °C (bar) |
|---|---|---|---|---|---|---|
| LaNi5 | 3.35 | 4.09 | 4.79 | 2.36 | 2.91 | 3.59 |
| La0.91Ce0.09Ni5 | 5.56 | 6.70 | 7.92 | 3.29 | 3.83 | 4.85 |
| La0.75Ce0.25Ni5 | 12.44 | 14.66 | 17.30 | 5.01 | 5.87 | 7.22 |
| La0.5Ce0.5Ni5 | 43.21 | 48.74 | 56.88 | 11.52 | 14.26 | 17.54 |
Table 3.
Absorption and desorption enthalpies and entropies estimated based on van ’t Hoff’s plots for the LaNi5, La0.91Ce0.09Ni5, La0.75Ce0.25Ni5 and La0.5Ce0.5Ni5 samples.
Table 3.
Absorption and desorption enthalpies and entropies estimated based on van ’t Hoff’s plots for the LaNi5, La0.91Ce0.09Ni5, La0.75Ce0.25Ni5 and La0.5Ce0.5Ni5 samples.
| Sample La1-xCexNi5 | ΔHabs (kJ·mol−1·H2) | ΔHdes (kJ·mol−1·H2) | ΔSabs (J·mol−1·K−1·H2) | ΔSdes (J·mol−1·K−1·H2) |
|---|---|---|---|---|
| LaNi5 | −29.08 | 34.09 | −104.47 | 117.78 |
| La0.91Ce0.09Ni5 | −28.79 | 31.69 | −107.73 | 112.65 |
| La0.75Ce0.25Ni5 | −26.84 | 29.74 | −108.08 | 109.84 |
| La0.5Ce0.5Ni5 | −22.37 | 34.29 | −103.87 | 131.60 |
Table 4.
Average of the measured microhardness values for the LaNi5, La0.91Ce0.09Ni5, La0.75Ce0.25Ni5 and La0.5Ce0.5Ni5 samples.
Table 4.
Average of the measured microhardness values for the LaNi5, La0.91Ce0.09Ni5, La0.75Ce0.25Ni5 and La0.5Ce0.5Ni5 samples.
| Sample La1-xCexNi5 | HV 0.05 (Vickers Hardness) |
|---|---|
| LaNi5 | 631 ± 23 |
| La0.91Ce0.09Ni5 | 661 ± 18 |
| La0.75Ce0.25Ni5 | 703 ± 19 |
| La0.5Ce0.5Ni5 | 681 ± 44; 582 ± 10 |
© 2020 by the authors. Licensee MDPI, Basel, Switzerland. This article is an open access article distributed under the terms and conditions of the Creative Commons Attribution (CC BY) license (http://creativecommons.org/licenses/by/4.0/).
Share and Cite
MDPI and ACS Style
Pęska, M.; Dworecka-Wójcik, J.; Płociński, T.; Polański, M. The Influence of Cerium on the Hydrogen Storage Properties of La1-xCexNi5 Alloys. Energies 2020, 13, 1437. https://doi.org/10.3390/en13061437
AMA Style
Pęska M, Dworecka-Wójcik J, Płociński T, Polański M. The Influence of Cerium on the Hydrogen Storage Properties of La1-xCexNi5 Alloys. Energies. 2020; 13(6):1437. https://doi.org/10.3390/en13061437
Chicago/Turabian StylePęska, Magda, Julita Dworecka-Wójcik, Tomasz Płociński, and Marek Polański. 2020. "The Influence of Cerium on the Hydrogen Storage Properties of La1-xCexNi5 Alloys" Energies 13, no. 6: 1437. https://doi.org/10.3390/en13061437
Note that from the first issue of 2016, this journal uses article numbers instead of page numbers. See further details here.