Beating the Naïve—Combining LASSO with Naïve Intraday Electricity Price Forecasts


Department of Operations Research and Business Intelligence, Wrocław University of Science and Technology, 50-370 Wrocław, Poland
*
Author to whom correspondence should be addressed.
Energies 2020, 13(7), 1667; https://doi.org/10.3390/en13071667
Submission received: 4 February 2020
/
Revised: 13 March 2020
/
Accepted: 24 March 2020
/
Published: 3 April 2020
(This article belongs to the Special Issue Modeling and Forecasting Intraday Electricity Markets)
Abstract
:In the last three decades the vast majority of electricity price forecasting (EPF) research has concerned day-ahead markets. However, the rapid expansion of renewable generation—mostly wind and solar—have shifted the focus to intraday markets, which can be used to balance the deviations between positions taken in the day-ahead market and the actual demand and renewable generation. A recent EPF study claims that the German intraday, continuous-time market for hourly products is weak-form efficient, that is, that the best predictor for the so-called ID3-Price index is the most recent transaction price. Here, we undermine this claim and show that we can beat the naïve forecast by combining it with a prediction of a parameter-rich model estimated using the least absolute shrinkage and selection operator (LASSO). We further argue, that that if augmented with timely predictions of fundamental variables for the coming hours, the LASSO-estimated model itself can significantly outperform the naïve forecast.
1. Introduction
After performing a comprehensive empirical study on intraday electricity price forecasting and considering models with tens of thousands of regressors, Narajewski and Ziel [1] concludes that the German continuous-time market for hourly products is weak-form efficient, that is, that the best predictor is the most recent transaction price. Their result is surprising and at the same time disappointing from a research perspective. Here, we undermine their claim and show that it is possible to build models that significantly outperform the naïve benchmark. Consequently, we invalidate the conjecture that the German intraday market for hourly products is weak-form efficient.
This paper belongs to a new strand of literature on forecasting prices in intraday electricity markets. To date, the workhorse of power trading in Europe has been the uniform price auction, and a vast majority of research and applications have concerned day-ahead (DA) electricity prices [2]. However, the rapid expansion and integration of renewable energy sources (most notably wind and solar), active demand side management (smart meters, smart appliances, etc.) and the introduction of the XBID pan-European trading platform have shifted the focus to intraday markets [3,4,5]. One of the more liquid—and hence more studied—marketplaces, is the German intraday market for quarter-hourly and hourly products [6,7,8,9,10,11,12]. In this continuous-time market, the majority of trading takes place in the last couple of hours before gate closure [13] and on the hourly products [1]; the latter are traded from 15:00 on day until 5 min before the delivery starts on day d, or 30 min before if the trade is made between the delivery zones. The leading reference price is the so-called ID3-Price index (or simply ID3), which is also an underlying instrument of exchange-traded derivative products (see www.eex.com). The index is computed as the volume-weighted average price of all trades on the quarter-hourly and hourly products in the three hour window directly preceding the delivery (see www.epexspot.com).
In this article, we focus on predicting the ID3-Price index a few hours-ahead and develop regression type models that outperform the naïve benchmark. To this end, we consider a large set of past ID3 values, past DA prices and forward-looking fundamental variables, and utilize the least absolute shrinkage and selection operator (LASSO) [14] to eliminate regressors with low explanatory power, as well as apply forecast averaging [15]. By comparing performance of different model structures, we draw important conclusions regarding variable selection and provide recommendations for very short-term electricity price forecasting.
The remainder of the paper is structured as follows. In Section 2, we introduce the dataset and discuss the use of variance stabilizing transformations (VSTs). Next, in Section 3 we describe the naïve approach proposed in Narajewski and Ziel [1] and introduce the model structures used in our study. In Section 4, we compare the predictive performance in terms of two commonly used error measures and the Giacomini and White [16] test for conditional predictive ability. Finally, in Section 5, we wrap up the results and conclude.
2. The Dataset
2.1. The ID3-Price Index and DA Prices
The ID3-Price index takes into account only the most recent trades, that is, transactions that took place no earlier than 3 h before delivery. EPEX SPOT SE publishes the index, however, the currently covered period is too short for a comprehensive evaluation of the forecasts. Therefore, following Narajewski and Ziel [1] and Uniejewski et al. [11], we use an ID3-like time-series reconstructed from the individual transactions and denote it by , where d is the day and h is the hour of delivery, see the top panel in Figure 1. In addition to past ID3 values, we also use prices from the German day-ahead (DA) market, see the middle panel in Figure 1; to better see the differences between the two price series, both are plotted during a sample 4-week period in the bottom panel. Recall, that the DA prices are set around noon on day for all 24 h of day d; we denote them by .
Both time series are of hourly resolution and span 1216 days ranging from 1 January 2015 to 30 April 2018. We consider a rolling estimation scheme with a 364-day window. Initially, we fit our models to data from hour 1 on 1 January 2015 to hour 20 on 30 December 2015 and compute the price forecasts for the first hour of 31 December 2015; note, that there is a 4 h lag between the last known ID3-Price index and the predicted hour. Next, the window is rolled forward by one hour and the predictions for hour 2 of 31 December 2015 are generated. This procedure is repeated until forecasts for hour 24 of 30 April 2018 are made, that is, the last hour in the 852-day long out-of-sample test period.
2.2. Exogenous Variables
The set of exogenous variables considered in this study includes three pairs of time-series that describe the demand-supply relationship in Germany:
- the system-wide load and its day-ahead forecast ,
- the total wind power generation (WPG; off- and on-shore) and its day-ahead forecast ,
- and the total photovoltaic generation (PVG) and its day-ahead forecast ,
where d is the target day and h is the hour. The day-ahead forecasts are plotted in Figure 2; the corresponding actual values of the fundamental variables are indistinguishable from them at this resolution. Naturally, the latter are known ex-post, hence only their lagged values can be used for forecasting. As discussed in Section 3, we utilize them by constructing a series of forecast errors, that is, , for the time moments for which the actual values are available; we assume that is known immediately after its hourly period ends, that is, at . Although an assumption, advances in on-line data collection significantly reduce the latency from the data source to the data provider, to the extent that in the near future this may become reality.
As Goodarzi et al. [3] argue, wind and photovoltaic generation forecasting errors increase the absolute levels of system imbalance in Germany and these in turn influence electricity prices. Hence, we additionally use a set of balancing volumes for the three () quarter-hourly periods directly preceding the time at which the forecast is made, that is, the period spans the first 45 min of the hour preceding the moment of computing the forecast. As in Narajewski and Ziel [1], is defined as the sum of imbalances of all German Transmission System Operators for day d and hour h; this data is published every quarter-hour, 15 min after the end of the delivery.
2.3. Variance Stabilizing Transformation
Following the recommendations put forward by Uniejewski et al. [17], we use the so-called variance stabilizing transformation (VST) to reduce the impact of extreme observations present in demand, generation and particularly in electricity price data. Before applying the VST, each variable is standardized by subtracting the sample median and dividing by the sample median absolute deviation (MAD) or by the sample standard deviation if , corrected by the 75th percentile of the standard normal distribution :
where is the in-sample vector of a given variable, is a single element of and its standardized value. However, unlike earlier studies, we apply the standardization to each variable separately due to a large number of zero-valued observations in the PVG series. Then, we use a well performing VST—the area hyperbolic sine (asinh)—on :
where is the VST-transformed value of .
The back-transformation is more tricky. Uniejewski et al. Uniejewski et al. [17] simply set:
However, Narajewski and Ziel [1] argue that the latter is not correct since in most cases . As a remedy, they propose using the following, mathematically correct back-transformation:
where are in-sample residuals of the model and D is the size of the calibration window. In this study we compare model performance for both back-transformations to assess the loss in predictive power across models of different complexity when using the more popular [4,9,11,17,18], simpler and faster to compute, but generally incorrect transformation (3), instead of (4).
3. The Models
3.1. The Naïve Benchmark
Recall that Narajewski and Ziel [1] conclude their empirical study of intraday hourly products by stating that the market is weak-form efficient, that is, that the best predictor is the most recent transaction price. Since we want to challenge this conjecture, as our benchmark we define:
where denotes the volume-weighted price of transactions that took place in the intraday (ID) market in a y-hour window that ended x hours before delivery on day d and hour h, see Equation (2) in [1]. Using this notation the ID3-Price index can be defined as , that is, the volume-weighted price of transactions that took place in the last three hours of trading (excluding the last 5 or 30 min, see Section 2).
Note, that our naïve benchmark is not identical to the one used in [1], that is, . Instead of assuming that the trader makes the decision and places orders in a 15-min window ending 3 h before delivery, we allow for a one hour window for making the trading decisions (between 4 and 3 h before delivery). This is illustrated in Figure 3, where the red step function represents the time the forecasts are made (4 h before delivery) and the black step function the time the delivery starts.
3.2. LASSO-Estimated Models
An advantage of using automated variable selection is an almost unlimited number of initially considered explanatory variables [19]. In this study, we define a baseline model with 76 potential regressors and its three extensions; the largest one takes into account 200+ explanatory variables. All considered models are estimated in a multivariate modeling framework in the sense of Ziel and Weron [20], that is, an explicit ‘day × hour’ matrix-like structure is used for the 24-dimensional price vectors. However, unlike when forecasting in day-ahead auction markets, where the prices are set once a day, in a continuous-time intraday market we are able to use information updated in the course of the day, for example, more recent weather forecasts.
3.2.1. The Baseline Model
The baseline model is a slightly modified LASSO-estimated model of Uniejewski et al. [11]. The only difference is the omission of some of the less important variables. Namely, we exclude the information about inputs distant in time and only use the latest information about past ID3 and DA prices. As a result, we obtain a model with 76 potential regressors—21 last known ID3-Price index values from the intraday market (that is, nearly the whole day), 24 DA prices for the target day and seven dummy variables (to account for the weekly seasonality). Given the 4-hour forecast to delivery lag and the time the DA prices are published, we can additionally include next day’s DA prices when forecasting hours 16 to 24:
where is the noise term. To simplify the notation when referring to an hourly product with delivery i hours after () or before () the product with delivery on day d and hour h (more precisely: with delivery between hour and h) we define:
For instance, for and we have , while for and we have . Note, that the price for each hour is predicted 4 h in advance, hence the first sum in the above formula starts with , and using the most recent information available, see Figure 3. Later in the text we denote model (6) by baseline.
3.2.2. The Model with Exogenous Variables
The first extension of model (6) is motivated by the results of Uniejewski et al. [21], who showed that fundamental variables play an important role when forecasting DA prices. On the other hand, Monteiro et al. [22] and Andrade et al. [23] argued that fundamentals (historical and predicted demand, generation and weather) did not have much explanatory power when forecasting Spanish intraday prices, since DA prices already included this information. To check whether fundamentals can help in forecasting the ID3-Price index in the German intraday market, we extend the baseline model to include load, wind power generation (WPG) and photovoltaic generation (PVG) forecasts and the corresponding errors, as well as the balancing volumes (Section 2.2 for details):
Later in the text we denote this model by w/exogenous.
3.2.3. The Model with Partial ID Prices
The second extension of model (6) is motivated by the results of Narajewski and Ziel [1]. The authors emphasize that the most important information for forecasting ID3 can be derived from recent transaction data for a given product. Hence, we extend the baseline model to include 8 additional predictors. Firstly, we add the naïve benchmark (5) as one of the explanatory variables. Secondly, we add variables that link the intraday to day-ahead markets and reflect changes in the expectations about price levels over time. More precisely, we construct artificial series that utilize the information from recent transaction data on the neighboring products. For , we define seven partial ID indexes:
where and are respectively the volume and price of a transaction made at time τ on a product with delivery on day d and hour h. Hence, is a volume-weighted price of all transactions on product in the last hour before the forecast is computed, that is, between 5 and 4 h before the delivery. For example, to compute , we use seven hourly windows corresponding to , see the gray-shaded rectangle spanning 7 hourly products in Figure 3. Note, that using the notation we can write:
Finally, we can define the model with partial ID prices as follows (later in the text we denote it by w/partial ID):
3.2.4. The Full Model
Now, we are ready to write the full model (denoted later in the text by full), which includes all elements of models (8) and (11). We end up with a maximum of 222 potential regressors, depending on whether we already know the day-ahead prices for day :
The final modification of the benchmark model is obtained by fixing , as considered in [1]. Later in the text we denote such a model by full-diff, because it corresponds to setting the dependent variable to the difference between ID3 and the naïve benchmark, instead of the ID3-Price index itself.
3.3. LASSO Estimation
In order to explain the estimation scheme, let us use a more compact form of the regression model:
where ’s are the predictors and ’s are the corresponding coefficients. The least absolute shrinkage and selection operator (LASSO) shrinks the coefficients of the less important explanatory variables towards zero and hence performs variable selection [14,24]. The LASSO can be treated as a generalization of linear regression, where instead of minimizing only the residual sum of squares (RSS), the sum of RSS and a linear penalty function of the β’s is minimized:
where is a tuning (or regularization) parameter. Note that setting λ to zero yields the standard least squares estimator, for all ’s tend to zero, while admits a balance between minimizing the RSS and shrinking the coefficients.
Selecting a ‘good’ value for λ is critical. It is, however, a complex problem [9,12,19]. Because of a relatively short dataset, we are not able to reselect λ based on model performance in a validation period. Instead, we have decided to use cross-validation. It can be effectively applied to select the tuning parameter ex-ante, unfortunately at a cost of increased computational complexity. The procedure is discussed in more detail in Section 5.2.
3.4. Forecast Averaging
Combining forecasts in order to obtain more precise and robust predictions is a technique known both in the electricity price forecasting literature [15] and in forecasting in general [25]. Here, we use an ensemble of two predictions—a simple arithmetic average of a LASSO-estimated model (labeled Z) and the naïve forecast:
The motivation for using the arithmetic mean is twofold. Firstly, it is the simplest averaging scheme, requiring no additional calibration. Secondly, it is hard to beat by ‘more sophisticated’ approaches [26].
4. Results
4.1. Forecast Evaluation
The forecasting accuracy is assessed in terms of two error measures: the mean absolute error (MAE) and the root mean squared error (RMSE). The scores are reported for the full out-of-sample test period of days, that is, 31 December 2015 to 30 April 2018, see Figure 1, jointly for all hours of the day:
where is the prediction error for model Z, for day d and hour h. Recall, that the RMSE is the optimal measure for least square problems, whereas the MAE is more robust to outliers [24]. The resulting aggregate MAE and RMSE scores can be used for a direct comparison of the forecasts, but do not allow to draw statistically significant conclusions. Therefore, we use the Giacomini and White [16] test for conditional predictive ability (CPA), which can be treated as a generalization of the more popular Diebold-Mariano test for unconditional predictive ability [2]. First, for each pair of models, following Uniejewski et al. [17] and Ziel and Weron [20], we compute the so-called multivariate loss differential series:
where is the p-th norm of the 24-dimensional vector of out-of-sample errors for model Z. Then, we calculate the p-values of the CPA test with null in the regression: , where contains information for day , that is, a constant and lags of . Note that we use the more parsimonious, multivariate version of the test, as introduced by Ziel and Weron [20]. Due to the strong intraday seasonality we cannot use the standard approach, where forecasts for all hours are treated as one univariate time series and tested jointly. On the other hand, reporting test results for 24 hourly time series independently would require much more space.
4.2. MAE and RMSE Errors
In Table 1 we report the MAE and RMSE metrics for all considered models and their ensembles with the naïve benchmark, as defined in Equation (15). In Figure 4 we additionally visualize the set of results corresponding to back-transformation (4), reflecting the upper part of Table 1. Several important conclusions can be drawn:
- In terms of the MAE, three models outperform the naïve benchmark even without averaging forecasts. However, only the full-diff approach manages to beat the benchmark in terms of the RMSE, see the values emphasized in bold in Table 1 in columns labeled ‘model’.
- All baseline model extensions yield lower errors than the baseline model itself, both in terms of the MAE and RMSE.
- The full model outperforms the model with partial ID prices, which suggests that using the exogenous variables discussed in Section 2.2 improves forecast accuracy.
- Interestingly, for the full-diff model we observe that back-transformation (3) performs better than the mathematically correct VST defined in Equation (4). The difference vanishes when the forecasts are averaged, which is probably caused by the fact that the correction improves performance mainly in the tails, and in the full-diff model the less heavy-tailed price differences are predicted.
- The improvements from averaging forecasts are much higher (ca. 12–14%) for models that do not use the naïve benchmark as a regressor. However, what is surprising, the gains are noticeable (ca. 2–4%) even for models which include this explanatory variable. Apparently, the LASSO scheme does not put enough weight to this variable. Setting in the full-diff model helps, but does not solve the problem completely. We return to this issue in Section 4.4.
4.3. Conditional Predictive Ability
We perform the Giacomini and White [16] test of conditional predictive ability (CPA) to check whether the differences in forecasting accuracy are statistically significant. We conduct the test only for the naïve benchmark and models that utilize back-transformation (4). The p-values of the pairwise comparisons are visualized in Figure 5. We can see that:
- The naïve forecasts can be significantly outperformed by predictions of models that include partial ID information and exogenous variables (full and full-diff models) without averaging, and by most of models after ensembling.
- Forecasts of the baseline model are significantly outperformed by those of any other LASSO-estimated model.
- For all considered models, ensembling significantly improves the accuracy in terms of the linear errors.
- Forecasts of the ens(full) model significantly outperform those of any other model, both in terms of the linear and quadratic errors.
4.4. Why Does Ensembling Improve the Results?
As the above reported results indicate, the ensemble is in most cases able to outperform both individual forecasts. However, the simple averaging scheme proposed in Equation (15) might not be the optimal for this task. Hence, in this Section we consider a more general formula:
where w is the weight assigned to the naïve forecast. In Figure 6 we depict the MAE of ensemble (18) as a function of w for the full model with back-transformation (4). The MAE curve is convex with a minimum at ca. w = 45%. However, the value for w = 50%., that is, the simple mean used in the study, is very close to the optimum.
The reason behind this shape is the characteristic of LASSO forecasts, estimated on long calibration windows. Specifically, the model is trained to generalize well, and such a behavior is reinforced by the fact that there are only a few spikes in the calibration window. As such, the model is able to better predict prices at the typically observed levels at the cost of underestimating spikes, especially negative ones, see Table 2. Note that an ensemble model is either the best performing one, or its performance is very close to the better of the full model and the naïve benchmark.
This behavior can be also observed in Figure 7, which illustrates differences in mean absolute errors— for model = ens(full) or full, across a range of price regimes. Overall 40 price regimes are considered—percentiles 0 to 2.5, percentiles 2.5 to 5, ..., and percentiles 97.5 to 100—with each point placed in the middle of the corresponding 2.5-percentile interval. Note, that for all except the very extreme intervals the ens(full) and full models consistently outperform the naïve benchmark. On the other hand, in the tails of the price distribution the benchmark excels, likely due to the ability to quickly adapt to unexpected market situations. Therefore the ensemble (regardless of the weights) balances the generalization of the LASSO forecasts with the ability to quickly adapt to non-recurring phenomena of the naïve benchmark, with both ensemble components playing an important role in achieving this effect.
5. Discussion and Conclusions
The motivation for this study was a claim made by Narajewski and Ziel [1], that the German intraday, continuous-time market for hourly products was weak-form efficient, that is, that the best predictor for the ID3-Price index was the most recent transaction price. Performing a comprehensive forecasting exercise involving parameter-rich regression-type models with four types of fundamental variables as inputs, we have been able to challenge their claim and show that we can significantly outperform the naïve forecast by combining it with a prediction of a LASSO-estimated model. To keep the empirical part of the paper concise, we have opted for omitting some of the considerations. Let us now briefly discuss them.
5.1. The Moment of Forecasting the ID3-Price Index
After consulting with practitioners, we have decided to focus on a forecasting scheme used by Uniejewski et al. [11], where the predictions are made four hours before delivery. This means, that a trader has an hour to make the decisions and build a long or short position before the ID3 transaction window opens three hours before delivery. However, to check whether also the benchmark of Narajewski and Ziel [1] can be outperformed, we have recalculated our models in their setting. Naturally, the Naive.MR1 is harder to beat than our naïve model, because it uses more recent transaction data. Yet, the relative performance vs. the benchmark was qualitatively the same as reported in Section 4.
5.2. Selecting the LASSO Regularization Parameter
For the choice of the regularization parameter, we have resorted to using an automated cross validation (CV) technique. More precisely, the applied CV procedure consisted of three folds with a dense logarithmic grid of 50 λ values spanning six orders of magnitude. Two thirds of the calibration sample was used for training the models estimated with different λ’s, the remaining one third for testing them. This resulted in a significantly increased computational burden, due to the need of testing multiple models for multiple λ’s, but also allowed for an ex-ante choice of the regularization parameter. We have also performed a limited numerical experiment to compare with the results obtained for the best ex-post selected λ. As it turned out, the difference in the MAE and RMSE errors was less than 0.5%.
5.3. The Impact of Intraday Updates of the Fundamentals
We have also tried to assess the impact of using more recent forecasts of the system-wide load, wind power generation, photovoltaic generation and balancing volumes. We have measured the predictive performance of our models under the assumption that we know future values of the exogenous variables until the end of the target day. With such ‘perfect forecasts’ we have been able to additionally reduce the forecasting error by more than 2%. This result emphasizes how important in short-term forecasting is the availability of more frequently updated forecasts of the exogenous variables.
5.4. Model Size
As mentioned above, the LASSO procedure allows for an efficient estimation of parameter-rich models. However, the quality of the obtained estimates can differ for different sizes of the regression model. Having only ca. 360 observations in the calibration window, we may obtain worse forecasts if we consider dozens or hundreds of redundant variables in the model. The full model defined by Equation (12) includes only ca. 200 potential predictors. Interestingly it outperforms by ca. 0.6% a richer model with more than 800 variables (the same information sources, but more past observations). Therefore we advise to use expert knowledge and/or back-testing to eliminate non-informative predictors before running the LASSO.
5.5. Directions for Future Research
Given that the literature on forecasting prices in European intraday power markets is still very scarce, our study is a step forward towards understanding the impact of using recent transaction data and exogenous variables on the predictive performance. Our study can be further expanded in several directions. In particular, we report the results for only one VST (for more suggestions see Reference [17]) and without decomposing the data into a long-term seasonal component and the remaining stochastic part (for the importance of doing this see, for example, References [27,28]). Furthermore, we have focused on point forecasting, ignoring the full predictive distribution [8,29] or—what may be even more important in continuous-time intraday markets—the trajectories [13,30]. We have restricted ourselves to using regression-based models, however, machine learning techniques could be used in this context as well [12,22,23,31], naturally at the cost of an increased computational burden. Finally, recall from Section 4.4, that the ensemble we use balances the generalization of the LASSO forecasts with the ability to quickly adapt to non-recurring phenomena of the naïve benchmark. A potentially viable alternative would be to use the approach introduced by Hubicka et al. [32], which averages forecasts of a given model across calibration windows of different length.
Author Contributions
Conceptualization, R.W.; investigation, G.M. and B.U.; software, G.M. and B.U.; validation, all authors; writing—original draft, G.M. and B.U.; writing—review and editing, all authors. All authors have read and agree to the published version of the manuscript.
Funding
This work was partially supported by the National Science Center (NCN, Poland) through grant No. 2018/30/A/HS4/00444 (to G.M.), the Ministry of Science and Higher Education (MNiSW, Poland) through grant No. 0199/DIA/2019/48 (to B.U.), and the German Research Foundation (DFG, Germany) and the National Science Center (NCN, Poland) through grant No. 2016/23/G/HS4/01005 (to R.W.).
Conflicts of Interest
The authors declare no conflict of interest.
References
- Narajewski, M.; Ziel, F. Econometric modelling and forecasting of intraday electricity prices. J. Commod. Mark. 2019. [Google Scholar] [CrossRef] [Green Version]
- Weron, R. Electricity price forecasting: A review of the state-of-the-art with a look into the future. Int. J. Forecast. 2014, 30, 1030–1081. [Google Scholar] [CrossRef] [Green Version]
- Goodarzi, S.; Perera, H.; Bunn, D. The impact of renewable energy forecast errors on imbalance volumes and electricity spot prices. Energy Policy 2019, 134, 110827. [Google Scholar] [CrossRef]
- Kath, C. Modeling intraday markets under the new advances of the cross-border intraday project (XBID): Evidence from the German intraday market. Energies 2019, 12, 4339. [Google Scholar] [CrossRef] [Green Version]
- Maciejowska, K. Assessing the impact of renewable energy sources on the electricity price level and variability—A quantile regression approach. Energy Econ. 2020, 85, 104532. [Google Scholar] [CrossRef]
- Ciarreta, A.; Muniain, P.; Zarraga, A. Modeling and forecasting realized volatility in German–Austrian continuous intraday electricity prices. J. Forecast. 2017, 36, 680–690. [Google Scholar] [CrossRef]
- Kiesel, R.; Paraschiv, F. Econometric analysis of 15-minute intraday electricity prices. Energy Econ. 2017, 64, 77–90. [Google Scholar] [CrossRef] [Green Version]
- Bunn, D.; Gianfreda, A.; Kermer, S. A trading-based evaluation of density forecasts in a real-time electricity market. Energies 2018, 11, 2658. [Google Scholar] [CrossRef] [Green Version]
- Kath, C.; Ziel, F. The value of forecasts: Quantifying the economic gains of accurate quarter-hourly electricity price forecasts. Energy Econ. 2018, 76, 411–423. [Google Scholar] [CrossRef] [Green Version]
- Maciejowska, K.; Nitka, W.; Weron, T. Day-ahead vs. Intraday—Forecasting the price spread to maximize economic benefits. Energies 2019, 12, 631. [Google Scholar] [CrossRef] [Green Version]
- Uniejewski, B.; Marcjasz, G.; Weron, R. Understanding intraday electricity markets: Variable selection and very short-term price forecasting using LASSO. Int. J. Forecast. 2019, 35, 1533–1547. [Google Scholar] [CrossRef] [Green Version]
- Janke, T.; Steinke, F. Forecasting the price distribution of continuous intraday electricity trading. Energies 2019, 12, 4262. [Google Scholar] [CrossRef] [Green Version]
- Narajewski, M.; Ziel, F. Estimation and simulation of the transaction arrival process in intraday electricity markets. Energies 2019, 12, 4518. [Google Scholar] [CrossRef] [Green Version]
- James, G.; Witten, D.; Hastie, T.; Tibshirani, R. An Introduction to Statistical Learning with Applications in R; Springer: New York, NY, USA, 2013. [Google Scholar]
- Nowotarski, J.; Raviv, E.; Trück, S.; Weron, R. An empirical comparison of alternate schemes for combining electricity spot price forecasts. Energy Econ. 2014, 46, 395–412. [Google Scholar] [CrossRef]
- Giacomini, R.; White, H. Tests of conditional predictive ability. Econometrica 2006, 74, 1545–1578. [Google Scholar] [CrossRef] [Green Version]
- Uniejewski, B.; Weron, R.; Ziel, F. Variance stabilizing transformations for electricity spot price forecasting. IEEE Trans. Power Syst. 2018, 33, 2219–2229. [Google Scholar] [CrossRef] [Green Version]
- de Marcos, R.; Bello, A.; Reneses, J. Electricity price forecasting in the short term hybridising fundamental and econometric modelling. Electr. Power Syst. Res. 2019, 167, 240–251. [Google Scholar] [CrossRef]
- Uniejewski, B.; Weron, R. Efficient forecasting of electricity spot prices with expert and LASSO models. Energies 2018, 11, 2039. [Google Scholar] [CrossRef] [Green Version]
- Ziel, F.; Weron, R. Day-ahead electricity price forecasting with high-dimensional structures: Univariate vs. multivariate modeling frameworks. Energy Econ. 2018, 70, 396–420. [Google Scholar] [CrossRef] [Green Version]
- Uniejewski, B.; Nowotarski, J.; Weron, R. Automated variable selection and shrinkage for day-ahead electricity price forecasting. Energies 2016, 9, 621. [Google Scholar] [CrossRef] [Green Version]
- Monteiro, C.; Ramirez-Rosado, I.; Fernandez-Jimenez, L.; Conde, P. Short-term price forecasting models based on artificial neural networks for intraday sessions in the Iberian electricity market. Energies 2016, 9, 721. [Google Scholar] [CrossRef]
- Andrade, J.; Filipe, J.; Reis, M.; Bessa, R. Probabilistic price forecasting for day-ahead and intraday markets: Beyond the statistical model. Sustainability 2017, 9, 1990. [Google Scholar] [CrossRef] [Green Version]
- Ziel, F. Forecasting electricity spot prices using LASSO: On capturing the autoregressive intraday structure. IEEE Trans. Power Syst. 2016, 31, 4977–4987. [Google Scholar] [CrossRef] [Green Version]
- Elliott, G.; Timmermann, A. Economic Forecasting; Princeton University Press: Princeton, NJ, USA, 2016. [Google Scholar]
- Diebold, F.X.; Shin, M. Machine learning for regularized survey forecast combination: Partially-egalitarian LASSO and its derivatives. Int. J. Forecast. 2018, 35, 1679–1691. [Google Scholar] [CrossRef]
- Nowotarski, J.; Weron, R. On the importance of the long-term seasonal component in day-ahead electricity price forecasting. Energy Econ. 2016, 57, 228–235. [Google Scholar] [CrossRef] [Green Version]
- Marcjasz, G.; Uniejewski, B.; Weron, R. On the importance of the long-term seasonal component in day-ahead electricity price forecasting with NARX neural networks. Int. J. Forecast. 2019, 35, 1520–1532. [Google Scholar] [CrossRef]
- Nowotarski, J.; Weron, R. Recent advances in electricity price forecasting: A review of probabilistic forecasting. Renew. Sustain. Energy Rev. 2018, 81, 1548–1568. [Google Scholar] [CrossRef]
- Muniain, P.; Ziel, F. Probabilistic forecasting in day-ahead electricity markets: Simulating peak and off-peak prices. Int. J. Forecast. 2020. [Google Scholar] [CrossRef] [Green Version]
- Oksuz, I.; Ugurlu, U. Neural network based model comparison for intraday electricity price forecasting. Energies 2019, 12, 4557. [Google Scholar] [CrossRef] [Green Version]
- Hubicka, K.; Marcjasz, G.; Weron, R. A note on averaging day-ahead electricity price forecasts across calibration windows. IEEE Trans. Sustain. Energy 2019, 10, 321–323. [Google Scholar] [CrossRef]
Figure 1.
The ID3-Price index (top) and the day-ahead prices (middle) from 1 January 2015 to 30 April 2018, and a zoom in on a 4-week period of both price series (bottom). The vertical dashed lines mark the beginning of the 852-day long out-of-sample test period and the boxes show the zoom in area.
Figure 1.
The ID3-Price index (top) and the day-ahead prices (middle) from 1 January 2015 to 30 April 2018, and a zoom in on a 4-week period of both price series (bottom). The vertical dashed lines mark the beginning of the 852-day long out-of-sample test period and the boxes show the zoom in area.

Figure 2.
Three forward-looking fundamental time-series: system-wide load forecasts (top), wind generation forecasts (middle) and solar generation forecasts (bottom) for the period from 1 January 2015 to 30 April 2018. All three are published on day and concern the 24 h of day d. As in Figure 1, the vertical dashed lines mark the beginning of the 852-day long out-of-sample test period.

Figure 3.
Illustration of the forecasting framework using actual transaction data from the German intraday, continuous-time market for hourly products from 26 April 2018 16:00 to 27 April 2018 24:00. The black step function represents the moment the delivery starts (every hour of Friday, 27 April 2018), the circles refer to actual trades, with circle size indicating the traded volume (from 0.1 to 300 MWh) and color the price (see the colorbar on the right), and the red step function represents the moment the forecasts are made. For instance, at 12:00 on 27 April 2018 when forecasting the price for 16:00 (⟶), the most recent ID3 value is for 12:00 (*). The grey-shaded area indicates the data used for computing the seven partial ID3 indices utilized when forecasting the price for hour 16, see Section 3.2.3 for details.

Figure 4.
Bar plots illustrating the MAE (top) and RMSE (bottom) errors reported in the upper part of Table 1, that is, for the naïve benchmark and models that utilize back-transformation (4). The black dashed lines correspond to the benchmark, the solid bars represent the individual models and the dotted bars the corresponding ensembles.
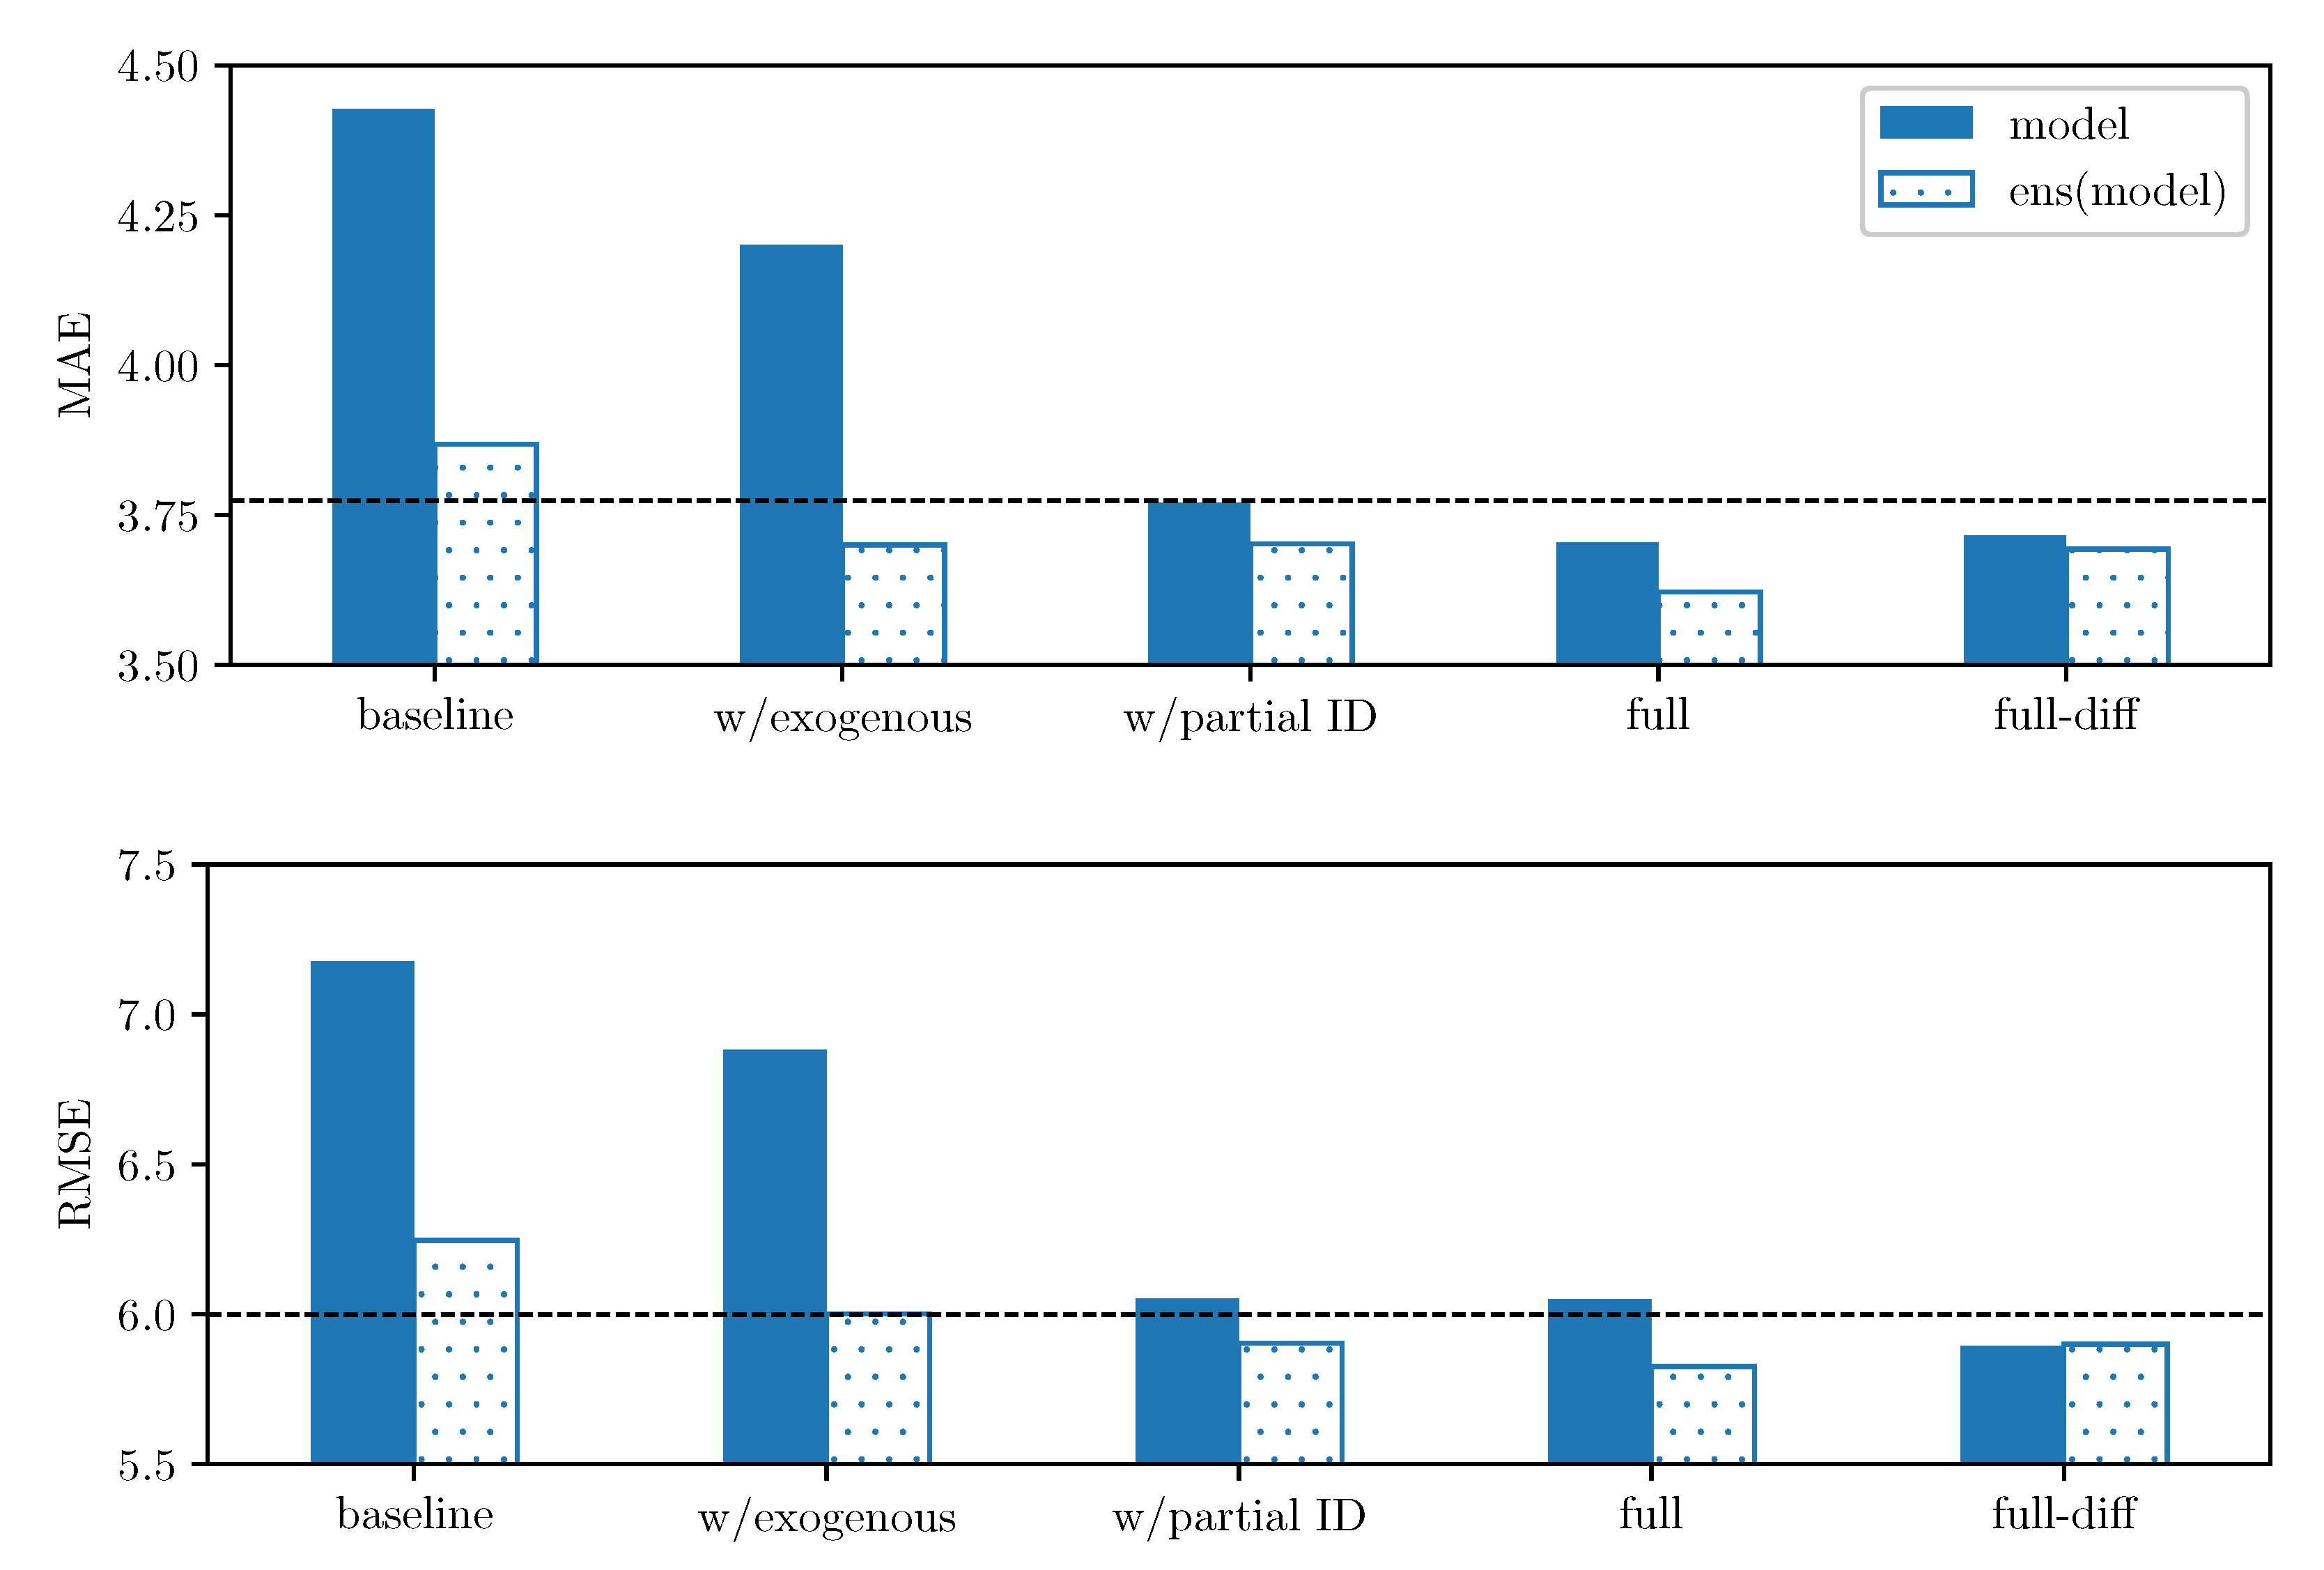
Figure 5.
Results of the conditional predictive ability (CPA) test of Giacomini and White [16] for the linear (left) and quadratic (right) errors. We use a heat map to indicate the range of the p-values—the closer they are to zero (→ dark green) the more significant is the difference between the forecasts of a model on the X-axis (better) and the forecasts of a model on the Y-axis (worse).
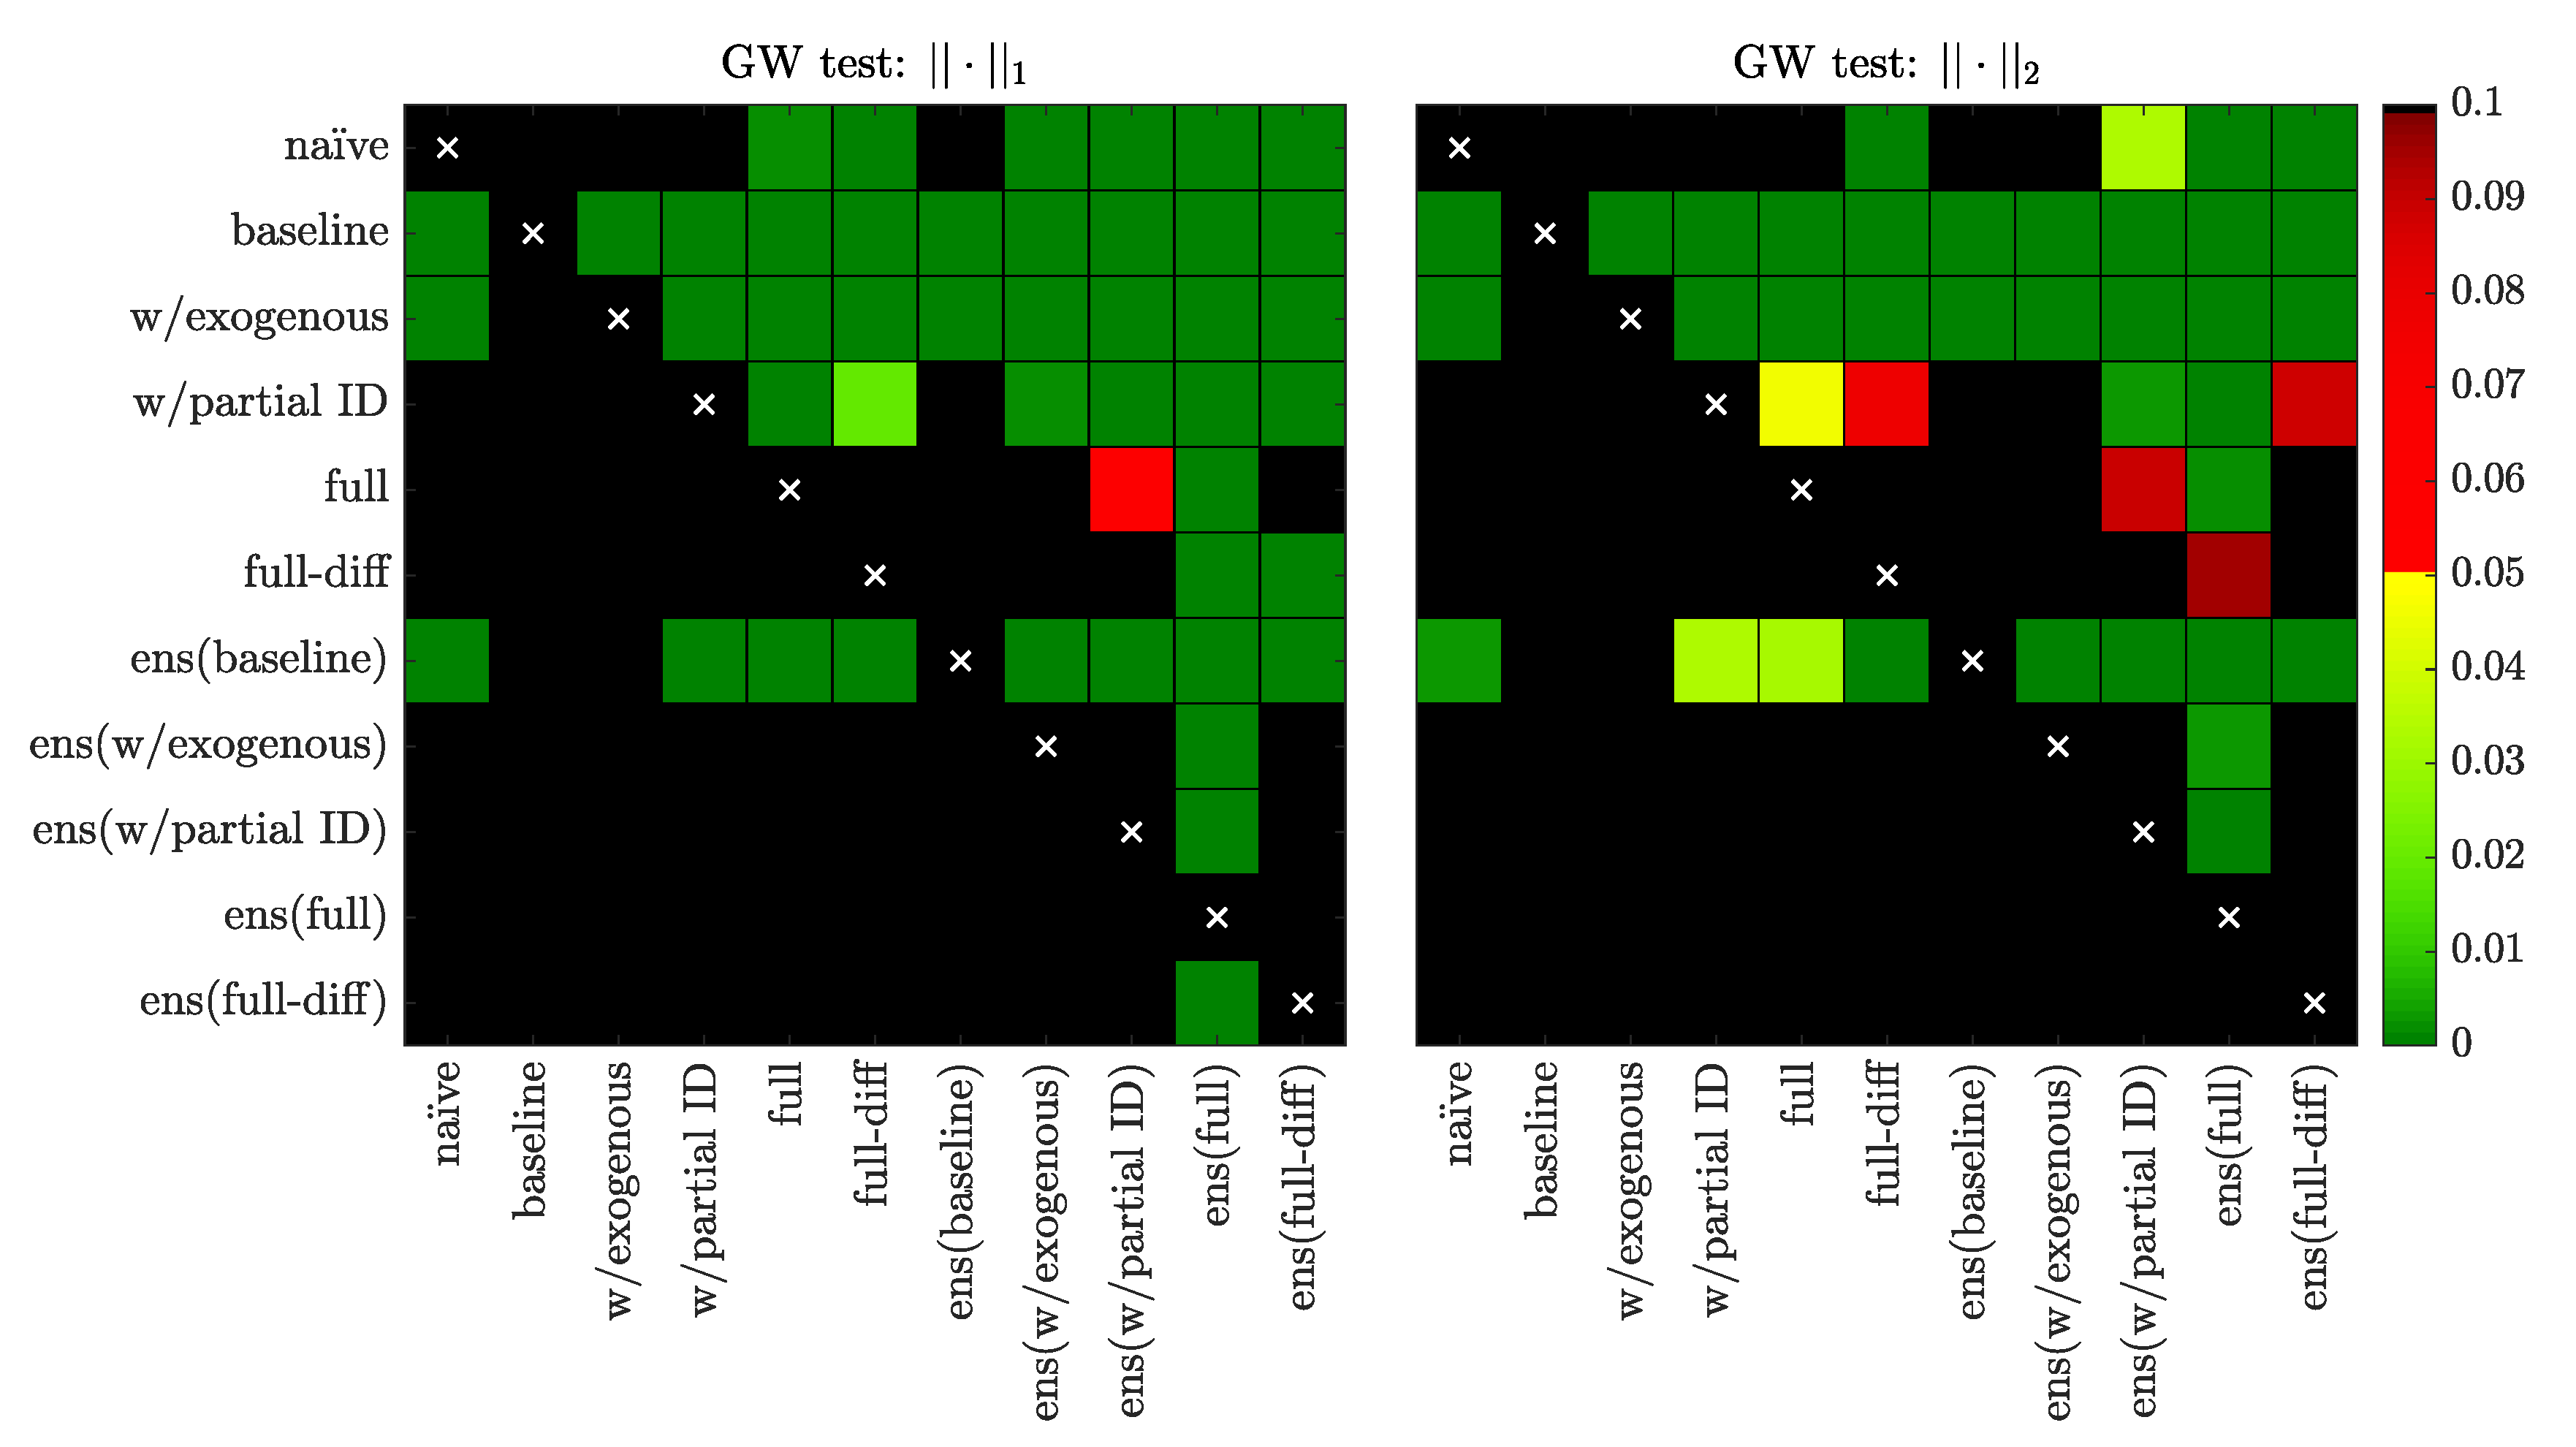
Figure 6.
The MAE errors of ensembles created using Equation (18) that utilize the full model with back-transformation (4), as a function of the weight assigned to the naïve benchmark.

Figure 7.
Differences in mean absolute errors across a range of price regimes: for model = ens(full) or full; both with back-transformation (4). The x-axis represents percentiles of the marginal distribution of prices observed in the out-of-sample test period, with each point placed in the middle of the corresponding 2.5-percentile interval. The first point of the blue curve, that is, for observations between percentiles 0 and 2.5, is out of bounds since for the extremely low prices.


Table 1.
MAE and RMSE errors for all 852 days of the out-of-sample test period, see Figure 1. The upper part of the table reports on the results obtained for models which use back-transformation (4), while the lower that use back-transformation (3). Columns labeled ‘model’ refer to the models themselves, while those labeled ‘ens(model)’ to ensembles with the naïve benchmark, as defined in Equation (15). Errors smaller than those of the naïve benchmark are emphasized in bold.
| Back- | Model | MAE | RMSE | ||
|---|---|---|---|---|---|
| Transformation | Class | Model | ens(Model) | Model | ens(Model) |
| naïve | 3.774 | — | 5.999 | — | |
| With correction proposed in [1], see Equation (4) | baseline | 4.427 | 3.868 | 7.178 | 6.246 |
| w/exogenous | 4.200 | 3.700 | 6.882 | 6.001 | |
| w/partial ID | 3.771 | 3.702 | 6.052 | 5.903 | |
| full | 3.704 | 3.622 | 6.050 | 5.826 | |
| full-diff | 3.716 | 3.693 | 5.894 | 5.900 | |
| As originally introduced in [17], see Equation (3) | baseline | 4.433 | 3.866 | 7.294 | 6.285 |
| w/exogenous | 4.208 | 3.703 | 6.990 | 6.046 | |
| w/partial ID | 3.807 | 3.708 | 6.182 | 5.942 | |
| full | 3.725 | 3.627 | 6.154 | 5.862 | |
| full-diff | 3.691 | 3.703 | 5.887 | 5.918 | |
Table 2.
The MAE and RMSE errors across five regimes defined by percentiles of the marginal distribution of prices observed in the out-of-sample test period: 0 to 2.5, 2.5 to 25, 25 to 75, 75 to 97.5, and 97.5 to 100. The LASSO model used is the full model with back-transformation (4). The lowest score for each error measure and regime is emphasized in bold.
| Model | Percentiles | ||||
|---|---|---|---|---|---|
| 0 to 2.5 | 2.5 to 25 | 25 to 75 | 75 to 97.5 | 97.5 to 100 | |
| MAE | |||||
| naïve | 12.35 | 3.882 | 2.795 | 3.982 | 11.94 |
| full | 14.04 | 3.757 | 2.668 | 3.836 | 12.42 |
| ens(full) | 12.43 | 3.672 | 2.663 | 3.815 | 11.81 |
| RMSE | |||||
| naïve | 17.03 | 5.452 | 3.781 | 5.296 | 18.54 |
| full | 19.46 | 5.206 | 3.555 | 5.111 | 18.82 |
| ens(full) | 17.26 | 5.118 | 3.576 | 5.086 | 18.33 |
© 2020 by the authors. Licensee MDPI, Basel, Switzerland. This article is an open access article distributed under the terms and conditions of the Creative Commons Attribution (CC BY) license (http://creativecommons.org/licenses/by/4.0/).
Share and Cite
MDPI and ACS Style
Marcjasz, G.; Uniejewski, B.; Weron, R. Beating the Naïve—Combining LASSO with Naïve Intraday Electricity Price Forecasts. Energies 2020, 13, 1667. https://doi.org/10.3390/en13071667
AMA Style
Marcjasz G, Uniejewski B, Weron R. Beating the Naïve—Combining LASSO with Naïve Intraday Electricity Price Forecasts. Energies. 2020; 13(7):1667. https://doi.org/10.3390/en13071667
Chicago/Turabian StyleMarcjasz, Grzegorz, Bartosz Uniejewski, and Rafał Weron. 2020. "Beating the Naïve—Combining LASSO with Naïve Intraday Electricity Price Forecasts" Energies 13, no. 7: 1667. https://doi.org/10.3390/en13071667
Note that from the first issue of 2016, this journal uses article numbers instead of page numbers. See further details here.