Acid-Catalyzed Wet Torrefaction for Enhancing the Heating Value of Barley Straw


1
Laboratory of Simulation of Industrial Processes, Department of Industrial Management and Technology, School of Maritime and Industrial Studies, University of Piraeus, 80 Karaoli & Dimitriou, GR 18534 Piraeus, Greece
2
Chemical Process and Energy Resources Institute (CERTH/CPERI), Centre for Research & Technology Hellas, Athens branch: Egialias 52, GR-15125 Marousi, Athens, Greece
3
Institute of Nanoscience and Nanotechnology, National Centre for Scientific Research “Demokritos”, GR-15310 Agia Paraskevi Attikis, Athens, Greece
*
Author to whom correspondence should be addressed.
Energies 2020, 13(7), 1693; https://doi.org/10.3390/en13071693
Submission received: 25 February 2020
/
Revised: 14 March 2020
/
Accepted: 24 March 2020
/
Published: 3 April 2020
(This article belongs to the Special Issue Solid Fuels Technology and Applications.)
Abstract
:In the present study, the possibility of improving the higher heating value (HHV) of lignocellulosic biomass, especially barley straw, was examined. The research deals with the treatment of barley straw by acid-catalyzed wet torrefaction (ACWT), also called acid hydrolysis, in a batch reactor (autoclave) Parr 4553 3.75 L. In this case, two different simulation approaches were applied: (i) combined severity factor (CSF) and (ii) response surface methodology (RSM) based on Box–Behnken design of experiments (DoE). Sulfuric acid (SA) concentration, temperature and time were the ACWT parameters examined herein. An oxygen bomb calorimeter was used for the HHV measurement. The findings indicated that the composition changes of the straw due to ACWT had a significant effect on the HHV of the pretreated material. In this study, treatment conditions were 10–35 mM SA, 160–200 °C and an isothermal reaction time 0–40 min (preheating period not included in these values). In conclusion, there was a significant increase in the HHV up to 24.3 MJ/kg for the ACWT barley straw, compared to 17.5 MJ/kg for the untreated straw, at optimal conditions of 200 °C for 25 min (isothermal period) and 35 mM SA. This resulted in a 1.39 enhancement factor (EF) and 68% energy yield (EY).
1. Introduction
The increase in worldwide energy demand has a significant effect on the fossil fuel contribution to environmental pollution and climate change, provoking a global interest in the use of environmentally friendly, renewable fuels [1,2]. Renewable biomass is one of the emerging energy resources with high potentials that can balance CO2 emissions [3]. Lignocellulosic biomass is currently a major energy source for fossil fuel partial substitution [4,5,6]. Biomass contributes about 10% of the global annual energy production [7,8]. Thus, biomass attracts considerable research interest in order to meet the increasing future sustainable energy demand [9]. Biomass is widely available in nature and accounts for around 100 billion tons per year [6]. Heat, electricity, fuel, chemicals and other high added value products can be produced from biomass [7,9].
Moreover, biomass disadvantages include heterogeneity in structure, low density, high humidity, low higher heating values (HHVs) and flexibility, all of which limit the use of biomass as a fuel [7,10]. These disadvantages make the production of heat and energy from biomass more complicated. They result in the increased cost of processing, transporting and storing of biomass fuels. Consequently, we need to process the fuel and upgrade it through processes like the torrefaction process. Combined with understanding and studying the mechanisms of the biomass reaction through the torrefaction process, it will be easier to develop the technologies for thermal utilization of biomass [7,11,12,13,14,15].
There are mainly two torrefaction categories in the recent literature: dry torrefaction (DT) and wet torrefaction (WT). Both these techniques produce biomass fuels with improved chemical and physical qualities compared to the untreated biomass characteristics [7]. No references were found with regard to acid-catalyzed wet torrefaction (ACWT) but it could be considered as a subcategory of WT which uses, e.g., SA as catalyst (not autocatalyzed by organic acids produced during WT). On the other hand, acid hydrolysis was examined for production of fermentable to bioethanol sugars from lignocellulosic biomass [16,17]. However, DT has been extensively studied for decades and significant references appear in the international literature [13,14,15] while WT appeared later, and is associated with concepts such as autohydrolysis, hydrothermal carbonization, hydrothermal pretreatment, etc. In recent years, research on WT has increased compared to investigation on DT [7,18,19].
WT is the treatment of biomass with hydrothermal media at 180–260 °C with pressures at 0.9–4.6 MPa, respectively [4,7,20,21]. WT seems to be a promising technology to produce low cost high quality solid biomass fuels from agricultural wastes. WT is synonymous with “hydrothermal carbonization” or “hydrothermal conversion” [22] or “hydrothermal treatment” [23]. Sometimes WT and hydrothermal carbonization terminologies are used alternatively. Although WT is applied to produce advanced solid fuels, hydrothermal carbonization is primarily used for coal production. WT gives fuels with an increased HHV, as well as low carbon emissions, which can also be considered as moderate biomass pyrolysis at 200–300 °C [24]. WT produces solid fuels with enhanced properties at comparatively milder conditions with regard to time and temperature [25]. Furthermore, WT was considered to be a low cost and thus cost-effective prefabrication method with promising equipment corrosion-limiting properties and simple operation [4,7]. After All, WT or hydrothermal pretreatment has attracted an interest, being an effective way to convert high moisture biomass [26]. Recently, Gan et al. [27] developed microwave-assisted ACWT (using various acids as catalysts) of microalgae for simultaneous production of char and sugars.
According to He et al. [4], issues associated with operating cost, pollutant emissions, re-design of industrially scale reactor, and system integration with downstream applications must be solved in order to make WT environmentally and commercially sustainable. The most critical issues deal with (i) requirements of reactor materials withstanding high temperature, moderate pressure and severe corrosion; (ii) clogging issues caused by inorganic precipitates; (iii) post-treatment of wastewater and downstream application of WT material; and (iv) heat recovery to minimize energy consumption.
Furthermore, in ACWT the recovery and recycling of the used acid (e.g., sulfuric acid) is crucial. According to Gan et al. [27] the corrosive nature of sulfuric acid requires a high capital cost for the pretreatment reactor, as well as high safety and handling measures due to using acid. Moreover, the generated byproducts inhibit bioethanol production from the sugars in the ACWT liquid phase and requires costly downstream waste treatment.
In our recently published work [28], the effect of DT in a muffle furnace on barley straw HHV was simulated using the combined severity factor (CSF) methodology (incorporating the effect of reaction time and temperature). In this study, in an effort to optimize the HHV of barley straw, the feasibility of ACWT was examined. Thus, the subject of this research is the modification of barley straw by acid hydrolysis using a batch reactor (autoclave). The pretreatment conditions were time, temperature and acid concentration. Moreover, two approaches were used to simulate the HHV enhancement during the performed experiments. These approaches were (i) the response surface methodology (RSM) based on a Box–Behnken design of experiments (DoE) and (ii) CSF. The HHV of the ACWT barley straw was compared to that of the untreated material. Afterwards, the ACWT conditions were optimized for maximizing the HHV of modified barley straw.
2. Materials and Methods
2.1. Material Development
The experiments performed using barley straw, originated in the Kapareli village of Thebes, Greece (38°14′8″ N 23°12′59″ E). The original straw was manually cut to particles of 2 and 3 cm. The specific fraction was considered to be suitable because in this way homogeneity could be achieved when the ACWT procedure was over. The untreated straw moisture was 6.0% w/w measured according to the procedure UNE-EN ISO 18134-1: 2015. Moreover, the barley straw used for the experiments in this work was the same raw material used in an earlier study of our team on DT [28].
2.2. ACWT Process
To carry out the ACWT treatment, a Parr 4553 batch reactor 3.75 L was used, being capable of reaching working temperatures up to 250 °C, while the planned experiments require a constant prevailing temperature of 160 or 180 or 200 °C. For each temperature level, there was a set of experiments which combine different acid concentration and reaction time. More specifically, the different SA concentrations tested herein were 0.01, 0.0225 and 0.035 M over 0, 20 or 40 min of reaction time each (isothermal reaction periods, not including the preheating and cooling period). When the sample has remained in the reactor vessel for the planned time, the cooling process kicks in, cooling the vessel to approximately 25 °C. It should be noted that throughout each experiment, the liquid/solid solution was stirred at 150 rpm, while the vessel preheating and the duration of the cooling process is neglected. The ACWT process was followed by a separation and drying process. In particular, the samples were extracted from the liquid solution using a No. 3 Whatman filter, washed and finally dried at 105 °C using an oven. The solid residue yield (SRY) was estimated by comparing the substrate weight, before and after the ACWT process, i.e., as the fraction substrate used for torrefaction.
2.3. Bomb Calorimeter
A Parr 1341 Plain Jacket Bomb Calorimeter was used for the HHV measurements. The original barley straw and modified barley straw samples produced by ACWT were tested for HHV determination according to the method ISO 1928:2009 “Solid mineral fuels—Determination of gross calorific value by the bomb calorimetric method and calculation of net calorific value”. More details are given in a recent work of our team [28].
2.4. Proximate and Ultimate Analysis
The moisture content, the volatile matter (VM), the fixed carbon (FC), the ash, the carbon, the hydrogen, the nitrogen, the sulfur and the oxygen (by difference) of untreated and ACWT pretreated samples was determined by proximate and ultimate analysis.
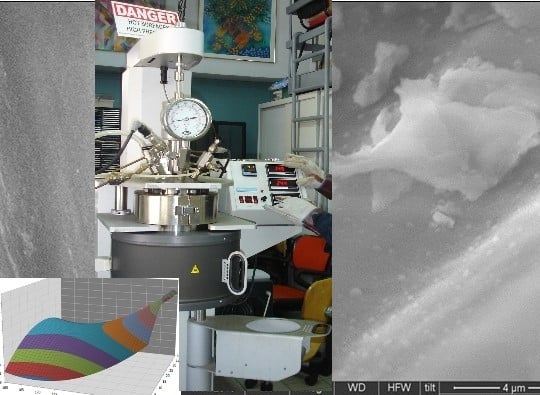
2.5. Scanning Electron Microscopy
Scanning electron microscopy (SEM) was used to examine the surface topology changes of the untreated barley straw compared to the ACWT treated barley straw. For this purpose, a FEI INSPECT SEM equipped with an EDAX super ultra-thin window analyzer for energy-dispersive X-ray spectroscopy (EDS) was used.
2.6. Combined Severity Factor
In order to incorporate the effect of reaction conditions (SA concentration, time and temperature) into a single ordinate we applied the CSF. The CSF concept was based on the “P factor” or “reaction ordinate” presented by Brasch and Free [29] in 1965 and Overend and Chornet [30] in 1987:
where T represents the temperature and t is the time of the procedure.
P factor = [exp((T − 100)/14.75] · t
In 1990, Chum et al. [31], and in 1992, Abatzoglou et al. [32] expanded this abovementioned formula, including the effects induced by how acidic or basic the solution is, according to the following equation:
The CSF concept enables the comparison and\or unifications of different pretreatments. CSF has been widely used. For instance, it was used on acid hydrolysis (used as a first step before enzymatic saccharification) for softwood and corn stover samples, in the study Lloyd and Wyman [33], as well as for samples of wheat straw by Kabel et al. [34]. However, the latter study is the only one characterized by low CSF, to the best of our knowledge. In particular, CSF in the study of Kabel et al. ranges from −1.7 to 1.5, while in contrast Lloyd and Wyman’s CSF ranges from 0.4 to 2.7.
CSF also can be used for non-isothermal acid treatment, based on previous studies [35,36,37], with the major difference from Equation (2) laying in expressing with more detail the change of temperature over time (including preheating and cooling period over the commonly used isothermal period):
The pH was measured in the liquid phase derived after ACWT (i.e., acid hydrolysis pretreatment).
In the present work, the CSF is as expressed by Equation (3).
2.7. Statistical Method
As a second method (additional to CSF), the RSM is used to incorporate the effect of the ACWT variables (temperature, residence time and SA concentration) into the modified barley straw HHV. The RSM was based on the Box–Behnken DoE (BBD). This particular design is considered more efficient than other designs, such as central composite design (CCD) and three-level full factorial design [38]. The CCD is a five-level fractional factorial design, which comprises of a two-level factorial design, central designs and two axial designs. On the other hand, the BBD is a spherical, rotatable second-order design. It is based on a three-level incomplete factorial design, which consists of the center point and middle points like the edge of a cube. Although BBD can be derived from a cube, it can be represented spherically, making the vertices of the cube not covered by the design. It can be considered as three interlocking factorial designs along with center points. The BBD is said to be a more economical and viable tool than the CCD, because its design matrix is usually generated with a fewer number of experimental runs. BBD requires an experiment number according to N = 2k(k − 1) + cp, where k is the number of factors and cp is the number of the central points, while CCD requires N = k2 + 2k + cp. More specifically, CCD requires experiment number N = 18 while BBD requires only N = 15 for k = 3 and cp = 3.
The BBD method is advantageous over other common experimental or optimization methods since it requires a relatively small number of experiments while it also enables the exploration of the interactive effects over the considered observables, hence enabling to depict the effects of each one [38].
The experiments are planned with Quantum XL (SigmaZone) software and are presented in Table 1. It should be noted that each of the 15 experiments was performed twice, with Table 1 containing the averaged outcomes.
Performing a polynomial regression with the method of least squares as described from Box and Wilson [39], enables the prediction of optimum conditions through RSM. More accurately, in order to draw a three-dimensional graph (the RSM) that will facilitate the identification of the optimum data, the most important steps include the determination of influencing variables and their range, the selection of a random point on sample as representative of input, encoding of the variables, implementation of the analysis of variance (ANOVA) technique and the lack-of-fit test.
The experiments outcome (A: temperature, B: time and C: SA concentration) fitted to the following equation:
where a, axx are the model’s constant and coefficients, respectively.
HHV = a + a1A + a2B + a3C + anA2 + a22B2 + a33C2 + a12AB + a13AC + a23BC
3. Results and Discussion
3.1. Simulation Based on CSF
The pH before and after ACWT of barley straw depending mostly on the concentration of SA is given in Table 1. Furthermore, the HHV and the SRY of barley straw after ACWT are presented in Table 2. According to the results, ACWT had a mild effect on barley straw SRY. Moreover, in Table 2, the HHV as affected by the ACWT treatment conditions is presented. These findings indicate that there was a serious increase in HHV for high temperature and the maximum SA concentration while untreated barley straw HHV was measured and its average rate was 17.6 MJ/Kg. This was the average result of two HHV measurements.
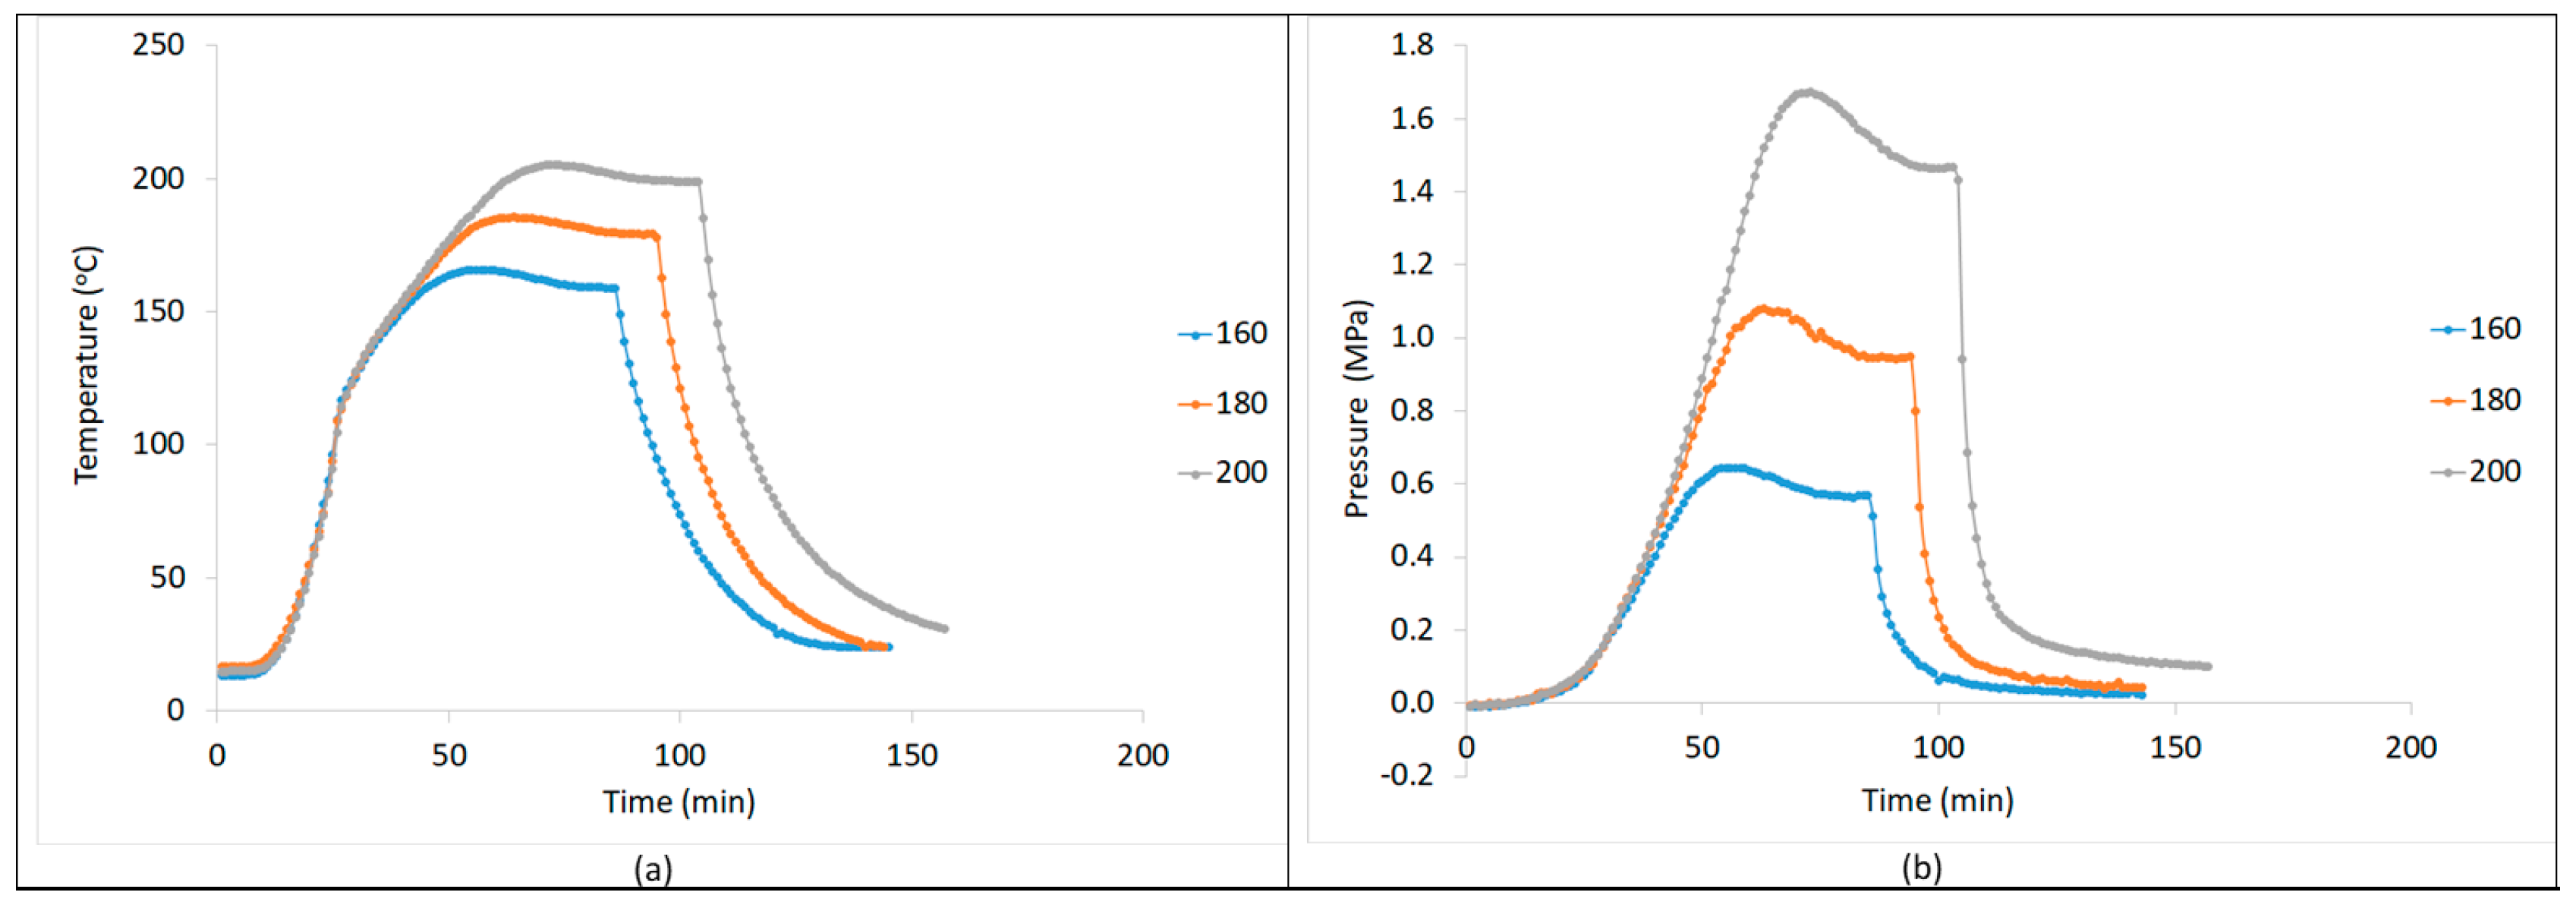
The CSF of the present study incorporates the effect of temperature, time and SA concentration. In Figure 1a the reaction temperature profile vs. the reaction time is presented. The isothermal period was 40 min at 160, 180 and 200 °C. In Figure 1b the reaction pressure profile vs. time for the same experiments is presented. Table 2 shows the CSF values estimated for the specific ACWT conditions. The CSF in logarithmic form ranged from −0.70 to 2.61, incorporating the effect of temperature, time and SA concentration. Combined increase in temperature, time and SA concentration leads to higher values of the CSF. Relevant research on straw pretreatment [40] shows that severe hydrolytic conditions leads to the degradation of cellulose and hemicelluloses, breaks the lignocellulosic matrix, decreases the ash content and changes the elemental composition of the modified material. In another relevant work, Angles et al. [41] used the CSF (also called gravity factor) for the softwood vapor explosion at 176 to 231 °C for 2.5 to 5.5 min hydrolysis. In their work the CSF varied from logR0* = 2.6 to logR0* = 4.6. Moreover, in the Chornet and Overend [30] study CSF was 2.6–4.2. Decreased sugar yield and degree of polymerization for severe hydrolytic conditions were reported. Toussaint et al. [42] and Heitz et al. [43] proved that a higher reaction temperature and time (i.e., increased CSF) results in enhanced cellulose recovery, accessibility and digestibility in combination with higher lignin removal. This was followed by increased hemicellulose degradation.
Demirbas [44] reported that the HHV of a lignocellulosic fuel depends on lignin, cellulose and hemicellulose percentage. He found that holocellulose HHV was 18.60 MJ/kg, while lignin HHV was 23.26–25.58 MJ/kg. Consequently, the HHV of lignocellulosic fuels is improved when the lignin content is increased.
Changes in the elemental composition of lignocellulosics due to ACWT affects the HHV of the solid residue. According to Semhaoui et. al. [45] hemicelluloses solubilization depends on the severity of treatment and becomes significant for positive CSF values. The results of CSF show that the concentration of acid that led to negative levels CSF value was insufficient for hemicelluloses solubilization.
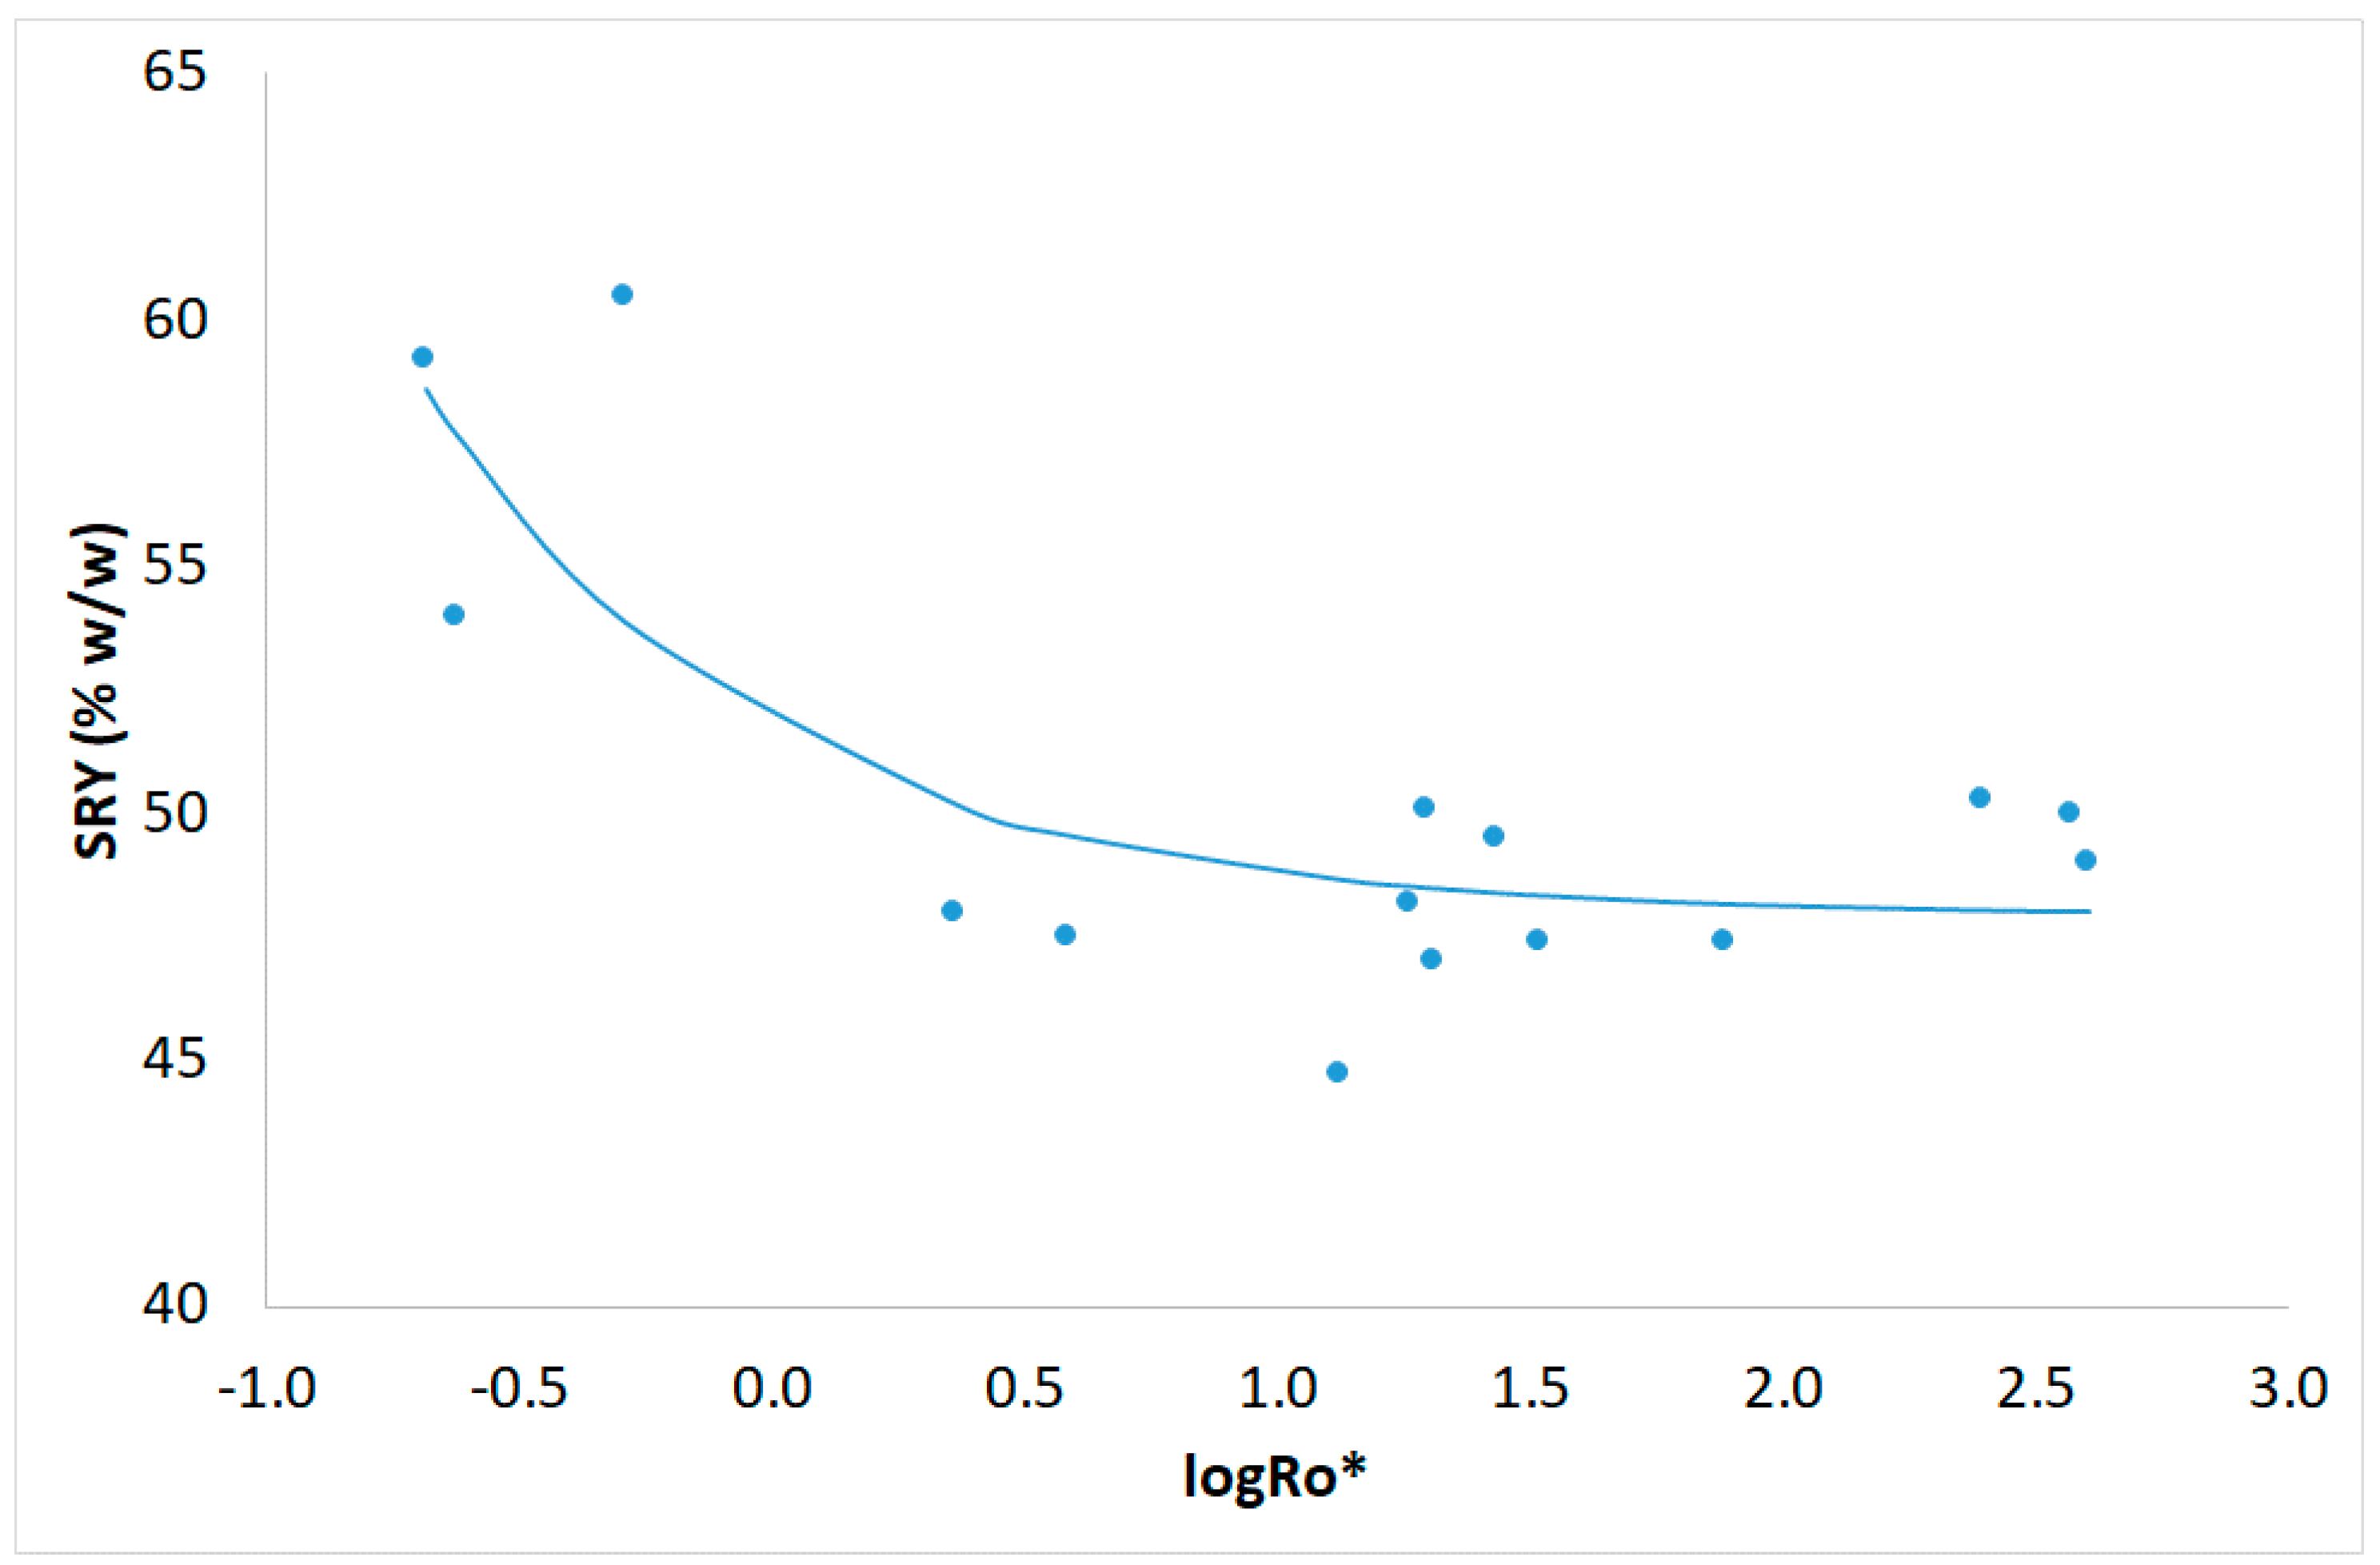
In the present work, the correlation between logR0* and SRY % w/w (dry basis) was found by applying a nonlinear regression, fitting the equation
where x = logR0*, and the standard error of the estimate (SEE) was equal to 2.885. In Figure 2, the SRY percentage decreases significantly when the CSF increases. This decrease becomes negligible for relatively high logR0* values. The SRY shows higher values for logR0* approximately 0.36 while the most sever conditions, 2.30 < logR0* < 2.60, gave lower SRY values. The SRY decrease can be attributed to the fast hydrolysis of hemicelluloses of barley straw while this decrease is limited by resisting the hydrolysis lignin fraction and the slow hydrolysis of the crystalline cellulose fraction. Moreover, some of the produced soluble sugar degradation products (furfural and 5-hydroxymethylo-furfural) can be further degraded to insoluble byproducts (humic substances, etc.).
SRY = 3.857exp(−1.480x) + 47.92
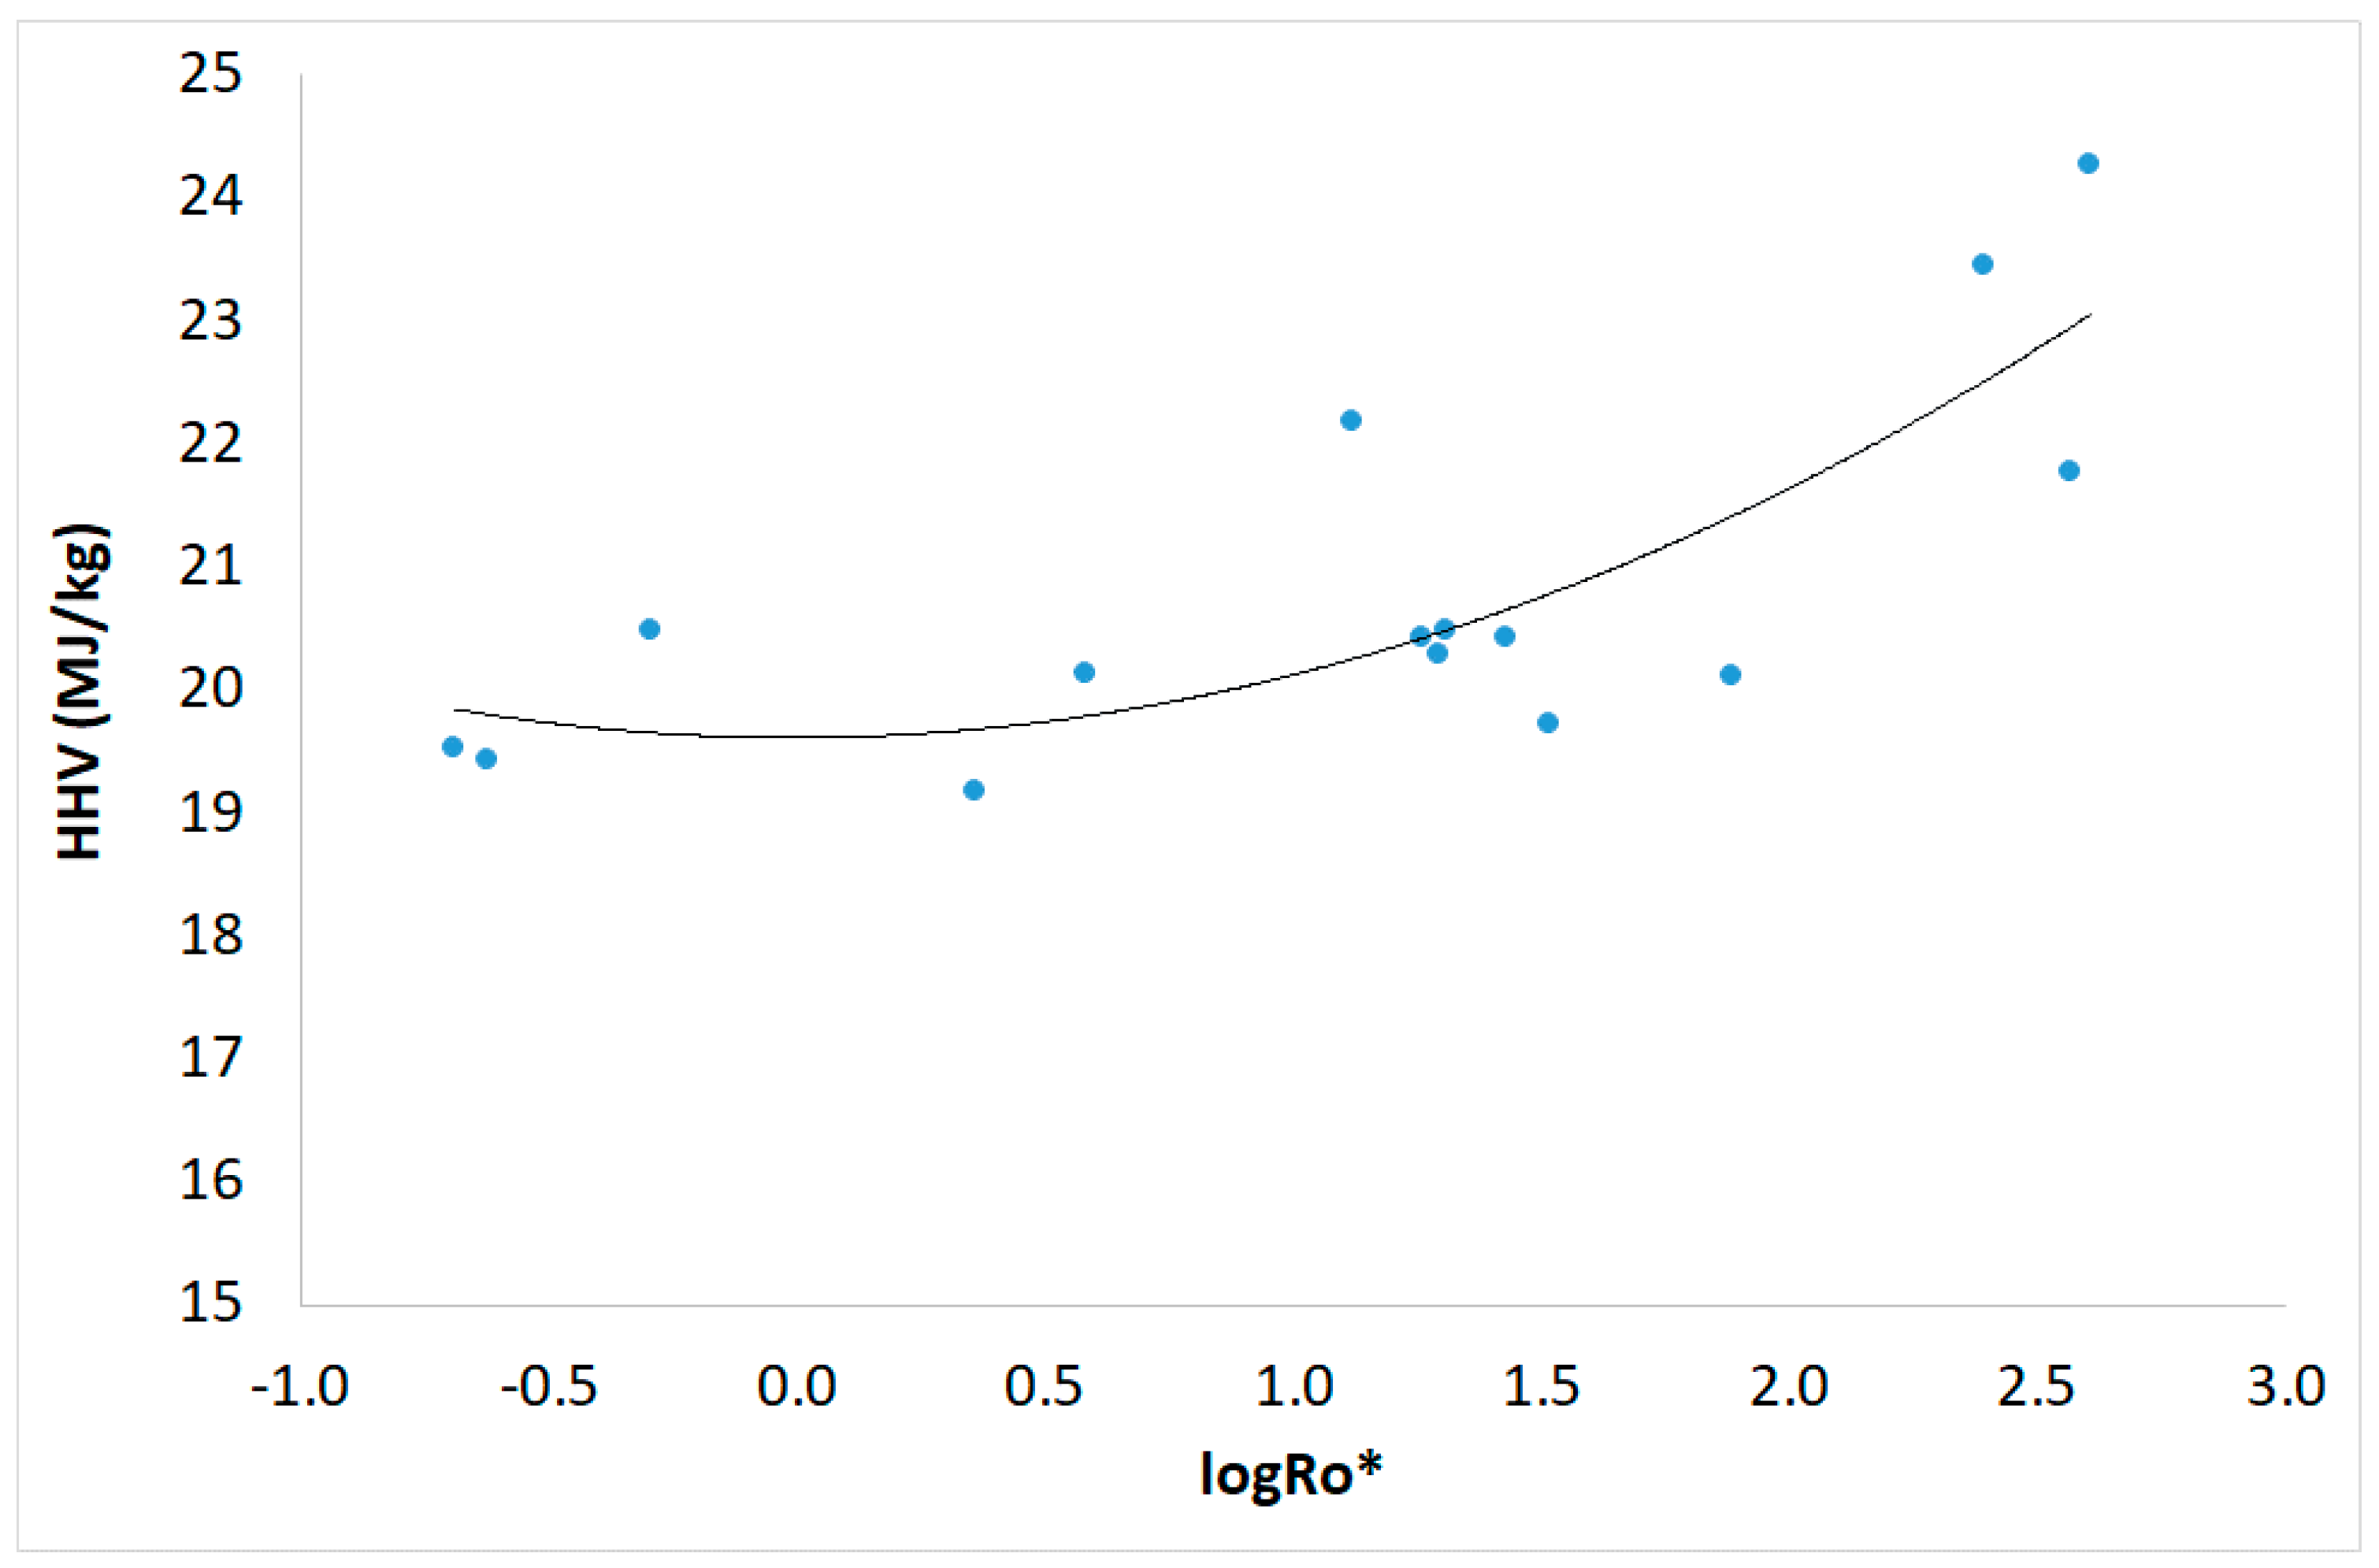
In Table 2 the HHV and SRY values are presented, while the relationship between HHV and ACWT severity using a second-order polynomial function is shown in Figure 3. The equation with the best fighting among many others was as follows:
where x = logR0*. The correlation coefficient was R = 0.7891 and the SEE was 5.097. The increase in the HHV can be explained by the increase of the carbon content in the ACWT material, as well as by the ash percentage decreasing. In addition, it can be explained by the lignin percentage increase and the hemicelluloses percentage decreasing with regard to the pretreated barley straw.
HHV = 0.5028x2 + 0.0087x + 19.613
Table 3 shows total ash content of ACWT barley straw compared to the untreated one. A decrease in ash content was observed from 8.4 for the untreated straw to 5.5% wt. for the treated one. At this point, the CSF of the ACWT was logR0* = 2.87. Öhman et al. [46] also observed the decrease in ash content of hydrolysis residue. In addition, Jenkins et al. [47] also recognized that water-leaking biomass has decreased ash concentration. Acid hydrolysis disrupts the structure of lignocellulose. As a result, minerals presented in the biomass were released into the soluble processing fluid. Therefore, the decrease in ash content can be attributed to the disordered cell structure and the water treatment. A reduction in the total ash content can be accomplished by applying acid hydrolysis to dissolve the minerals during the process.
In the present work, sulfur content increased after pretreatment, from 0.11% for untreated barley straw to 0.14 for the pretreated one (see Table 3). The difference is not significant, so acid hydrolysis can be applied for high sulfur containing lignocellulosics like barley straw [47].
The enhancement factor (EF) is defined by the following equation:
where HHVt represents the HHV for ACWT barley straw and HHVo the HHV for original straw. The energy yield (EY) can be calculated as follows:
EF = HHVt/HHVo
EY = EF · SRY
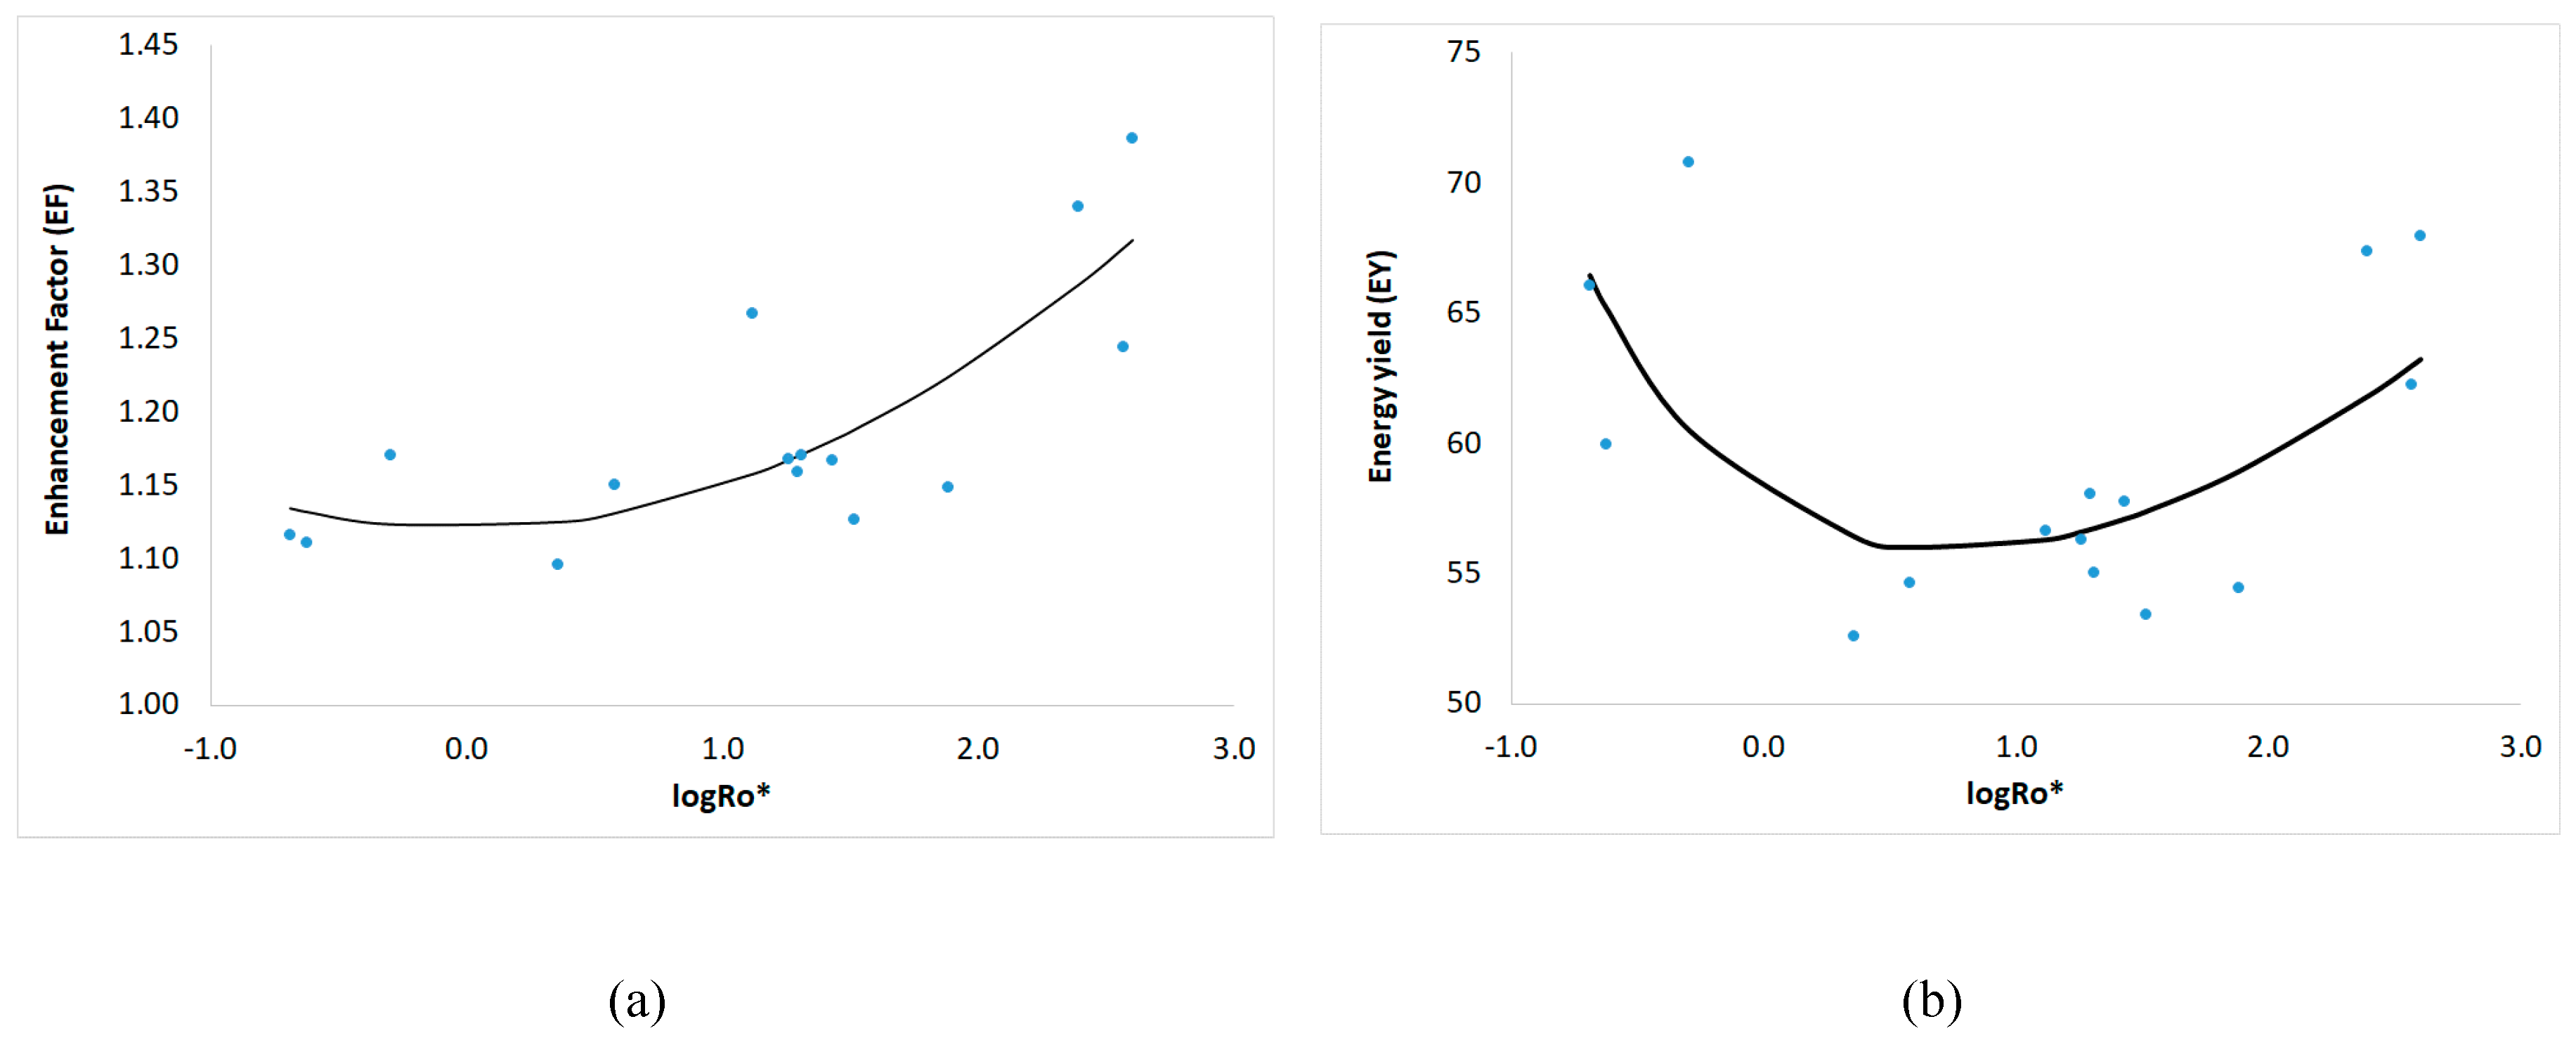
In Figure 4, the EF and the EY of ACWT barley straw vs. the CSF in logarithmic form are presented. The curves representing the calculated values of EF and EY (i.e., the theoretical values) occurred from the application of Equations (5) and (6), respectively, using the same parameters as in Figure 3. Moreover, in Figure 4a we can notice that the EF increases when the CSF increases. On the other hand, in Figure 4b, EY demonstrates improved values either for low CSF values or for higher CSF values, but not for moderate conditions. It must be observed that taking into account both Figure 3 and Figure 4, we get high HHV, EF and EY only for high CSF values, i.e., severe conditions. The increase in EF is a result of the increase in HHV, as can be seen from Equation (7). The initial decreasing of the EY can be explained by the significant decreasing of SRY and the insignificant increasing of EF for relatively low CSF values. On the other hand, the consequent increasing of EY can be explained by the significant increase of EF compared to the negligible SRY decreasing for higher CSF values.
3.2. Ultimate and Proximate Analysis Results
Ultimate and proximate analysis results of the barley straw compositions are presented in Table 3. The purpose of the analysis was mainly to determine whether carbon appeared during the ACWT process. In the untreated barley straw, carbon and oxygen were 45.53% and 47.86%, respectively. After ACWT pretreatment (200 °C, 0.0035 N SA concentration, 25 min), the carbon content increased to 52.51% (optimal conditions) and the oxygen decreased to 40.71%. Zanzi et al. [48], Angles et al. [40] and Iroba et al. [49] obtained similar results from the ultimate analysis of the WT-treated lignocellulosic biomass feedstock. The C content of their steam-exploded samples increases while lignin condenses and carbonizes. The lignin condensation was with loss of H2O and reduction of O content. H and O losses were also reported due to the formation of H2O, CO and CO2. The observed increased N content was dropped by the increasing temperature and time of WT. The change in C, H and O content was significant. Reactions occurring during hydrolytic treatment generally produce volatiles and gases with a low energy density until they evaporate, increasing the energy density of the residue material by making it rich. The results obtained from the present ultimate and proximate analysis are consistent with the above literature results, demonstrating that carbonization occurs at higher temperatures and times in combination with degradation of holocellulose and destruction of the lignocellulosic matrix.
The increase in the HHV of the pretreated straw relative to the increase in its values of hydrogen, carbon and sulfur, as well as the reduction of oxygen, are in agreement with previous studies [44]. In the present work, the HHV of the ACWT-treated barley straw samples were calculated using the C, H and N results presented in Table 3. The following Friedl et al. [50] equation was used for these calculations:
HHV = 3.55C2 − 232C − 2230H + 51.2C·H + 131N + 20600
The HHV for the untreated and ACWT-treated barley straw, estimated by Equation (9), was 18.1 and 21.0 MJ/kg, respectively. The experimentally measured HHV was 17.5 of untreated barley straw and 24.3 MJ/kg for ACWT-treated material. Consequently, the estimated HHV was sufficiently close to the experimental measurements. Moreover, the estimated EF was 1.16, also not so close to the experimental one that was 1.39.
3.3. Simulation Based on RSM
In this work we performed 15 experimental trials as the Box–Behnken scheme demands. The results were fitted by an RSM model using a second-order polynomial equation. The model variables, where A temperature, B time and C SA concentration. The suggested polynomial was fitted to the ACWT experimental data. The equation parameters were estimated by multiple linear regressions analysis. The confidence level was 99%. The optimal conditions for ACWT of barley straw were found. The polynomial equation used herein was as follows:
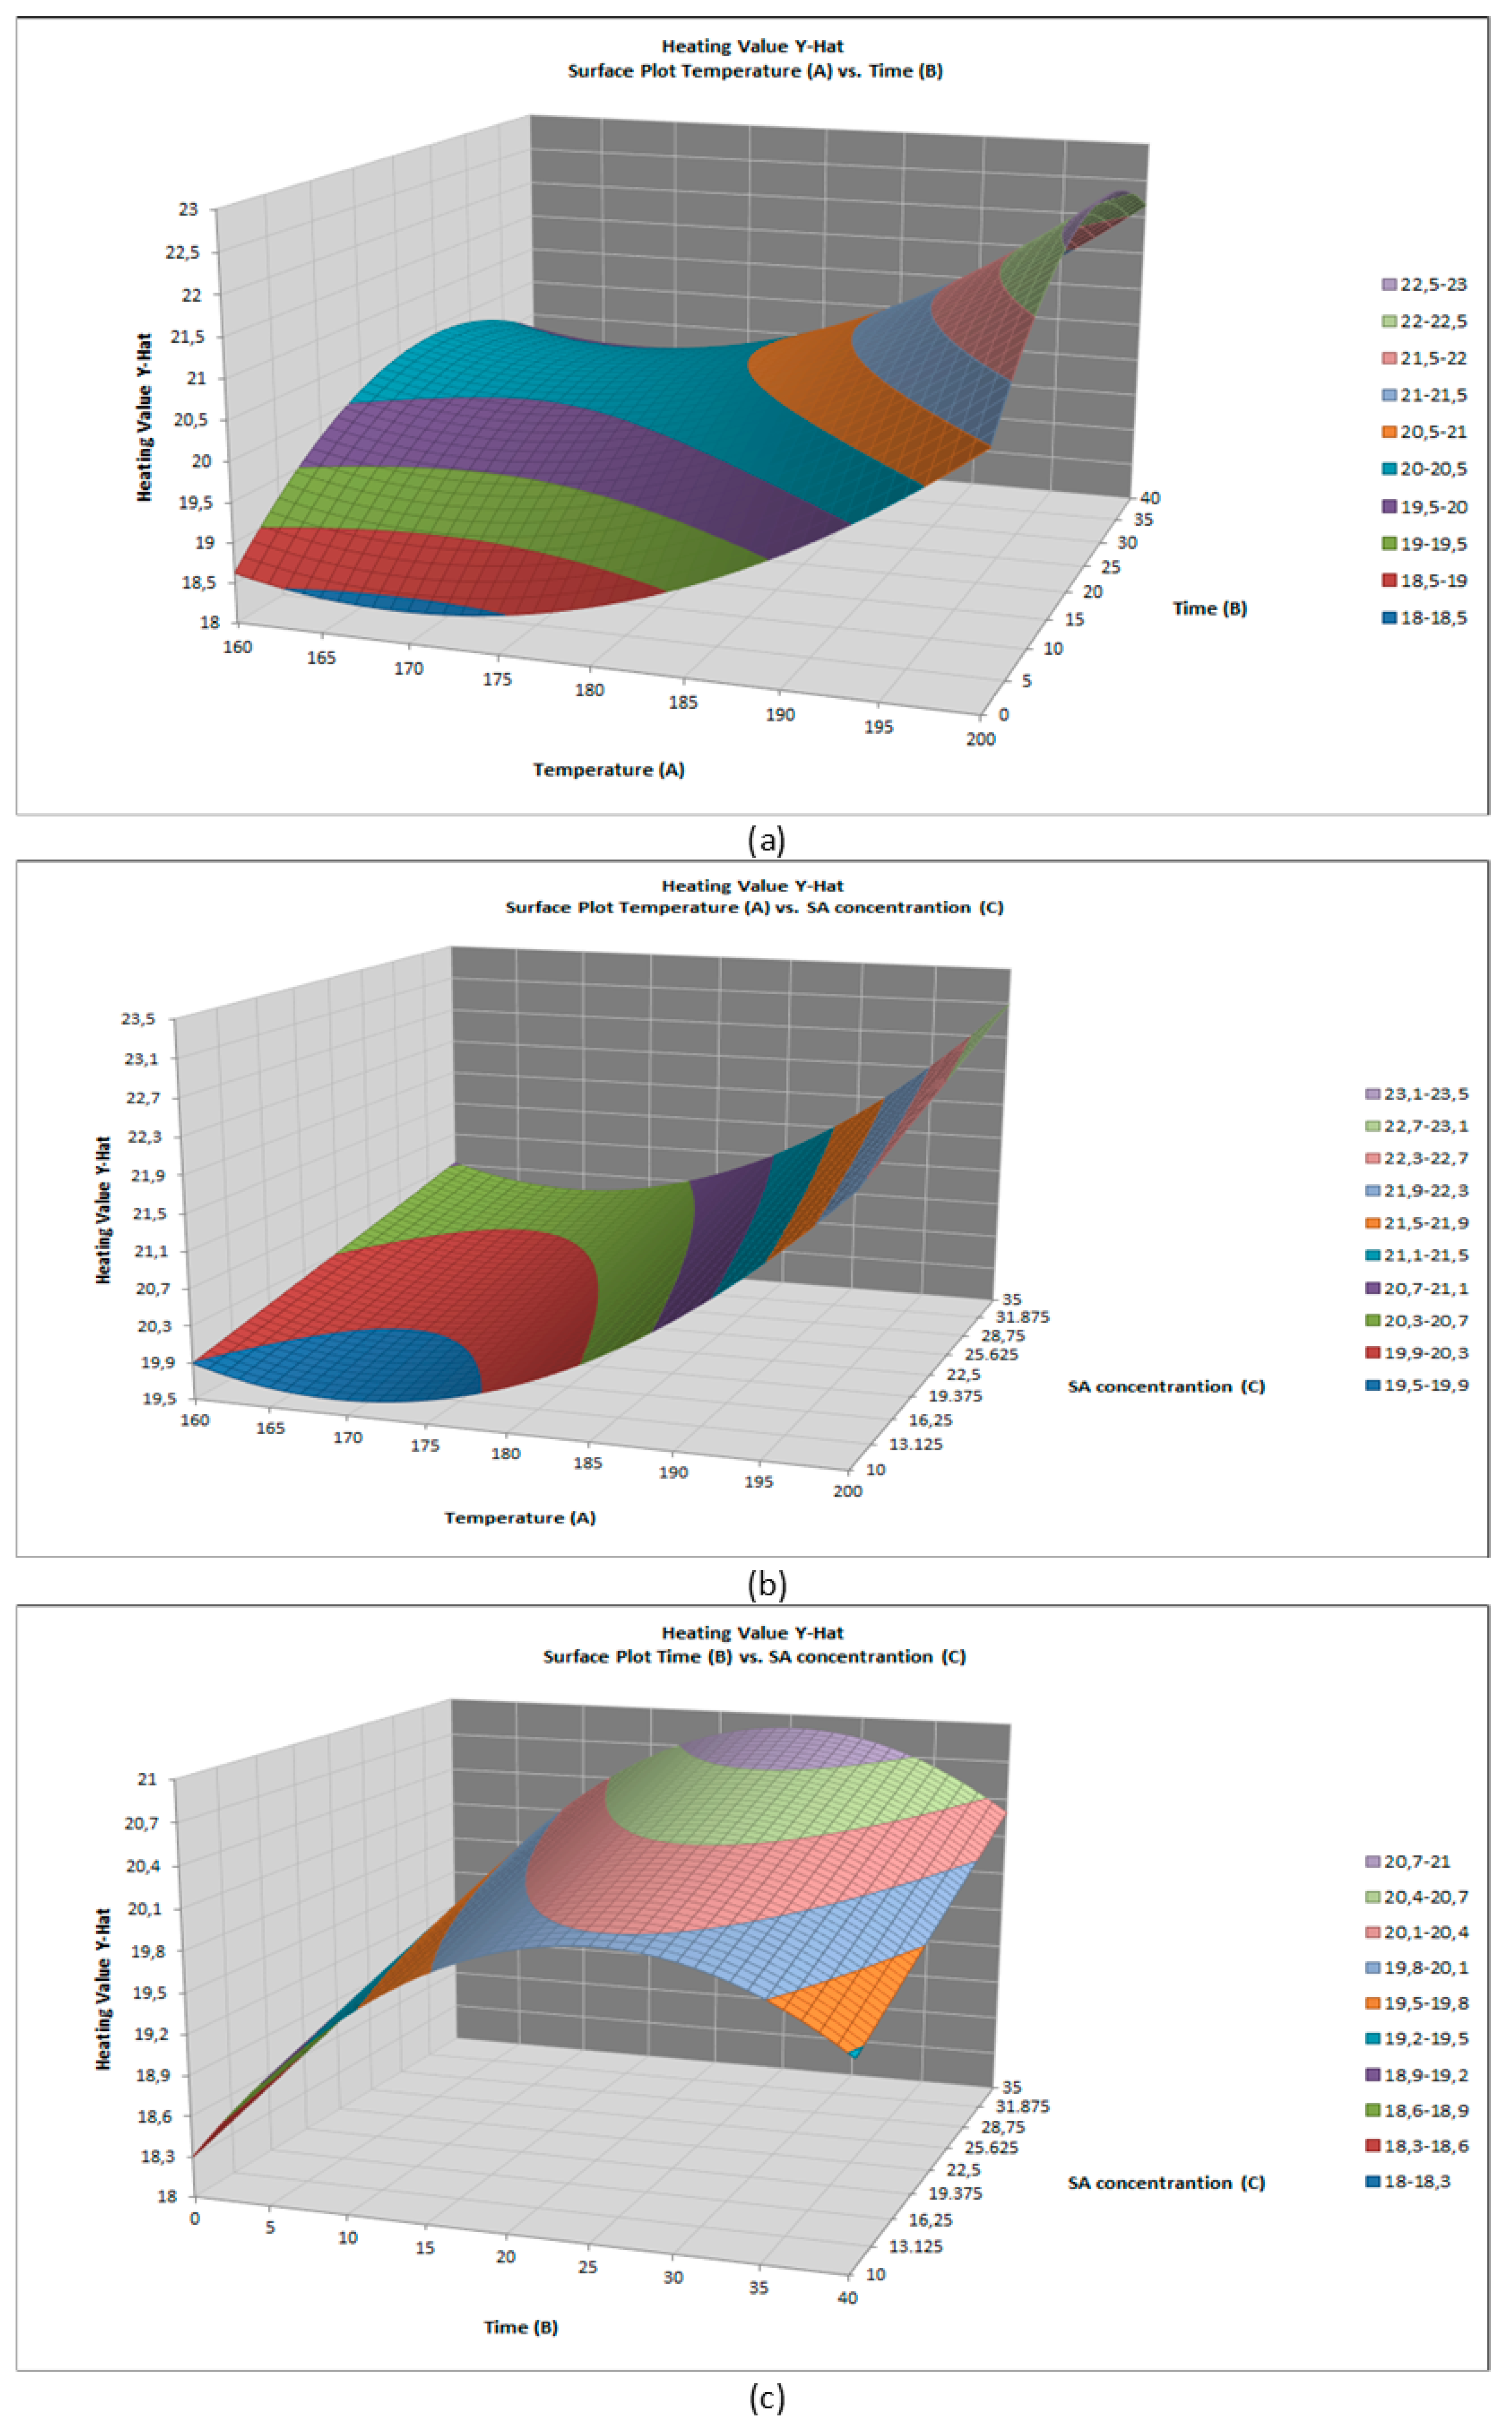
HHV = 20.397 + 1.18A + 0.585B + 0.4138C + 0.2775AB − 0.38AC − 0.0575BC + 1.0967A2 − 1.1008B2 + 0.7367C2
By solving this model using a partial differential equation (PDE), three 3D graphs were developed.
In Table 4 the effect of the three independent A, B and C variables on the response variables P, T and F is presented by ANOVA of the RSM. The coefficient of determination (R2) equaled 0.9035, showing sufficient fitting of Equation (9) to the experimental data. Joglekar and May [51] demands R2 > 0.80 for the reliable model based on its parameters. The R2 of the model presented herein has shown that it adequately represents the true relationship between the predicted and observed values of the variables under consideration. When the R2 value is 0.9035 it indicates that 90.3% of the volatility is explained by the model and only 9.70% is due to luck. Model regression analysis showed that the effect of the temperature variable was significant, while the time and SA concentration variable had no effect on ACWT.
ANOVA of the performance index, including the probability value P-value, the value on the F distribution F-statistic or F-value, as well as the value of the T-distribution, T-statistic or T-value, shows that the high value of F indicates that the proposed model is valid and low P values indicate that the model is significant. Given the F value for the temperature, which was higher compared to the other two, it implies that the increase in the reaction temperature has very strong effect on the experiment. The appropriate T value (4.3368) gives the signal to noise ratio and when the value is greater than 4 is generally desirable [52]. When P becomes less than 0.05, it also indicates the significance of the model terms. On the other hand, values above 0.10 means that these terms are not significant. In addition, the RSM provided a sum of squares (SS) of 27.90, degrees of freedom (DF) for the regression of 9 and 5 for the residual; a mean square (MS) of 3.100 for the regression and 0.5960 for the residual, and a significance of F (SigF) of 0.0421. ANOVA analysis produced values within the range of experimental values, confirming that the RSM model can simulate the HHV of ACWT-treated barley straw.
In Figure 5, three 3D-graphs illustrate the RSM results as a function of two of the independent variables, while the third variable remains constant. The conditions 180 °C, 20 min and 22.5 mM SA concentration were chosen as constant values as their combination gives a moderate HHV value. The relationships between the time and temperature, temperature and SA concentration and the time and SA concentration are presented in Figure 5a–c, respectively. There was no significant effect of the combination of variables individually, namely the reaction time and the concentration of sulfate on the response value.
3.4. Optimization
The optimal conditions for ACWT of barley straw were determined by using Quantum XL commercial software. The findings were comparable to those of CSF methodology. The highest value of the HHV experimentally achieved at the expected by the Quantum XL software set point and it is achieved when relatively severe pretreatment conditions (200 °C, 20 min and 35 mol/m3 SA concentration) were used (Table 5). Under these optimal conditions, logR0* = 2.87 and SRY = 38% were estimated. The experimental result agreed with the optimal values predicted by the RSM model giving HHV = 25.5 MJ/kg. Both simulation approaches (CSF methodology and RSM) provided useful information on CSF and exact experimental parameters to optimize the HHV of ACWT-treated material.
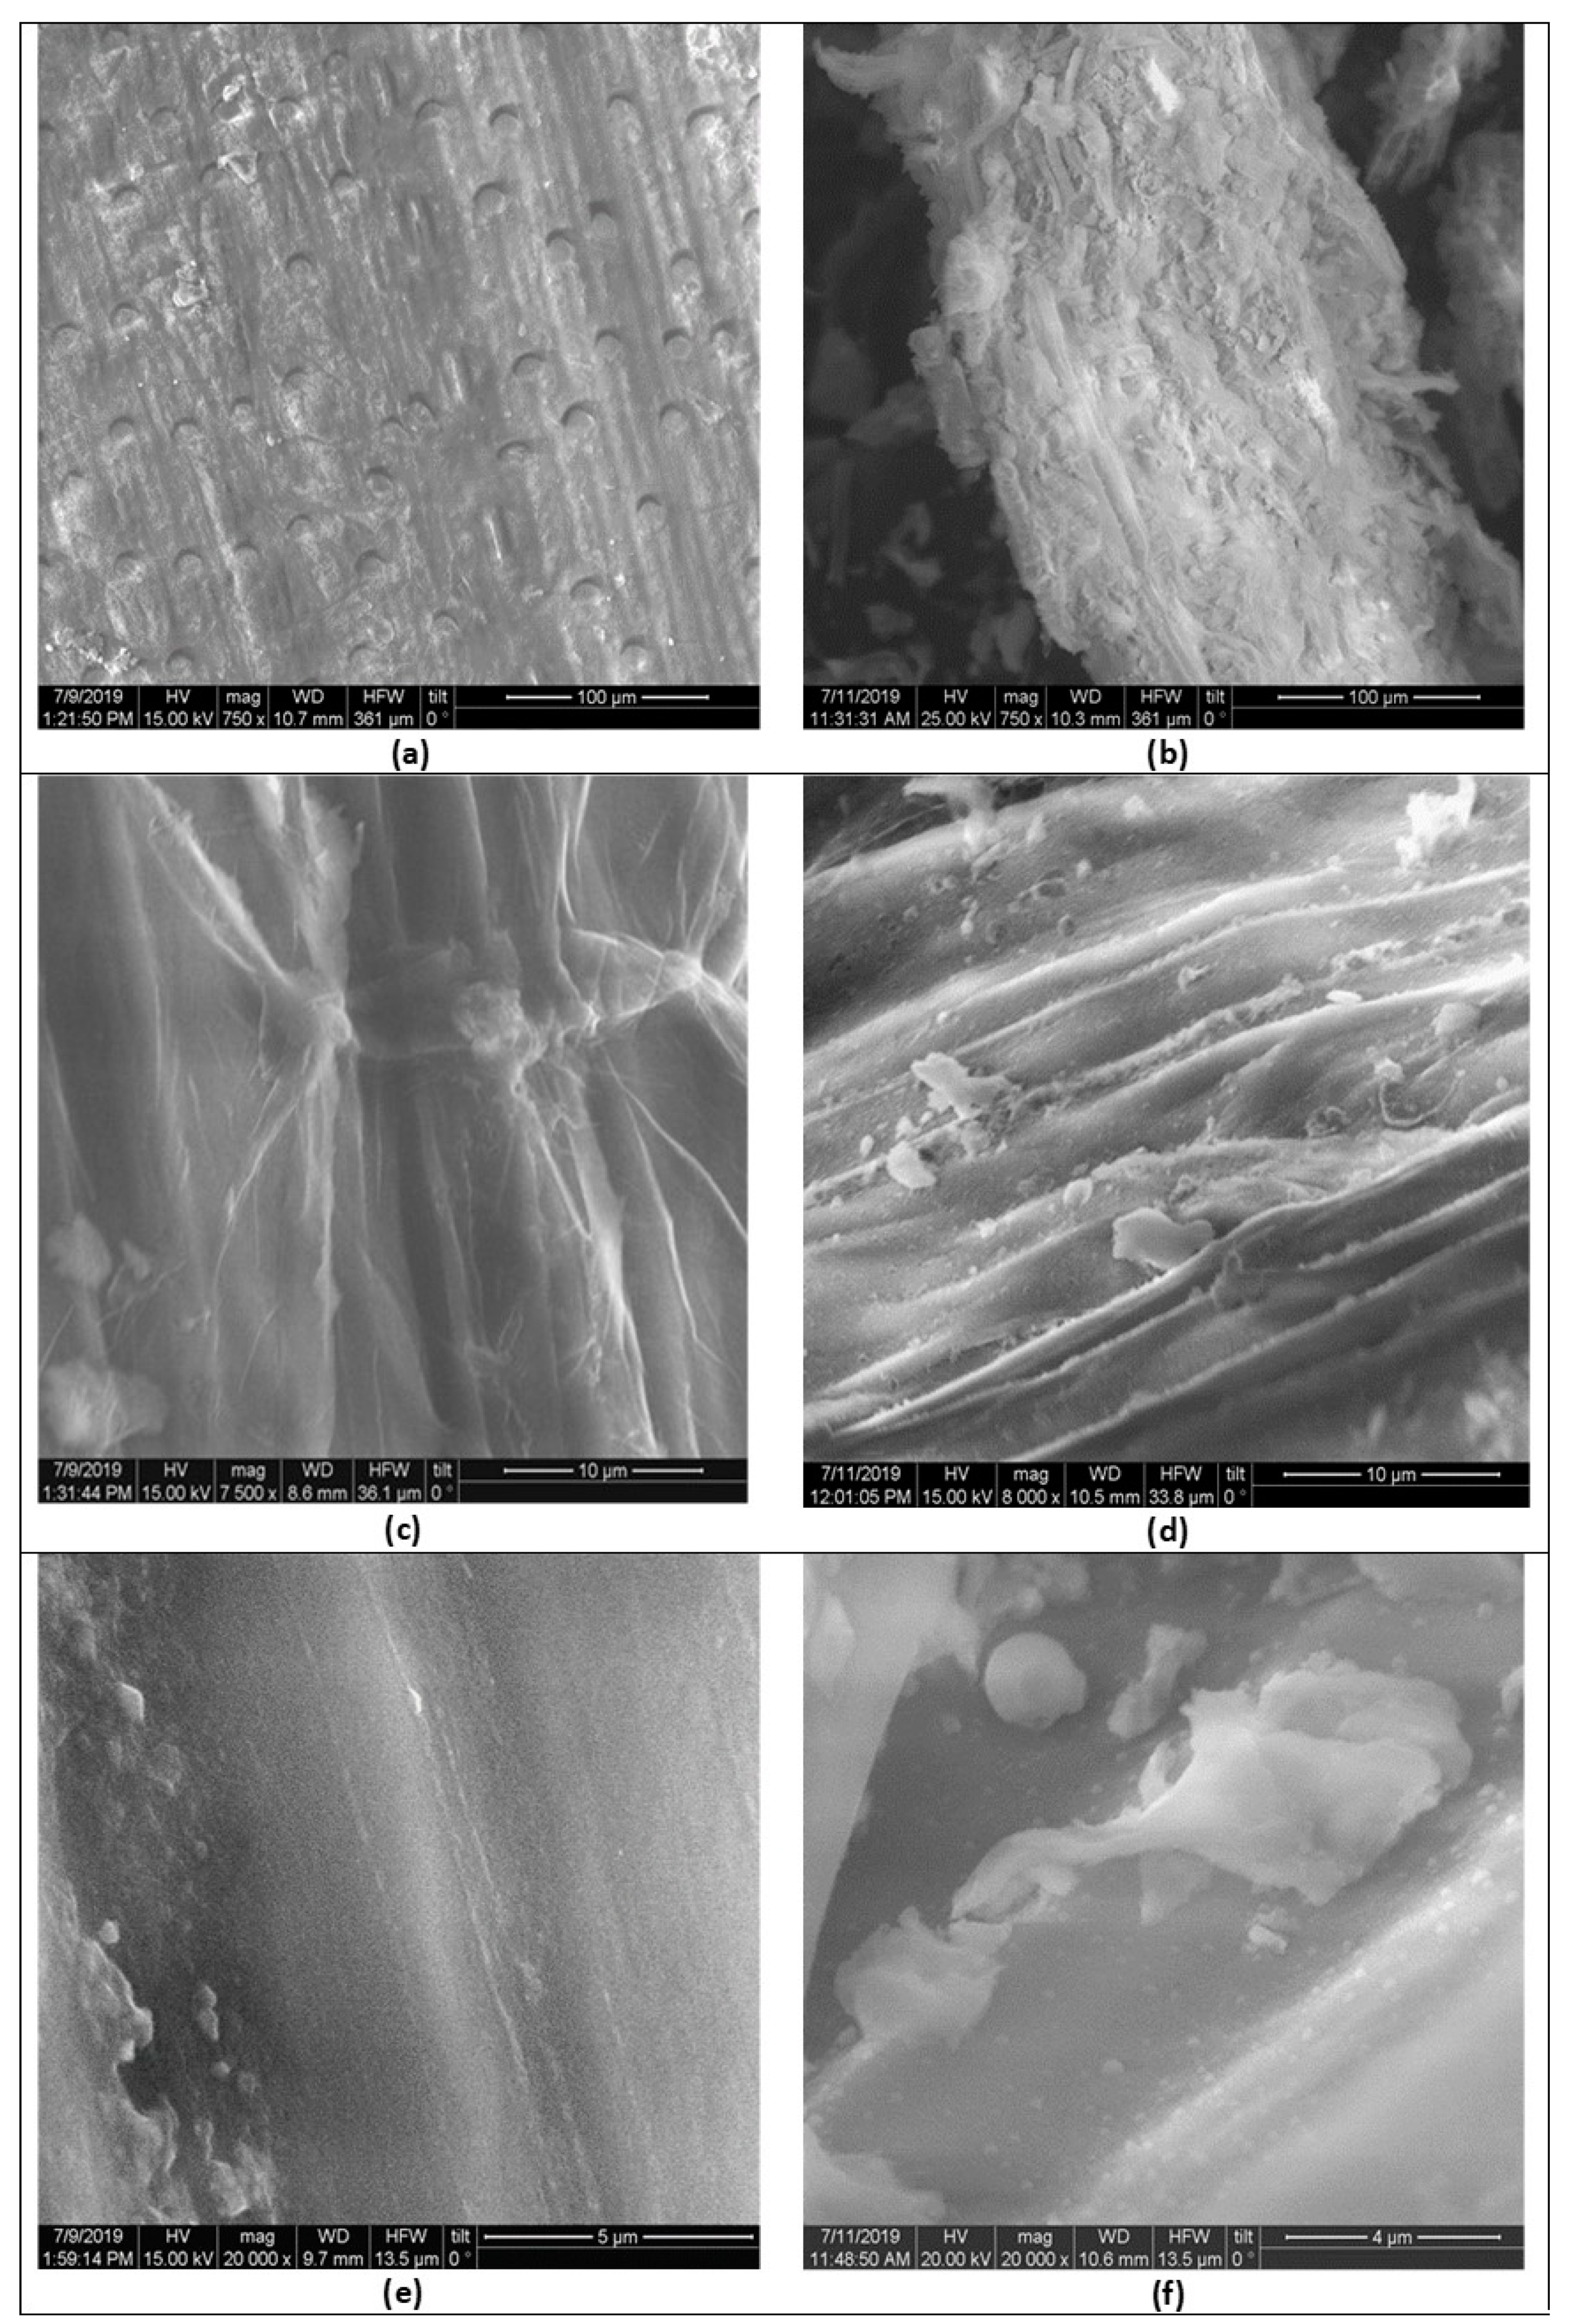
3.5. SEM Results
The surface of the solid residue of untreated barley straw (Figure 6a,c,e) and the ACWT-treated one Figure 6b,d,f) was observed by a SEM, in the order to observe the physical changes in the structure of barley straw. The porous structure of the surface of solid residue is created during the ACWT process due to the production of volatile substances. As the process continues, the pores and cracks are appearing on the surface of the solid residue. The porous structure and the cracks of solid residue can be clearly shown on the SEM images. When the temperature increases at 200 °C, the hydrolysis process enters the second phase and most of organic materials are released gradually, resulting from a great loss of mass and the formation of the major hydrolysis products.
As the temperature rises, the volatile matter gradually evaporates, creating pores and transforming the surface of solid residue to be concave. The surface of straw is found to have more irregular porous structures in the higher hydrolysis temperature, and changes in surface morphology is observed (Figure 6b,d,f). This evidence indicates that the structure of the torrefied biofuel is downgraded or lit due to high temperature.
This results in the formation of an irregular structure of solid residue, destroying its uniformity. The solid residue, created from high temperature, is more fragile compared to the untreated straw and it cannot withstand the pressure due to its fragile structure.
4. Conclusions
In this study, it was shown that ACWT has the potential to convert biomass such as barley straw into biofuel with enhanced thermal, chemical and physical fuel properties compared to raw barley straw. The results were obtained by ACWT treatment of barley straw, in a batch reactor, showing significant improvements, such as an increased HHV and lower ash content. In addition, the ACWT is appropriate for cleaner fuels production from lignocellulosic residues. Within the biorefinery concept, during the fermentable sugars production via acid hydrolysis, ACWT barley straw with enhanced HHV can be obtained as a solid byproduct. Two simulation methodologies were successfully applied for ACWT process: (i) the combined severity factor approach and (ii) the response surface methodology. The first methodology gives the CSF R0* or R0* (which can be achieved by various combinations of time, temperature and acid concentration) for optimized HHV, EF and EY, while the second methodology determines exactly the optimal experimental conditions (time, temperature and acid concentration). The pretreatment conditions were optimized for modified barley straw production with a maximum HHV equal to 24.3 MJ/kg, EF = 1.39 and EY = 68% wt. dry basis. The optimal ACWT temperature, time and SA concentration were 200 °C, 25 min (with regard to the isothermal period only) and a 35 mM SA concentration of the solution. The above presented simulation method, which is the combination of two methodological approaches, can be possibly used in modelling/simulation and optimization of various processes of biomass thermal, chemical and thermochemical treatment.
Author Contributions
Investigation, A.N.; methodology, P.G.; software, E.S.; supervision, D.S. All authors have read and agreed to the published version of the manuscript.
Funding
This research received no external funding.
Acknowledgments
This work has been partly supported by the University of Piraeus Research Center.
Conflicts of Interest
The authors declare no conflict of interest.
References
- Johnsson, F.; Kjärstad, K.; Rootzén, J. The threat to climate change mitigation posed by the abundance of fossil fuels. Clim. Policy 2019, 19, 258–274. [Google Scholar] [CrossRef] [Green Version]
- Kumar, R.; Strezov, V.; Weldekidan, H.; He, J.; Singh, S.; Kan, T.; Dastjerdi, B. Lignocellulose biomass pyrolysis for bio-oil production: A review of biomass pre-treatment methods for production of drop-in fuels. Renew. Sustain. Energy Rev. 2020, 123, 109763. [Google Scholar] [CrossRef]
- Möllersten, K.; Yan, J.; Moreira, J.R. Potential market niches for biomass energy with CO2 capture and storage—Opportunities for energy supply with negative CO2 emissions. Biomass Bioenergy 2003, 25, 273–285. [Google Scholar] [CrossRef]
- He, C.; Tang, C.; Li, C.; Yuan, J.; Tran, K.Q.; Bach, Q.V.; Qiua, R.; Yang, Y. Wet torrefaction of biomass for high quality solid fuel production: A review. Renew. Sustain. Energy Rev. 2018, 91, 259–271. [Google Scholar] [CrossRef]
- Hrnčič, M.K.; Kravanja, G.; Knez, Ž. Hydrothermal treatment of biomass for energy and chemicals. Energy 2016, 116, 1312–1322. [Google Scholar] [CrossRef]
- Tekin, K.; Karagöz, S.; Bektaş, S. A review of hydrothermal biomass processing. Renew. Sustain. Energy Rev. 2014, 40, 673–687. [Google Scholar] [CrossRef]
- Bach, Q.-V.; Skreiberg, Ø. Upgrading biomass fuels via wet torrefaction: A review and comparison with dry torrefaction. Renew. Sustain. Energy Rev. 2016, 54, 665–677. [Google Scholar] [CrossRef]
- Fan, S.; Xu, L.H.; Namkung, H.; Xu, G.; Kim, H.T. Influence of Wet Torrefaction Pretreatment on Gasification of Larch Wood and Corn Stalk. Energy Fuels 2017, 31, 13647–13654. [Google Scholar] [CrossRef]
- Kostas, E.T.; Beneroso, D.; Robinson, J.P. The application of microwave heating in bioenergy: A review on the microwave pre-treatment and upgrading technologies for biomass. Renew. Sustain. Energy Rev. 2017, 77, 12–27. [Google Scholar] [CrossRef] [Green Version]
- Demey, H.; Melkior, T.; Chatroux, A.; Attar, K.; Thiery, S.; Miller, H.; Grateau, M.; Sastre, A.M.; Marchand, M. Evaluation of torrefied poplar-biomass as a low-cost sorbent for lead and terbium removal from aqueous solutions and energy co-generation. Chem. Eng. J. 2019, 361, 839–852. [Google Scholar] [CrossRef]
- Acharya, B.; Sule, I.; Dutta, A. A review on advances of torrefaction technologies for biomass processing. Biomass Convers. Biorefin. 2012, 2, 349–369. [Google Scholar] [CrossRef]
- Chen, W.; Peng, J.; Bi, X.T. A state-of-the-art review of biomass torrefaction, densification and applications. Renew. Sustain. Energy Rev. 2015, 44, 847–866. [Google Scholar] [CrossRef]
- Artiukhina, E.; Grammelis, P. Torrefaction of Biomass Pellets: Modeling of the Process in a Fixed Bed Reactor. Int. J. Chem. Mol. Eng. 2015, 9, 12. [Google Scholar]
- Artiukhina, E.; Grammelis, P. Modeling of biofuel pellets torrefaction in a realistic geometry. Therm. Sci. 2016, 20, 156. [Google Scholar] [CrossRef] [Green Version]
- Isemin, R.; Mikhalev, A.; Klimov, D.; Grammelis, P.; Margaritis, N.; Kourkoumpas, D.S.; Zaichenko, V. Torrefaction and combustion of pellets made of a mixture of coal sludge and straw. Fuel 2017, 210, 859–865. [Google Scholar] [CrossRef]
- Binder, J.B.; Raines, R.T. Fermentable sugars by chemical hydrolysis of biomass. Proc. Natl. Acad. Sci. USA 2010, 107, 4516–4521. [Google Scholar] [CrossRef] [Green Version]
- Taherzadeh, M.J.; Karimi, K. Acid-based hydrolysis processes for ethanol from lignocellulosic materials: A review. Bioresources 2007, 2, 472–499. [Google Scholar]
- Román, S.; Libra, J.; Berge, N.; Sabio, E.; Ro, K.; Li, L.; Ledesma, B.; Alvarez, A.; Bae, S. Hydrothermal carbonization: Modeling, final properties design and applications: A review. Energies 2018, 11, 216. [Google Scholar] [CrossRef] [Green Version]
- Román, S.; Ledesma, B.; Álvarez, A.; Coronella, C.; Qaramaleki, S.V. Suitability of hydrothermal carbonization to convert water hyacinth to added-value products. Renew. Energy 2020, 146, 1649–1658. [Google Scholar] [CrossRef]
- Chen, W.H.; Kuo, P.C. Torrefaction and co-torrefaction characterization of hemicellulose, cellulose and lignin as well as torrefaction of some basic constituents in biomass. Energy 2011, 36, 803–811. [Google Scholar] [CrossRef]
- Runge, T.; Wipperfurth, P.; Zhang, C. Improving biomass combustion quality using a liquid hot water treatment. Biofuels 2013, 4, 73–83. [Google Scholar] [CrossRef]
- Kruse, A.; Funke, A.; Titirici, M.M. Hydrothermal conversion of biomass to fuels and energetic materials. Curr. Opin. Chem. Biol. 2013, 17, 515–521. [Google Scholar] [CrossRef] [PubMed]
- Rodríguez, A.; Moral, A.; Sánchez, R.; Requejo, A.; Jiménez, L. Influence of variables in the hydrothermal treatment of rice straw on the composition of the resulting fractions. Bioresour. Technol. 2009, 100, 4863–4866. [Google Scholar] [CrossRef]
- Zhang, C.; Ho, S.-H.; Chen, W.-H.; Xie, Y.; Liu, Z.; Chang, J.-S. Torrefaction performance and energy usage of biomass wastes and their correlations with torrefaction severity index. Appl. Energy 2018, 220, 598–604. [Google Scholar] [CrossRef]
- Nhuchhen, D.R.; Basu, P.; Acharya, B. A Comprehensive Review on Biomass Torrefaction. Int. J. Renew. Energy Biofuels 2014, 2014, 1–56. [Google Scholar] [CrossRef]
- Wang, X.; Wu, J.; Chen, Y.; Pattiya, A.; Yang, H.; Chen, H. Comparative study of wet and dry torrefaction of corn stalk and the effect on biomass pyrolysis polygeneration. Bioresour. Technol. 2018, 258, 88–97. [Google Scholar] [CrossRef]
- Gan, Y.Y.; Ong, H.C.; Chen, W.H.; Sheen, H.K.; Chang, J.S.; Chong, C.T.; Ling, T.C. Microwave-assisted wet torrefaction of microalgae under various acids for coproduction of biochar and sugar. J. Clean. Prod. 2020, 253, 119944. [Google Scholar] [CrossRef]
- Sidiras, D.K.; Nazos, A.G.; Giakoumakis, G.E.; Politi, D.V. Simulating the Effect of Torrefaction on the Heating Value of Barley Straw. Energies 2020, 13, 736. [Google Scholar] [CrossRef] [Green Version]
- Brasch, D.J.; Free, K.W. Prehydrolysis-kraft pulping of Pinus radiata grown in New Zealand. Tappi 1965, 48, 245–248. [Google Scholar]
- Overend, R.; Chornet, E. Fractionation of lignocellulosics by steam-aqueous pretreatments. Philos. Trans. R. Soc. Lond. B Biol. Sci. 1987, 321, 523–536. [Google Scholar]
- Chum, H.H.; Johnson, D.K.; Black, S.K.; Overend, R.P. Pretreatment-catalyst effects and the combined severity parameter. Appl. Biochem. Biotechnol. 1990, 13, 24–25. [Google Scholar] [CrossRef]
- Abatzoglou, N.; Chornet, E.; Belkacemi, K.; Overend, R.P. Phenomenological kinetics of complex systems: The development of a generalized severity parameter and its application to lignocellulosics fractionation. Chem. Eng. Sci. 1992, 47, 1109–1122. [Google Scholar] [CrossRef]
- Lloyd, T.A.; Wyman, C.E. Combined sugar yields for dilute sulfuric acid pretreatment of corn stover followed by enzymatic hydrolysis of the remaining solids. Bioresour. Technol. 2005, 96, 1967–1977. [Google Scholar] [CrossRef] [PubMed]
- Kabel, M.A.; Bos, G.; Zeevalking, J.; Voragen, A.G.J.; Schols, H.A. Effect of pretreatment severity on xylan solubility and enzymatic breakdown of the remaining cellulose from wheat straw. Bioresour. Technol. 2007, 98, 2034–2042. [Google Scholar] [CrossRef] [PubMed]
- Sidiras, D.; Batzias, F.; Ranjan, R.; Tsapatsis, M. Simulation and optimization of batch autohydrolysis of wheat straw to monosaccharides and oligosaccharides. Bioresour. Technol. 2011, 102, 10486–10492. [Google Scholar] [CrossRef] [PubMed]
- Weinwurm, F.; Turk, T.; Denner, J.; Whitmore, K.; Friedl, A. Combined liquid hot water and ethanol organosolv treatment of wheat straw for extraction and reaction modeling. J. Clean. Prod. 2017, 165, 1473–1484. [Google Scholar] [CrossRef]
- Ferreira, S.L.C.; Bruns, R.E.; Ferreira, H.S.; Matos, G.D.; David, J.M.; Brandão, G.C.; da Silva, E.G.P.; Portugal, L.A.; dos Reis, P.S.; Souza, A.S.; et al. Box-Behnken design: An alternative for the optimization of analytical methods. Anal. Chim. Acta 2007, 597, 179–186. [Google Scholar] [CrossRef]
- Bezerra, M.A.; Santelli, R.E.; Oliveira, E.P.; Villar, L.S.; Escaleira, L.A. Response surface methodology (RSM) as a tool for optimization in analytical chemistry. Talanta 2008, 76, 965–977. [Google Scholar] [CrossRef]
- Box, G.E.P.; Wilson, K.B. On the experimental attainment of optimum conditions. J. R. Stat. Soc. Ser. B 1951, 13, 1–45. [Google Scholar] [CrossRef]
- Salapa, I.; Katsimpouras, C.; Topakas, E.; Sidiras, D. Organosolv pretreatment of wheat straw for efficient ethanol production using various solvents. Biomass Bioenergy 2017, 100, 10–16. [Google Scholar] [CrossRef]
- Angles, M.N.; Reguant, J.; Garcia-Valls, R.; Salvado, J. Characteristics of lignin obtained from steam-exploded softwood with soda/anthraquinone pulping. Wood Sci. Technol. 2003, 37, 309–320. [Google Scholar] [CrossRef]
- Toussaint, B.; Excoffier, G.; Vignon, M.R. Effect of steam explosion treatment on the physico-chemical characteristics and enzymic hydrolysis of poplar cell wall components. Anim. Feed Sci. Technol. 1991, 32, 235–342. [Google Scholar] [CrossRef]
- Heitz, M.; Capek-Menard, E.; Koeberle, P.G.; Gagne, J.; Chornet, E.; Overend, R.P.; Taylor, J.D.; Yu, E. Fractionation of Populus tremuloides at the pilot plant scale: Optimization of steam pretreatment conditions using the STAKE II technology. Bioresour. Technol. 1991, 35, 23–32. [Google Scholar] [CrossRef]
- Demirbas, A. Biomass Resource Facilities and Biomass Conversion Processing for Fuels and Chemicals. Energy Convers. Manag. 2001, 42, 1357–1378. [Google Scholar] [CrossRef]
- Semhaoui, I.; Maugard, T.; Zarguili, I.; Rezzoug, S.A.; Zhao, J.M.Q.; Toyir, J.; Nawdali, M.; Maache-Rezzoug, Z. Eco-friendly process combining acid-catalyst and thermomechanical pretreatment for improving enzymatic hydrolysis of hemp hurds. Bioresour. Technol. 2018, 257, 192–200. [Google Scholar] [CrossRef] [PubMed]
- Öhman, M.; Boman, C.; Hedman, H.; Eklund, R. Residential combustion performance of pelletized hydrolysis residue from lignocellulosic ethanol production. Energy Fuels 2006, 20, 1298–1304. [Google Scholar] [CrossRef]
- Jenkins, B.M.; Bakker, R.R.; Wei, J. On the properties of washed straw. Biomass Bioenergy 1996, 10, 177–200. [Google Scholar] [CrossRef]
- Zanzi, R.; Ferro, D.T.; Torres, A.; Soler, P.B.; Bjornbom, E. Biomass Torrefaction. Proceedings of the 2nd World Biomass Conference on Biomass for Energy Industry and Climate Protection, Rome, Italy, 10–14 May 2004, In World Biomass Conference-CD-ROM Edition. In World Biomass Conference-CD-ROM Edition; WIP: Munich, Germany; Florence, Italy, 2004; 859–862. [Google Scholar]
- Iroba, K.L.; Tabil, L.G.; Sokhansanj, S.; Dumonceaux, T. Pretreatment and fractionation of barley straw using steam explosion at low severity factor. Biomass Bioenergy 2014, 66, 286–300. [Google Scholar] [CrossRef]
- Friedl, A.E.; Padouvas, H.R.; Varmuza, K. Prediction of heating values of biomass fuel from elemental composition. Anal. Chim. Acta 2005, 544, 191–198. [Google Scholar] [CrossRef]
- Joglekar, A.; May, A. Product excellence through design of experiments. Cereal Foods World 1987, 32, 211–230. [Google Scholar]
- Cao, G.; Ren, N.; Wang, A.; Lee, D.J.; Guo, W.; Liu, B.; Feng, Y.; Zhao, Q. Acid hydrolysis of corn stover for biohydrogen production using Thermo-anaerobacterium thermo-saccharolyticum W16. Int. J. Hydrogen Energy 2009, 34, 7182–7188. [Google Scholar] [CrossRef]
Figure 1.
The ACWT pretreatment’s temperature (a) and pressure (b) profiles vs. time (isothermal period 40 min at 160, 180 and 200 °C, respectively).
Figure 1.
The ACWT pretreatment’s temperature (a) and pressure (b) profiles vs. time (isothermal period 40 min at 160, 180 and 200 °C, respectively).

Figure 2.
SRY of the ACWT-treated material as affected by the CSF.

Figure 3.
HHV vs. CSF in logarithmic form.

Figure 4.
ACWT barley straw (a) enhancement factor (EF) and (b) energy yield (EY) vs. CSF in logarithmic form.
Figure 4.
ACWT barley straw (a) enhancement factor (EF) and (b) energy yield (EY) vs. CSF in logarithmic form.

Figure 5.
HHV vs. temperature–time (a), temperature–SA concentration (b) and SA concentration–time (c).
Figure 5.
HHV vs. temperature–time (a), temperature–SA concentration (b) and SA concentration–time (c).

Figure 6.
SEM results of original barley straw at (a) ×750, (c) ×7500 and (e) ×20,000 magnification, and ACWT-treated material at (b) ×750, (d) ×7500 and (f) ×20,000 magnification.
Figure 6.
SEM results of original barley straw at (a) ×750, (c) ×7500 and (e) ×20,000 magnification, and ACWT-treated material at (b) ×750, (d) ×7500 and (f) ×20,000 magnification.

Table 1.
Box–Behnken experimental design.
| Run | T (°C) | t (min) | SA (mol/m3) | pH before | pH after |
|---|---|---|---|---|---|
| 1 | 160 | 0 | 22.50 | 1.74 | 2.37 |
| 2 | 200 | 0 | 22.50 | 1.74 | 2.05 |
| 3 | 160 | 40 | 22.50 | 1.74 | 2.30 |
| 4 | 200 | 40 | 22.50 | 1.74 | 2.40 |
| 5 | 180 | 0 | 10.00 | 3.31 | 4.02 |
| 6 | 180 | 0 | 35.00 | 1.75 | 1.80 |
| 7 | 180 | 40 | 10.00 | 2.49 | 3.64 |
| 8 | 180 | 40 | 35.00 | 1.79 | 1.90 |
| 9 | 160 | 20 | 10.00 | 2.8 | 3.97 |
| 10 | 160 | 20 | 35.00 | 1.79 | 1.93 |
| 11 | 200 | 20 | 10.00 | 3.31 | 3.53 |
| 12 | 200 | 20 | 35.00 | 1.73 | 1.89 |
| 13 | 180 | 20 | 22.50 | 1.88 | 2.60 |
| 14 | 180 | 20 | 22.50 | 2.14 | 2.63 |
| 15 | 180 | 20 | 22.50 | 2.14 | 2.65 |
Table 2.
Combined severity factor (CSF) in logarithmic form (logR0*), higher heating value (HHV) and solid residue yield (SRY) of barley straw treated by acid-catalyzed wet torrefaction (ACWT).
Table 2.
Combined severity factor (CSF) in logarithmic form (logR0*), higher heating value (HHV) and solid residue yield (SRY) of barley straw treated by acid-catalyzed wet torrefaction (ACWT).
| Run | T (°C) | t (min) | SA (mol/m3) | logR0* | SRY % wt. | HHV (MJ/kg) |
|---|---|---|---|---|---|---|
| 1 | 160 | 0 | 22.5 | 0.36 | 60.50 | 19.17 |
| 2 | 200 | 0 | 22.5 | 1.89 | 47.40 | 20.10 |
| 3 | 160 | 40 | 22.5 | 1.22 | 50.30 | 20.13 |
| 4 | 200 | 40 | 22.5 | 2.30 | 44.70 | 22.17 |
| 5 | 180 | 0 | 10.0 | −0.70 | 59.20 | 19.53 |
| 6 | 180 | 0 | 35.0 | 1.55 | 47.40 | 19.71 |
| 7 | 180 | 40 | 10.0 | 0.47 | 48.00 | 20.47 |
| 8 | 180 | 40 | 35.0 | 2.21 | 49.50 | 20.42 |
| 9 | 160 | 20 | 10.0 | −0.64 | 54.00 | 19.43 |
| 10 | 160 | 20 | 35.0 | 1.42 | 56.60 | 21.78 |
| 11 | 200 | 20 | 10.0 | 0.97 | 47.50 | 23.44 |
| 12 | 200 | 20 | 35.0 | 2.61 | 31.60 | 24.27 |
| 13 | 180 | 20 | 22.5 | 1.31 | 47.00 | 20.48 |
| 14 | 180 | 20 | 22.5 | 1.28 | 50.10 | 20.28 |
| 15 | 180 | 20 | 22.5 | 1.28 | 48.20 | 20.43 |
Table 3.
Proximate and ultimate analysis of the original and ACWT-treated (at optimized conditions based on HHV) barley straw.
Table 3.
Proximate and ultimate analysis of the original and ACWT-treated (at optimized conditions based on HHV) barley straw.
| Original Barley Straw (% wt. Dry Basis) | ACWT Barley Straw at Optimized Conditions Based on HHV (% wt. Dry Basis) | Methods | ||
|---|---|---|---|---|
| Proximate analysis | Moisture | 6.00 | 5.10 | ISO 18134-1 |
| Volatile Matter | 74.30 | 72.30 | ISO 18123 | |
| Ash | 8.40 | 5.50 | ISO 18122 | |
| Fixed Carbon | 17.3 | 22.2 | by difference | |
| Ultimate analysis | C | 45.53 | 52.51 | ISO 16948 |
| H | 5.50 | 5.79 | ISO 16948 | |
| N | 0.99 | 0.85 | ISO 16948 | |
| S | 0.12 | 0.14 | ISO 16994 | |
| O | 47.86 | 40.71 | by difference |
Table 4.
RSM coefficients and P, T and F-values for the polynomial model.
| Factor | Name | Coefficients | P | T | F |
|---|---|---|---|---|---|
| Const | Constant | 20.40 | 0.0000 | 45.76 | - |
| A | Temperature | 1.184 | 0.0075 | 4.336 | 18.81 |
| B | Time | 0.5850 | 0.0850 * | 2.143 | 4.593 |
| C | SA concentration | 0.4137 | 0.1900 * | 1.515 | 2.230 |
| AB | - | 0.2775 | 0.5044 * | 0.7189 | 0.5168 |
| AC | - | −0.3800 | 0.3701 * | −0.9844 | 0.9691 |
| BC | - | −0.0575 | 0.8874 * | −0.149 | 0.0222 |
| AA | - | 1.097 | 0.0413 | 2.729 | 7.450 |
| BB | - | −1.101 | 0.0408 | −2.739 | 7.507 |
| CC | - | 0.7366 | 0.1262 * | 1.833 | 3.361 |
* not significant.
Table 5.
Optimal conditions (set point) for maximized HHV predicted by the RSM polynomial model.
| Name | Factor | Range | Set Point | |
|---|---|---|---|---|
| Low | High | |||
| Temperature | A | 160 | 200 | 200 |
| Time | B | 0 | 40 | 25 |
| SA concentration | C | 10 | 35 | 35 |
© 2020 by the authors. Licensee MDPI, Basel, Switzerland. This article is an open access article distributed under the terms and conditions of the Creative Commons Attribution (CC BY) license (http://creativecommons.org/licenses/by/4.0/).
Share and Cite
MDPI and ACS Style
Nazos, A.; Grammelis, P.; Sakellis, E.; Sidiras, D. Acid-Catalyzed Wet Torrefaction for Enhancing the Heating Value of Barley Straw. Energies 2020, 13, 1693. https://doi.org/10.3390/en13071693
AMA Style
Nazos A, Grammelis P, Sakellis E, Sidiras D. Acid-Catalyzed Wet Torrefaction for Enhancing the Heating Value of Barley Straw. Energies. 2020; 13(7):1693. https://doi.org/10.3390/en13071693
Chicago/Turabian StyleNazos, Antonios, Panagiotis Grammelis, Elias Sakellis, and Dimitrios Sidiras. 2020. "Acid-Catalyzed Wet Torrefaction for Enhancing the Heating Value of Barley Straw" Energies 13, no. 7: 1693. https://doi.org/10.3390/en13071693
Note that from the first issue of 2016, this journal uses article numbers instead of page numbers. See further details here.