Hybrid Sensing of Internal and Surface Partial Discharges in Air-Insulated Medium Voltage Switchgear
by
 , , and
Ghulam Amjad Hussain
1,* ,
,
Ashraf A. Zaher
1,
Detlef Hummes
1,
Madia Safdar
2 and
Matti Lehtonen
2 1
Department of Engineering, College of Engineering and Applied Sciences, American University of Kuwait, Safat 13034, Kuwait
2
Department of Electrical and Automation Engineering, School of Electrical Engineering, Aalto University, 02150 Espoo, Finland
*
Author to whom correspondence should be addressed.
Energies 2020, 13(7), 1738; https://doi.org/10.3390/en13071738
Submission received: 1 March 2020
/
Revised: 24 March 2020
/
Accepted: 2 April 2020
/
Published: 5 April 2020
(This article belongs to the Special Issue Selected Papers from the 19th IEEE International Conference on Environment and Electrical Engineering (19th IEEE EEEIC))
Abstract
:Partial discharge (PD) measurements have proved their reliability for health monitoring of insulation systems in power system components including synchronous generators, power transformers, switchgear and cables etc. Online condition monitoring and pro-active detection of PD faults have been highly demanded over the last two decades. This paper provides results from a research project to develop advanced non-intrusive sensing technologies that are cost effective, reliable and efficient for early detection of PD faults in medium voltage (MV) and high voltage (HV) air-insulated switchgear. Three sensors (high frequency E-field (D-dot) sensor, Rogowski coil and loop antenna) have been developed and tested under various PD faults and their performance were evaluated in comparison with high frequency current transformer (HFCT) which is being used commercially for PD testing and measurement. Among these three sensors, it is shown that D-dot sensor and Rogowski coil are more dependable when it comes to the PD measurements due to their high signal to noise ratio and hence high accuracy. These sensors can be customized according to a specific application and can be connected together with one data acquisition device while developing an online condition monitoring system.
1. Introduction
Switchgear is a set of equipment consisting of circuit breakers, isolating switches, fuses, instrument transformers (CT—current transformers, PT—potential transformer) and relays, used to distribute electrical power as well as protect and isolate a certain line during a fault. There are numerous types of electrical switchgear based on application and insulation requirements and circuit breaker construction. They are categorized as air insulated, oil or sulphur-hexa-fluride (SF) switchgear. This paper investigates partial discharge (PD) measurements in air-insulated metal clad switchgear. Switchgear is an integral part of electrical transmission and distribution system, therefore, the occurrence of any electrical fault in it leads to an interruption of electric power to the users and hence economic losses and penalty. Majority of electrical faults occurring in switchgear are developed slowly due to the insulation degradation. PD is considered as one of the major causes of insulation deterioration in medium voltage (MV) and high voltage (HV) switchgear, power cables and transformers which is dependent on various stresses named as TEAM stresses, i.e., Thermal, Electrical, Ambient and Mechanical [1,2]. These stresses continuously affect the PD activity and hence the insulation material keeps on deteriorating. Therefore, a PD activity provides an early alarming sign of an insulation failure. The severe consequences of insulation failure include flash-over or discharge of energy through air, which is a major hazard in industry for personnel and equipment [3]. Hence PD detection is becoming popular for the condition assessment and health monitoring of MV and HV power equipment [4,5]. There are various components in a switchgear panel which are prone to the PD activities. The nature and the type of a PD activity depends on the insulation type, operating and environmental conditions. For example, electrical tracking is prominent on organic insulation surfaces while electrical treeing is more common in CTs and PTs. Often PD activity is believed to be initiated due to cracks, voids and other manufacturing defects in the insulation materials [6].
Conventionally MV and HV equipment were tested occasionally during the scheduled periodic maintenance times, allocated for a certain equipment or even a for the whole substation. Such procedures have certain drawbacks, such as a PD activity can start and lead to complete damage to the insulation between two maintenance periods leading to a long power outage, while the operators can be completely blind about it. Moreover, PD tests were carried out during off-line conditions, and the PD fault behaves quite differently during an off-line condition. With the advancements in non-intrusive sensing technologies, it is now possible to monitor the equipment continuously online [7,8]. Such an online monitoring of PD in HV/MV equipment provide an early warning for a developing insulation defect, allowing planner/operator to arrange for a maintenance, repair or a replacement without having long unplanned outages [9].
Numerous non-intrusive sensors have already been developed in industry and reported [10,11,12,13,14,15]. Some of them are very reliable, but at the same time very expensive. In this paper, three sensors which are differential electric field sensor (D-dot sensor), Rogowski coil and loop antenna have been developed and tested for the detection of PD faults in air-insulated metal-clad switchgear in HV laboratory and their performance is evaluated in comparison with a widely accepted PD sensor i.e., High Frequency Current Transformer (HFCT). The sensitivity and reliability of these sensors in detection of PD faults are investigated. Moreover, an outline of integration of such sensors with an existing SCADA or protection system is given.
This paper is organized as follow. Section 2 presents the background and theory of PD phenomenon as an indication of insulation degradation. Section 3 and Section 4 present the working and detection principles of the sensors and the laboratory test setup, respectively. Section 5 presents the results and discussion, followed by an outline of connection of the proposed sensors to the SCADA or protection systems in Section 6. Finally, conclusions are given in the last section.
2. Partial Discharge (PD) Phenomenon
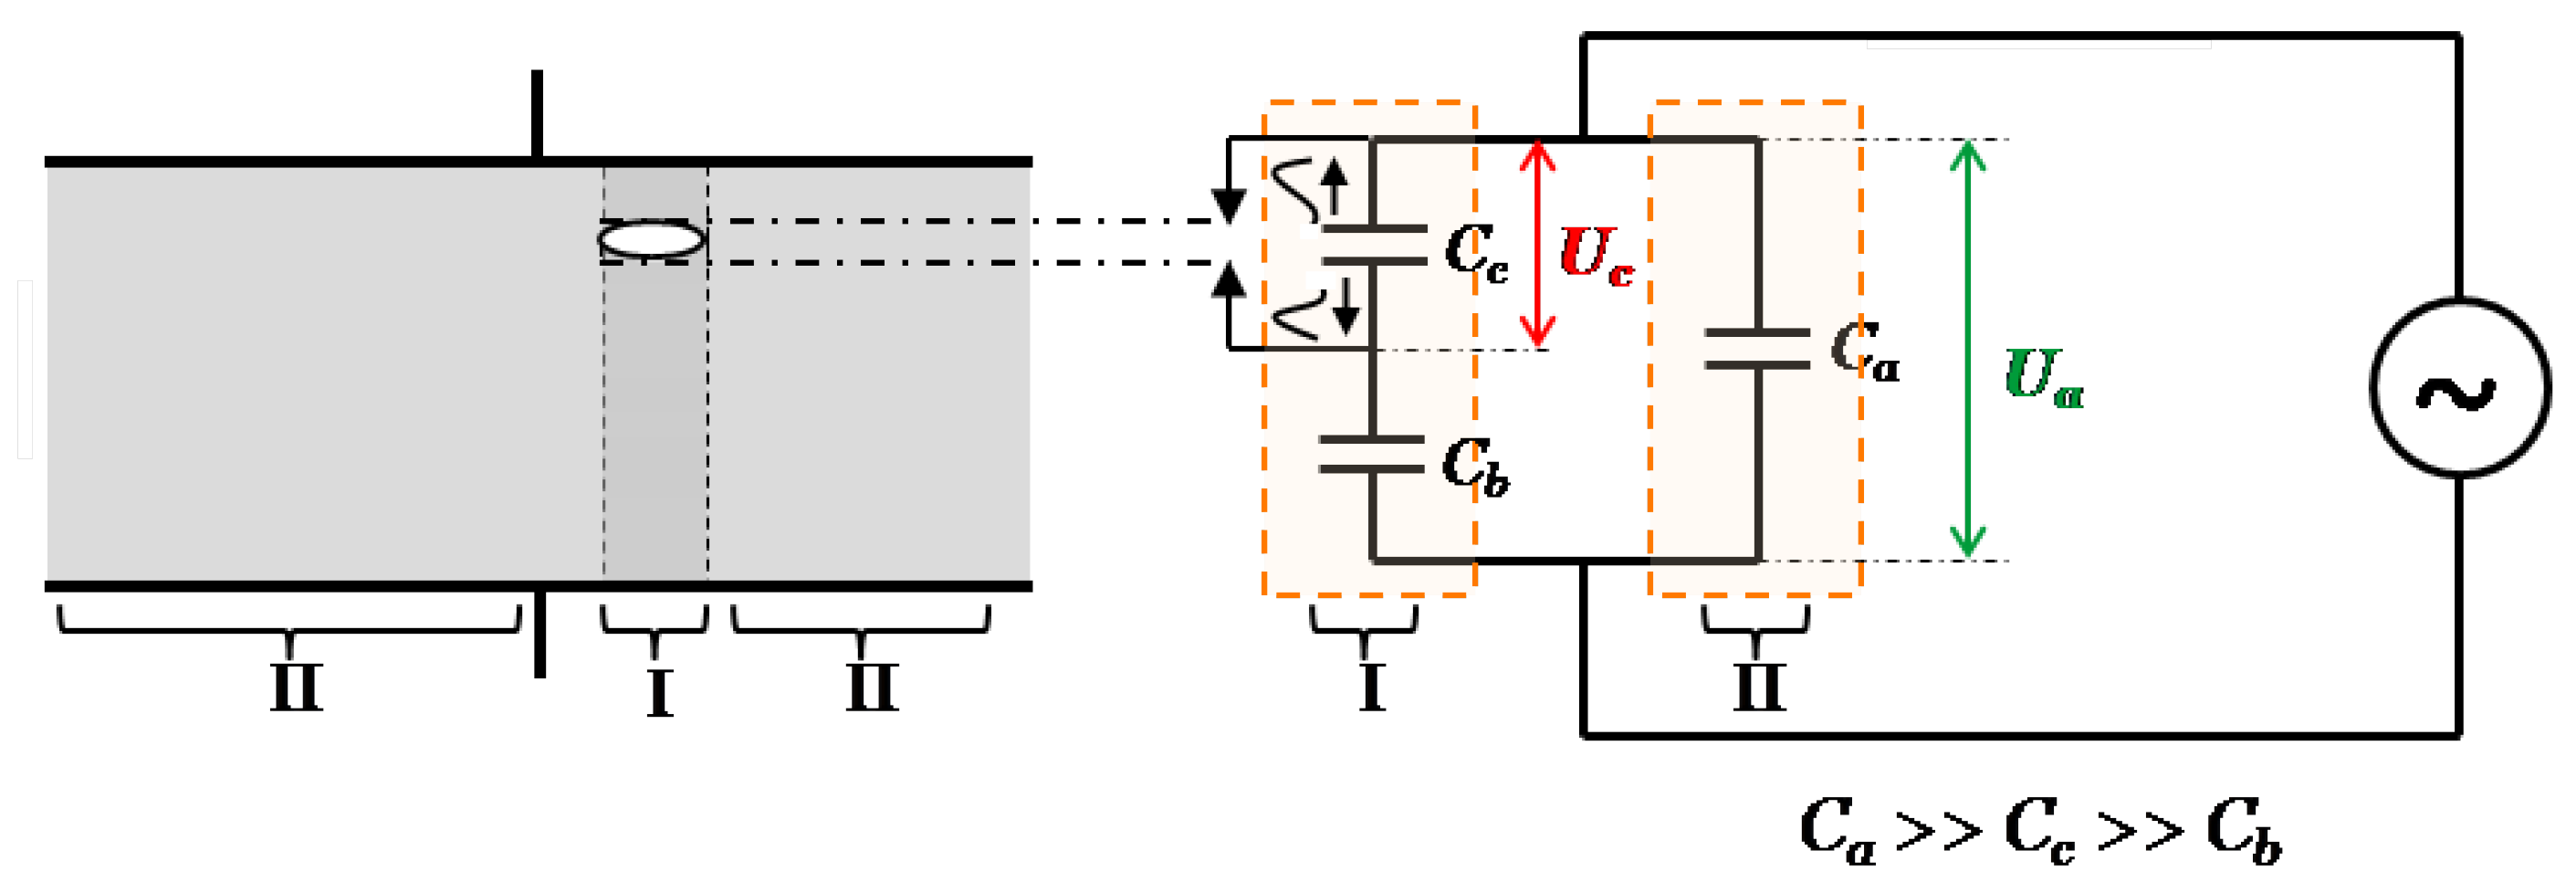
As given in IEC Standard [16], PD is defined as follows: “A localized electrical discharge that only partially bridges the insulation between conductors and which can or can not occur adjacent to a conductor”. The insulation material is inserted around a conductor in order to limit the electric current between the conductors or between a conductor and a ground. When an electrical power equipment is energized during its operation, a certain voltage level exists across an insulator and an electric field is created in it. If a void or crack (termed as a defect in insulation diagnostic studies) exists within the insulation as shown in Figure 1, the permittivity of the defect is less than the permittivity of the healthy part of the insulation. The electric field strength in an insulation is inversely proportional to the permittivity of the material, therefore the electric field strength in the defect is higher than the healthy part of the insulation. As the operating voltage varies sinusoidally, so does the electric field. At a certain voltage level, where electric field in the defect exceeds the breakdown strength of it, a rapid flow of charges across the defect is resulted which is called breakdown of the cavity or partial discharge (PD). The voltage level at which the defect or cavity breaks down is called the ionization voltage . The PD can occur at any point in the insulation system where the electric field exceeds the breakdown strength of that portion of the insulation. As PD starts, it causes continuous damage to the insulation, resulting in complete breakdown of the insulation. PD is divided into the following categories [17]:
- Internal PD
- (a)
- Cavity discharge
- (b)
- Treeing discharge
- Surface PD
- Corona
The discharges from gas filled voids, delaminations or cracks within a solid insulation are called internal PDs. Discharge occurring on the surface of an electrical insulation where the tangential field is strong, is called surface discharge. Ionization of air around the surface of an HV bare conductor such as in transmission lines is called Corona [17].
Figure 1 shows a well known three capacitance model with an internal cavity [17]. Any insulation material can be represented by a capacitance. In Figure 1, represents the capacitance of the cavity or defect, is the capacitance of the healthy part of the insulation in series with the defect, whereas is the capacitance of the remaining helthy part of the insulation which is in parallel with the series combination of and .
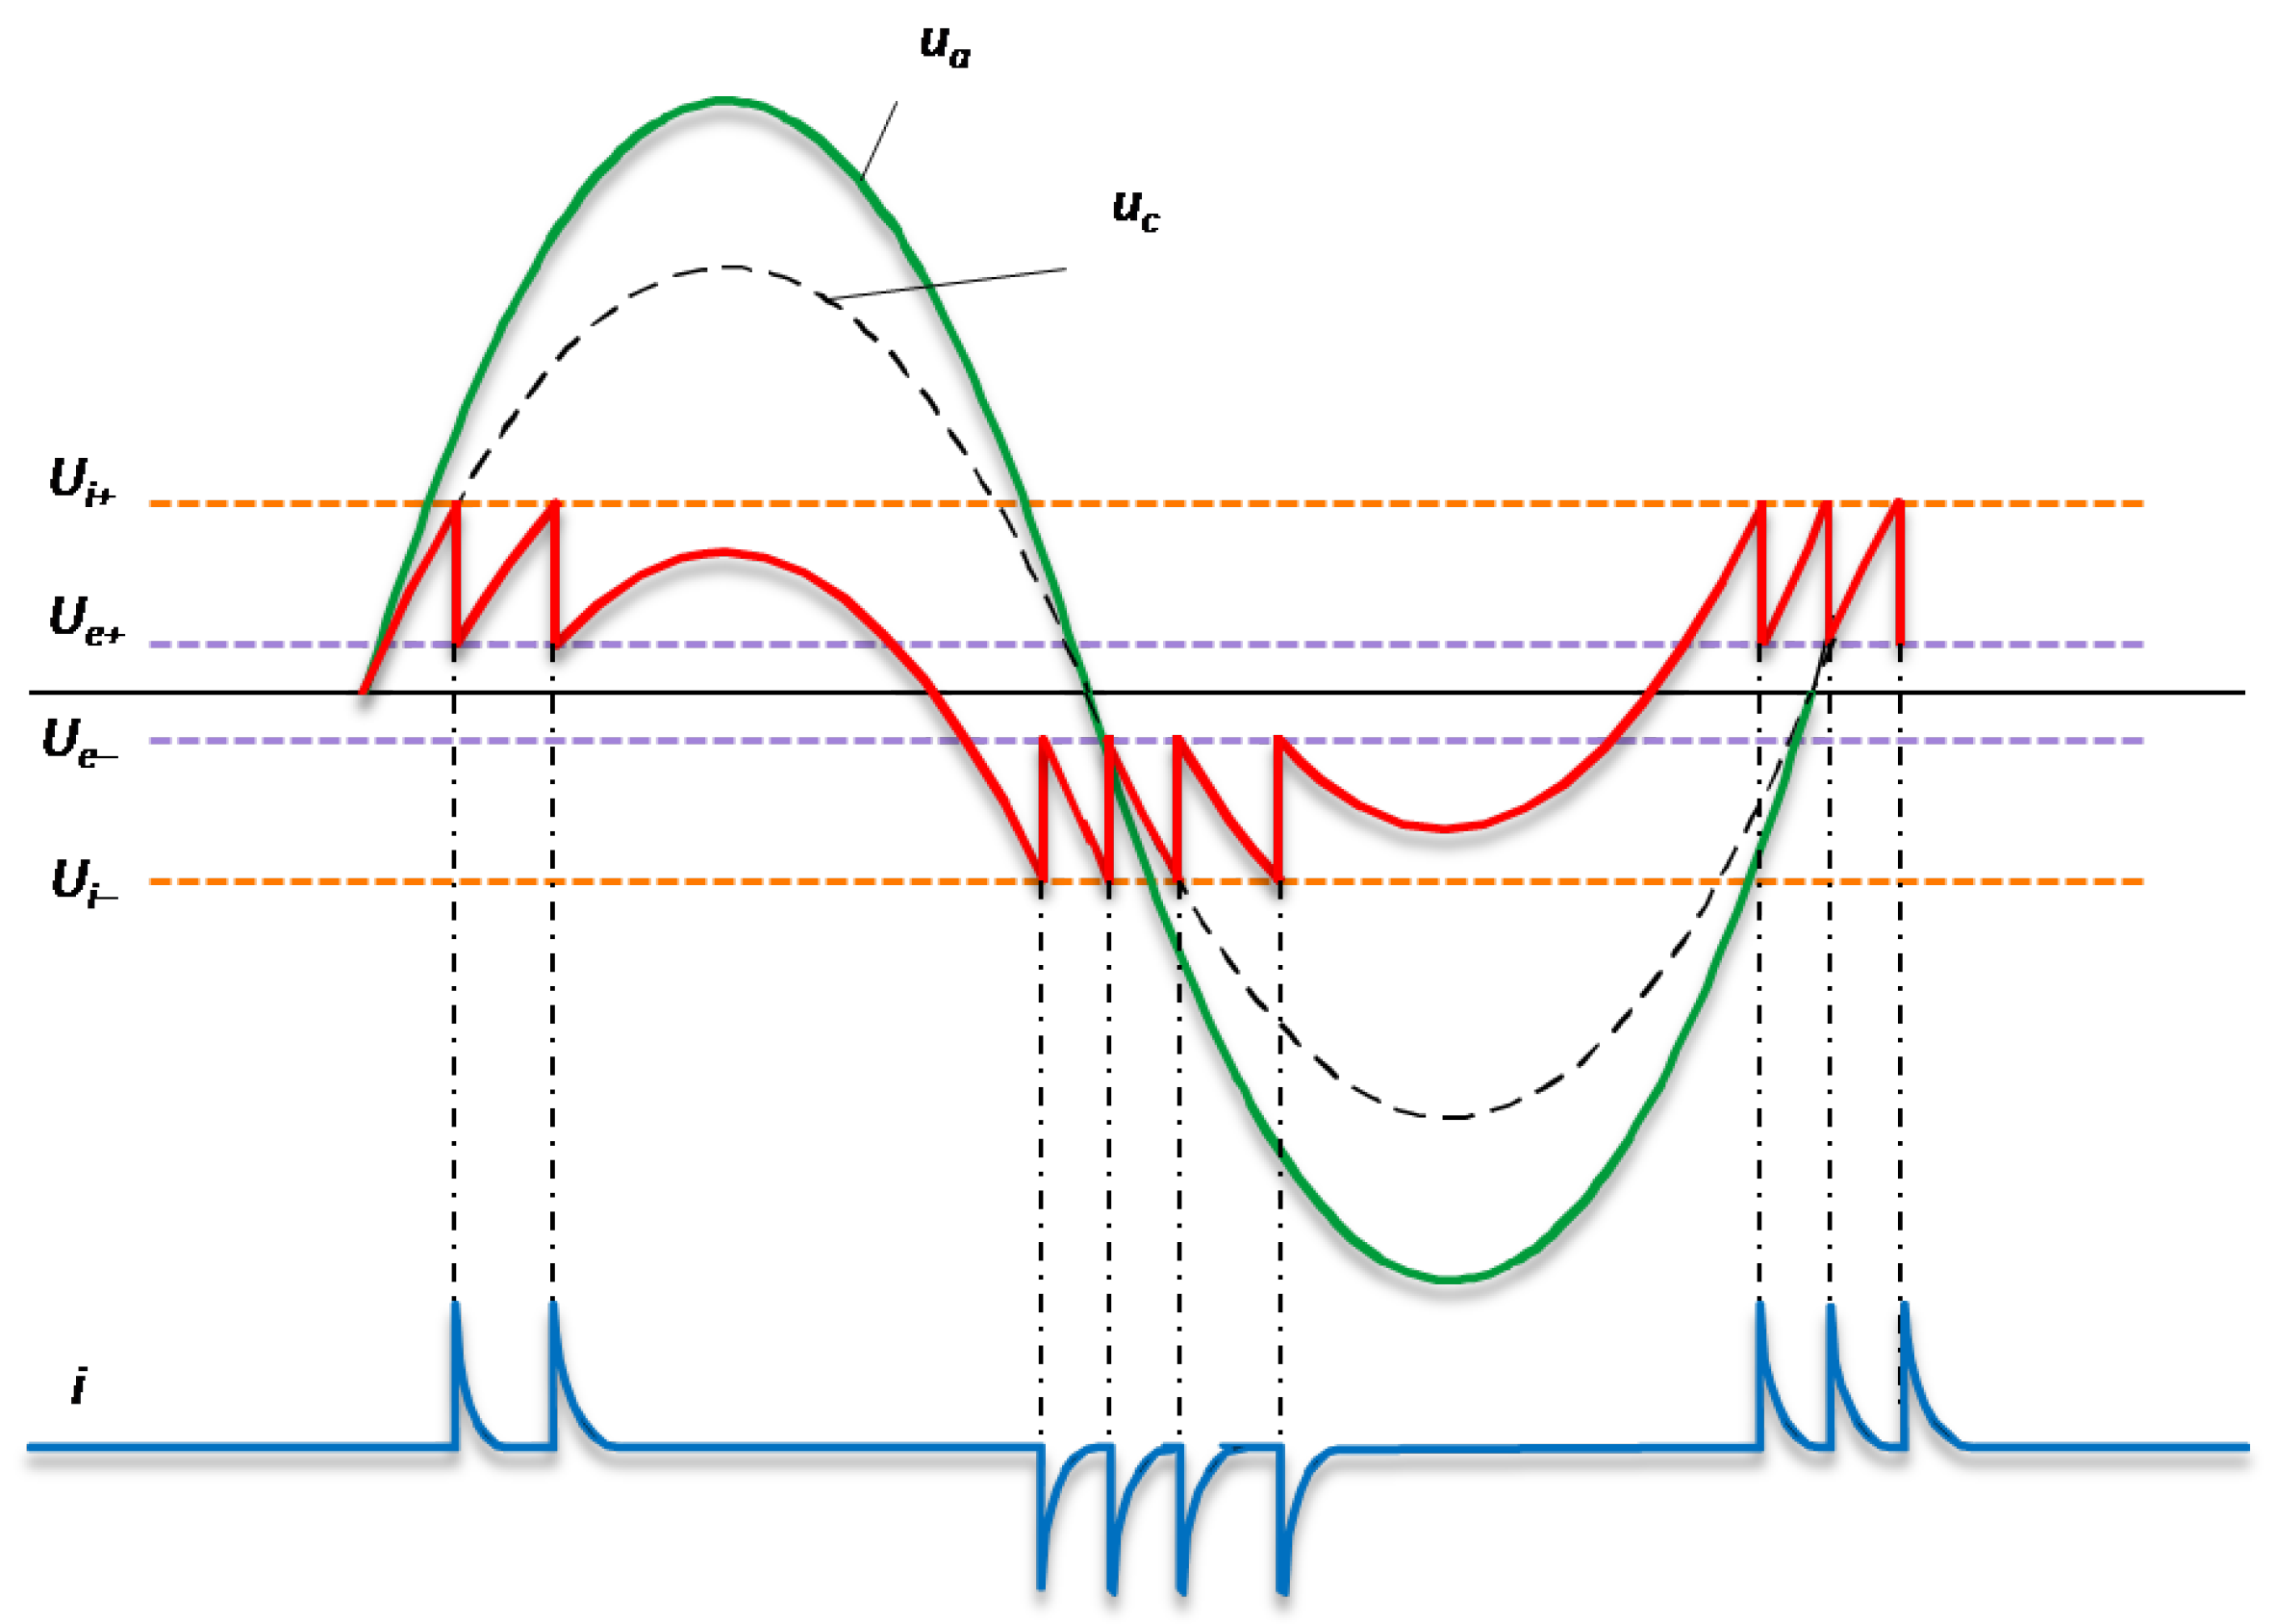
The movement of charges is nearly equal to the speed of light which results in creating a current pulse of very short duration (usually in the range of nanoseconds) and a very small rise time. This is called a PD current pulse and the charge displaced during this activity is termed as apparent charge of PD [18,19]. The apparent charge is a detectable PD quantity at terminals of test object. It is a representative measure of the PD, but is not equal to the true amount of charge involved at the source of the PD. The generation of PD pulses with respect to the applied voltage is shown in Figure 2. The Figure shows the breakdown of the cavity shown in Figure 1 at its ionization voltage . Due to the transfer of charge the potential difference across the cavity drops to a voltage level called extinction voltage . The voltage across the cavity starts to build up again. This process goes on repeatedly in both positive and negative half cycles. These PD pulses are superimposed on the power frequency current and voltage waveforms and travel away from the PD location. The PD activity is demonstrated in Figure 2, where i shows the PD current waveform [18,19].
The most important type of all PDs is the internal PD, which slowly and gradually eats away the insulation by increasing the length of the cavity, and leading to the complete breakdown of insulator. All types of PDs result in physical emissions such as electromagnetic airborne signals in radio frequency, ultraviolet light, heat radiations, ultrasonic emissions and chemical byproducts. Such emissions can be detected non-intrusively and hence a PD activity is estimated [18,19]. This is the basis for development of the sensors used in this research. The sensors used for PD measurement and their working principles along with the equivalent models are explained in the next section.
3. PD Sensors
The fundamental part of an online monitoring system is a sensor. The accuracy of the measurements is affected by its appropriate design and installation. As mentioned in the previous section, the PD activities generate high frequency current pulses superimposed on the power frequency current as well as other physical emissions. In this research three sensors are developed based on their cost effectiveness, sensitivity, compactness and simplicity in design as well as reliability in detecting PD signals. These sensors are:
- Differential E-field sensors (D-dot sensor)
- Rogowski coil
- Loop antenna
All the three sensors detect high frequency electromagnetic signals generated by the PD activity. The detection frequency range of the three sensors are given in Table 1. One of the commercially used PD sensors for insulation diagnostics is high frequency current transformer (HFCT) for various power equipment and cables [12]. This sensor is still costly compared to the other non-intrusive sensors. In order to confirm the performance and reliability of the proposed sensors, it can be a prime choice. Hence, HFCT is used for comparison with other three sensors listed above.
3.1. Working Principle of Rogowski Coil and HFCT
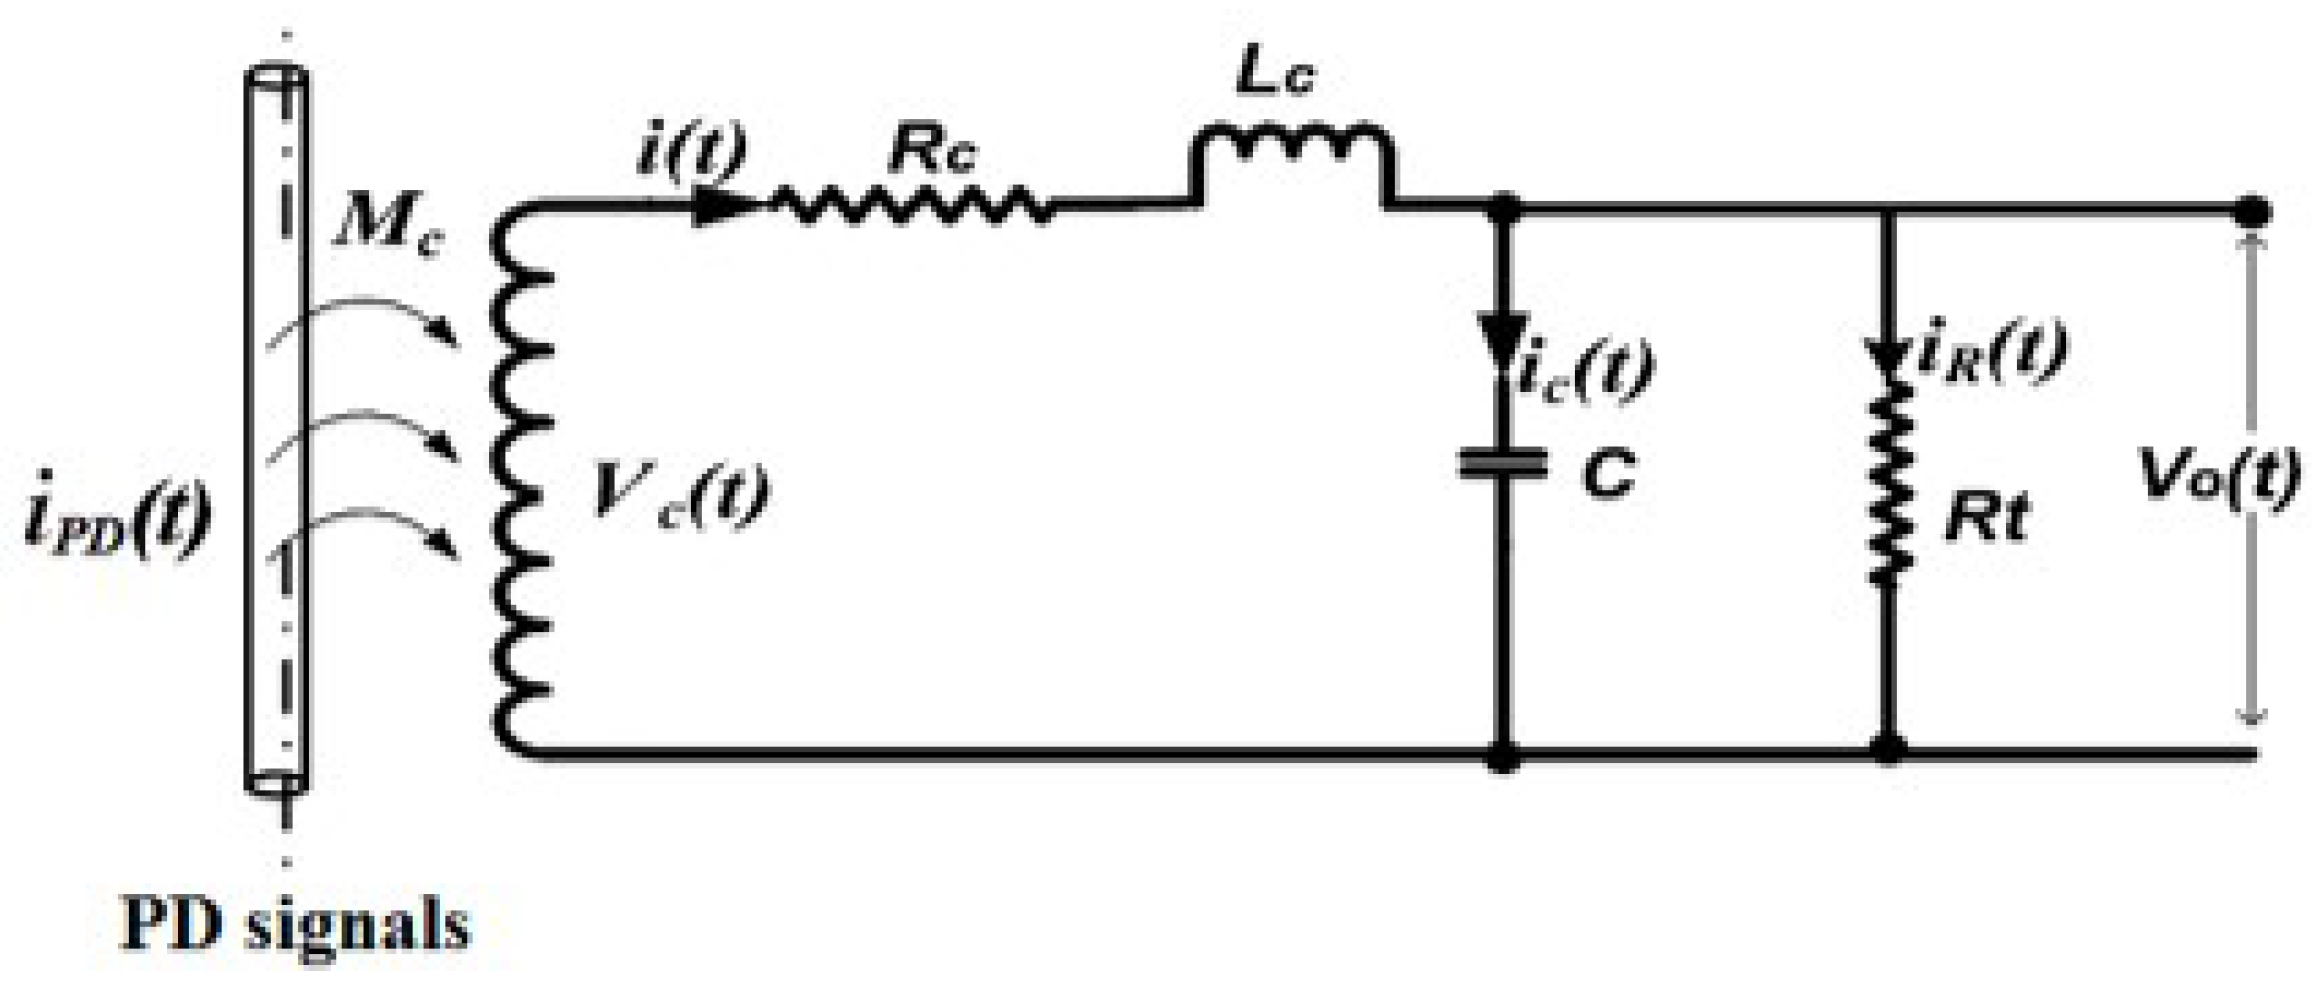
The HFCT and Rogowski coil work on the same principle while being different in construction. The Rogowski coil is a high frequency current probe, which works on the Faraday’s law of electromagnetic induction. The detailed sensor design is given in [20]. The sensor developed and used in this research is given in Figure 3, which measures the differential magnetic field generated by the PD pulse. Figure 4 shows the electrical equivalent model of a Rogowski coil, where is the voltage developed at the coil (winding) of the probe, which serves as a source voltage for the coil’s equivalent circuit. In the presence of terminating impedance, the output voltage can be expressed as:
where, is the PD signal to be measured and is the mutual inductance between the PD source and coil winding. The output of the Rogowski coil in terms of transfer function can be expressed as [20]:
3.2. Working Principle of D-Dot Sensor
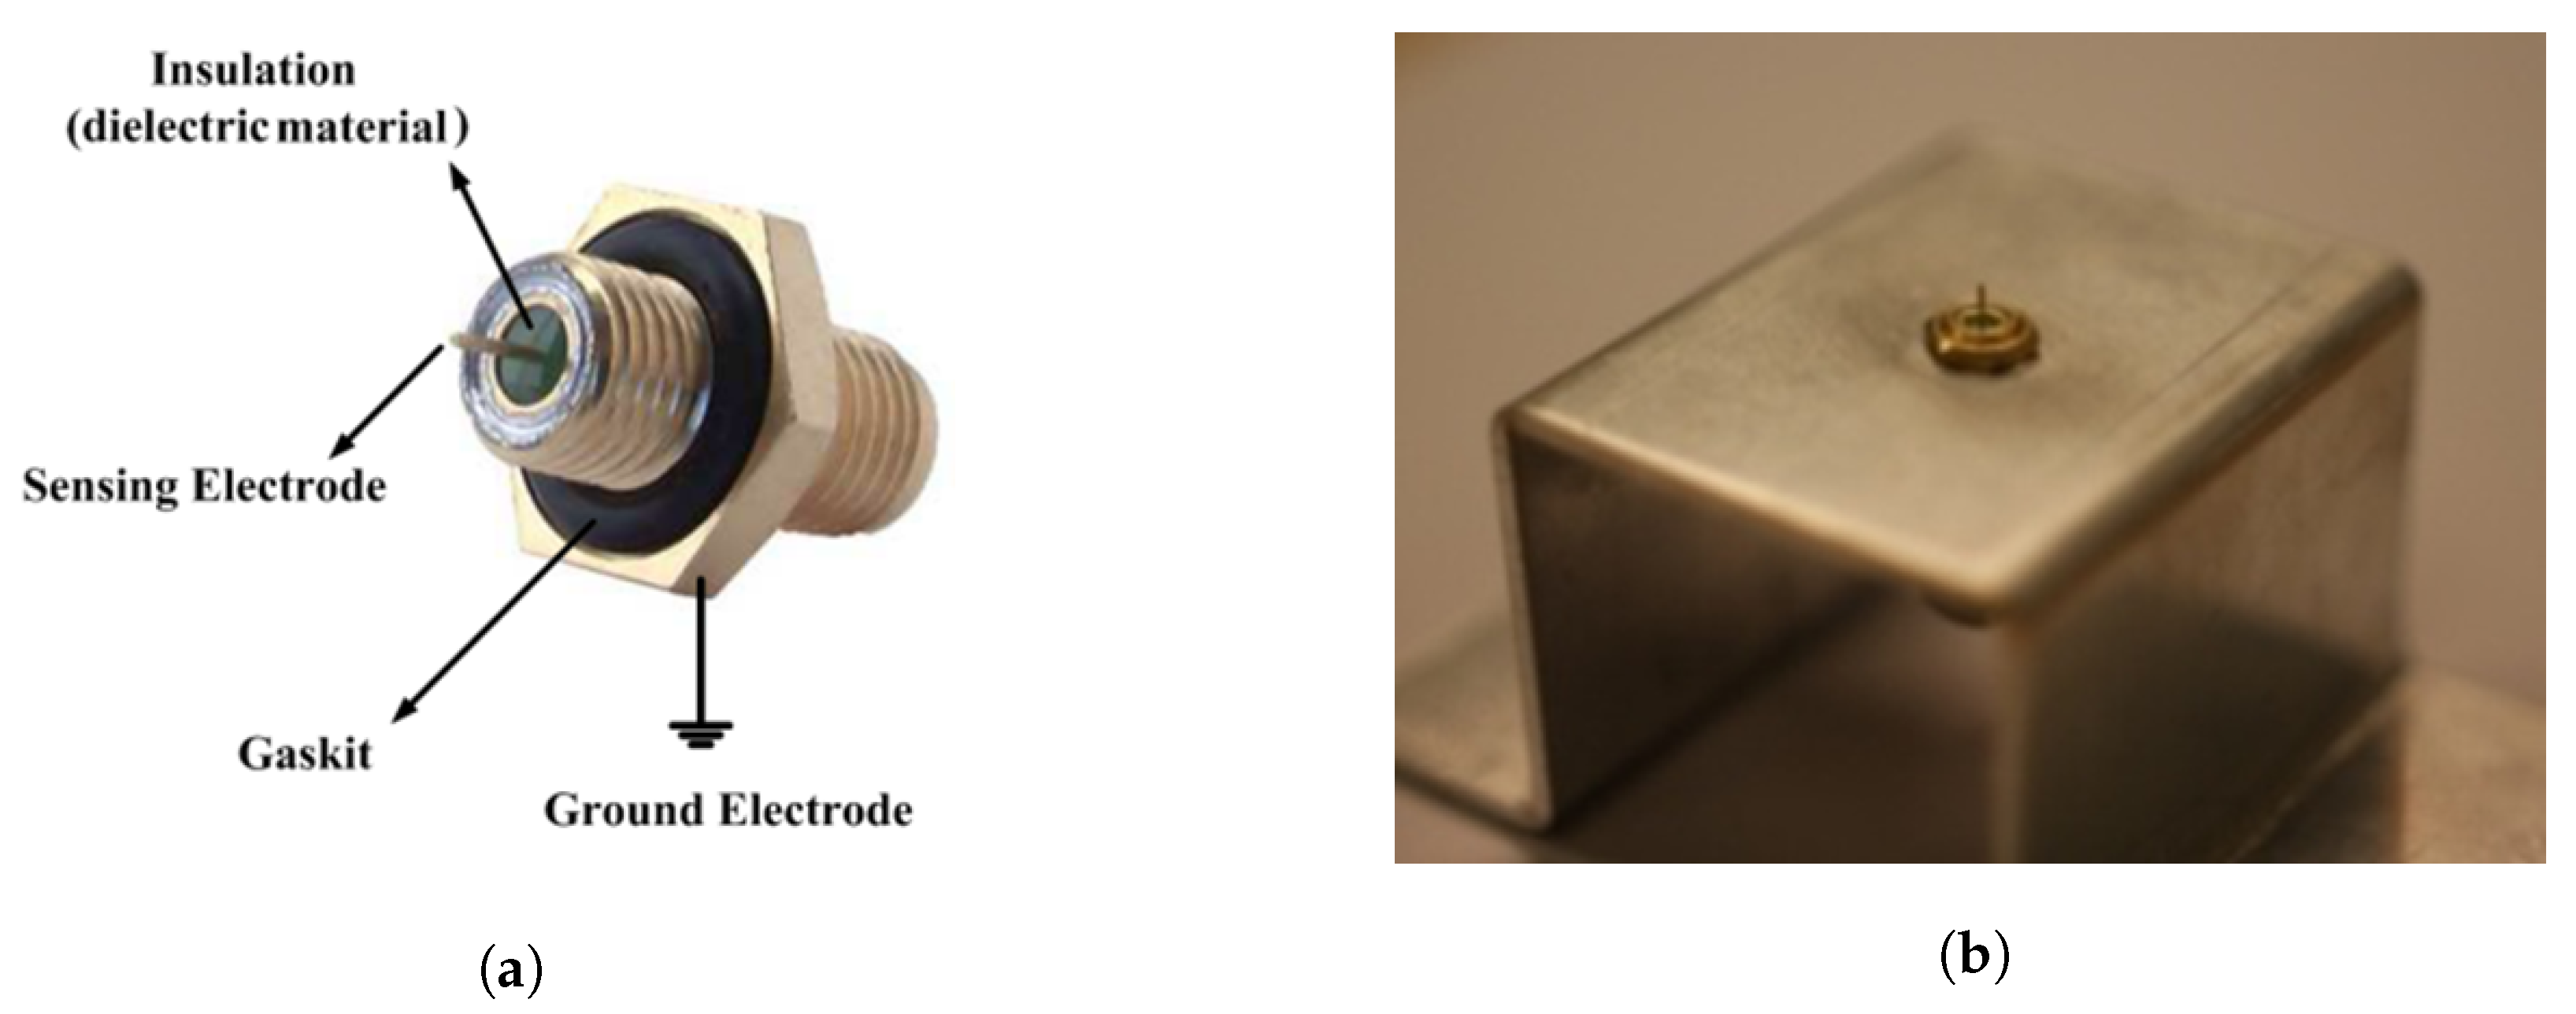
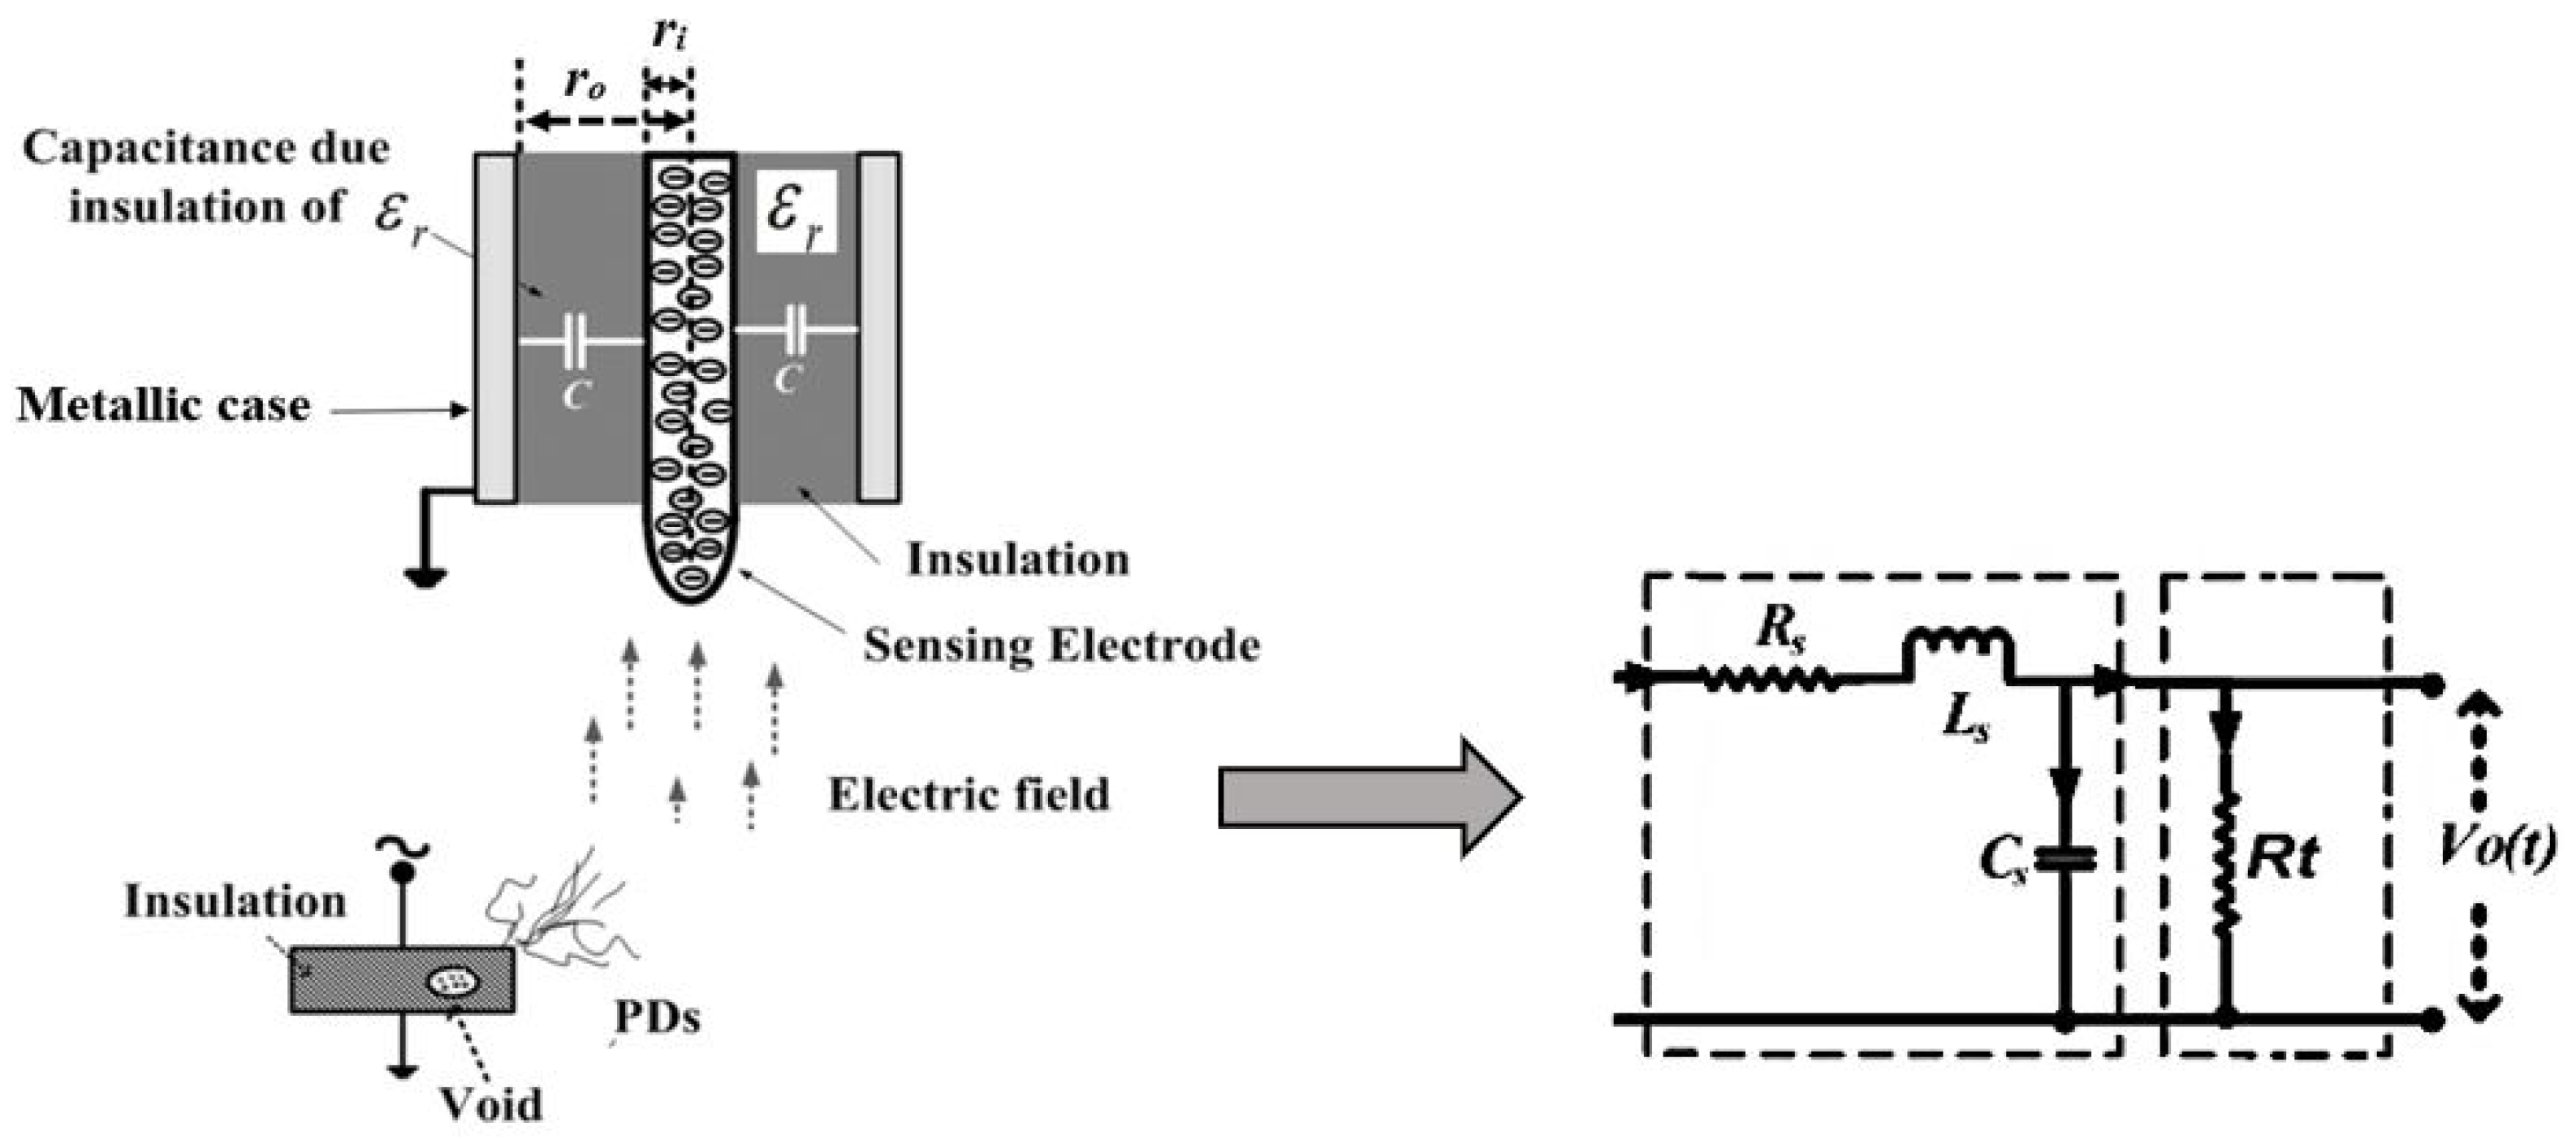
The D-dot sensor is a short mono-pole antenna, which is a capacitive sensors and measures the differential electrical field in a frequency range upto GHz [21]. Its detailed description is given in [22]. The sensor used in this research is given in Figure 5. The sensor was installed on a metal plane to be used for PD detection. The electrical equivalent model of the D-dot sensor is shown in Figure 6. The output current of the sensor can be represented by
where C is the capacitance between the discharge source and the centre conductor of the sensor head, p is the distance between them and is the time variant electric field. The electric potential and the electric field are correlated as
The electrical model of D-dot sensor is the second order RLC circuit as presented by the Rogowski coil, therefore the transfer function of the D-dot sensor can be similar to the one given in Equation (2).
3.3. Working Principle of Loop Antenna
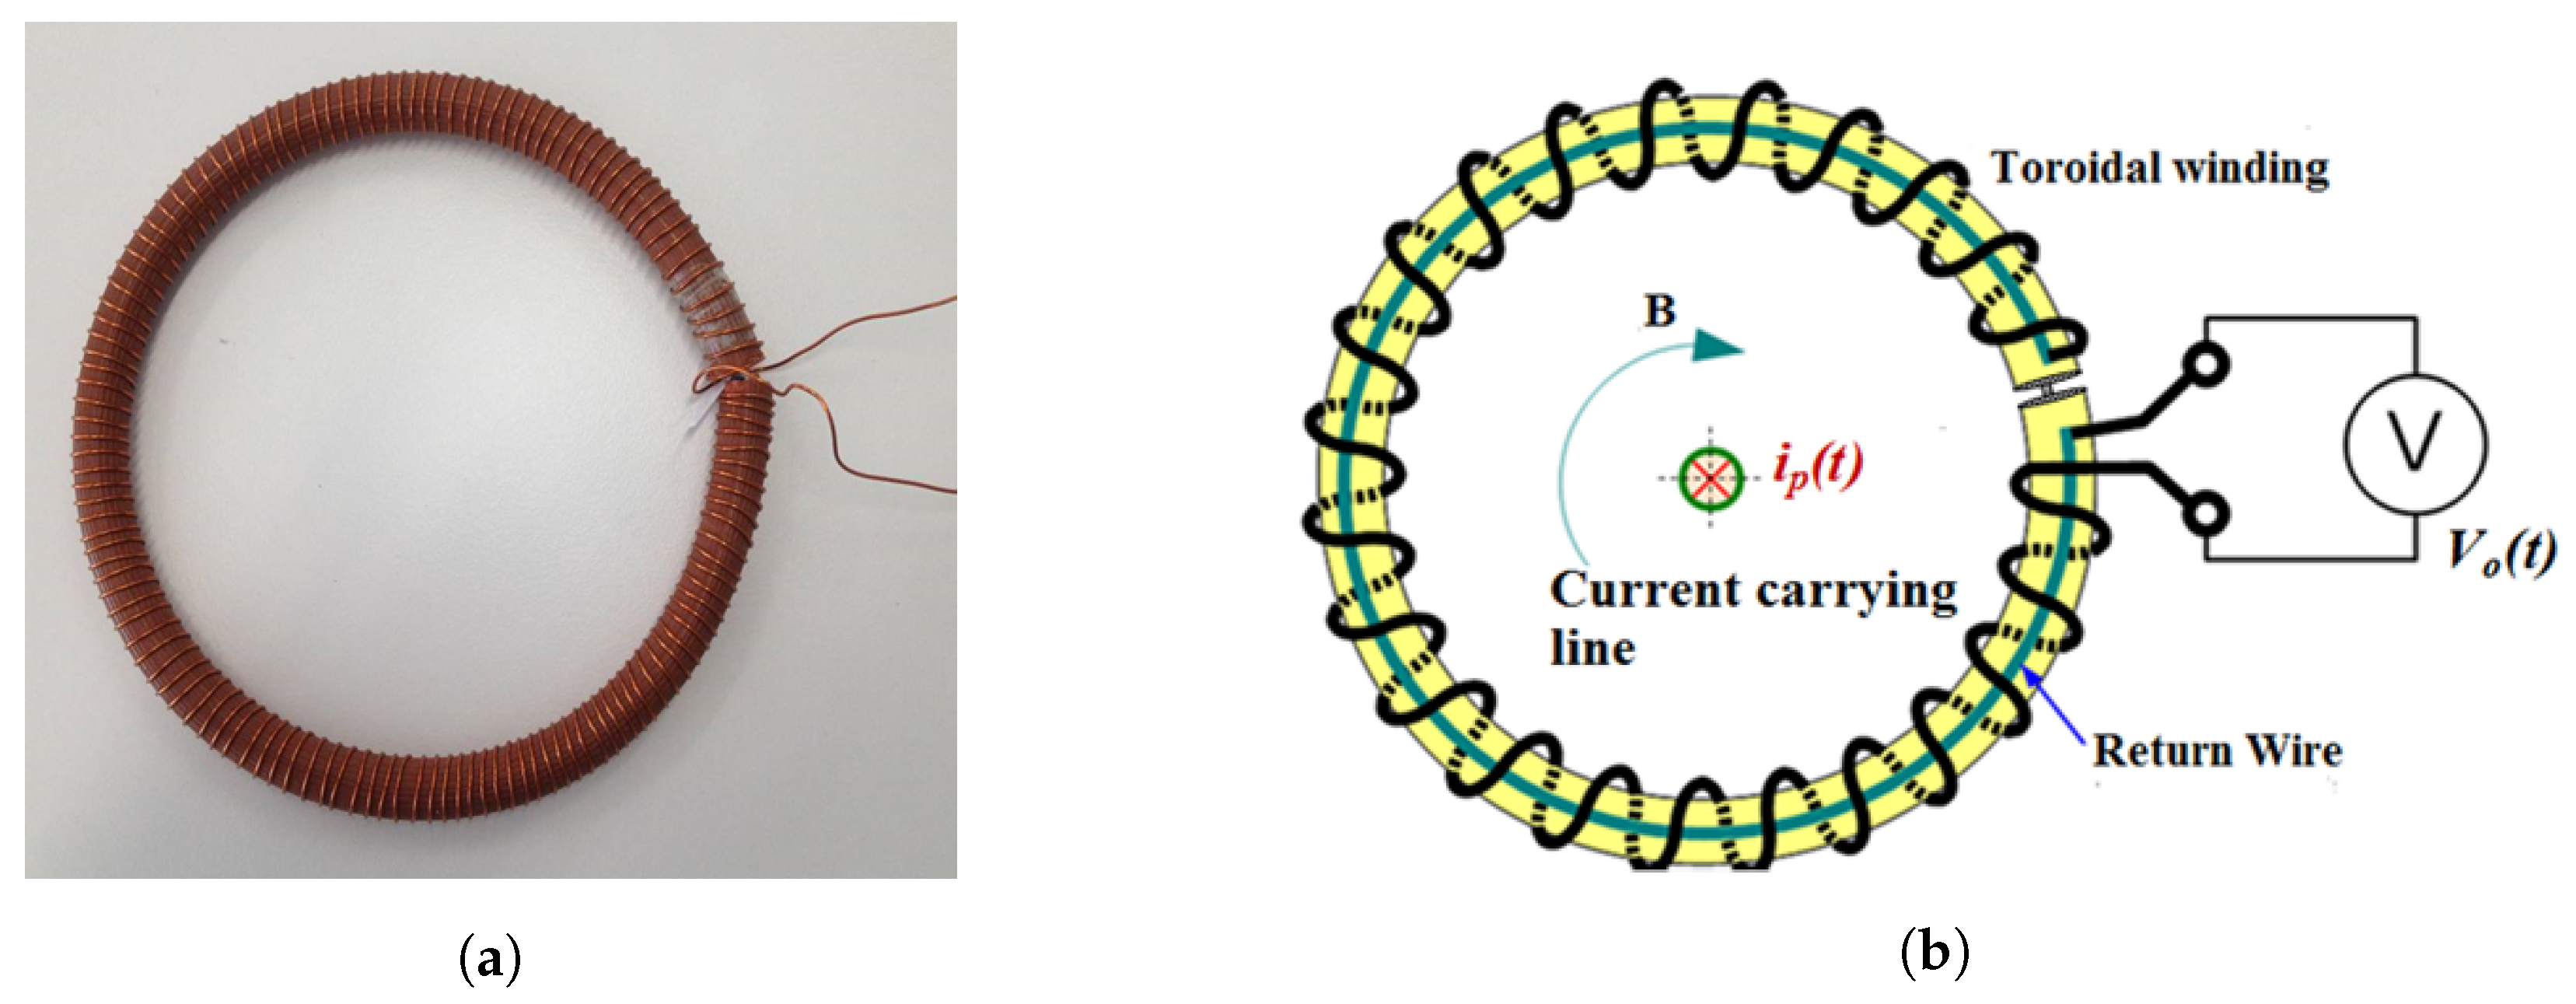
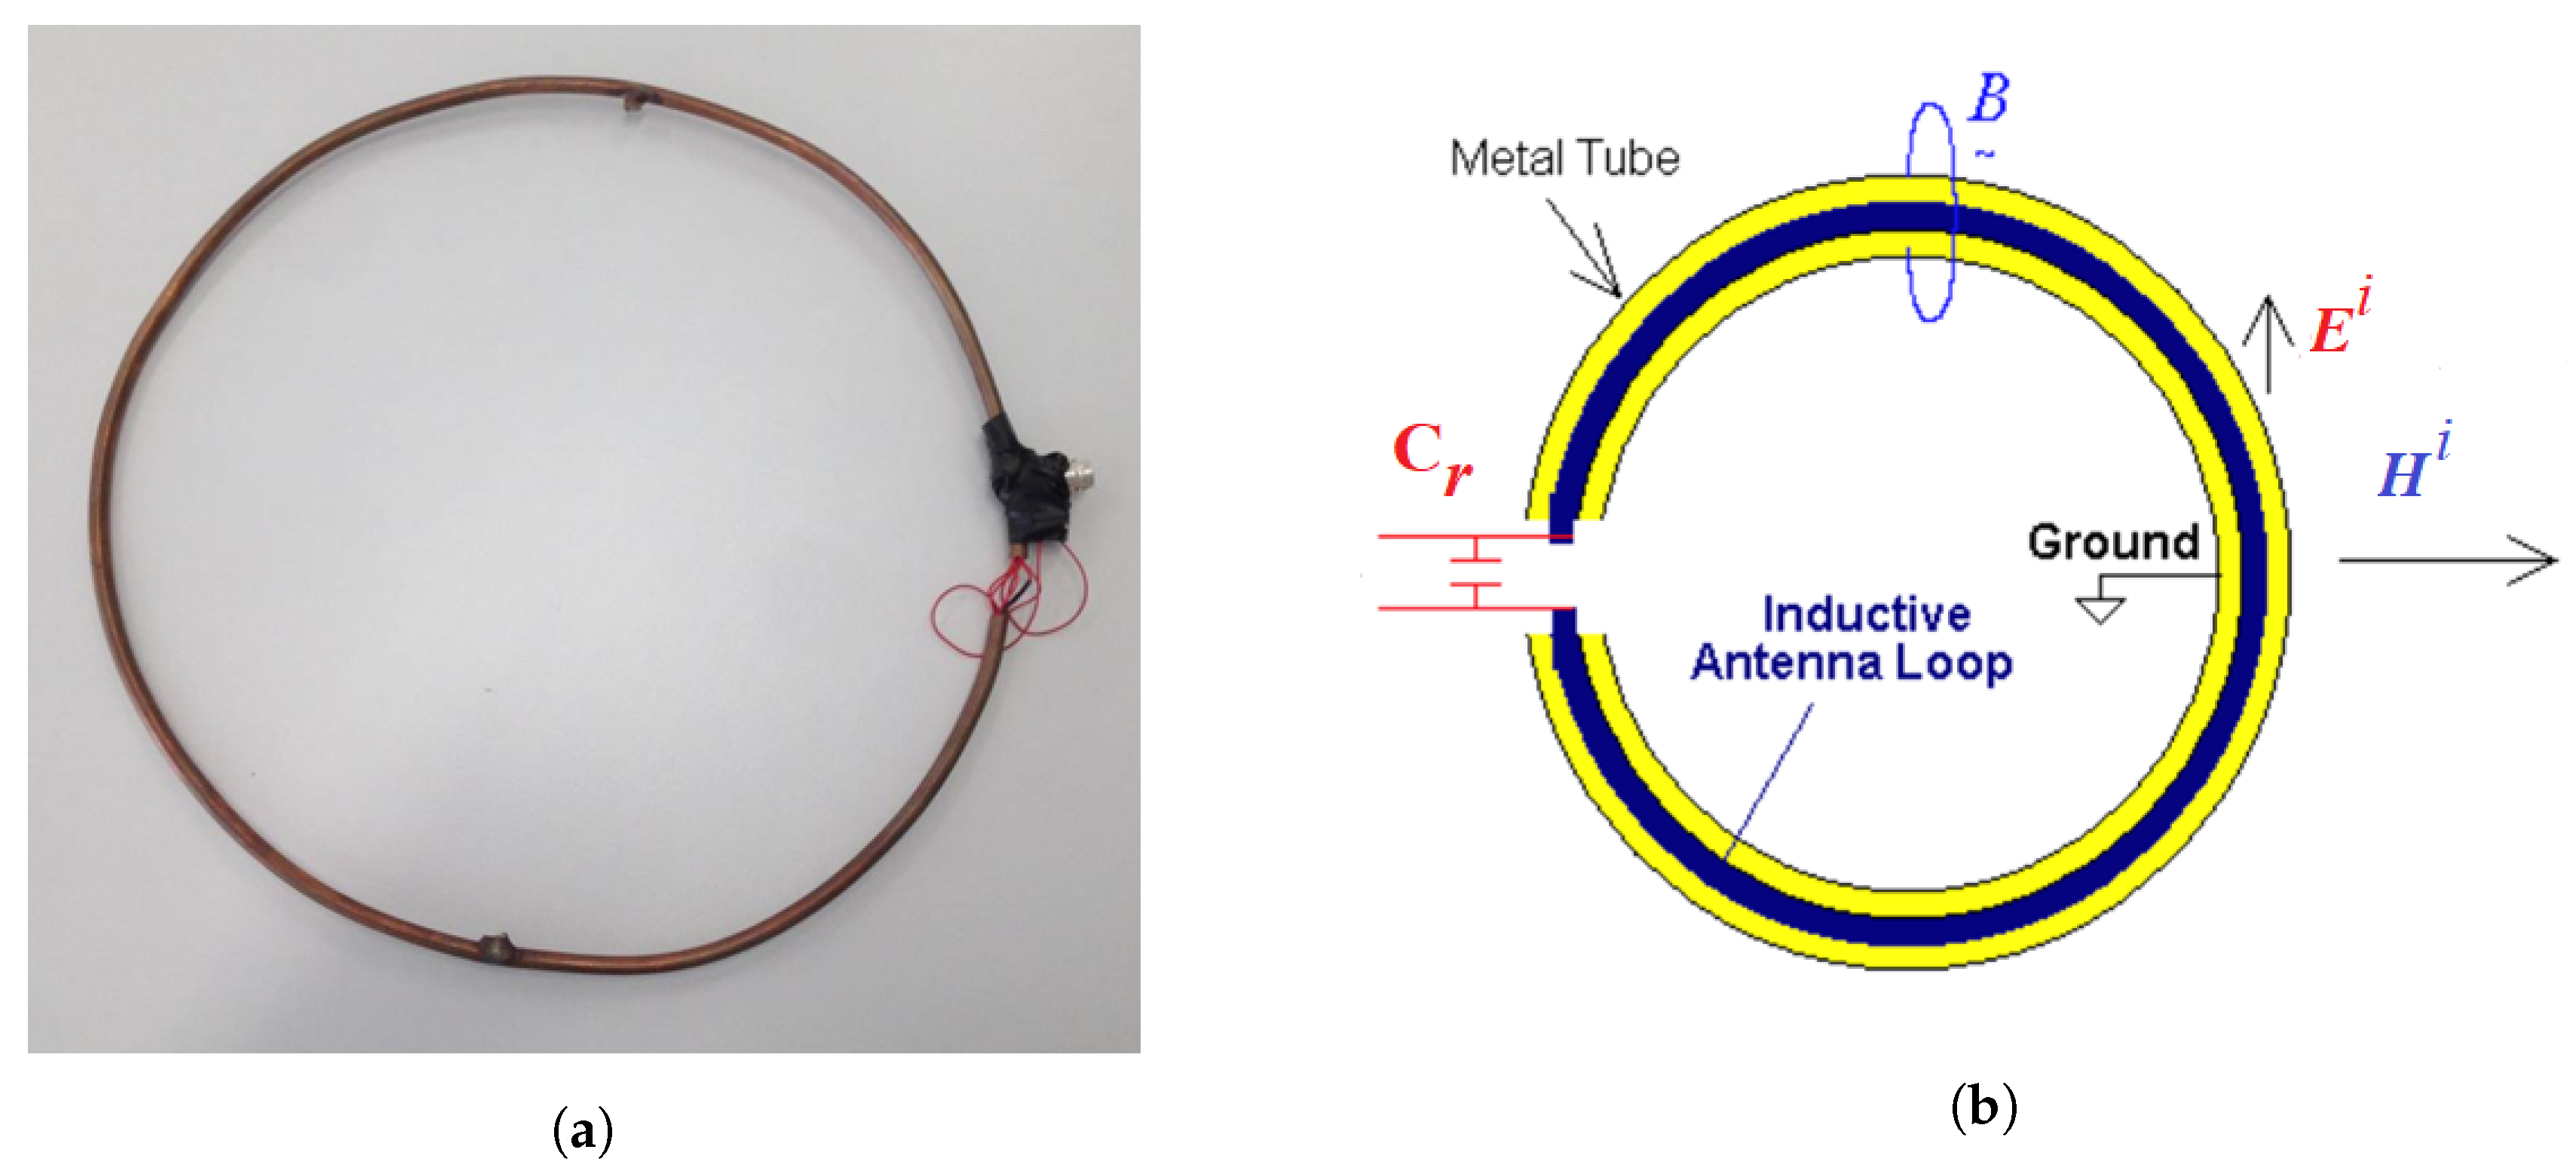
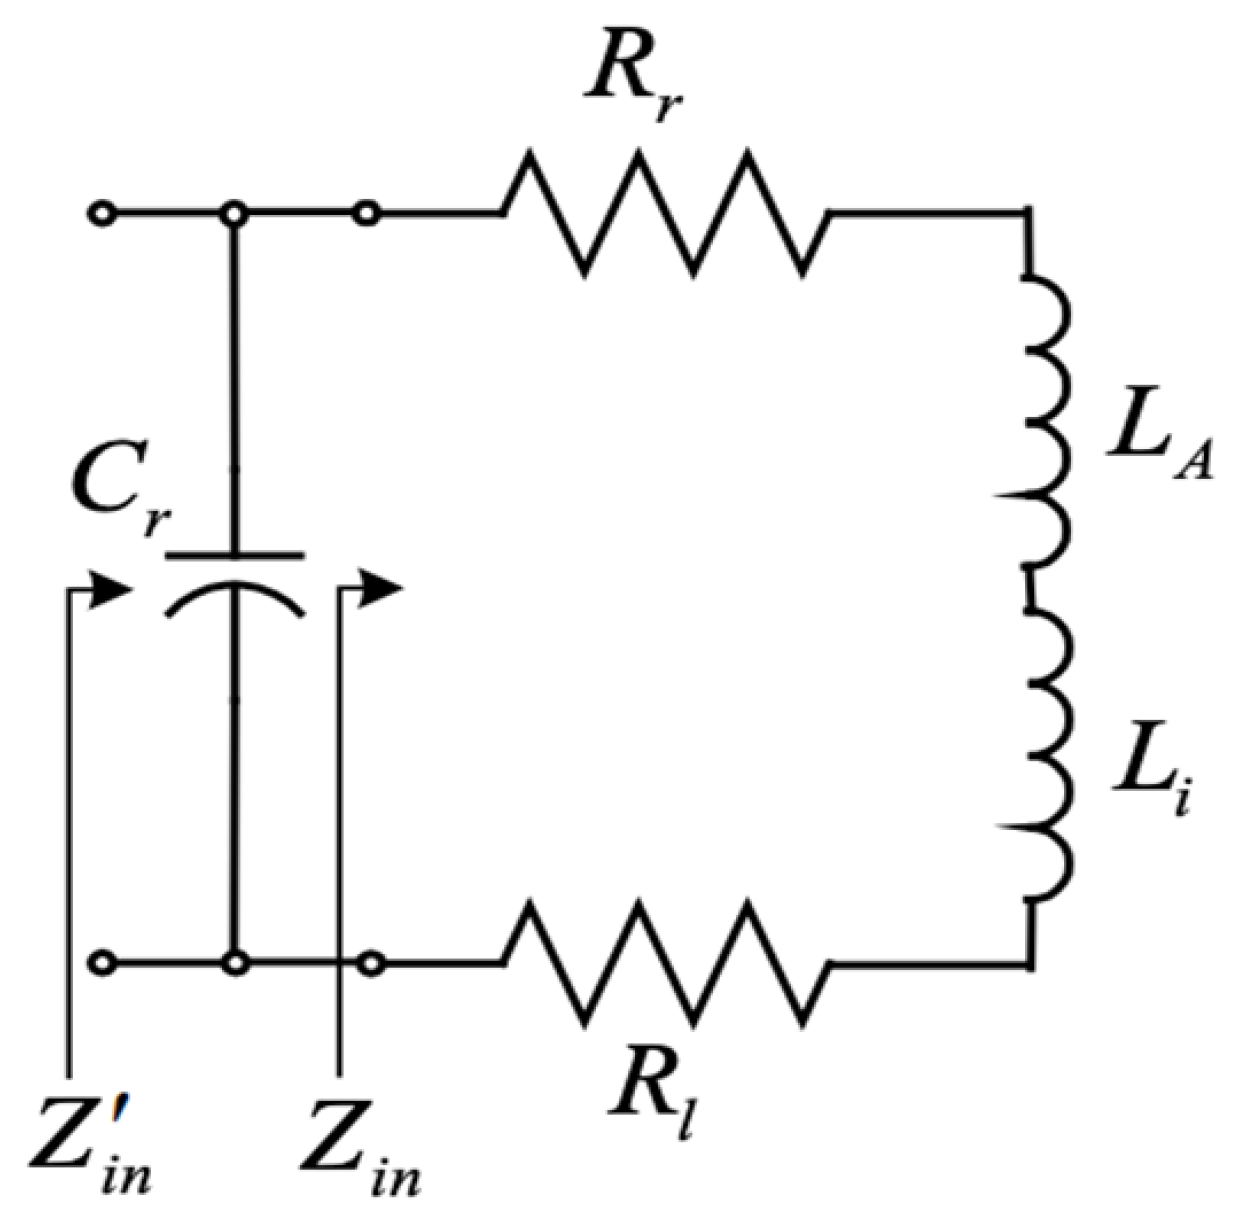
The loop antenna is quite similar to a conventional antenna which captures electromagnetic waves in the range of MHz and GHz. Loop antenna is simple in construction, cost effective and versatile. The antenna is constructed by taking a certain number of wire loops placed inside a circular conducting/metal tube tube. The antenna used in the experiments is shown in Figure 7 along with its conceptual diagram. Various shaped loop antennas are used as electromagnetic probes for the detection of high frequency electromagnetic signals. Some popular designs include: circular, triangular, square, elliptical, etc. They are widely used in telecommunication links. The antenna simply works on the Faraday’s law of electromagnetic induction and hence detects the differential magnetic fields. The travelling electromagnetic waves are time variant, hence it produces output voltage across the terminals of the antenna. The electrical equivalent model of the antenna is given in Figure 8 [23]. In this model is resonance (tuning) capacitor, is loss resistance of the loop antenna, is radiation resistance, is inductance of the loop, and is inductance of the loop conductor (wire).
The output voltage of the sensor is given by:
Here denotes the area of the loop, is the phase constant, is the angle between z-axis (the loop’s axis) and the Poynting vector of the incident wave, is the angle between the vector and the plane of incidence, whereas, and are the incident electric and magnetic field strengths. is maximum for and .
4. PD Test Setup
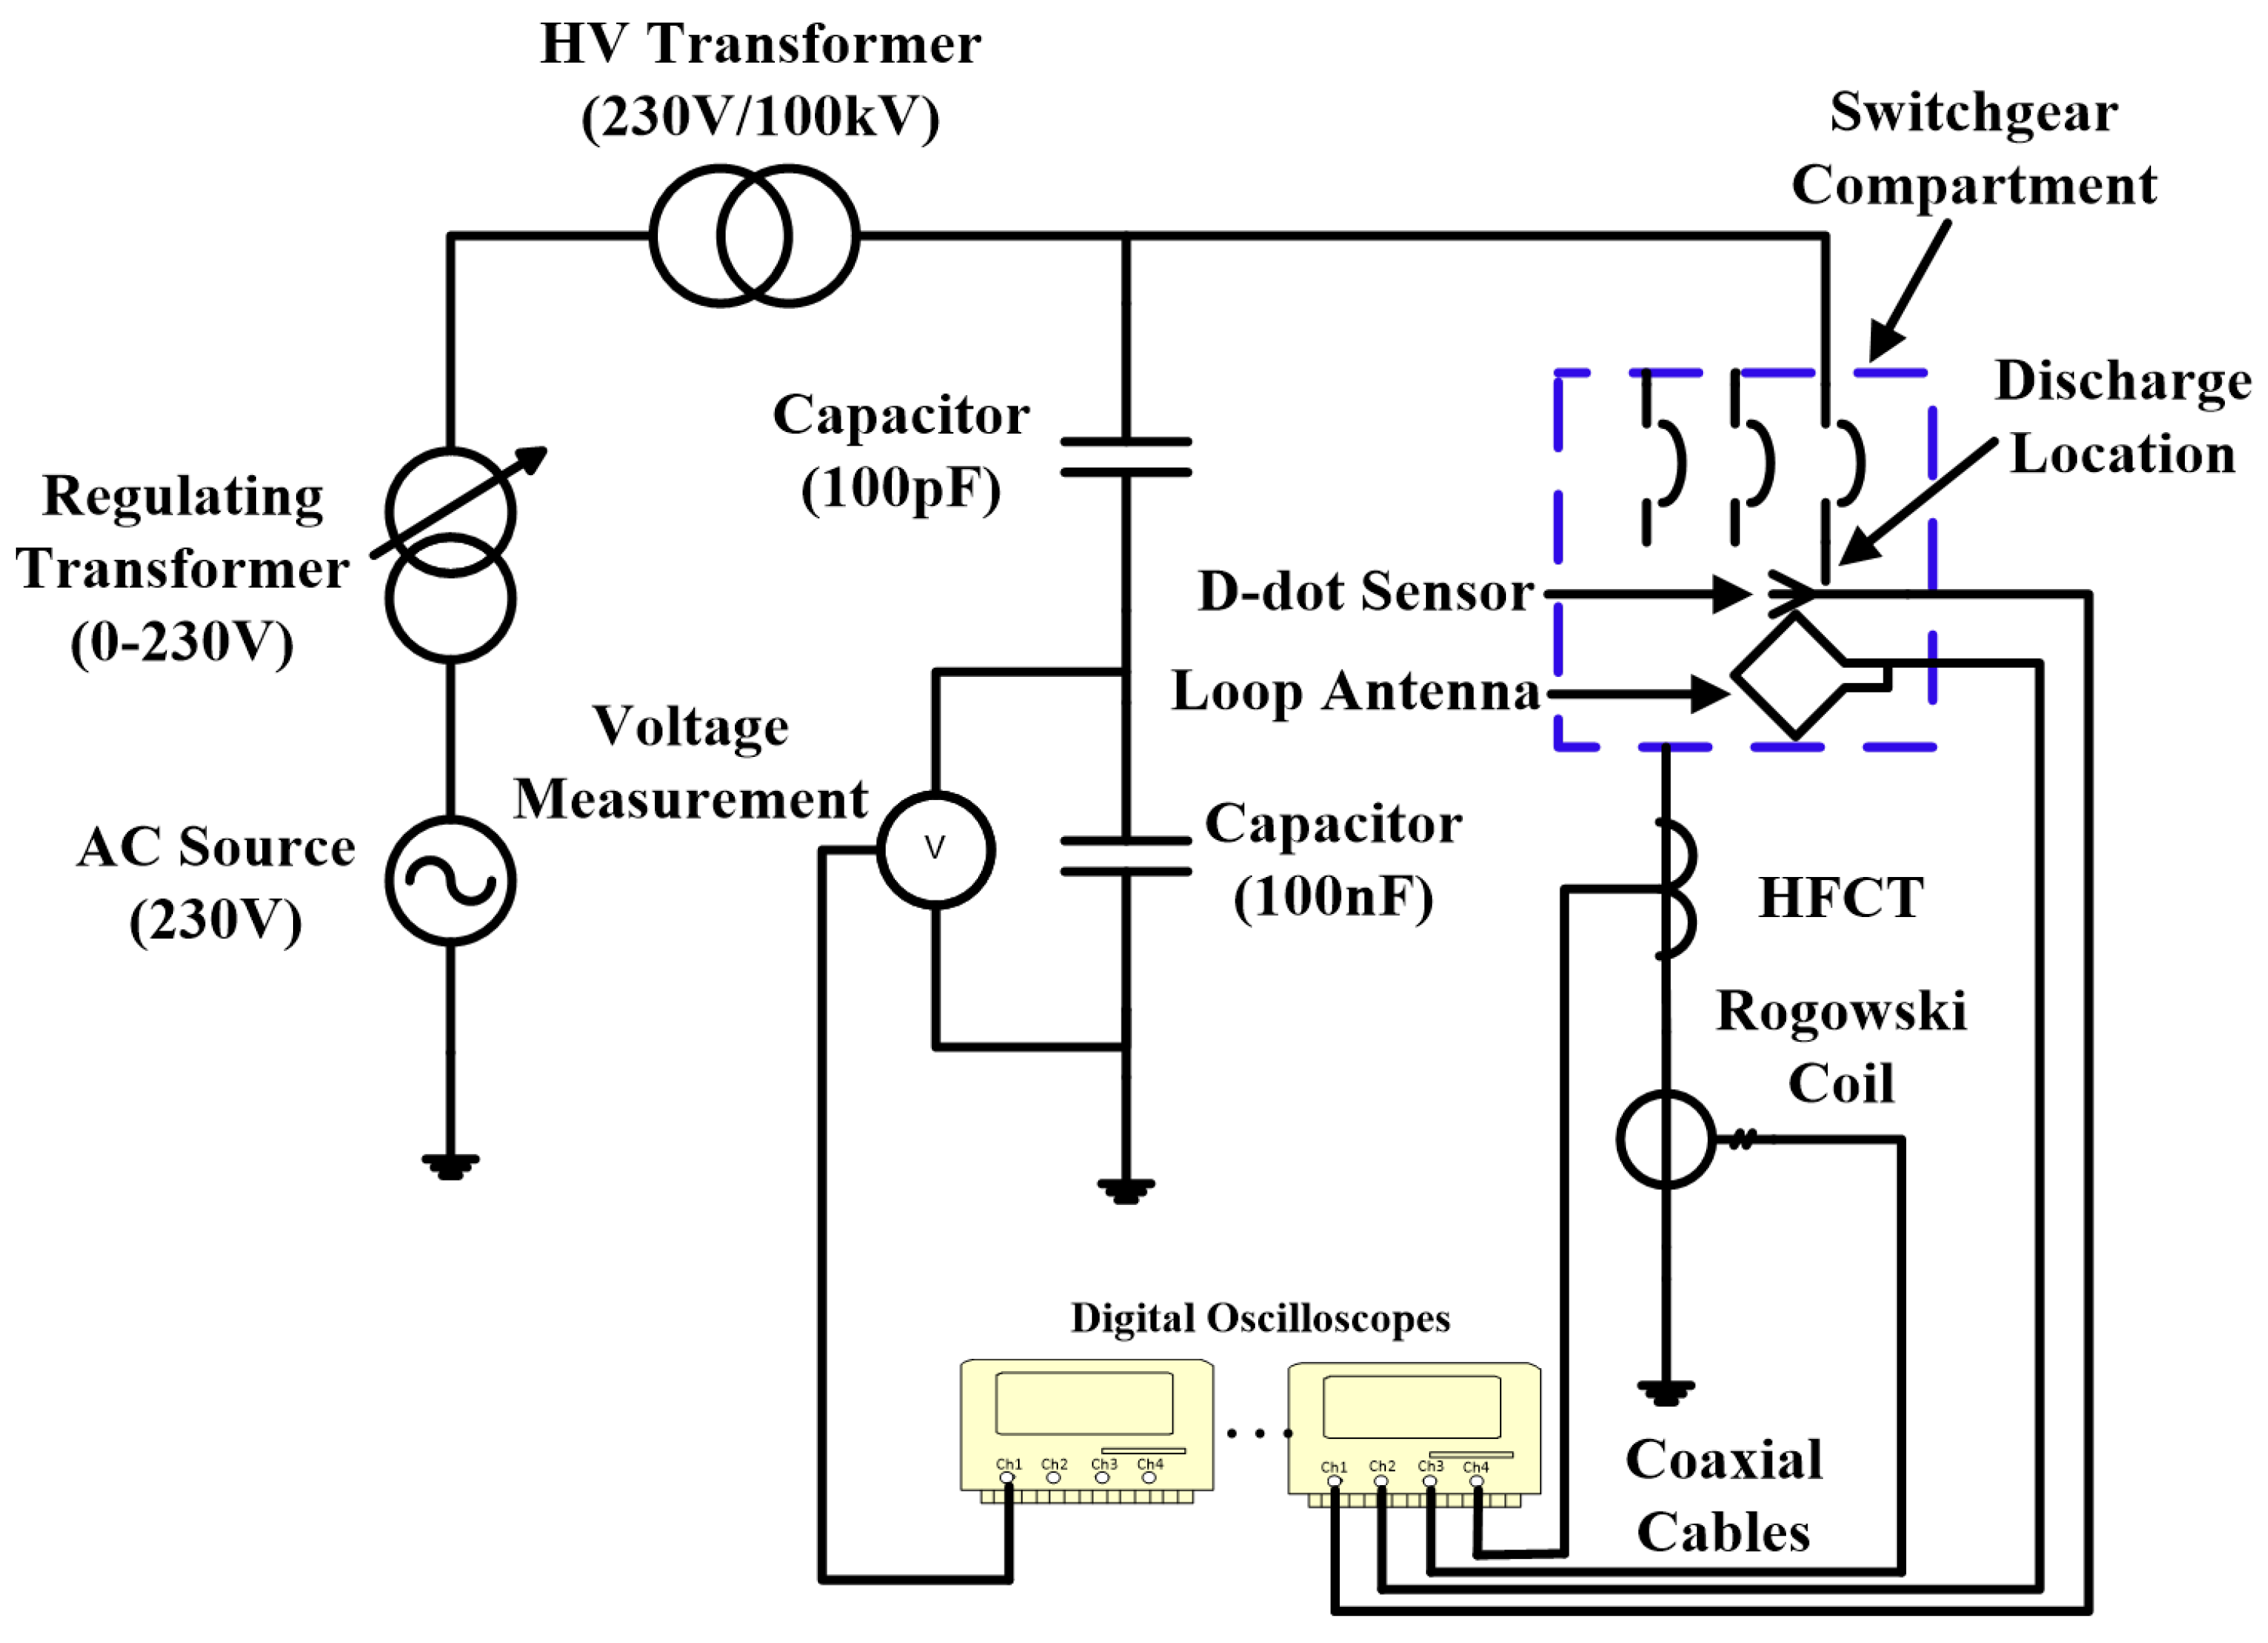
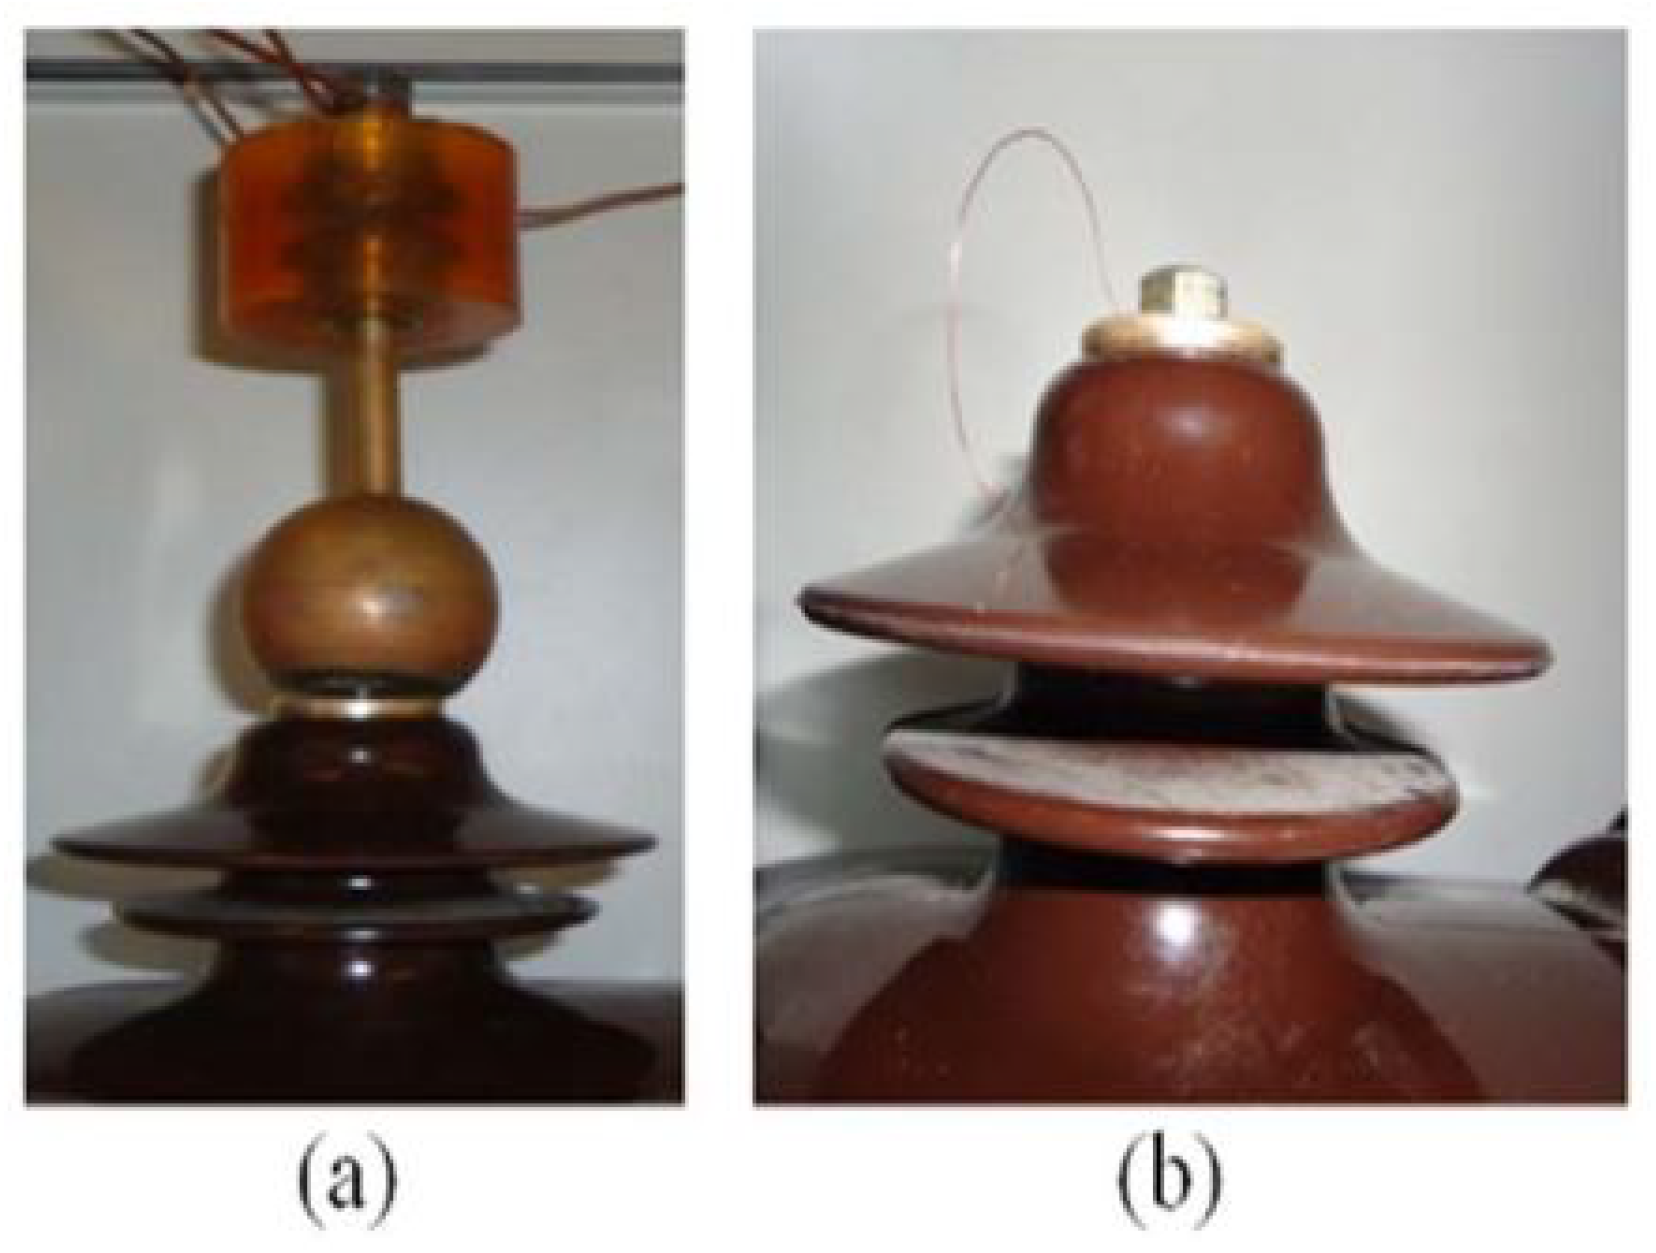
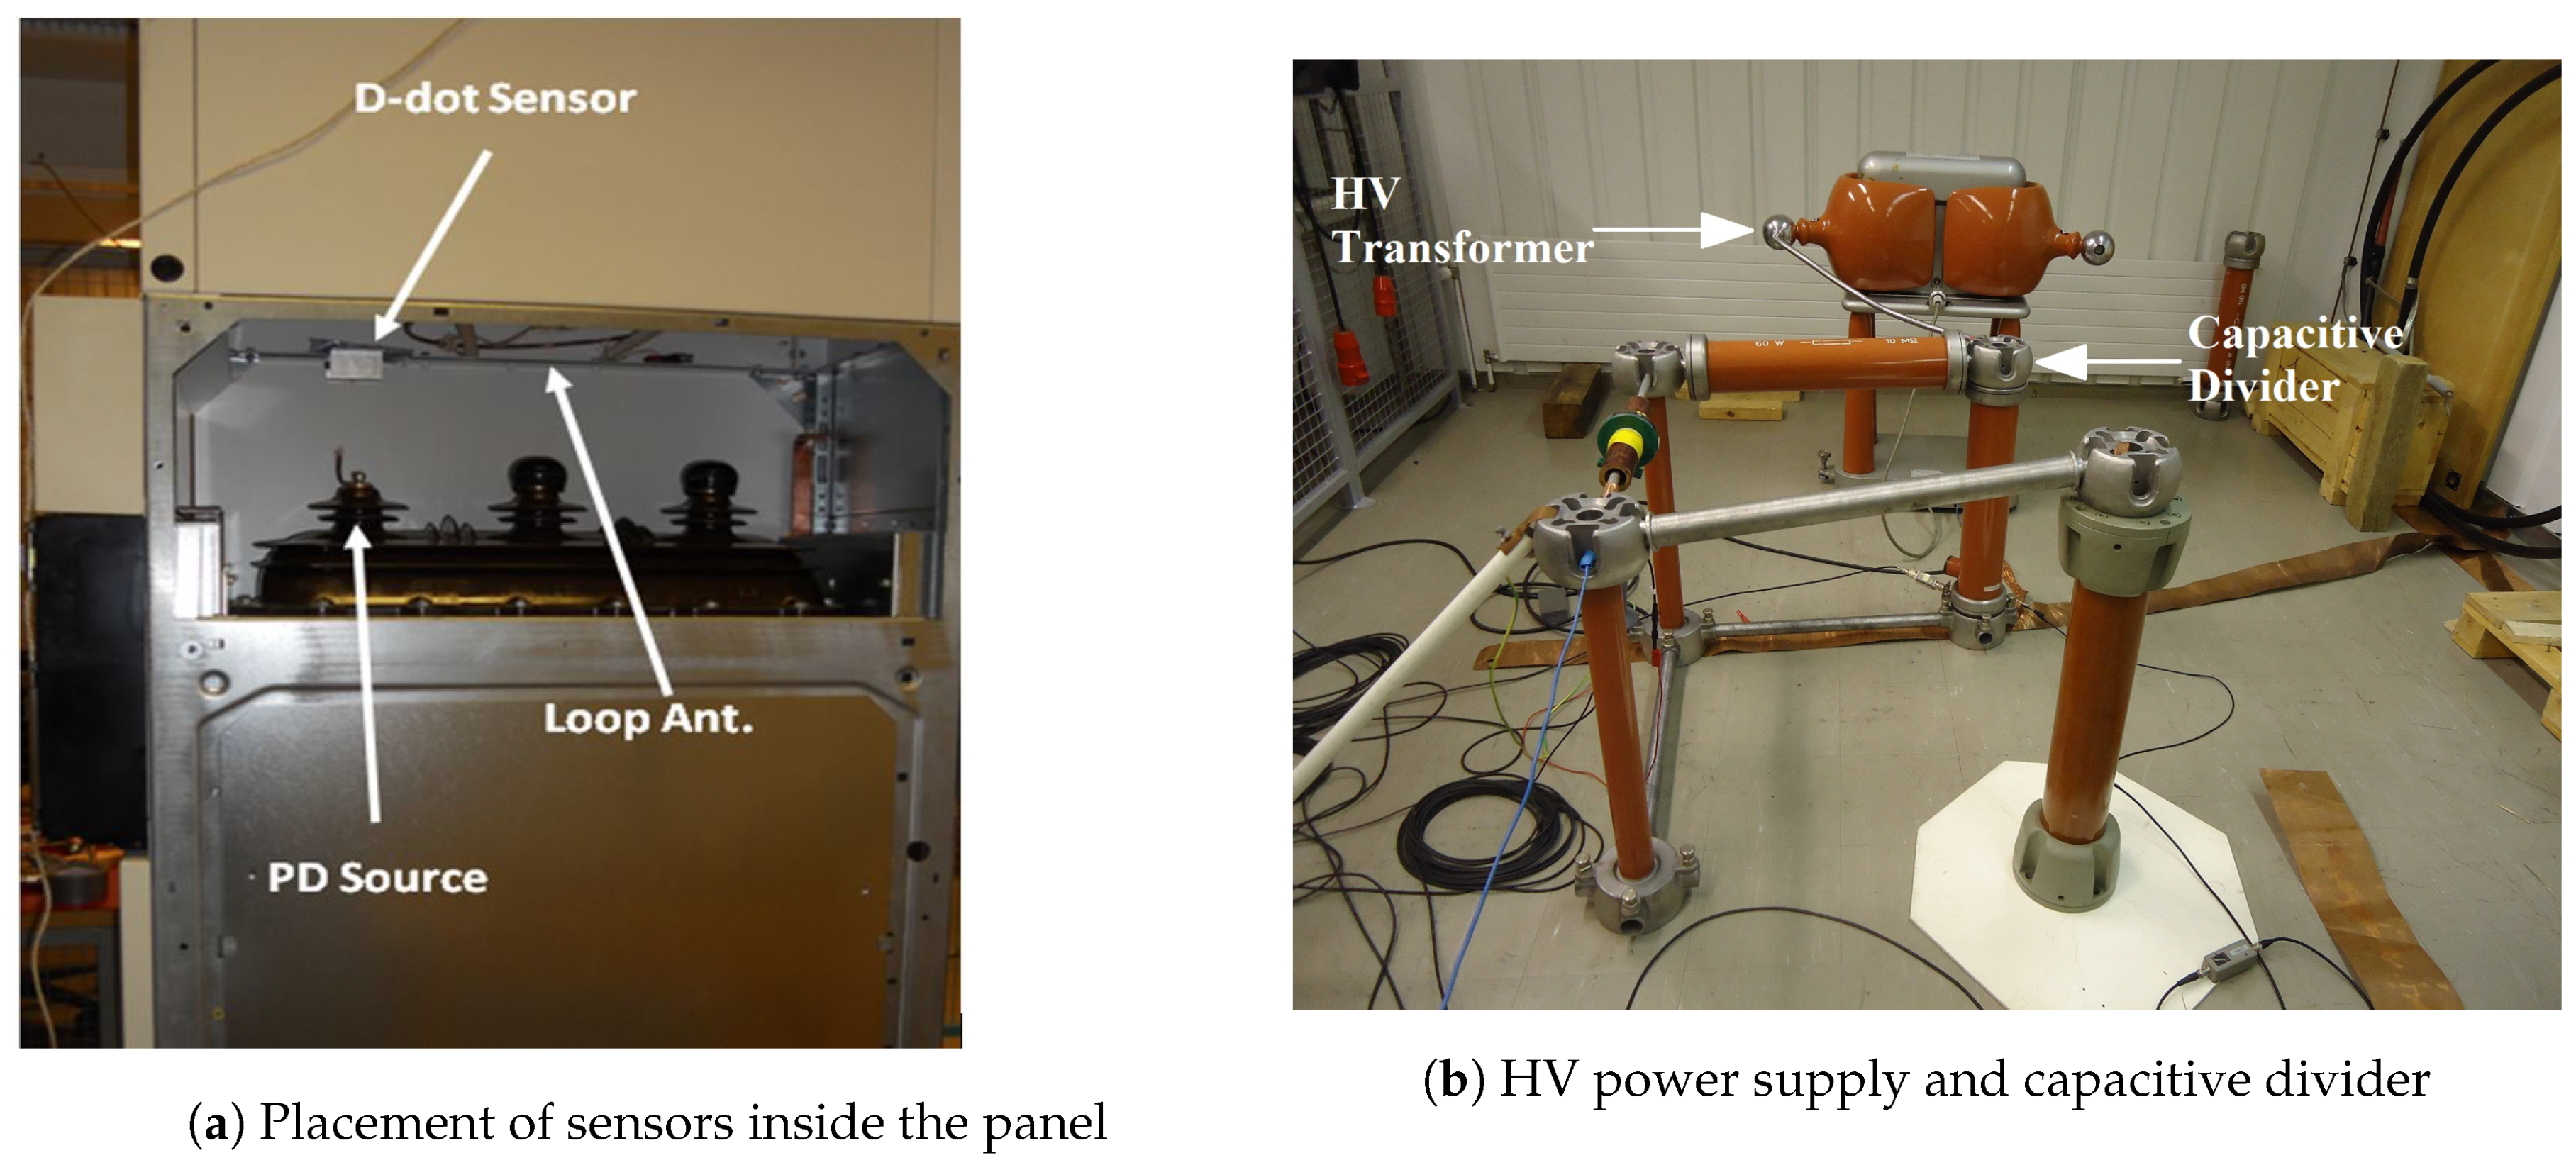
PD tests were carried out in a commercial switchgear panel in the HV laboratory of Aalto University, Finland. The circuit diagram of the test setup used in the laboratory is shown in Figure 9. Due to the limitation of the available power supply, which was single phase, only one phase was used to energize a switchgear. The outgoing side of one phase was open circuited and two PD faults were created at its open end and the circuit breaker was closed. The other two phases were grounded for safety reasons. An epoxy insulator having air voids (or air bubbles) in it was used to test internal PDs and bare thin conductors were used to create surface discharge and corona activities. The PD sources used in the tests are shown in Figure 10. The switchgear was placed on a wooden base and was grounded through a single point. In order to energize the PD source a low voltage (LV) regulating transformer and a 0.230/100 kV HV transformer were used. The D-dot sensor and loop antenna were installed inside the switchgear compartment at distances of 13 and 16 cm from the discharge location respectively, as shown in Figure 11a and the HFCT and Rogowski coil were installed around the earthing connection of switchgear, as per depicted in Figure 9. Figure 11b shows the HV transformer to step up the voltage and the capacitive divider for voltage measurement. The sensors provide the discharge pulses measurements at various voltage levels.
Two oscilloscopes were used for sampling and digitization of the signals captured by the sensors at a sampling rate of 2 GS/s. The high sampling rate ensures the accuracy of the PD measurements. The applied voltage was increased gradually until the PD events were detected on the oscilloscope. PD current pulses are superimposed on the power frequency current, whereas PD activity also causes airborne electromagnetic radiations in the switchgear compartment. The electromagnetic signals passing through air are far weaker than the PD current pulses passing through the electrical cable. Hence, it is expected that the signals measured by the D-dot sensor and the loop antenna are weaker than the signals measured by the HFCT and Rogowski coil.
5. Results and Discussion
5.1. Time Domain Comparison of PD Signals
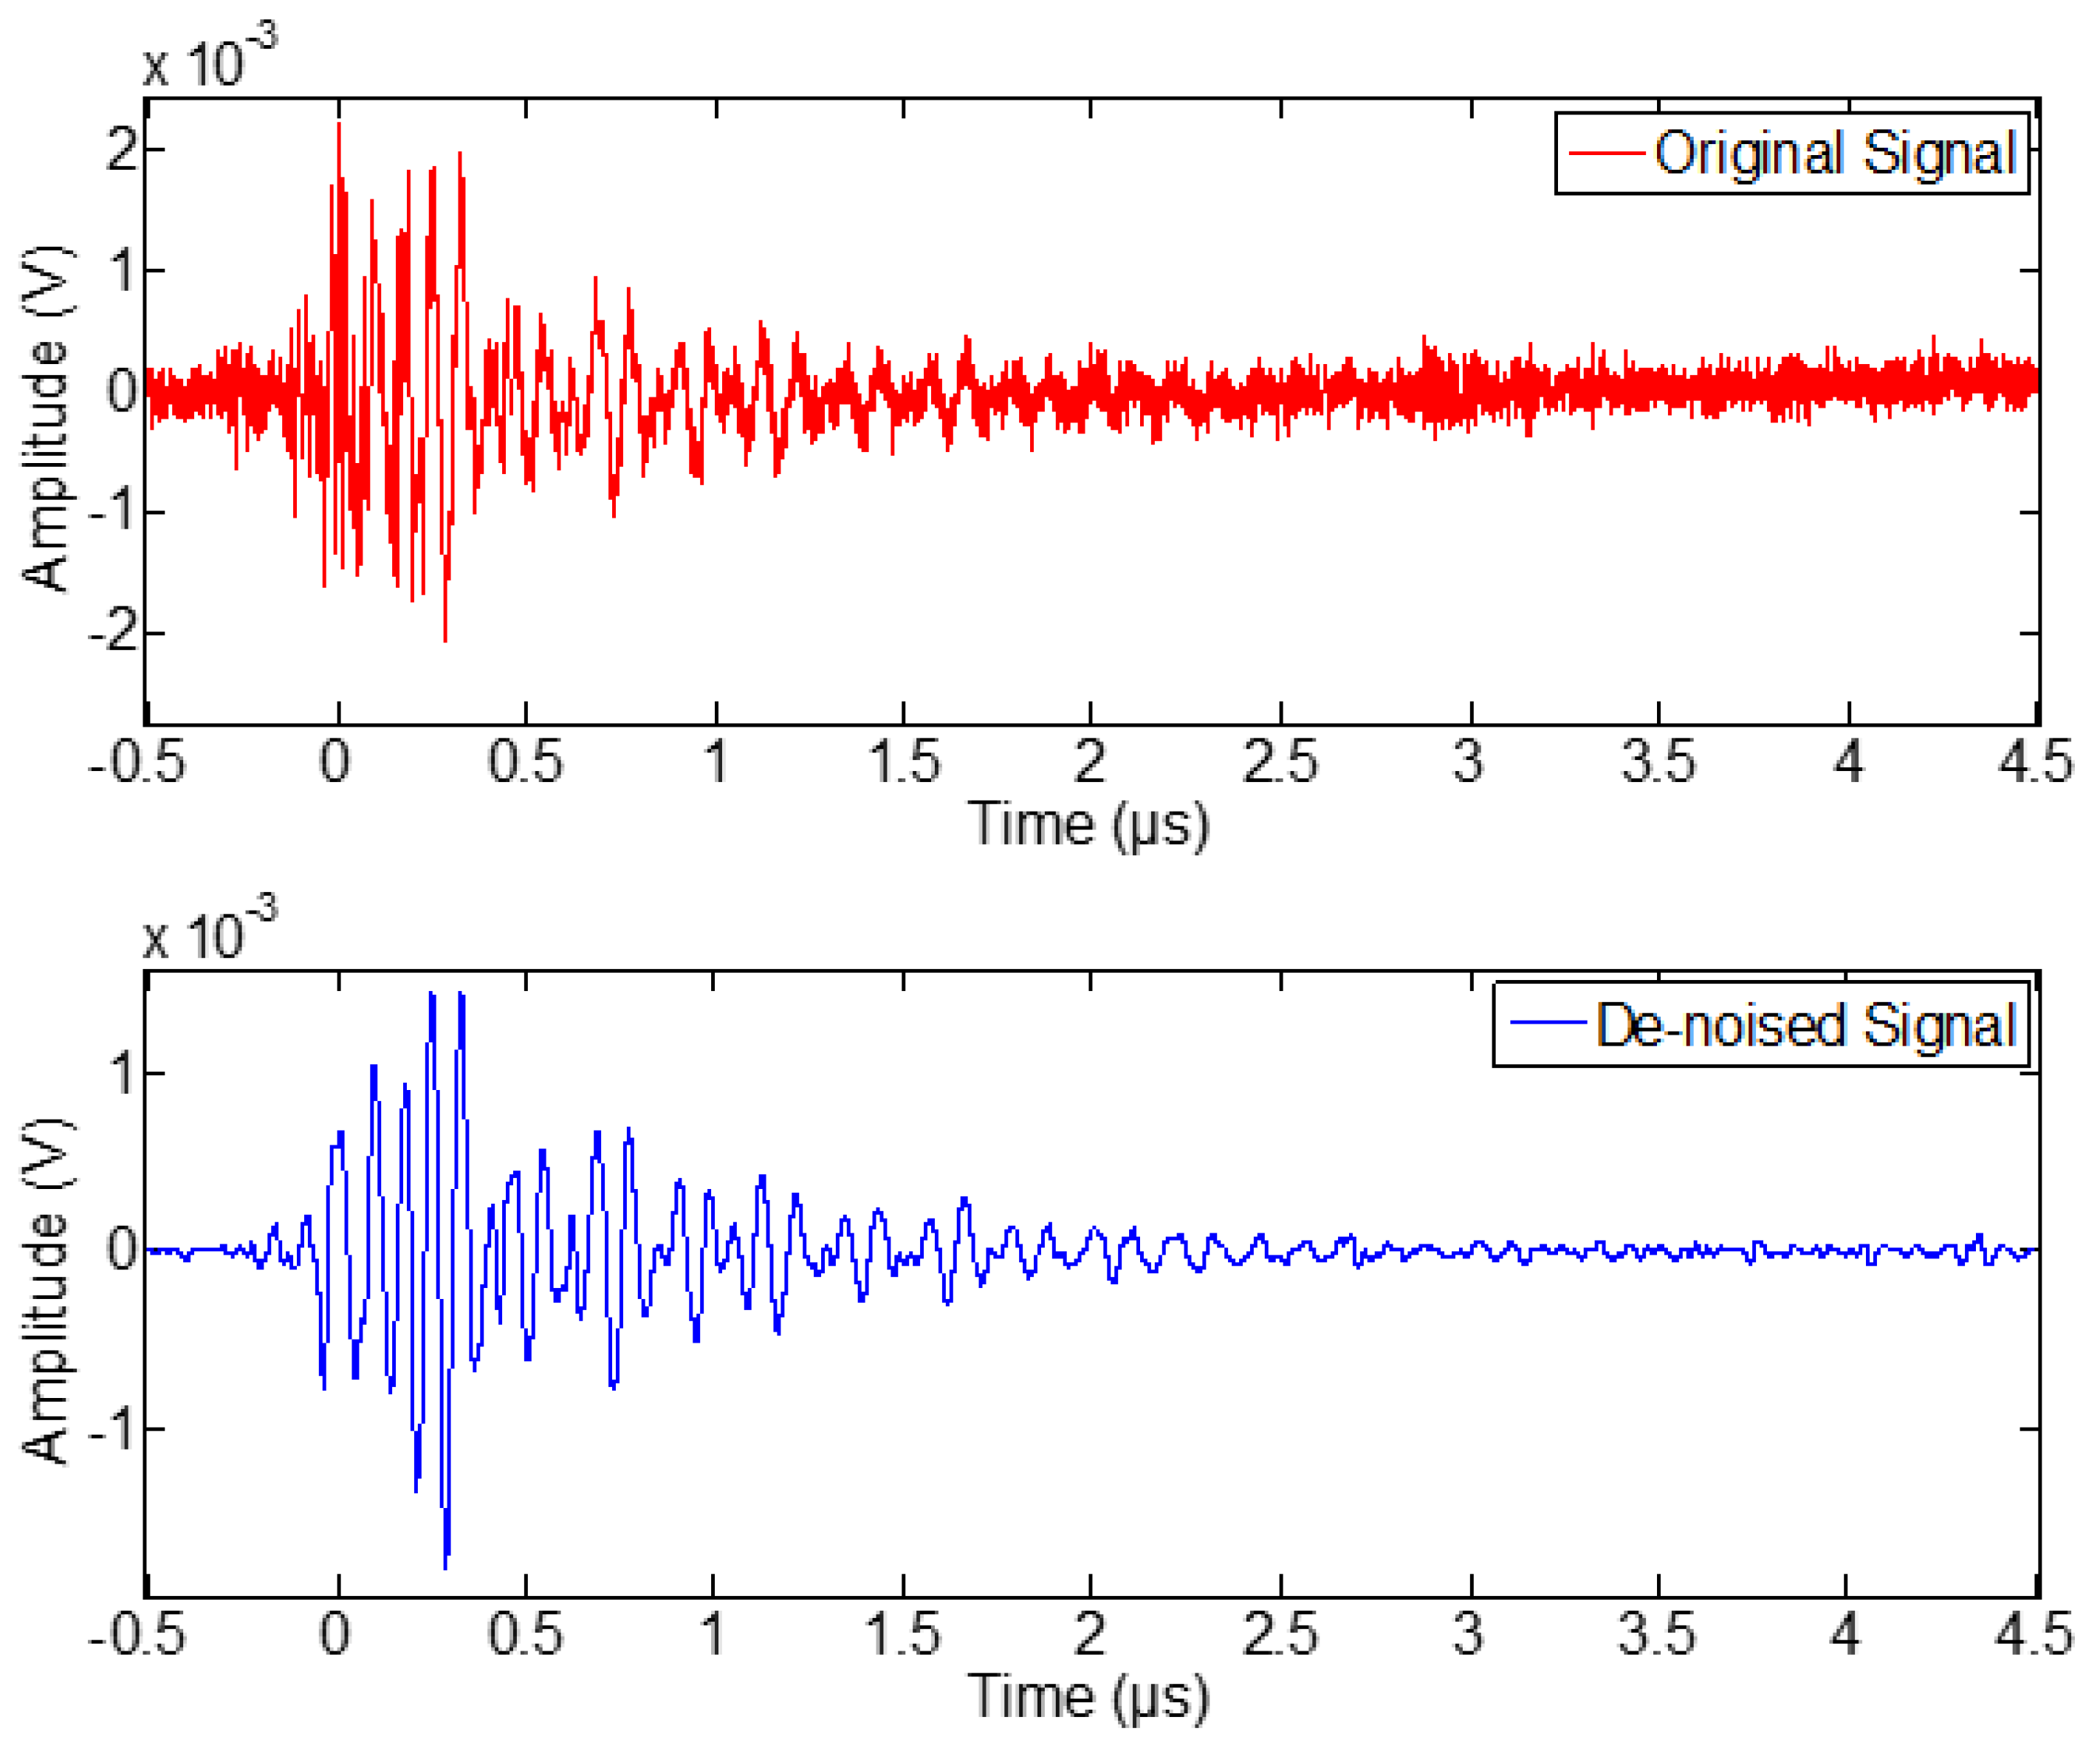
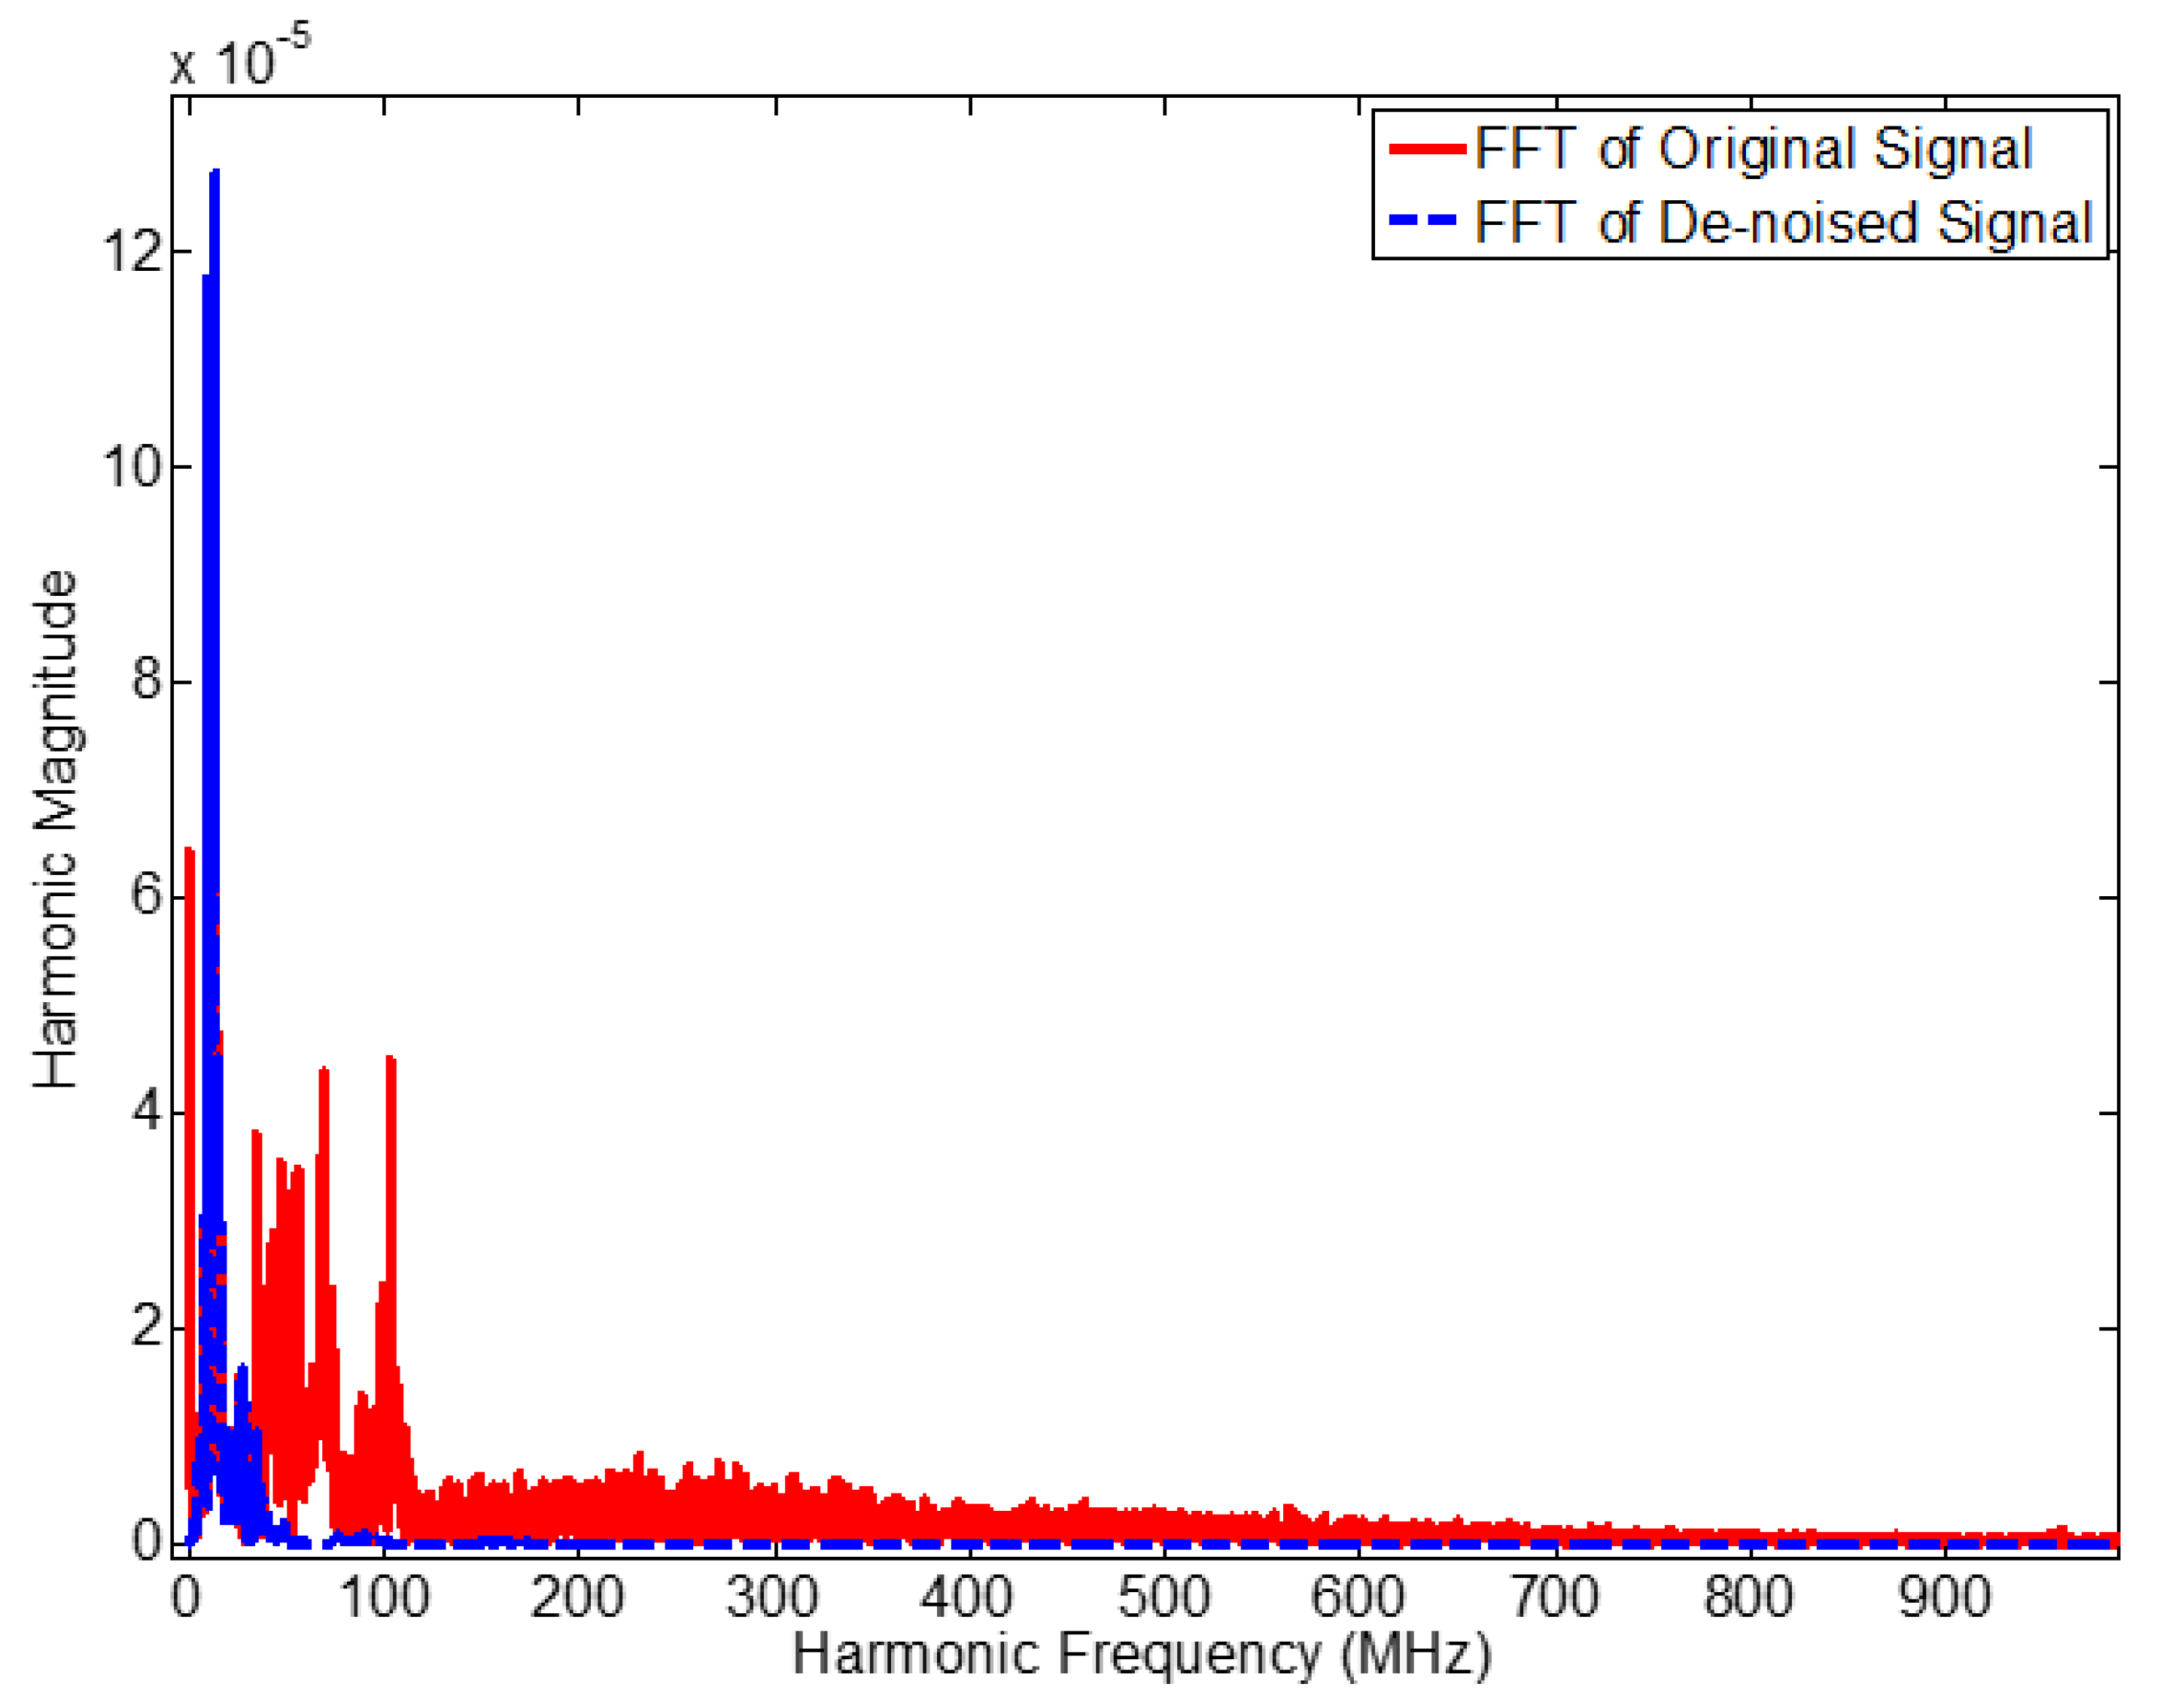
The signal captured by the various sensors contain a significant external noise and hence the analysis of the raw signals may lead to erroneous PD detection. Therefore, it is proposed to first de-noise the captured signal before further analysis. Among many other de-noising techniques the discrete wavelet transform (DWT) is proposed to be the best technique for PD signal de-noising [24,25,26]. Therefore, the captured PD signals in this research are de-noised using DWT. Figure 12 demonstrates the effectiveness of the de-noising technique by comparing the original and de-noised signals in time domain. The original signal shows that there is an enormous amount of high frequency noise present in the captured signal due to a wide bandwidth of the sensor. The de-noised signal show the effectiveness of the de-noising technique as it is free from the high frequency noise. The FFT analysis of the same signal given in Figure 13 also proves the effectiveness of the de-noising. Therefore, it is clear that the de-noising should be performed before analyzing the signals and determining fault characteristics for correct interpretation.
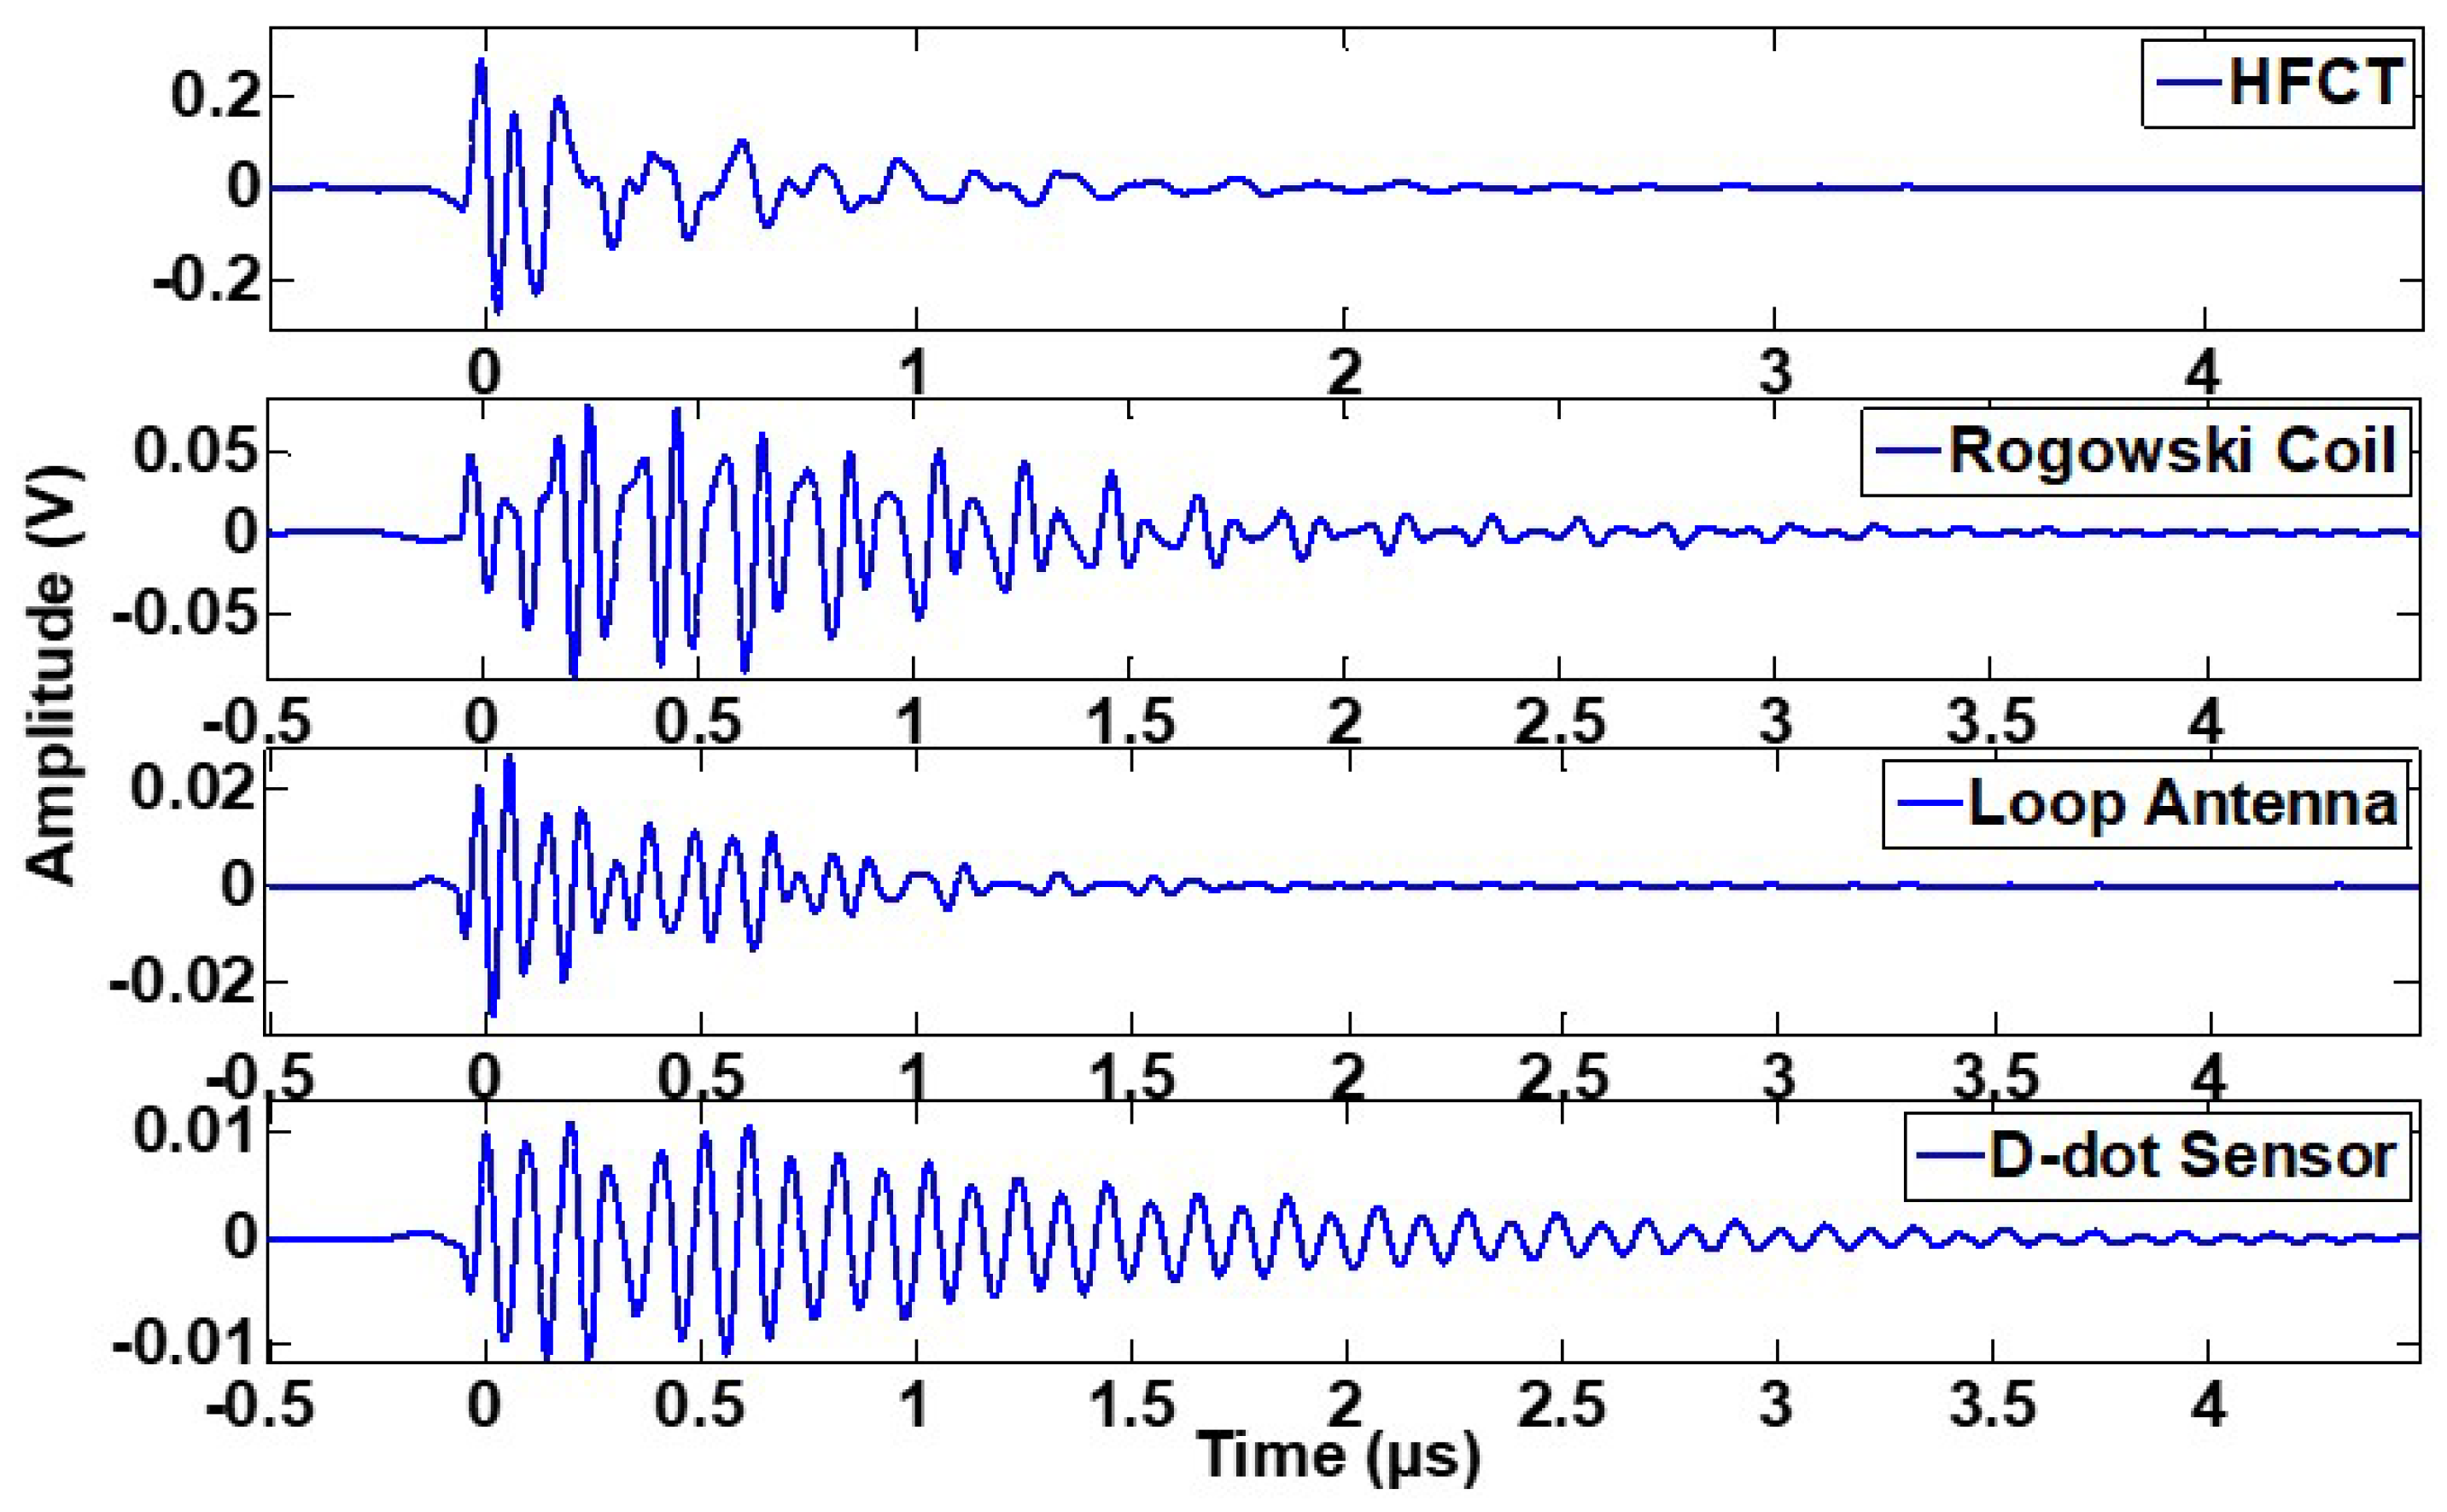
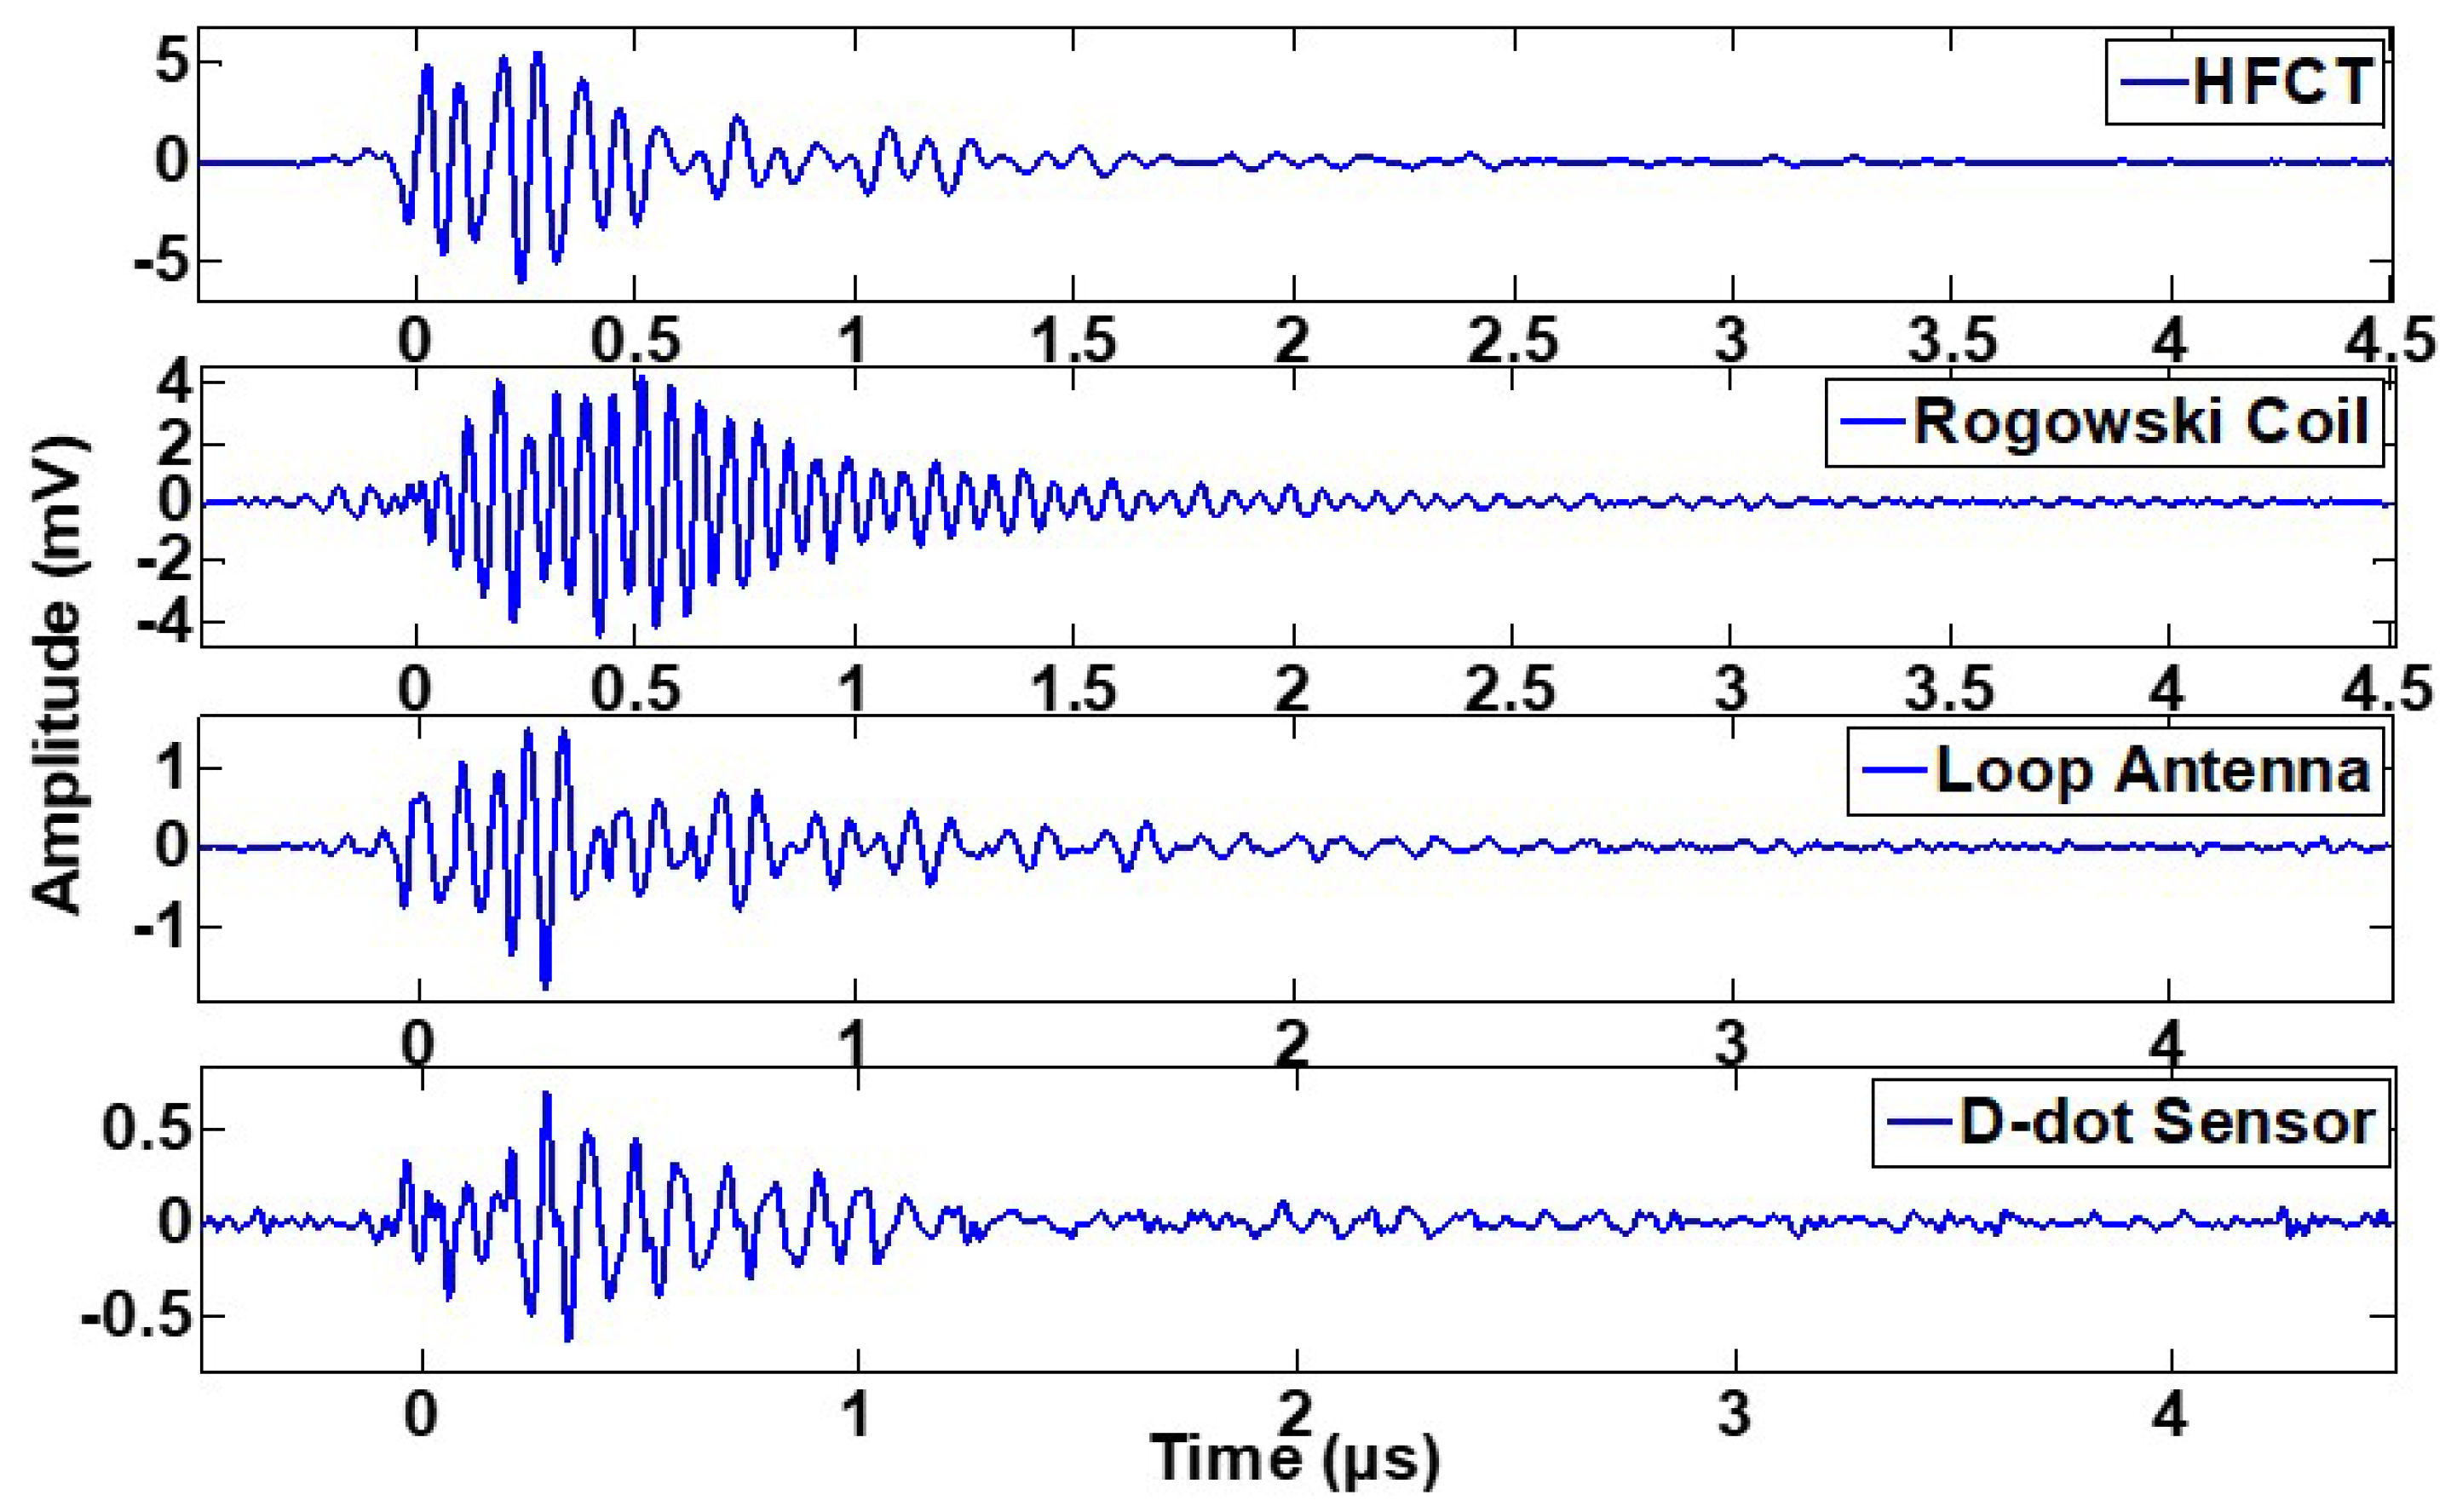
Figure 14 and Figure 15 compare the signals captured by the four sensors simultaneously. The oscilloscope was triggered at the instant shown at t = 0, and the time recorded by the oscilloscope before this instant is negative. The signals captured by the HFCT and the Rogowski coil have higher amplitude due to the installation on the earthing/grounding conductor. The change in current is taken from HFCT probe and Rogowski coil because of the discharge, whereas the measurement of the changing magnetic field and electric field is taken from the loop antenna and D-dot probe respectively. These behaviours of the sensors were anticipated due to their detection principles. The signals detected by the loop antenna and the D-dot sensors are airborne signals and are weaker than the signals travelling through the conductors which were detected by the HFCT and the Rogowski coil.
It was expected that all the three sensors would exhibit different sensitivity due to their different working principles and characteristics in terms of their bandwidth and frequency responses. In spite of all the differences, it can be clearly seen in Figure 14 and Figure 15 that all these sensors responded to a PD activity at the same instant with a negligible time delay among each other. Even though, these sensors differ in their sensitivity, yet they offered a reasonable signal to noise ratio and the de-noised signals can provide a meaningful information about a PD activity. Consequently the sensors can be considered as usable for PD detection in air insulated switchgear.
5.1.1. Frequency Domain Comparison of PD Signals
Table 2 shows the comparison among the signals captured by different sensors under different PD activities. The frequency spectra of the signals captured by different sensors are almost the same. It can be observed clearly that all the sensors are consistent with the behaviour of HFCT. Frequency spectra of the surface discharges are higher than the frequency spectra of the internal PDs. This is quite consistent with the theory as reported in [5,6,7], which explains why corona and surface discharges have higher frequency spectra. Therefore, it can be concluded that all the sensors performed as expected.
5.1.2. Cumulative Energy (pJ) and Peak-To-Peak Amplitude (mV) of PD Signals
The apparent charge and the rise time of a PD fault can not be determined from the signals captured by the radio frequency (RF) electromagnetic sensors directly. However, by using additional terminating resistances across the output terminals of a Rogowski coil, a damped current pulse of a PD signal can be reconstructed, which can lead to the estimation of PD intensity [27]. This requires a thorough knowledge of the sensor parameters and its calibration. The idea about the intensity of discharge can also be taken from the peak voltage and peak-to-peak voltage of the signal, but the exact relationship between the apparent charge and these values is still multifaceted. The cumulative energy of the radio frequency signal can also provide useful information about the extent of discharge [28] in a similar way as the apparent charge. The derivation of the relationship for cumulative energy follows as below. The signal’s power and energy can be calculated across the input resistance of the digitizer/oscilloscope by using the following equation:
where the sample duration is t, the input resistance of oscilloscope is R and the sample voltage is . The energy of one sample is given by Equation (7). The cumulative energy of the whole signal captured by a sensor can be obtained by summing all the samples’ energies, as in Equation (8), where the total number of samples is N.
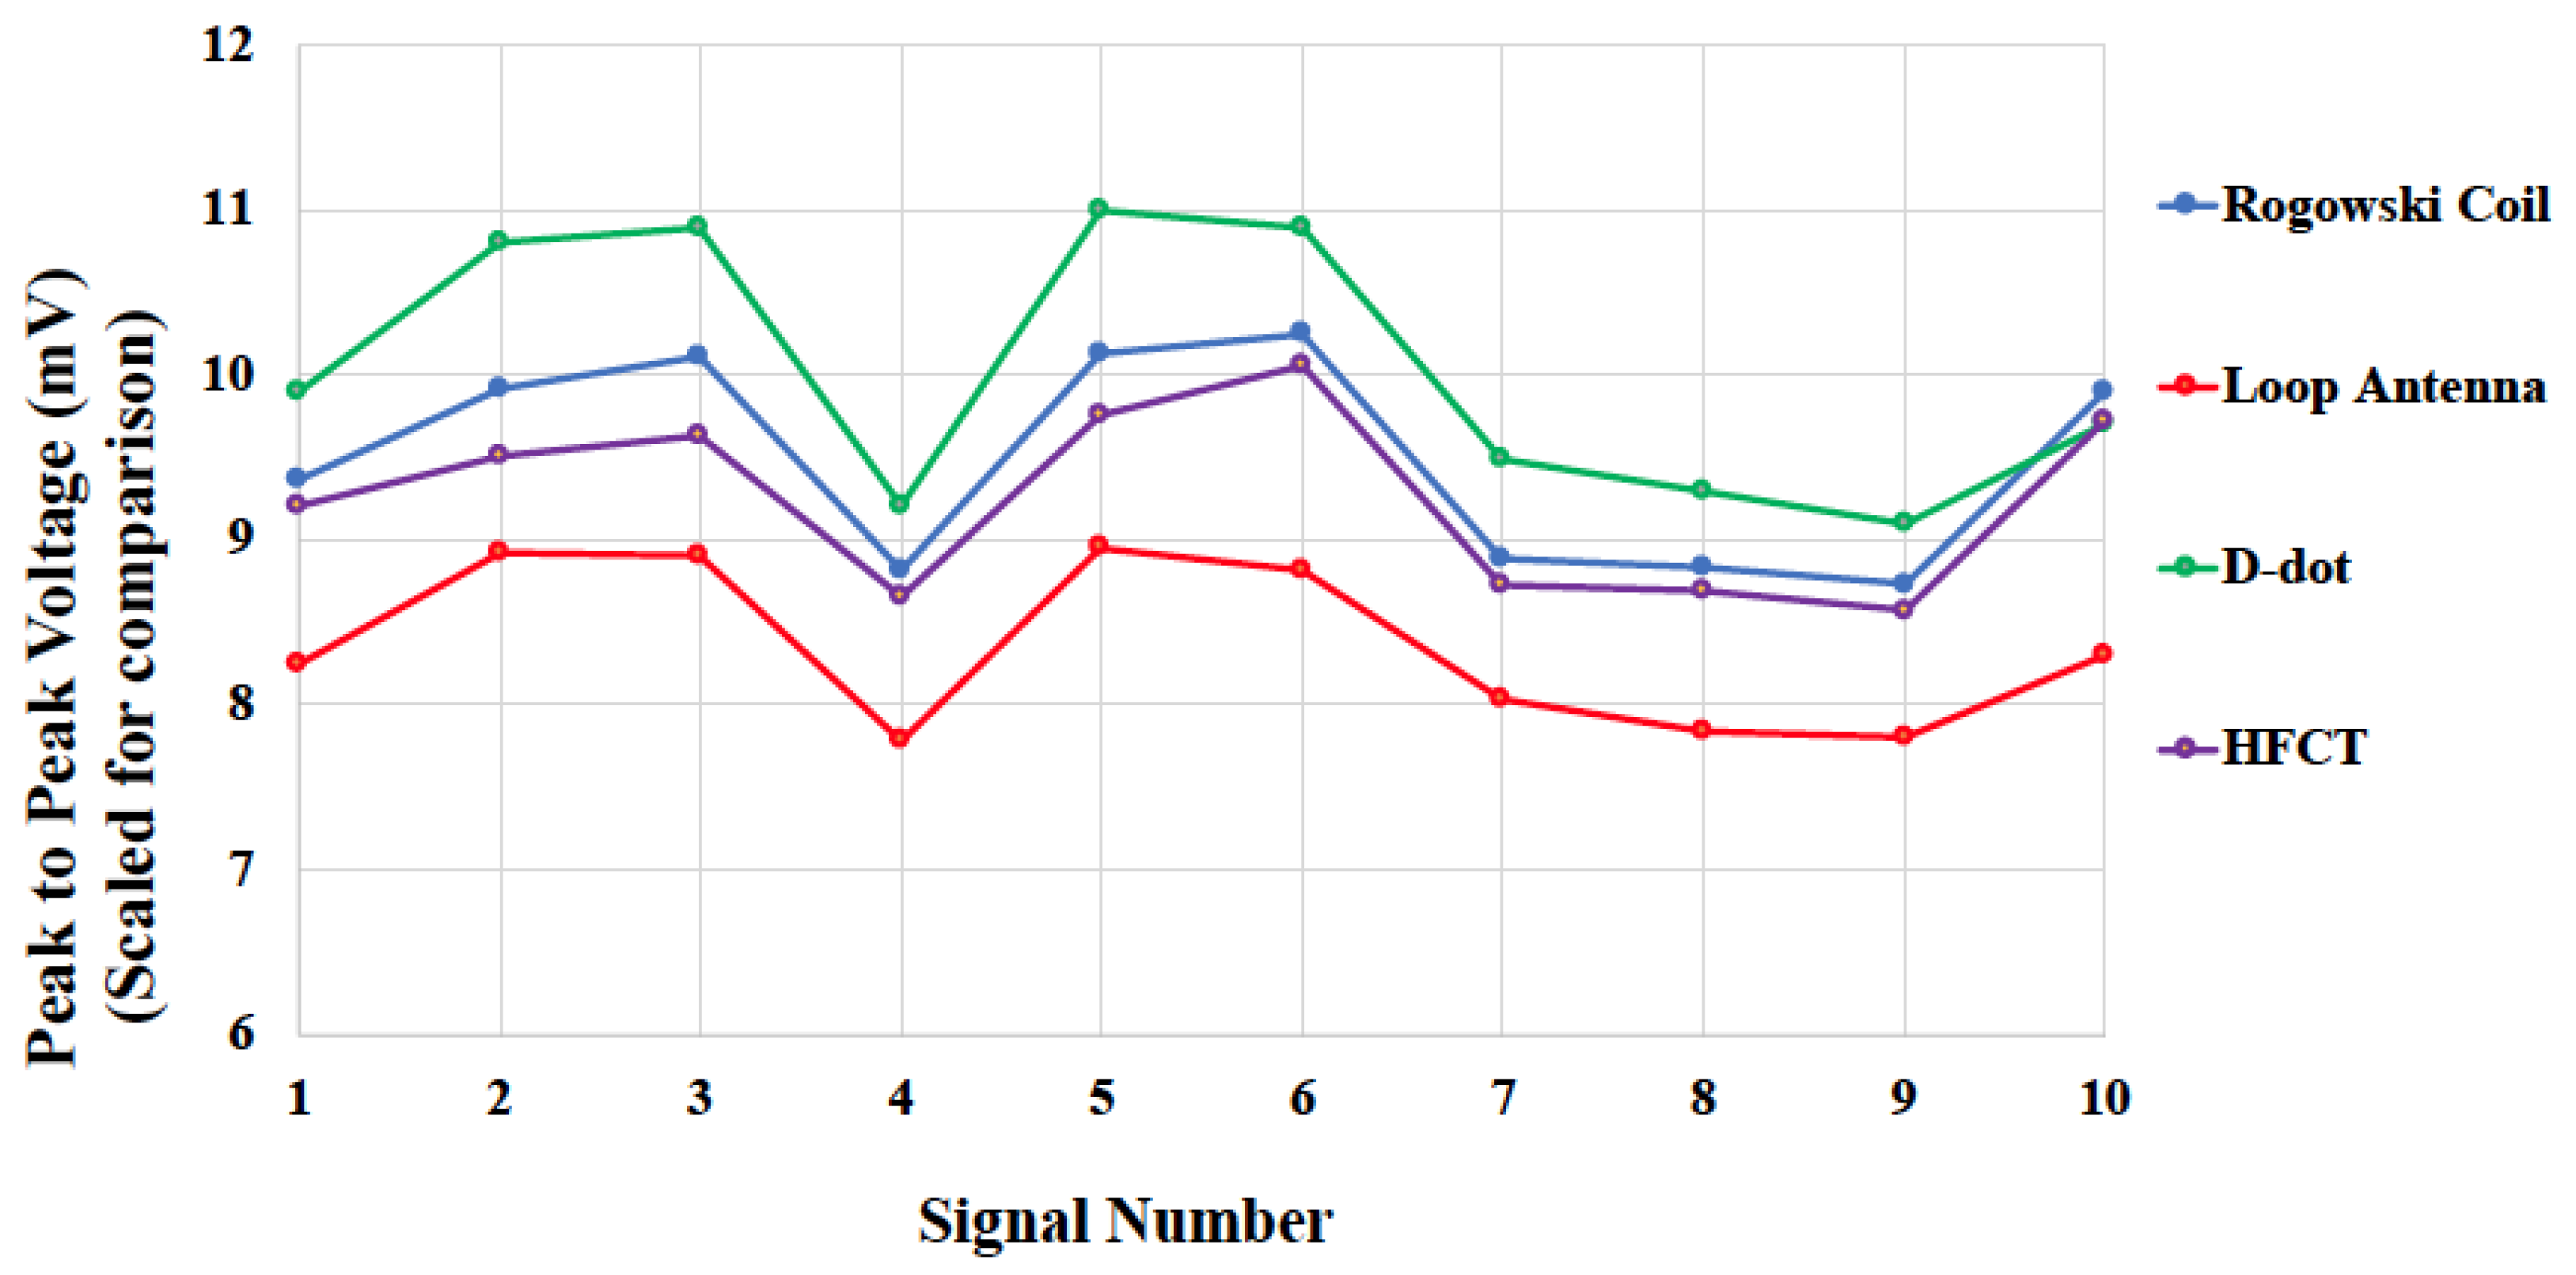
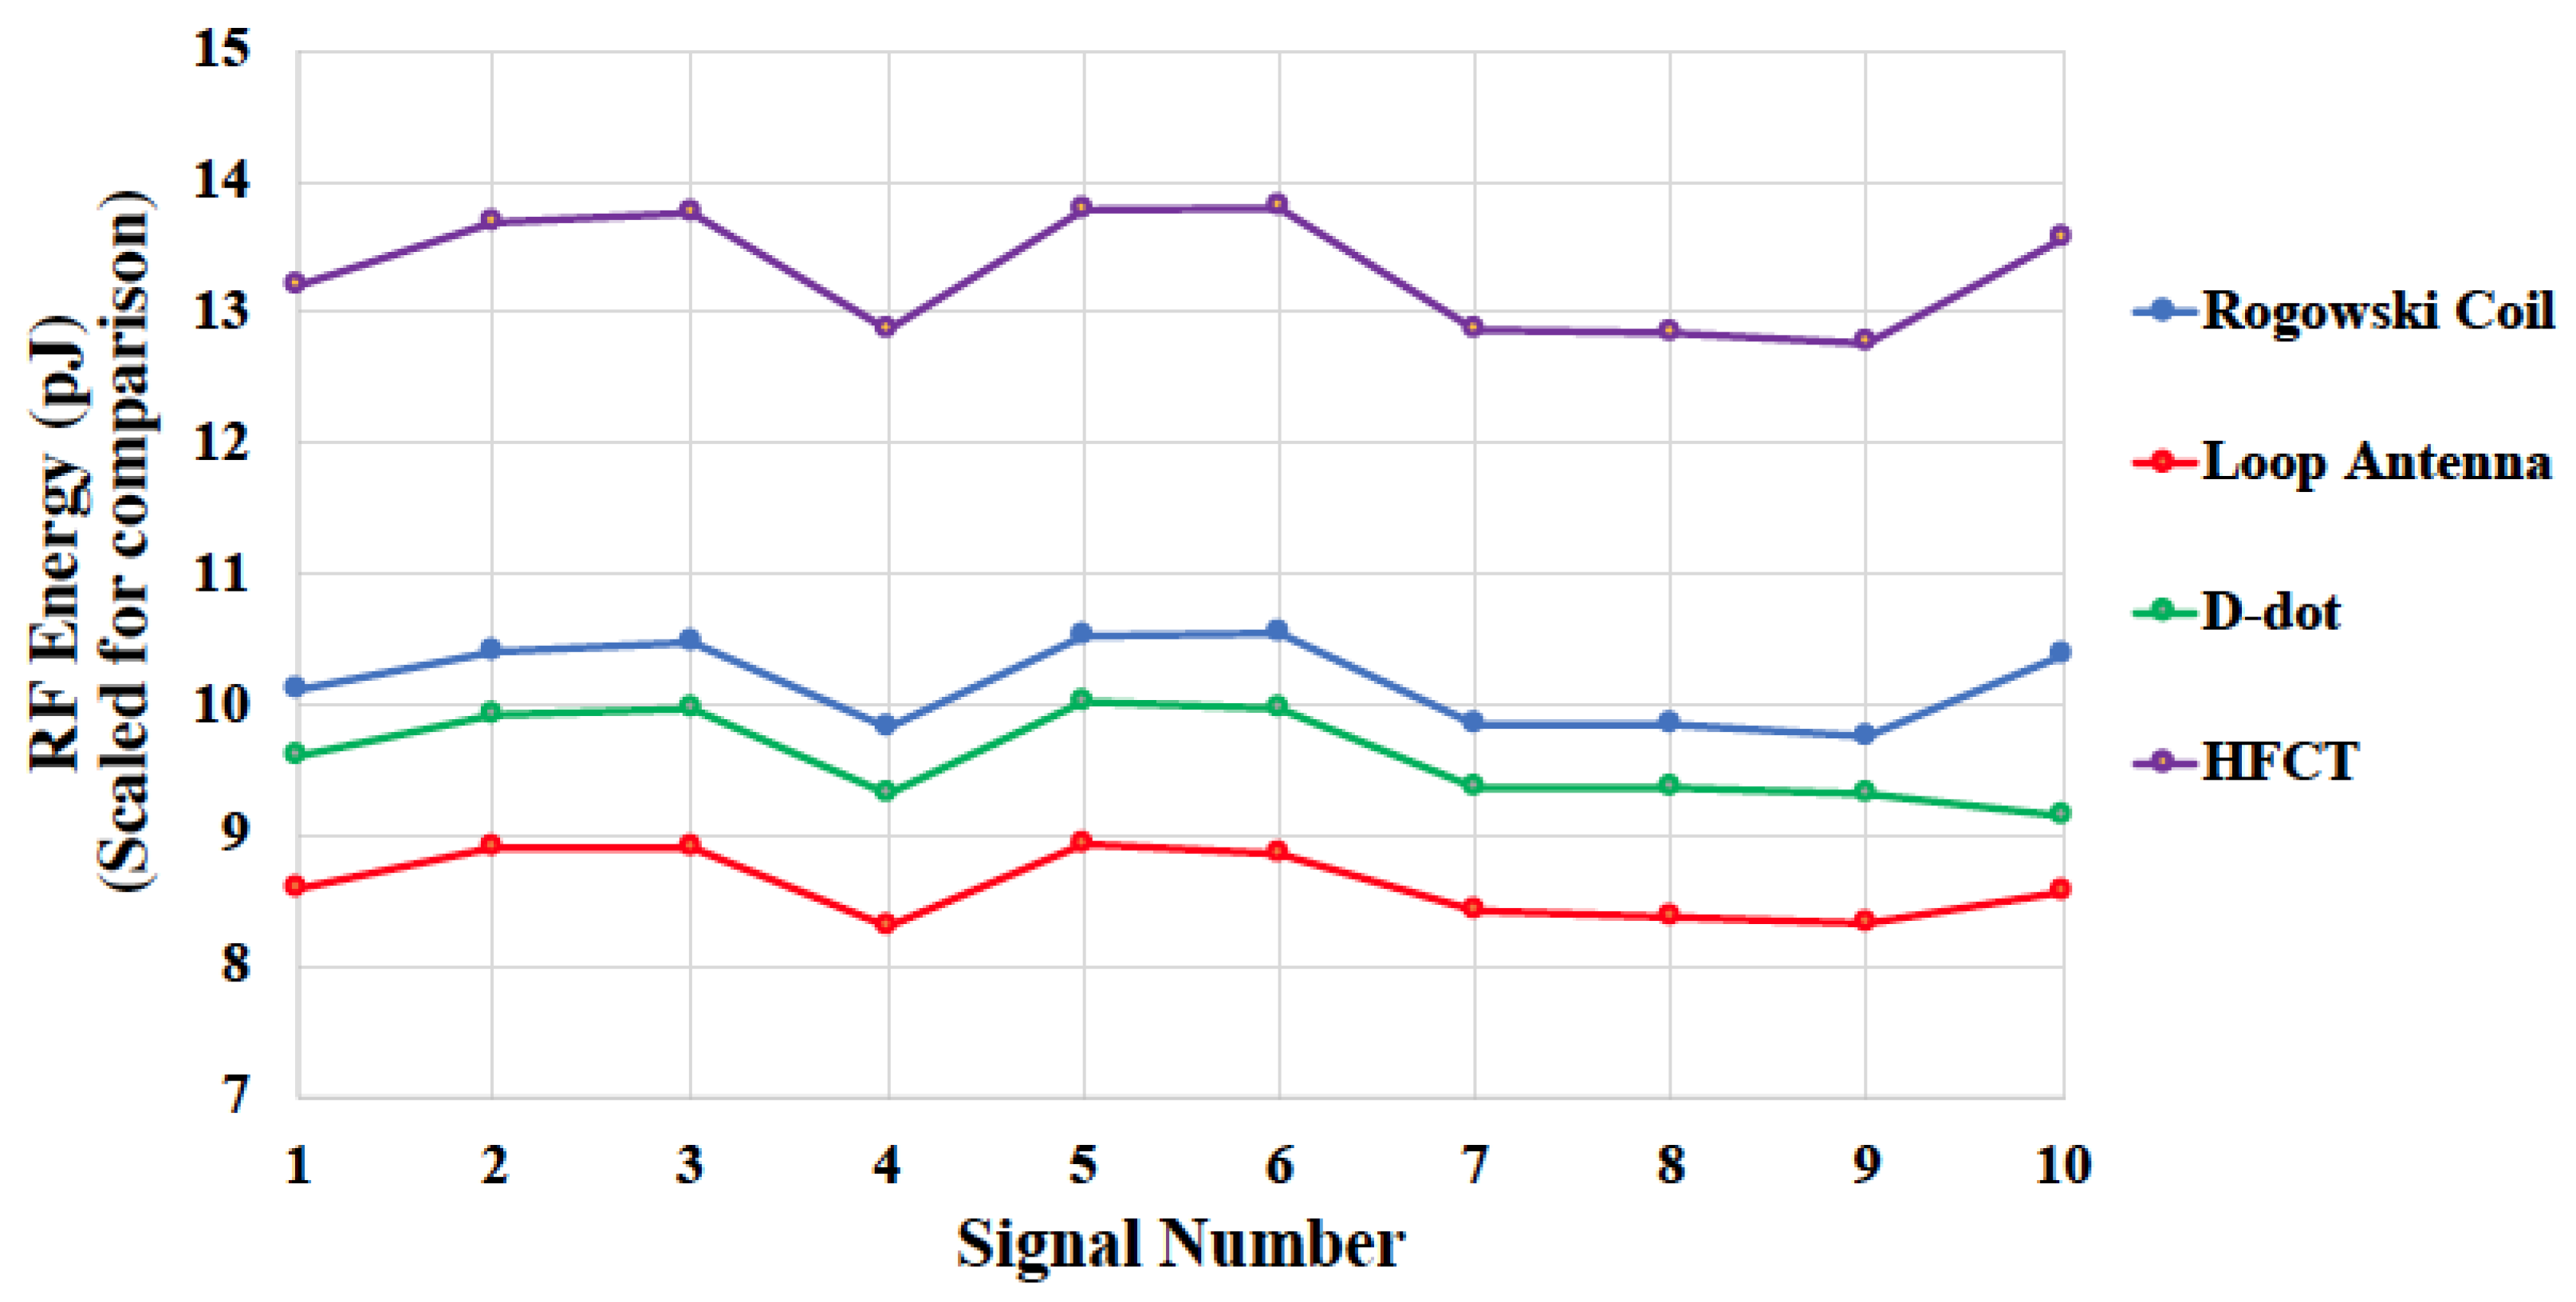
The values of the peak to peak and cumulative energies of all the signals captured by the sensors have been calculated, so that their characteristics can be compared. Figure 16 and Figure 17 show the comparison between the peak to peak voltages and cumulative energies of the signals captured by the four sensors. Only ten random signals were taken for this comparison from the captured signals. The calculated peak to peak voltages and the cumulative energies are scaled with a multiplication factor in order to show a clear comparison. It can be seen in these Figures that, even though the peak to peak values and cumulative energies of various signals are different, they are still following the same trend and hence the ratios between them is maintained constant. Thus, it verifies that the signals captured by the three sensors represent the same PD activity as detected by the HFCT. Consequently, it is suggested that the implementation of these sensors for PD fault detection can lead to satisfactory results and thus these sensors can be adopted for on-line condition monitoring of air insulated switchgear.
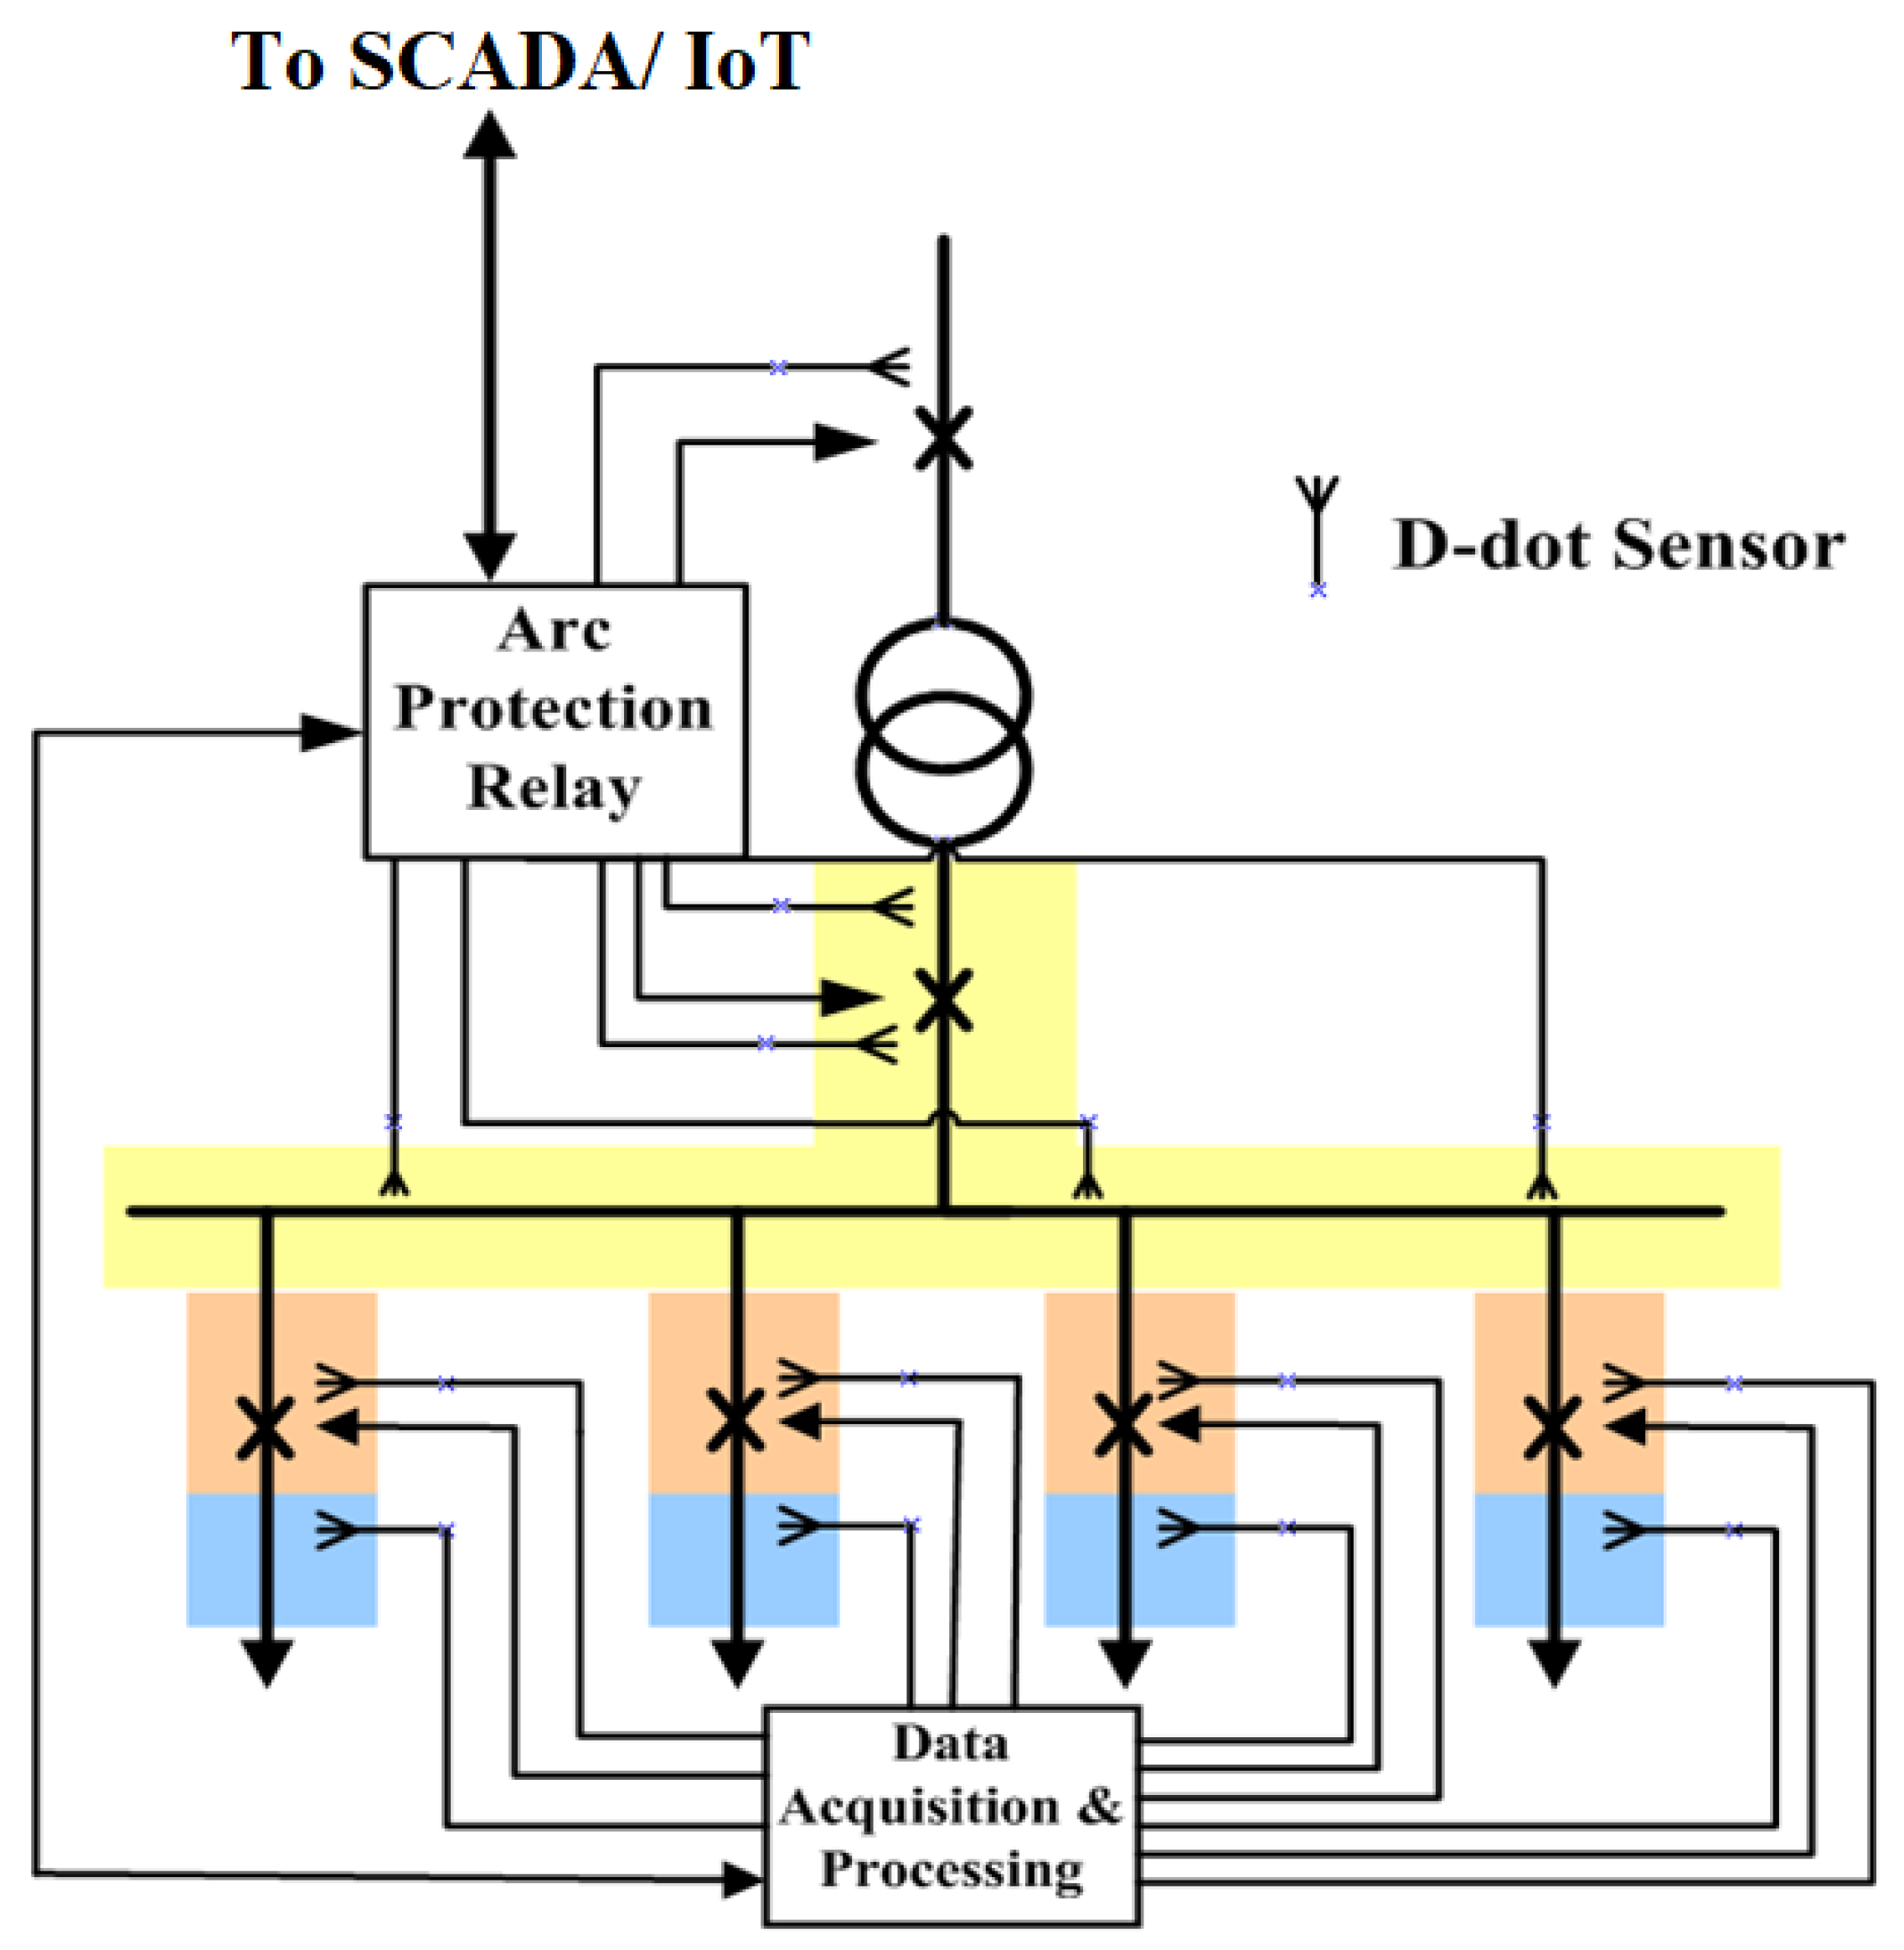
6. Connecting PD Sensors with SCADA or Protection Relays
The main objective of on-line monitoring of switchgear is to avoid complete breakdown of insulation leading to high energy faults such as an arc-flash. An on-line monitoring system can be designed such that it continuously monitors the switchgear and keep updating about the health of the equipment to an upper level systems, such as PLC or SCADA system. On the grounds of the above presented signal processing capacity, it looks more feasible to have a detached processing unit which collects data from these sensors, pre-process them and transfers only a useful information with much less data amount to the upper level. Such a system is outlined in Figure 18. An early warning can be an “alarm” signal, which may be cross-checked with other possible signs of an evolving fault. Conversely a trip signal could be activated in the protection relay as a result of an extremely high PD activity.
7. Conclusions
Three different types of PD sensors were tested in the laboratory in an air-insulated switchgear to demonstrate their sensitivity and operability in comparison with a well known and commercially used PD sensor, HFCT. The sensors developed and tested in this research are D-dot sensor, Rogowski coil and loop antenna to detect PD signals in a metal-clad air insulated switchgear. The performance of the sensors has been evaluated using various factors including time domain analysis which includes peak to peak comparison of the measured signals and RF energy comparison of the measured signals from the three proposed sensors with an HFCT. The comparison shows that all the sensors detected the same faults, however, due to difference in their design and characteristics, a time and frequency shift between their measured signals were observed. Finally, the connection of the on-line monitoring system to protection or SCADA system has been outlined. The evaluation of sensors based on size, cost, ease of use, sensitivity and reliability illustrated that the D-dot sensor is the most favorable sensor for online condition monitoring of air insulated switchgear.
Further work is needed to develop a functional prototype of the online monitoring system, which includes data acquisition and processing unit with communication capabilities. After that, laboratory and field testing will be required to prove its functionalities.
Author Contributions
G.A.H. and M.L. conceived the idea; G.A.H. carried out the tests and measurement and acquired the results; A.A.Z. and D.H. mainly contributed in the analysis; M.S. contributed in editing and drafting the manuscript. All authors have read and agreed to the published version of the manuscript.
Funding
This research work is funded by Kuwait Foundation for the Advancement of Sciences under the project code PR18-18EO-01.
Conflicts of Interest
The authors declare no conflict of interest.
References
- Álvarez, F.; Garnacho, F.; Ortego, J.; Sánchez-Urán, M.Á. Application of HFCT and UHF sensors in on-line partial discharge measurements for insulation diagnosis of high voltage equipment. Sensors 2015, 15, 7360–7387. [Google Scholar] [CrossRef] [PubMed] [Green Version]
- Luo, Y.; Li, Z.; Wang, H. A review of online partial discharge measurement of large generators. Energies 2017, 10, 1694. [Google Scholar] [CrossRef] [Green Version]
- Hussain, G.A.; Kumpulainen, L.; Lehtonen, M.; Kay, J.A. Preemptive Arc-Fault Detection Techniques in Switchgear and Controlgear—Part II. IEEE Trans. Ind. Appl. 2013, 50, 1649–1658. [Google Scholar] [CrossRef]
- Stone, G.C. Partial discharge diagnostics and electrical equipment insulation condition assessment. IEEE Trans. Dielectr. Electr. Insul. 2005, 12, 891–904. [Google Scholar] [CrossRef]
- Stone, G.; Warren, V.; Sedding, H.; McDermid, W. Advances in Interpreting Partial Discharge Test Results from Motor and Generator Stator Windings; CIGRE: Paris, France, 2002; pp. 11–202. [Google Scholar]
- VanHaeren, R.; Stone, G.; Meehan, J.; Kurtz, M. Preventing failures in outdoor distribution-class metalclad switchgear. IEEE Trans. Power Appar. Syst. 1985, 2706–2712. [Google Scholar] [CrossRef]
- Brown, P. Non-intrusive partial discharge measurements on high voltage switchgear. In Proceedings of the IEE Colloquium on Monitors and Condition Assessment Equipment, Leatherhead, UK, 5 December 1996. [Google Scholar]
- Lloyd, B.; Campbell, S.; Stone, G. Continuous on-line partial discharge monitoring of generator stator windings. IEEE Trans. Energy Convers. 1999, 14, 1131–1138. [Google Scholar] [CrossRef]
- Petchphung, P.; Leelajindakrairerk, M.; Pattanadech, N.; Yutthagowith, P.; Aunchaleevarapan, K. The comparison study of PD measurement with conventional method and unconventional method. In Proceedings of the 2008 International Conference on Condition Monitoring and Diagnosis, Beijing, China, 21–24 April 2008; pp. 32–36. [Google Scholar]
- Baker, P.; Judd, M.; McArthur, S. A frequency-based RF partial discharge detector for low-power wireless sensing. IEEE Trans. Dielectr. Electr. Insul. 2010, 17, 133–140. [Google Scholar] [CrossRef] [Green Version]
- Kaneko, S.; Okabe, S.; Yoshimura, M.; Muto, H.; Nishida, C.; Kamei, M. Detecting characteristics of various type antennas on partial discharge electromagnetic wave radiating through insulating spacer in gas insulated switchgear. IEEE Trans. Dielectr. Electr. Insul. 2009, 16, 1462–1472. [Google Scholar] [CrossRef]
- Mallikarjunappa, K.; Ratra, M. Detection of partial discharges in power capacitors using high frequency current transformers. In Proceedings of the Annual Conference on Electrical Insulation and Dielectric Phenomena, Pocono Manor, PA, USA, 28–31 October 1990; pp. 379–384. [Google Scholar]
- Ray, W.; Hewson, C. High performance Rogowski current transducers. In Proceedings of the Thirty-Fifth IAS Annual Meeting and World Conference on Industrial Applications of Electrical Energy, Rome, Italy, 8–12 October 2000; pp. 3083–3090. [Google Scholar]
- Zhu, H.; Green, V.; Sasic, M.; Halliburton, S. Increased sensitivity of capacitive couplers for in-service PD measurement in rotating machines. IEEE Trans. Energy Convers. 1999, 14, 1184–1192. [Google Scholar] [CrossRef]
- Muhr, M.; Woschitz, R. Partial discharge diagnostic. In Proceedings of the 6th International Conference on Properties and Applications of Dielectric Materials, Xi’an, China, 21–26 June 2000; Volume 1, pp. 223–226. [Google Scholar]
- Standard, B. BS EN 60270: 2001/IEC 60270: 2000: High-Voltage Test Techniques—Partial Discharge Measurements; BS: Chicago, IL, USA, 2001. [Google Scholar]
- Kuffel, J.; Kuffel, P. High Voltage Engineering Fundamentals; Elsevier & Newnes: Boston, MA, USA, 2000. [Google Scholar]
- Abdel-Salam, M. High-Voltage Engineering: Theory and Practice, Revised and Expanded; CRC Press: Boca Raton, FL, USA, 2000. [Google Scholar]
- Bartnikas, R. Partial discharges. Their mechanism, detection and measurement. IEEE Trans. Dielectr. Electr. Insul. 2002, 9, 763–808. [Google Scholar] [CrossRef]
- Shafiq, M.; Hussain, G.A.; Kütt, L.; Lehtonen, M. Effect of geometrical parameters on high frequency performance of Rogowski coil for partial discharge measurements. Measurement 2014, 49, 126–137. [Google Scholar] [CrossRef]
- Burkhart, S. Coaxial E-field probe for high-power microwave measurement (short papers). IEEE Trans. Microw. Theory Tech. 1985, 33, 262–265. [Google Scholar] [CrossRef]
- Hussain, G.A.; Shafiq, M.; Lehtonen, M.; Hashmi, M. Online Condition Monitoring of MV Switchgear Using D-Dot Sensor to Predict Arc-Faults. IEEE Sens. J. 2015, 15, 7262–7272. [Google Scholar] [CrossRef]
- Stutzman, W.L.; Thiele, G.A. Antenna Theory and Design; John Wiley & Sons: Hoboken, NJ, USA, 2012. [Google Scholar]
- Hashmi, M.; Lehtonen, M.; Nordman, M.; Hänninen, S. Signal processing of on-line pds captured by rogowski coil for enhanced fault detection in smart distribution networks. Int. Rev. Electr. Eng. 2012, 7, 4055–4064. [Google Scholar]
- Satish, L.; Nazneen, B. Wavelet-based denoising of partial discharge signals buried in excessive noise and interference. IEEE Trans. Dielectr. Electr. Insul. 2003, 10, 354–367. [Google Scholar] [CrossRef] [Green Version]
- Hussain, G.A.; Shafiq, M.; Kumpulainen, L.; Mahmood, F.; Lehtonen, M. Performance evaluation of noise reduction method during on-line monitoring of MV switchgear for PD measurements by non-intrusive sensors. Int. J. Electr. Power Energy Syst. 2015, 64, 596–607. [Google Scholar] [CrossRef]
- Shafiq, M.; Lethonen, M.; Kutt, L.; Hussain, G.A.; Hashmi, M. Effect of terminating resistance on high frequency behaviour of Rogowski coil for transient measurements. Elektronika ir Elektrotechnika 2013, 19, 22–28. [Google Scholar] [CrossRef]
- Xiao, S.; Moore, P.; Judd, M.; Portugues, I. An investigation into electromagnetic radiation due to partial discharges in high voltage equipment. In Proceedings of the 2007 IEEE Power Engineering Society General Meeting, Tampa, FL, USA, 24–28 June 2007; pp. 1–7. [Google Scholar]
Figure 1.
Three capacitance model of a dielectric with a cavity.

Figure 2.
Generation of PD current pulses.

Figure 3.
(a) Physical image (b) Construction of Rogowski coil.

Figure 4.
Electrical equivalent model of a Rogowski coil.

Figure 5.
D-dot sensor (a) Sensor’s head (b) Sensor mounted on metal plane.

Figure 6.
Electrical equivalent model of the D-dot sensor.

Figure 7.
(a) Physical image (b) Construction of Loop Antenna.

Figure 8.
Electrical equivalent model of the loop antenna.

Figure 9.
PD test setup.

Figure 10.
PD Sources (a) Voids in epoxy insulator (b) Surface discharge and corona source.

Figure 11.
HV Power Supply.

Figure 12.
Original and de-noised PD signal captured by loop antenna.

Figure 13.
FFT of signal, captured by loop antenna (original vs. de-noised).

Figure 14.
Internal PD within an insulator.

Figure 15.
Surface PD over the insulator.

Figure 16.
Peak to peak voltages of the four sensors (values are scaled for comparison).

Figure 17.
Cumulative energies of the four sensors (values are scaled for comparison).

Figure 18.
Outline of online monitoring system integrated with SCADA.

Table 1.
Properties of PD sensors.
| Sensor | Lower Cut-Off Frequency | Upper Cut-Off Frequency |
|---|---|---|
| HFCT | 1 Hz | 100 MHz |
| D-dot Sensor | 1 Hz | 18 GHz |
| Rogowski Coil | 1 kHz | 150 MHz |
| Loop Antenna | 1 kHz | 100 MHz |
Table 2.
Frequency spectra of PD signals captured by different sensors.
| Type of Discharge | HFCT | Rogowski | Loop Antenna | D-Dot |
|---|---|---|---|---|
| Internal PD | 3–20 MHz | 3–25 MHz | 5–25 MHz | 3–20 MHz |
| Surface PD | 5–35 MHz | 5–40 MHz | 5–40 MHz | 5–40 MHz |
© 2020 by the authors. Licensee MDPI, Basel, Switzerland. This article is an open access article distributed under the terms and conditions of the Creative Commons Attribution (CC BY) license (http://creativecommons.org/licenses/by/4.0/).
Share and Cite
MDPI and ACS Style
Hussain, G.A.; Zaher, A.A.; Hummes, D.; Safdar, M.; Lehtonen, M. Hybrid Sensing of Internal and Surface Partial Discharges in Air-Insulated Medium Voltage Switchgear. Energies 2020, 13, 1738. https://doi.org/10.3390/en13071738
AMA Style
Hussain GA, Zaher AA, Hummes D, Safdar M, Lehtonen M. Hybrid Sensing of Internal and Surface Partial Discharges in Air-Insulated Medium Voltage Switchgear. Energies. 2020; 13(7):1738. https://doi.org/10.3390/en13071738
Chicago/Turabian StyleHussain, Ghulam Amjad, Ashraf A. Zaher, Detlef Hummes, Madia Safdar, and Matti Lehtonen. 2020. "Hybrid Sensing of Internal and Surface Partial Discharges in Air-Insulated Medium Voltage Switchgear" Energies 13, no. 7: 1738. https://doi.org/10.3390/en13071738
Note that from the first issue of 2016, this journal uses article numbers instead of page numbers. See further details here.