Abstract
The operation feasibility of small hydropower plants in mountainous sites is subjected to the run-of-river flow, which is also dependent on a high variability in precipitation and snow cover. Moreover, the management of this kind of system has to be performed with some particular operation conditions of the plant (e.g., turbine minimum and maximum discharge) but also some environmental flow requirements. In this context, a technological climate service is conceived in a tight connection with end users, perfectly answering the needs of the management of small hydropower systems in a pilot area, and providing a forecast of the river streamflow together with other operation data. This paper presents an overview of the service but also a set of lessons learnt related to the features, requirements, and considerations to bear in mind from the point of view of climate service developers. In addition, the outcomes give insight into how this kind of service could change the traditional management (normally based on past experience), providing a probability range of the future river flow based on future weather scenarios according to the range of future weather possibilities. This highlights the utility of the co-generation process to implement climate services for water and energy fields but also that seasonal climate forecasting could improve the business as usual of this kind of facility.
1. Introduction
Hydropower is one of the most reliable, sustainable, renewable, and cheapest sources of energy [1]. In a climate change scenario, hydropower projects are also an adaptation measure for the use of water resources, since regulated basins with large reservoir capacities are more resilient to changes in these resources [2]. However, small-scale hydropower plants are mostly run-of-river (RoR) systems, located in mountainous areas, without dams or significant water storage. Despite being one of the most profitable energy technologies, with relatively low operating and maintenance costs, and being environmentally benign [3], this type of facility has the disadvantage of having an irregular production that is subject to RoR flow, which in turn is highly variable depending on the duration of rainfall and snow cover. Since RoR plants usually have a small or non-existent storage facility that allows for very short-term water storage, the hydropower plant does not have enough water to continue operating when the inflow falls below the turbine’s minimum discharge value. Another drawback of these systems is that when the inflows are extremely high and the turbine capacity is exceeded, the water will be wasted (spill) and will become a lost opportunity for generation [4].
Europe is the market leader in small-scale hydropower technology, with Spain, Italy, France, Germany, and Sweden being the main producers [5]. However, the potential of RoR plants has not yet been fully explored and exploited, so there is interesting scope for the development of this technology and its optimization [5]. Management has to be done with some particular plant operating conditions but also with some environmental requirements. In this context, decision makers need to have information on the flow in the river in the short and medium term. If they could forecast the energy that will be produced in the following months, they could better adjust market prices and plan maintenance or other energy resources when the water availability falls below the minimum operating flow.
Although some forecasting models already exist in the area of small-scale hydropower production [6,7,8,9], there is still a gap in linking forecasting with decision support systems. In most cases, water system managers usually make decisions based on historical statistical data despite the great advances in climate forecasting that exist so far. There are currently a number of European projects (e.g., MED-GOLD, CLARA, S2S4E, H2020_Insurance, VISCA, CLIMATE-FIT, SECLI-FIRM, PROSNOW, CLARITY) involved in the development of tailored and usable climate services (CSs) that can facilitate the uptake and use of climate information and forecast by the final users. In the framework of the H2020 project CLARA (climate forecast-enabled knowledge services), a CS targeted at end-users and able to support small hydropower systems’ management, has been developed. A preliminary version of this tool is presented in [10], showing the structure of the tool and utilities but without delving into details, such as the data and models used and the co-development process outcomes. This preliminary version used a single forecast. However, as probabilistic forecasts are based on ensembles, in this paper, we used a set of forecasts that represent a range of future weather possibilities. Multiple simulations were run, each with a slight disturbance of the initial conditions of the weather models [11]. The new version presented here includes the range of probabilistic forecasts in order to show end-users the range of weather possibilities. The aim of this work was to also show the main outcomes of the co-generation process in order to provide a short guide to help future CS developers to connect climate forecast data with the decision support process. It thus provides very useful knowledge for technicians in charge of control operation centers of small hydropower plants and managers in regional administrations.
The tool proposed in this paper is a state-of-the-art CS based on the newly created Copernicus Climate Change Service (C3S) [12], which provides Earth observation satellite-based information and in situ (non-spatial) data. The climate data developed by C3S, in this case SEAS5 [13], provides seasonal forecast data as input to the developed CS. A strong point of this CS is the cogeneration methodology used during its creation and development. In this way, the proposed service bridges the gap between data providers generating climate impact data, on the one hand, and administrators and policy makers, on the other. In addition, the service is based on databases and models created with a scalable architecture that allows their application in other systems. This ensures that the information available is useful for hydropower management at different scales, both at the local and regional level across Europe, which contributes to the marketability of this type of information. More generally, this paper aimed to highlight the value that CS tools can bring to the hydropower energy field but also to highlight relevant outcomes about the skill of the forecast data when applied at the local scale in a pilot area in southern Spain.
The paper is organized as follows: Section 2 introduces the methodology carried out for the service development, including a pilot area description, the data and models used, and the CS approach, which also illustrates the CS workflow; Section 3 presents the main outcomes of the co-design process, the final structure of the web user interface, and service output examples; and Section 4 contains the findings and implications of the main results.
2. Materials and Methods
2.1. The Pilot Area in Southern Spain
The CS was tested in southern Spain, in a Mediterranean high mountain area where snow has a critical influence over the hydrology of the downstream areas. The RoR pilot system consists of three small consecutive hydroelectric plants in the Poqueira River basin (Figure 1) belonging to a leading company in the Spanish energy sector, with a combined generation capacity of between 10 and 12 megawatts. The study area is divided into three catchments of interest for the user. These three catchments define three different points of water uptake for the hydropower production. Their main characteristics are compiled in Table 1.
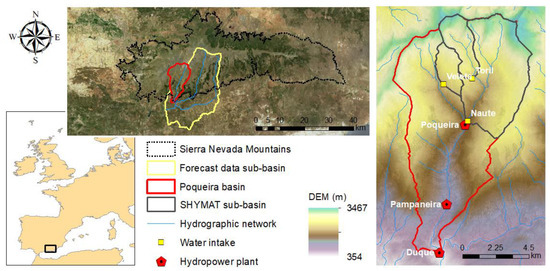
Figure 1.
Location of the Poqueira River basin in southern Spain and the three RoR plants system in the pilot area. The sub-basin where seasonal forecast data are produced and the sub-basins defining three different points of water uptake for the hydropower production (SHYMAT sub-basins) are also presented.

Table 1.
Size, mean slope, and mean elevation of the three catchments of interest in the pilot system.
The basin is located within the Sierra Nevada Mountain Range, which is a national park and biosphere reserve. This explains the special importance of carrying out adequate management of water resources in strict compliance with environmental regulations. It is an alpine/Mediterranean climate region with a highly variable rainfall regime. Annual cumulative values range from 1000 mm in wet years to 200 mm in dry years [14]. Snow appears recurrently at altitudes above 1000 m a.s.l. and is more persistent at altitudes above 2500 m a.s.l. from November to May. Snow cover is subject to several accumulation-ablation cycles during the snow season [15]. The average annual area of fractional snow cover was 0.21 m2·m−2 between 2000 and 2013, and ranged from 0.9 to 0.16 m2·m−2 in wet/cold and dry/hot years, respectively, with an average standard deviation of 0.23 m2·m−2 [16]. The spatial distribution of snow cover is very heterogeneous over the years and very difficult to predict. Therefore, this pilot area was a perfect candidate to apply and analyze the potential of the proposed CS.
Under these circumstances, climate is extremely variable and seasonal forecasts usually show very limited skills and performance. However, the use of a seasonal forecast in this pilot area allows managers to estimate the production in the next 7 months thanks to the knowledge of the water availability in terms of the volume of snow (from the real-time hydrological state of the contributing basin to the RoR plants) together with information of the seasonal forecast of river inflow.
2.2. Data and Models
Several data sources were used in this work: Historical information, seasonal forecast data, and local data, with all of them provided in the collaborative framework of the CLARA project.
On the one side, the service includes dynamic data, which is seasonal forecast data and simulated hydrological data, that can be updated as better knowledge of the physical environment and as more measurements become available, resulting in improved data forcing and models:
- Seasonal (which go up to a seven-month prediction lead time) forecast of daily river flow data issued monthly by the Swedish Meteorological and Hydrological Institute (SMHI). SMHI produces these data by forcing the E-HYPE (European Hydrological Predictions for the Environment) model with the ECMWF SEAS5 seasonal forecast. SEAS5 is based on a global climate model, which, since the oceanic circulation is a major source of predictability in the seasonal scale, is based on coupled ocean-atmosphere integrations [17]. E-HYPE is the European setup of the HYPE model, which calculates hydrological variables on a daily time step at an average sub-basin resolution of 120 km2 over the entire continent [17,18,19]. Figure 1 shows the location of the sub-basin where seasonal forecast data are produced, which has a size of 527 km2. Probabilistic forecasts are produced as an ensemble of scenarios that present the range of future river flow possibilities. In the service testing stage, we used the SEAS5 hindcast period 1981–2015 for each calendar month and up to seven months ahead, considering an ensemble of 51 members. In this work, the raw seasonal forecast data were presented at a monthly scale and downscaled to the intake points of the three RoR systems to match the temporal and spatial scale suitable for this particular application. This was done by using a quantile mapping methodology [20,21], usually adopted as a bias correction method, which leads to a good performance [21,22].
- Interpolation of the meteorological real-time data and current state of the hydrological variables were extracted from GMS-Snowmed service [23], which makes use of WiMMed (Water Integrated Management in MEDiterranean Environments) [24,25,26], a physically based and fully distributed hydrological model. This service makes use of past and quasi-real-time observations of daily hydro-meteorological data (precipitation, temperature, river flow), from different meteo-hydrological networks in the area (Red Guadalfeo, SAIH Guadalquivir, RIA-JA, Red Hidrosur). The outputs of GMS-Snowmed directly offer distributed information about the antecedent weather and current water availability in the basin upstream from the RoR plants at daily and monthly scales.
On the other side, the service makes use of static data related to local specific facility features defined by end-users:
- Past observations of daily streamflow measurements provided by the managers of the hydropower system and available for the period 1969–2018. These data provide a very adequate overview of the historical river inflow to the RoR system.
- Some records related to the specific consumption of the turbines that are also provided by the managers of the hydropower system. This information is mainly used to compute the production of the hydropower plants.
- Threshold value of the target indicators in the service, according to the turbine’s minimum and maximum discharge, provided by the managers of the hydropower system.
- Minimum environmental flow restrictions, as defined in the Hydrological Plan of the Mediterranean River Basin, the water authority in the study site.
Different scale issues were considered in the development of the service to achieve a satisfactory representation of the flow data on both the historical and forecasted information. On the one hand, there is the more detailed scale of the data and models, and on the other, the broader scale of the industrial processes that determine energy production. At the core of the CS, the calculation scales of the historical and the real-time modules are determined by the characteristic scales of the physical processes. The stream discharge is determined by the combined action of snowmelt, surface runoff, infiltration, and subsurface and groundwater flows. WiMMed performs hourly calculations of the energy and water balance on a 30-m gridded representation of the terrain, providing input data to circulate both surface and sub-surface flows throughout the catchment area to the selected outlets. Despite the user’s requirements for decision-making being framed in a daily time step, which is the data scale displayed in the service, the hourly calculations are accumulated or averaged to the daily scale at sub-basin level (as represented in Figure 1). This avoids a non-adequate performance of the model when the non-linear effects of the topography of the area and the significant scales of the energy fluxes’ evolution cannot be neglected. In addition, the results are also aggregated on a monthly scale to provide a perspective within the current year compared to previous ones. The historical simulation of the river flow generated by the model results in a correlation coefficient r of 0.790 and 0.864 on a daily and monthly basis, respectively. As for the final downscaled seasonal forecast, which is not modeled in as much detail as the historical one, it is displayed on a monthly basis.
2.3. Climate Service Approach
The CS was developed following a co-generation process, where data providers and service purveyors and also end-users are closely involved in the design of the tool and local data provision (Figure 2). Co-generation entails that all participants are engaged on an equal footing in an effort for co-designing, co-developing, co-delivering, and co-evaluating CS tools [27]. The outcomes and conclusions of this co-development process are presented in Section 3.
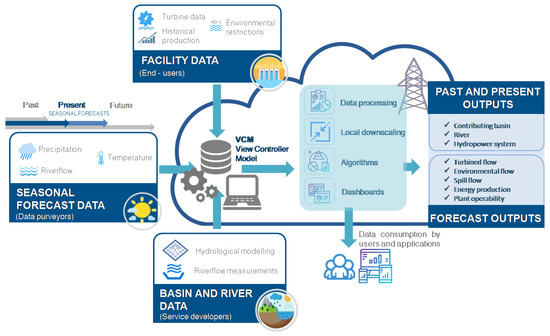
Figure 2.
Structure of the CS developed in the CLARA project for the operation of RoR plants (SHYMAT), including the seasonal forecast, facility data, and historical data.
Figure 2 shows an overview of the structure of the service, called SHYMAT (Small Hydropower Management Assessment Tool), including the inputs from different data sources, the data processing workflow, and the service outputs.
Firstly, the historical and quasi-real-time hydro-meteorological information was collected from the GMS-Snowmed service, and the seasonal forecast of daily river flow. River flow was the variable selected as an indicator of the available water to generate electricity. With the aim of making the downscaling generation of the river inflow, river flow forecast data were combined with historical local measurements of the river flow in the RoR system’s uptake point. Moreover, a set of local specifications, such as historical energy production, turbine maximum and minimum discharge, turbine-specific consumption, and environmental flow requirements, were defined by end-users as well as the outputs answering their needs.
Once all the seasonal forecast, basin and river data, and local facility data were collected, a data model defining the different components of the hydropower system and including all available information was developed. The CS uses the data model in order to automatically build a scalable database and a scalable topological scheme of the pilot RoR system. Both scalable capacities allow the implementation of SHYMAT in other sites. Thus, the on-line implementation of the CS included two main aspects:
- A web administration panel: A CS administrator (or also a CS developer) accesses a panel in order to define, store, and manage the information to be included in SHYMAT. Through this administration panel, a CS administrator is able to create users, hydropower systems, the elements that compose the hydropower systems (rivers, load chambers, hydropower plants, basins, power grid), and also import the available data (related to climate, hydrology, energy production, and local facility data).
- A web-user interface: A CS user accesses a graphical application, which allows fast and intuitive access to all the information included in SHYMAT. This user interface has capacities for SIG geolocalization, user registration, data processing and acquisition, and graphical monitoring and supervision of the hydropower systems. It includes two different modes: One for “historical information” and another one for “forecast information”. The historical mode is devoted to showing weather and hydrological past and real-time data. The forecast mode includes hydro-meteorological forecast information and offers the user seasonal forecast information together with a prediction of the operability of the plant and the energy production expected for the next seven months (because, as it was already said before, seasonal forecast data go up to a seven-month prediction lead time).
The implementation of SHYMAT was carried out following a view controller model (VCM) methodology. One of the main advantages of the VCM architecture is that it allows for fast and collaborative development but also an easier update of the application. This characteristic is very relevant for the CS development, because SHYMAT is expected to be updated as the knowledge of forecast information progresses. In addition, the VCM architecture can assist decision-makers and help practitioners to prepare and realize such integration projects [28]. The view is the user interface on which the end-user can interact and perform some actions. The controller is the part of the application in which data are processed after a request is received from the view and before updating anything in the database with the model. When a CS end-user sends a query to the view (web user interface), the controller (web administration panel) asks the model for information from the database, which answers the controller by sending the requested information. As a reply to this request, the controller sends the information to the view, which automatically collects the updated information and shows the required data on the screen.
HTML and JavaScript codes were combined to integrate the software architecture defined above. In addition, data models and processing routines were implemented in a Python code, thus CS developers used a high-level Python Web Framework (Django) in order to integrate them in the database.
3. Results
3.1. Outcomes of the Co-Development Process
The co-development process was carried out through seven face-to-face meetings during an 11-month period, during which service providers and pilot end-users discussed the user needs and specifications and requirements to be implemented in the CS. The main lessons learnt from the meetings were:
- The user needs and the specifications and requirements to be implemented in the CS were set according to the operation in RoR plants. SHYMAT should cover the end-user’s needs, providing an answer to these questions: (1) Will my RoR plant be operative during the coming months? (2) What is the best date to plan maintenance tasks for the next coming months? (3) Will the minimum environmental flow restrictions be met for the next months? (4) What is the energy production expected for the coming months? and (5) When should I tune up the machines to increase the capacity of my plant to take advantage of the water excess discharges coming from snowmelt?
- Hydropower managers traditionally use historical inflows in order to predict the water availability and energy production; different past data-based scenarios (last year, driest year, wettest year) are compared to the current situation on a monthly basis, as a simple forecast approach. The difficulty in using forecast information is mainly that the data do not provide reliable and concise information to be used in the decision support process.
- The main data required for the CS implementation provided by the end-users were identified: Specific consumption of the machines, turbine minimum and maximum discharge, ecological flow to be considered, historical daily production, and turbined flow data.
- Regarding the analysis of how the CS could improve the management of the plants, the definition of payoff should be considered in terms of the amount of produced energy. However, the value of the energy production forecast is also related to market issues and to the schedule of the operation for investment or maintenance tasks.
- The web-user interface and graphical outputs were defined. One of the main lessons learnt was that users prefer graphs that are not too technical and do not contain too much information in the same graph, as well as clear information about the forecast skill and comparison between the past forecast and observed data. Moreover, users were also interested in the hydrological state of the basin upstream (defined by variables, such as the current amount of snow) and short-term forecast data, as managers also need to plan for the short term (which will be taken into account in the updated version of the service).
- The CS tool should be easily scalable to other small hydropower plants. For this reason, SHYMAT is presented as a cloud web application based on a scalable database, allowing implementation in other systems with similar characteristics to the pilot area. This database is managed through an administration panel, which includes the users and typical component and data of the hydropower systems (Figure 3). From the information included in this database, a topological panel is dynamically generated showing the different components and relations (Figure 4).
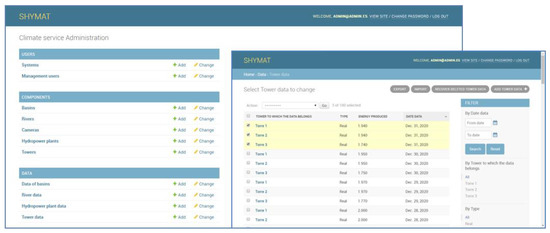 Figure 3. Example of visualization of the web administration panel of the SHYMAT service for the pilot RoR system. It shows the “users section”, where systems and different users can be managed; the “components section”, where basins, rivers, load chambers, hydropower plants, and power grid elements can be managed; and the “data section”, where data related the system components can be managed. Some examples of management options are also displayed, such as add/change data, export/import setting, and filter options.
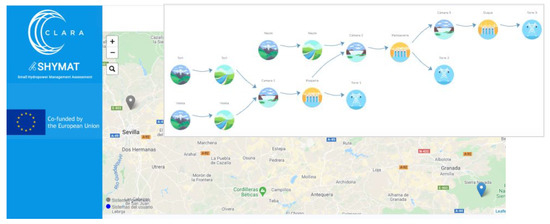 Figure 4. Example of the visualization of the SHYMAT web-user interface. A geolocation panelfor hydropower system selection and the topology panel of the hydropower system selected (appearing on the screen once a particular system is selected by the user), which shows the different elements of the system and the relations among them.
 - Uncertainty information is one of the key issues when providing trustworthy forecast information to end-users, especially in the case of seasonal forecast information due to its higher uncertainty when compared to short-term forecasts, which they are usually familiar with. For this, the interaction with the end-users in the cogeneration process of the service was crucial for them not only to understand what uncertainty means in this framework but also to efficiently advise on how to incorporate this metadata in a displayable and rigorous way. As will be shown in Section 3.2, forecast information is included in the service as probabilistic data by using boxplot graphs, which graphically show the data through their quartiles. This provides a range of potentially likely values and how probable each interval is.
Finally, the structure of the web-user interface and the graphical outputs for the on-line monitoring system were defined as follows:
- A login screen for each customer to access its personalized web page service. After on-line registration, access is given to certain RoR systems (payed access) or only to public information (open access). Both types of access login need to be previously accepted by the service developers’ team.
- A GIS (Geographic Information System) panel: A geolocation map presents the user all the RoR systems included in SHYMAT, showing in a different color those over which the user has control (the rest will not be selectable, since they would belong to other users). Then, the user can select a system to launch an information queries process through a topological panel.
- A topological panel module: All the elements that comprise the small hydropower system and their interactions need to be defined during the setup phase of the CS; after, the topological panel of the system is dynamically generated. The sequence of icons in the topology panel means the path which river flow follows from the sub-basin outlet, passing through a river stretch, load chamber, and hydropower plant, and ending in the conversion to energy.
- A water availability and operation module: Here, a set of weather data (rainfall, snow, and temperature), hydrological data (river flow), and operation data (number of days with operation and energy production) is computed and stored. This provides users with information about the past, present, and future climate and water availability in the basin and in the uptake point of the plant. This module includes both a historical and a forecast information mode. In the historical mode, hydro-meteorological and operational data related to the RoR system are displayed and compared for different years at a daily and monthly scale. The module for forecast purposes covers some operation aspects, such as the inflow, operability, and energy production, expected for the next seven months according to the provided seasonal climate forecast.
- A tool for exporting the raw data to different formats required by the user and sending queries for certain periods. This facilitates the integration of the CS outputs into the individual operational and managerial systems of the end-users.
3.2. Service Outputs
Service outputs are shown in a user-friendly web interface. To access the information, the user needs to enter a login window, which will take the user to a GIS map viewer (Figure 4), where the user will be able to explore the hydropower systems included in SHYMAT and select one of them. Once the system of interest is chosen, its topological representation is automatically generated and displayed, showing the different components (Figure 4). Once the user chooses an element of the topology panel, the available information appears in the screen at the requested time scale.
On the one hand, by choosing the historical mode, the user can check real-time information from each one of the system elements, such as basin data (snow water volume, temperature, precipitation, water availability), river data (simulated and measured river flow, environmental river flow), hydropower plant data (discharge), or power grid data (energy production). The CS also offers a comparison between the real-time and historical data at both daily and monthly time scales. This option allows the user to receive information about the behavior of the river basin under similar, drier, or wetter hydrological conditions. Figure 5 and Figure 6 present an example of the historical mode outputs, where a comparison of the river streamflow data and the energy production along the hydrological year are presented respectively for two different periods. Both graphs show the high annual variability of the study case.
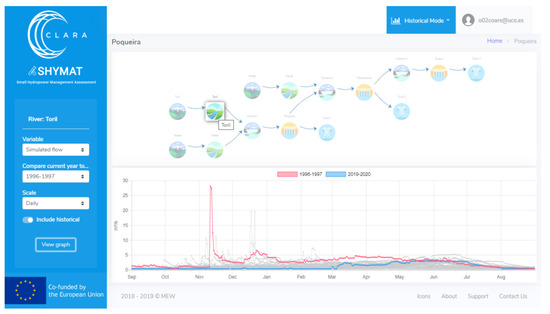
Figure 5.
Example of visualization of the SHYMAT web-user interface. Historical mode outputs: The river element is selected in the topology panel and a graph showing the daily streamflow data for the hydrological years 1996/97 (red) and 2019/20 (blue), and for the period 1981–2020 (grey) appears on the screen.
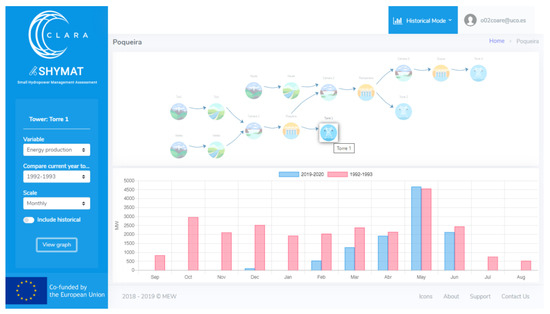
Figure 6.
Example of the visualization of the SHYMAT web-user interface. Historical mode outputs: The power grid element is selected in the topology panel and a graph showing the monthly energy production data for the hydrological years 1992/93 (red) and 2019/20 (blue) appears on the screen.
On the other hand, the main outputs of the forecast mode are:
- Hydro-meteorological forecast: The user can check how the temperature, precipitation, or river flow forecasts compare with past years. Information about both periods, the previous past five months and the next seven months, is shown in the same graph. Moreover, this option allows the user to compare the past forecast data with past observed data so that the end-user can check the level of the skill of the seasonal forecast information.
- Inflow forecast: Forecast of the water availability is provided for the next seven months. Moreover, this information is split into the turbine discharge and spill but also into a minimum environmental flow, the minimum flow that must be released from a plant in order to meet environmental water requirements. These water volumes are computed according to the turbine’s minimum and maximum discharge values and the environmental requirements defined in the hydrological plan. An example of the presentation of inflow forecast data, for the hydrological years 1985/86, 1989/90, 2001/02, and 2010/11 (with annual precipitation around 450, 840, 510, and 700 mm, respectively), is presented in Figure 7. Once a hydropower plant element is selected in the topology panel, a graph showing forecast and real or measured data of monthly river flow data is displayed on the screen. Here, real data are represented as points; however, as forecasts are produced as an ensemble of scenarios that present the range of future river flow possibilities, this variable is represented as boxplots, giving the user a range of values with an associated probability. In most of the cases, the forecasted values are close to real values, which is expected because forecast data show a wide range of possibilities. However, as shown in Figure 7, it seems that snow precipitation is underestimated by the forecast model. On the other hand, the melting of snow causes an increase in flow at times of melting (winter and spring) and the flow remains constant during the maintenance of flow in the first months of the summer, even though this fact is not captured by the forecast data either. Thus, after comparing monthly forecast data with monthly real data and considering the maximum, mean, and minimum values of the forecast, the river flow predictions are true in 54% of the cases for the hindcast period 1981–2015.
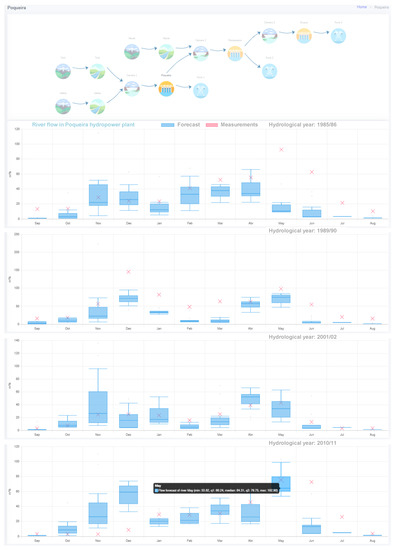 Figure 7. Example of the visualization of the SHYMAT web-user interface. Historical mode outputs: The hydropower plant element is selected in the topology panel and a graph showing the forecast (boxplot) and real (point) data of monthly river flow data for the hydrological years 1985/86, 1989/90, 2001/02, and 2010/11 appears on the screen. In the last graph, an example of the statistical information (minimum, quartile 1, median, quartile 3, and maximum) is displayed.
 - Operability forecast: The operability of the plant is predicted according to the production and non-production periods for the next seven months. In this sense, the number of days of the month in which the inflow forecast reaches or drops below the turbine’s minimum discharge is computed, which means the periods when the water availability in the plant is enough for the system to remain operational or stop, respectively.
- Energy production forecast: An estimation of the energy production is given taking into account the prediction of water available to be discharged and the specific consumption of the turbines. Figure 8 shows how well the energy production forecast data fits the real data.
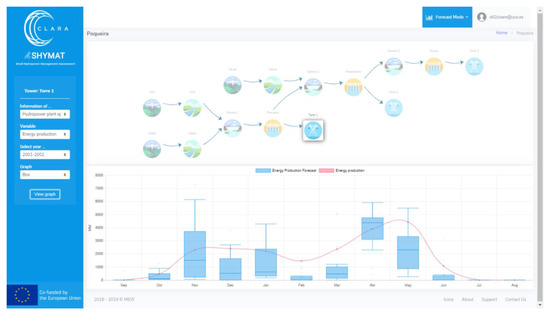 Figure 8. Example of the visualization of the SHYMAT web user interface. Forecast mode outputs: The power gridelement is selected in the topology panel and a graph showing monthly values of the energy production expected for the next seven months (boxplot) and real energy production (line) appears on the screen.
4. Discussion and Conclusions
The operation planning of RoR plants should not be solely based on historical local data, since water availability presents a very high interannual variability, which is even more significant in mountainous Mediterranean areas, where snow cover and snow processes have a large influence on the quantity and timing of water availability. Thus, seasonal forecasts constitute an added source of information that may help to narrow down the operational options inferred from historical data sources. The proposed CS provides end-users with the most up-to-date hydrological data, combining measurements and modelling with the most advanced seasonal forecast that currently exists at the European level. The co-design process gives as a result a tool that perfectly matches the user’s needs, i.e., the information uses the correct scale and the right tools to convey information, which results in a more effective knowledge system [29]. The service provides simple and intuitive results, while being supported by the state-of-the-art knowledge on snow hydrology and weather forecasting.
SHYMAT shows hydropower managers how seasonal climate forecasts can provide advanced information about water availability for the next season, and users can make use of this knowledge for several aspects related to plant operation planning. Users can take advantage of the climate forecast in order to anticipate: (1) Periods in which there will be enough water to turbinate (periods with production); and, on the other hand, (2) periods in which there will be an inadequate amount of water to turbinate, and maintenance tasks can be planned (periods without production). Moreover, having knowledge of the possible water excess discharges coming from snowmelt, which may result in the spilling of water, gives managers the opportunity to quickly tune up additional turbines. Finally, great value comes from the prediction of energy production, which is clearly valuable information for market issues. In addition, the development of this kind of tool, addressed to hydropower managers to predict the operability of the plant and the expected energy production, should consider not only forecast information but also past data at the local scale. Both types of information provide end-users with more reliability and trust.
SHYMAT is a scalable solution, as service developers just need to define the elements of the new hydropower system and a new topology scheme will be automatically generated to include the new local information and parameters. This allows an easy application in other systems, with very low development costs, which helps to bring the C3S information to other sites in Spain and Europe, while also contributing to the bloom off climate services as an emerging market. In addition, the CS combines service-oriented architecture (SOA) and VCM architecture for cloud services and information systems, as other works have also proposed [28].
The findings presented in this work have enormous implications in the emerging markets of climates services, helping future climate service developers to connect climate forecast data with the decision support process in the hydropower sector. As previous works have indicated [29], technical information, such as historical and local data of water availability and production, placed in the context of hydropower plant operation according to the management experience, leads to more robust knowledge and contextual applicability of the seasonal climate forecast. This will also help end-users to overcome some perceived barriers, such as the accessibility, relevance, and usability of seasonal climate forecasting [30].
Keeping these general ideas in mind, the major problem to solve is how to generate forecast data with the highest skill and reliability possible. In this work, a quantile mapping approach was adopted as a direct and easy-to-run method to downscale the raw forecast data to the local spatial resolution required by the RoR system; more complex methodologies for stochastic bias correction [31] can be applied to further overcome these scale issues. Moreover, future research could focus on the improvement of forecast information at the local scale by using both local historical data and high-resolution model outputs with better performance when reproducing the local results.
The energy demand was not mentioned in this work. One might think that periods with low energy demand may be less sensitive to uncertain forecasts and, on the contrary, for periods where the demand is high, the energy producers might be more sensitive to uncertainties. However, the pilot system is composed of small hydropower plants and as such is fully dependent on the seasonal availability of water, whose regime makes non-operational conditions usual during a significant fraction of the year; the operation criteria is to generate the potentially maximum amount of energy at every moment, and this is easily absorbed by the energy market at any time given its magnitude. In such systems, the key advantages provided by seasonal forecasting is to optimize the operation of the facilities, mainly the seasonal start up and closure of the system, together with the dynamic seasonal planning of generation and cost-benefit analysis. Demand dynamics is key in hydropower systems with a storage capacity, and the requirements that its inclusion involves are needed in the future for the extension of SHYMAT to larger hydropower systems, with greater variability of both the demand and the response capacity.
Finally, it must be highlighted how the co-generation approach followed to develop this tool has benefited the result. As the tool evolved, the engagement of the end-users in the pilot case was increasingly enthusiastic, mostly due to the natural uptake of comprehension of both the software but also the underlying know-how. Despite being aware of the limitations forecast data on a seasonal basis still show, the joint discussion of needs for downscaling, and the available options, and requirements of the information to be provided by the service resulted in an efficient exchange and integrated acquisition of expertise for both sides, end-users and developers. End-users valued the possibility of a seasonal forecast that also includes an assessment of skill and uncertainty, leading us to shape their needs for information to understand and frame such additional metadata in the forecast, and to design optimal visualization tools for them to understand and further exploit the information from the service. As a consequence, end-users are excited about the chance to implement the operational version of the service in their system since they tested the pilot version and had the opportunity to compare their day-to-day decision-making with and without the forecast. Even though a higher skill is still needed to narrow the probability of underperformance of the seasonal forecasts that feed the service, the operability of this tool takes them one step further in the future improvement of the service and provides training for staff to cope with the challenging conditions that future climate scenarios provide to the energy and water sectors. The co-generation process has resulted in their convinced willingness to participate in similar experiences in the future, and incredible opportunities for this service as a market product in the near future in a co-participation of public research institutions and private spin-off companies.
Author Contributions
Supervision, M.J.P.; Conceptualization, E.C. and M.J.P.; methodology, E.C. and J.H.; software, E.C. and J.H.; writing—original draft, E.C.; writing—review and editing, J.H., L.C., I.P., C.P., C.A. and M.J.P. All authors have read and agreed to the published version of the manuscript.
Funding
This research was funded by the European Union’s Horizon 2020 research and innovation programme under the Gran Agreement No 730482 in the framework of CLARA Project.
Acknowledgments
Authors are thankful for the support and technical knowledge provided by the Poqueira hydropower system managers and personnel and the hydrological data provided by the Mediterranean Adalusian Basin.
Conflicts of Interest
The authors declare no conflict of interest.
References
- Yildiz, V.; Vrugt, J.A. A toolbox for the optimal design of run-of-river hydropower plants. Environ. Model. Softw. 2019, 111, 34–152. [Google Scholar] [CrossRef]
- Berga, L. The Role of Hydropower in Climate Change Mitigation and Adaptation: A Review. Eng. Lond. 2016, 2, 313–318. [Google Scholar] [CrossRef]
- Paish, O. Small hydro power: Technology and current status. Renew. Sustain. Energy Rev. 2020, 6, 537–556. [Google Scholar] [CrossRef]
- IRENA. Renewable Energy Technologies: Cost Analysis Series-Hydropower; IRENA Secretariat: Abu Dhabi, United Arab Emirates, 2012; Volume 1, Available online: www.irena.org/Publications (accessed on 23 January 2020).
- Manzano-Agugliaro, F.; Tahera, M.; Zapata-Sierra, A.; Del Juaidi, A.; Montoya, F.G. An overview of research and energy evolution for small hydropower in Europe. Renew. Sustain. Energy Rev. 2017, 75, 476–489. [Google Scholar] [CrossRef]
- Li, G.; Sun, Y.; He, Y.; Li, X.; Tu, Q. Short-Term Power Generation Energy Forecasting Model for Small Hydropower Stations Using GA-SVM. Math. Probl. Eng. 2014, 2014, 381387. [Google Scholar] [CrossRef]
- Monteiro, C.; Ramirez-Rosado, I.J.; Fernández-Jimenez, L.A. Short-term forecasting model for aggregated regional hydropower generation. Energy Convers. Manag. 2014, 88, 231–238. [Google Scholar] [CrossRef]
- Anugrah, P.; Setiawan, A.A.; Budiarto, R.; Sihana, F. Evaluating Micro Hydro Power Generation System under Climate Change Scenario in BayangCatchment, KabupatenPesisir Selatan, West Sumatra. Energy Procedia 2015, 65, 257–263. [Google Scholar] [CrossRef]
- MainardiFana, F.; Schwanenberg, D.; Collischonna, W.; Weerts, A. Verification of inflow into hydropower reservoirs using ensemble forecasts of the TIGGE database for large scale basins in Brazil. J. Hydrol. Reg. Stud. 2015, 4, 196–277. [Google Scholar]
- Contreras, E.; Herrero, J.; Aguilar, C.; Polo, M.J. Management and Operation of Small Hydropower Plants through a Climate Service Targeted at End-Users. In Proceedings of the2019 IEEE International Conference on Environment and Electrical Engineering and 2019 IEEE Industrial and Commercial Power Systems Europe (EEEIC/I&CPS Europe), Genova, Italy, 11–14 June 2019; pp. 1–6. [Google Scholar]
- ECMWF. ECMWF Ensemble Weather Forecasting. Available online: https://www.ecmwf.int/en/about/media-centre/fact-sheet-ensemble-weather-forecasting (accessed on 15 December 2019).
- Climate change |Copernicus. Available online: https://www.copernicus.eu/en/services/climate-change (accessed on 1 April 2019).
- Johnson, S.J.; Stockdale, T.N.; Ferranti, L.; Balmaseda, M.A.; Molteni, F.; Magnusson, L.; Tietsche, S.; Decremer, D.; Weisheimer, A.; Balsamo, G.; et al. SEAS5: The new ECMWF seasonal forecast system. Geosci.Model Dev. 2019, 12, 1087–1117. [Google Scholar] [CrossRef]
- Pérez-Palazón, M.J.; Pimentel, R.; Herrero, J.; Aguilar, C.; Perales, J.M.; Polo, M.J. Extreme values of snow-related variables in Mediterranean regions: Trends and long-term forecasting in Sierra Nevada (Spain). Proc. Int. Assoc. Hydrol. Sci. 2015, 369, 157–162. [Google Scholar] [CrossRef]
- Herrero, J.; Polo, M.J.; Moñino, A.; Losada, M.A. An energy balance snowmelt model in a Mediterranean site. J. Hydrol. 2009, 371, 98–107. [Google Scholar] [CrossRef]
- Pimentel, R.; Herrero, J.; Polo, M.J. Subgrid parameterization of snow distribution at a Mediterranean site using terrestrial photography. Hydrol. Earth Syst. Sci. 2017, 21, 805–820. [Google Scholar] [CrossRef]
- Molteni, F.; Stockdale, T.; Balmaseda, M.; Balsamo, G.; Buizza, R.; Ferranti, L.; Magnusson, L.; Mogensen, K.; Palmer, T.; Vitart, F. The New ECMWF Seasonal Forecast System (System 4); ECMWF: Reading, UK, 2011; Volume 49. [Google Scholar]
- Hundecha, Y.; Arheimer, B.; Donnelly, C.; Pechlivanidis, I. A regional parameter estimation scheme for a pan-European multi-basin model. J.Hydrol. Reg. Stud. 2016, 6, 90–111. [Google Scholar] [CrossRef]
- Crochemore, L.; Ramos, M.-H.; Pechlivanidis, I.G. Can Continental Models Convey Useful Seasonal Hydrologic Information at the Catchment Scale? Water Resour.Res. 2020, 56, e2019WR025700. [Google Scholar] [CrossRef]
- Herrero, J.; Contreras, E.; Pimentel, R.; Aguilar, C.; Polo, M.J. Challenges for the Use of Seasonal Forecasts in Mediterranean Mountain Areas in 2020. In Proceedings of the SnowHydro 2020/International Conference on Snow Hydrology, Challenges in Mountain Areas, Bolzano, Italy, 28–31 January 2020. [Google Scholar]
- Heo, J.-H.; Ahn, H.; Shin, J.-Y.; Rodding Kjeldsen, T.; Jeong, C. Probability Distributions for a Quantile Mapping Technique for a Bias Correction of Precipitation Data: A Case Study to Precipitation Data Under Climate Change. Water 2019, 11, 1475. [Google Scholar] [CrossRef]
- Crochemore, L.; Ramos, M.-H.; Pappenberger, F. Bias correcting precipitation forecasts to improve the skill of seasonal streamflow forecasts. Hydrol. Earth Syst. Sci. 2016, 20, 3601–3618. [Google Scholar] [CrossRef]
- Polo, M.J.; Herrero, J.; Pimentel, R.; Pérez-Palazón, M.J. The Guadalfeo Monitoring Network (Sierra Nevada, Spain): 14 years of measurements to understand the complexity of snow dynamics in semiarid regions. Earth Syst. Sci. Data 2019, 11, 393–407. [Google Scholar] [CrossRef]
- Herrero, J.; Aguilar, C.; Millares, A.; Polo, M.J. WiMMed Manual de Usuario v1.1. Grupo de Dinámica Fluvial e Hidrología; Universidad de Córdoba: Andalusia, Spain, 2011. [Google Scholar]
- Polo, M.J.; Herrero, J.; Aguilar, C.; Millares, A.; Moñino, A.; Nieto, S.; Losada, M.A. WiMMed, a Distributed Physically-Based Watershed Model (I): Description and Validation. In Theorical, Experimental and Computational Solutions, Proceedings of the International Workshop on Environmental Hydraulics 09, Valencia, Spain, 28–29 October 2009; Taylor & Francis: Valencia, Spain, 2009; pp. 225–228. [Google Scholar]
- Herrero, J.; Millares, A.; Aguilar, C.; Egüen, M.; Losada, M.A.; Polo, M.J. Coupling Spatial And Time Scales in the Hydrological Modelling of Mediterranean Regions: WiMMed. CUNY Academic Works. 2014. Available online: https://academicworks.cuny.edu/cc_conf_hic/315/ (accessed on 18 November 2019).
- Polo, M.J.; Jurado, A.; Contreras, E.; Herrera, E.; Herrero, J.; Mysiak, J.; Calliari, E.; Del Piazzo, E.; Tornato, A.; Mazzoli, P.; et al. Climate Forecast Enabled Knowledge Services. D2.1. Forum Activity Report I. 2018. Available online: https://drive.google.com/file/d/1a1Hu2EC7dHDkx3hQGmuznReFh7SJCLYi/view (accessed on 12 February 2019).
- Lee, H.-Y.; Wanga, N.-J. Cloud-based enterprise resource planning with elastic model–view–controller architecture for Internet realization. Comp. Stand. Interf. 2019, 64, 11–23. [Google Scholar] [CrossRef]
- Buizer, J.; Jacobs, K.; Cash, D. Making short-term climate forecasts useful: Linking science and action. Proc. Natl. Acad. Sci. USA 2016, 113, 4597–4602. [Google Scholar] [CrossRef]
- Bruno, M.; Dessai, S. Exploring the use of seasonal climate forecast in Europe through expert elicitation. Clim. Risk Manag. 2015, 10, 8–16. [Google Scholar] [CrossRef]
- Maraun, D. Nonstationarities of regional climate model biases in European seasonal mean temperature and precipitation sums. Geophys. Res. Lett. 2012, 39, L06706. [Google Scholar] [CrossRef]
© 2020 by the authors. Licensee MDPI, Basel, Switzerland. This article is an open access article distributed under the terms and conditions of the Creative Commons Attribution (CC BY) license (http://creativecommons.org/licenses/by/4.0/).