Wind Turbines with Truncated Blades May Be a Possibility for Dense Wind Farms


1
Department of Mechanical Science and Engineering, University of Illinois, Urbana, IL 61801, USA
2
Department of Mechanical Engineering, The University of Texas at Dallas, Richardson, TX 75080, USA
3
Department of Aerospace Engineering, University of Illinois, Urbana, IL 61801, USA
4
Department of Civil and Environmental Engineering, University of Illinois, Urbana, IL 61801, USA
*
Author to whom correspondence should be addressed.
Energies 2020, 13(7), 1810; https://doi.org/10.3390/en13071810
Submission received: 17 March 2020
/
Revised: 31 March 2020
/
Accepted: 3 April 2020
/
Published: 9 April 2020
(This article belongs to the Special Issue Fluid Mechanics and Turbulence in Wind Farms)
Abstract
:We experimentally explored the impact of a wind turbine with truncated blades on the power output and wake recovery, and its effects within arrays of standard units. The blades of the truncated turbine covered a fraction of the outer region of the rotor span and replaced with a zero-lift structure around the hub, where aerodynamic torque is comparatively low. This way, the incoming flow around the hub may be used as a mixing enhancement mechanism and, consequently, to reduce the flow deficit in the wake. Particle image velocimetry was used to characterize the incoming flow and wake of various truncated turbines with a variety of blade length ratios , 0.7, and 1, where L is the length of the working section of the blade of radius R. Power output was obtained at high frequency in each of the truncated turbines, and also at downwind units within arrays with streamwise spacing of 5, and 6, with being the turbine diameter. Results show that the enhanced flow around the axis of the rotor induced large-scale instability and mixing that led to substantial power enhancement of wind turbines placed 4 downwind of the truncated units; this additional power is still relevant at 6. Overall, the competing factors defined by the expected power reduction of truncated turbines due to the decrease in the effective blade length, the need for reduced components of the truncated units, and enhanced power output of downwind standard turbines suggest a techno-economic optimization study for potential implementation.
1. Introduction
Wind energy has received substantial attention in the past few decades due to its potential as a renewable energy resource. It has multiplied worldwide; in the US, wind energy increased from less than 1% to more than 6% in the last decade [1]. Although wind energy is one of the most competitive options in the portfolio of renewables, the Levelized cost of energy (LCOE) is still higher than traditional energy sources [2].
Particular attention has been placed on improving turbine rotors of full-scale units; investigations have ranged from the use of new materials and composites to the application of flow control strategies aimed at reducing the unsteady loading and increasing their performance. The use of winglets, pitch, and yaw controls have been widely explored as strategies to alter the turbine blade aerodynamic characteristics. Saravanan et al. [3] reported that winglet increases the pressure difference between the windward and leeward surfaces of blades. Tobin et al. [4] experimentally showed that winglets could produce a noticeable increase in the power and thrust coefficients. Recent work by Khaled et al. [5] numerically explored the influence of winglet length and cant angle on the turbine blade performance; they noted the best improvement of power coefficient with a winglet length of 6.32% of the rotor radius and a cant angle of ≈48°. The aerodynamic efficiency of turbine blades and structural loading can be adjusted with changes in the pitch of the blades. Experiments by Nagai et al. [6] on a 3 kW turbine showed that by feathering the pitch angle, structural damage may be significantly reduced even in a typhoon-like conditions. Pitch adjustment is also a way to produce constant power output (e.g., [7]); this is challenging, especially under high winds.
Yaw control has been explored as a mechanism to optimize the bulk power output of a wind farm. For instance, upwind turbines may operate misaligned to the incoming flow direction. This implies reduced power output on the units; however, the wake can be deflected strategically to reduce the impact on downwind turbines. The combined effect may result in higher bulk power production. Numerical work by, e.g., Gebraad et al. [8] noted that yaw control in a wind farm may result in an increase of the power production and reduction of the aerodynamic loads. They applied this concept on a wind plant based on the Princess Amalia Wind Park and obtained an annual energy production increase of . Qian and Ishihara [9] investigated the wake characteristics of a turbine under yaw control and found that high incoming turbulence level reduces the wake deflection. Howland et al. [10] used steering control schemes in a wind farm in Alberta, Canada, and pointed out that the variability of the power generation can be reduced significantly.
Duquette and Visser [11] studied the effect of solidity on untwisted blades, and showed that higher power coefficient may be achieved with higher solidity throughout a wide range of tip-speed ratios. Optimization methods are often used in practice. For instance, Kenway and Martins [12] showed a possible 3–4% increase in the power output using the optimum blade shape determined by a multidisciplinary design feasible (MDF) approach, and Clifton-Smith and Wood [13] employed a differential evolution method focusing on improving the turbine starting performance. Other multi-criteria design methods aim to solve an optimization problem of minimizing blade vibration and maximizing the output power under the constraint of sufficient blade structure stability [14,15,16,17].
The size of wind-turbine rotors has undergone a monotonic increase over time, which poses new engineering challenges. The blades are the second most expensive component of a wind turbine, with approximately 20% of the total construction cost of a utility-scale unit [18,19]. Innovative rotor blade designs considering a balance between manufacture cost and efficiency are crucial for this growing industry. Here, we propose a new concept of a wind-turbine rotor that does not use the flow around the hub. The lift-producing section is left in the outer part of the rotor, where most of the torque is generated. The associated reduction in efficiency resulting from this strategy may promote faster flow recovery in the wake. This can be particularly beneficial in wind farms, where energy is mostly supplemented from above.
2. Experimental Setup
Horizontal-axis model wind turbines with truncated rotors sharing the same bulk diameter, but different effective blade lengths were operated in the Eiffel-type wind tunnel at the Talbot laboratory of University of Illinois at Urbana-Champaign. The test section of the wind tunnel has dimension of 0.914 m wide, 0.45 m high, and 6.1 m long. The ceiling can be adjusted along the test section, which was set to produce a nearly zero pressure gradient during this experimental study. More details of the facility can be found in Adrian et al. [20].
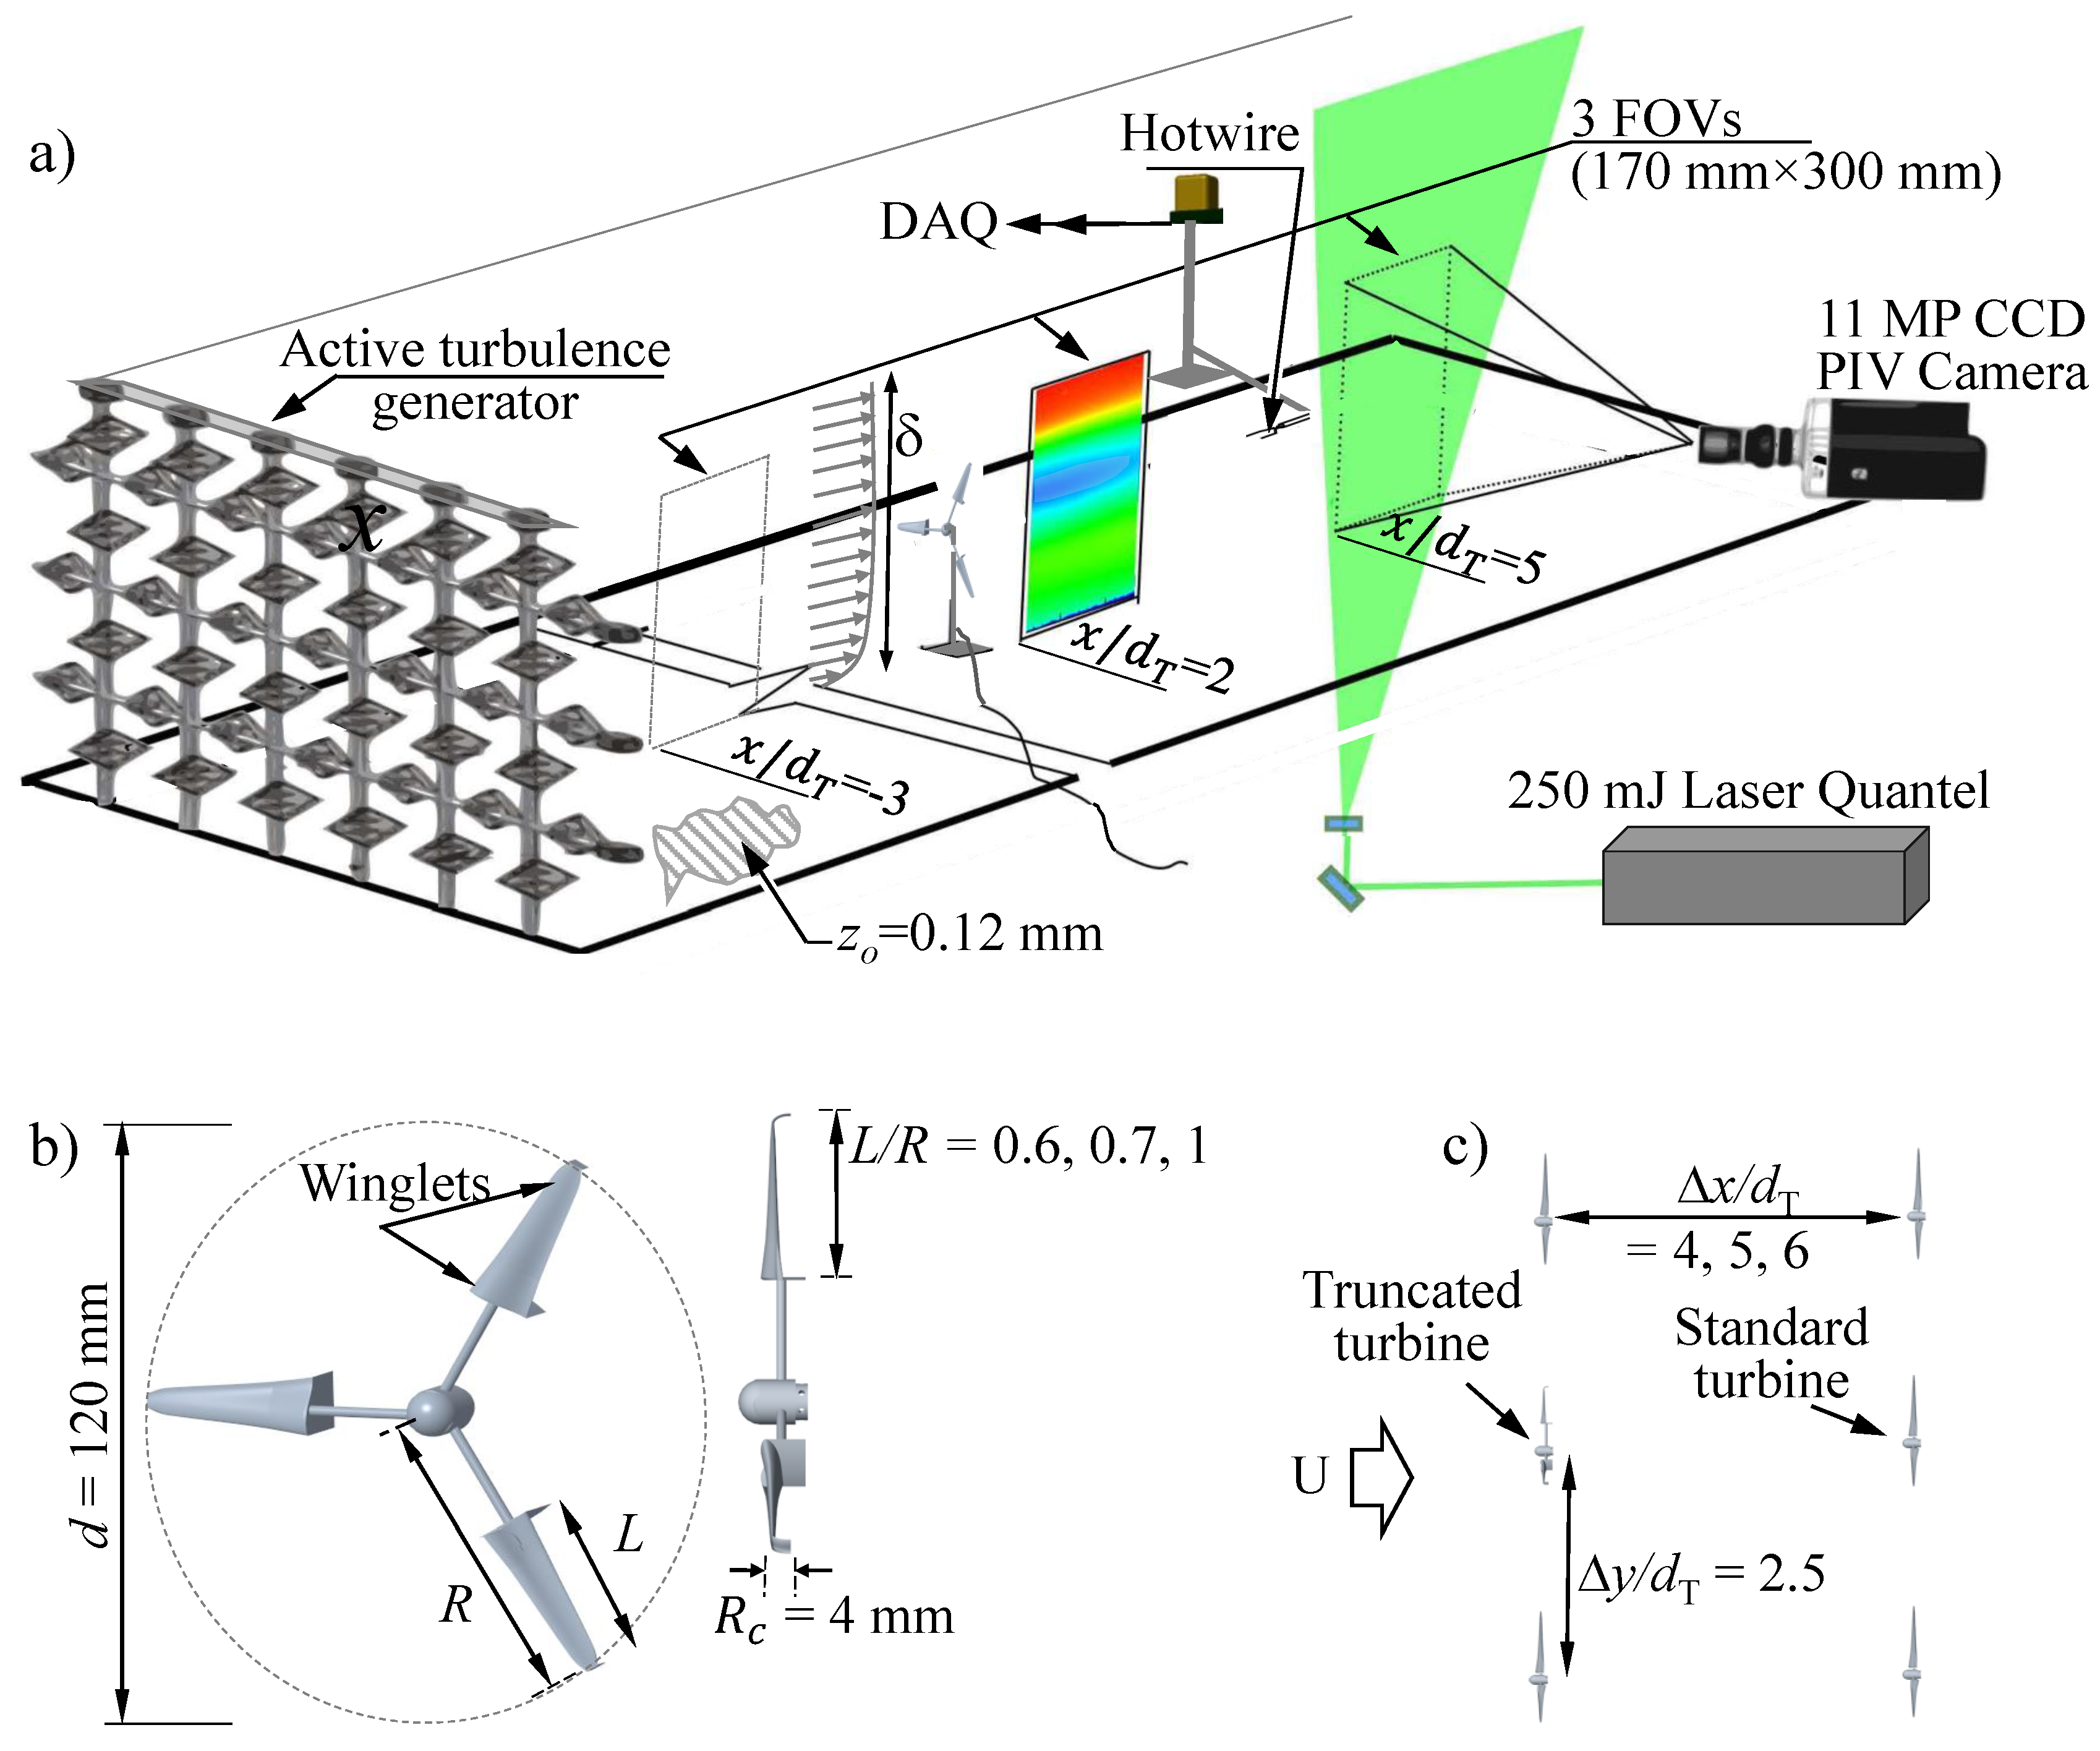
The truncated rotors had blades with lift-producing sections restricted to the outer region, where the torque is higher. In the vicinity of the hub, the airfoil section of a blade was replaced with a structure that did not produce net lift; it allowed the incoming flow to inject momentum to the wake. The rotor investigated had blade length ratios of , 0.7, and 1, where L is the length of the blade that produced lift and R is the rotor radius. Winglets were added to both tips of the lift-producing sections to reduce negative end effects [4]; see figure general setup and details of the rotors in Figure 1. The rotors were printed at the rapid-prototyping laboratory located at University of Illinois using an Objet Vero material. Geometry of the rotor is chosen to match with the model turbine designed at Sandia National Laboratory [21,22] for the case. Precision Microdrives 112-001 12 mm core DC Motors were used in all model turbines as loading system to control their angular velocity, , set to give a tip-speed ratio of = 5 for the full-blade model (hereon base case), 4.2 for the rotor and 3.5 for the case. In the configurations inspected, the load on the turbines were kept constant; the values of for the three cases are relatively comparable with ≈80% and ≈70% of that of the base case. See Tobin et al. [4] for more details on the base case.
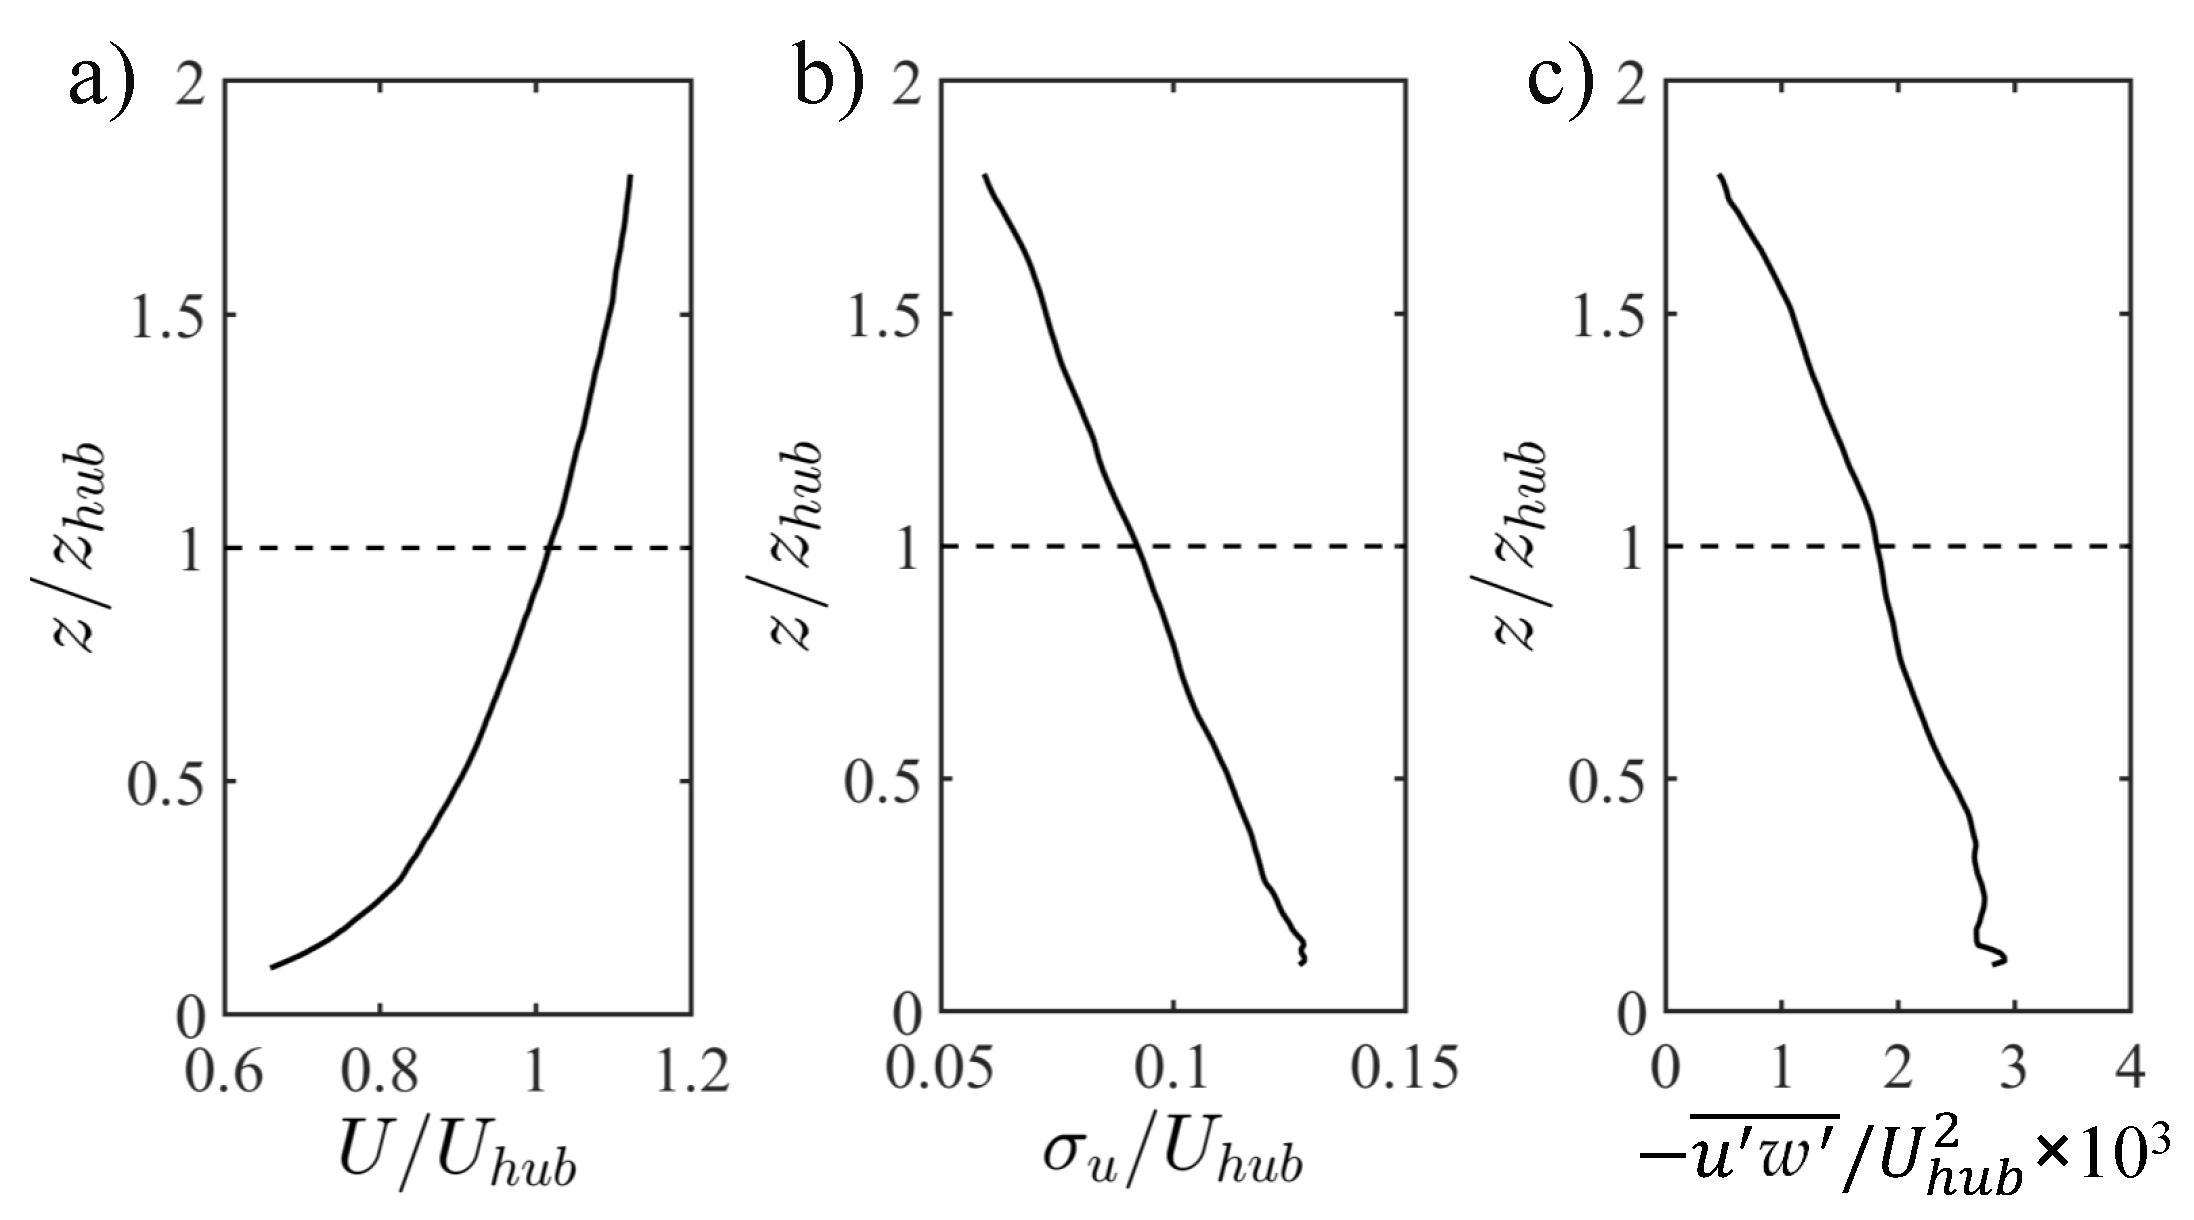
High incoming turbulence was induced with an active turbulence generator (TG) placed at the test section entrance. The TG consists of three horizontal and eight vertical rods. Independent electric stepper motors are used to rotate the rods at a frequency of 0.1 Hz with random direction changes; additional information of the TG setup can be found in Jin et al. [23]. The resulting turbulence structure contained a well-developed inertial subrange spanning approximately two decades [24]. Surface roughness was also added to promote the development of the turbulent boundary layer (TBL); it consisted of 5 mm bulk diameter chains placed in the spanwise direction every 0.2 m along the test section [25]. The resulting TBL had a friction velocity of 0.55 m , with roughness length of 0.12 mm, and thickness 2, where = 0.12 m is the hub height of the model turbines. The turbulence intensity / at the turbine hub height resulted , where = 8.65 m is the mean incoming velocity at that location. The resulting Reynolds number based on rotor diameter = 0.12 m was = 6.9 . Basic details of the incoming TBL are illustrated in Figure 2.
The incoming flow and wake statistics along the central axis of single, truncated turbines were characterized using a planar particle image velocimetry (PIV) system from TSI in three distinct fields of view (FOVs). The FOVs covered regions of approximately 240 mm × 340 mm ( and ) and were located at , [2.3, 4] and [5.3, 7]. The coordinate system is defined here with the origin at the wall and coincident with the rotor plane.
A 250 mJ/pulse double-pulsed laser (Quantel) was used to create a 1-mm thick laser sheet to illuminate the FOVs of the PIV, where the flow was seeded with 1 m olive oil droplets. Two thousand image pairs were collected for each experimental case at a frequency of 4 Hz using a 16-bit frame-straddling 8 MP (3312 pixels × 2488 pixels) CCD camera. A recursive cross-correlation method provided in Insight 4G (version 11) software package from TSI was used to interrogate the image pairs. The final interrogation window was 24 × 24 pixels in size and had a 50% overlap. High-quality vector fields with more than 95% valid vectors and a grid spacing of 1.3 mm resulted from this process.
Complementary single-point, high-frequency flow measurements in the wake of single, truncated turbines along the rotor axis were taken with hotwire anemometer within every . Negligible voltage drift from the data acquisition system was ensured by comparing the calibrations of the hotwire at the beginning and the end of the experiments. Automatic motions of the probe were controlled with a two-dimensional Velmex traversing system. A Dantec dynamic system was connected to the hotwire for sampling the sensor voltage signature at a rate of 10 kHz for periods of 60 s. The laboratory temperature was maintained at °C during the measurements to minimize the thermal drift of the voltage signals.
Mean power output and fluctuations were obtained in each of the truncated turbines, and at downwind units within arrays with streamwise spacing of 5 and 6, and spanwise spacing of (Figure 1c). The power output was obtained from a USB-1608HS datalogger for sampling periods of 120 s at a frequency of 1 kHz. Power was measured from a NI data acquisition (DAQ) system; it was obtained from the applied voltage and the resistance across the terminals of the generators.
3. Results and Discussion
In this section, we present and discuss the distinct influence of turbine blade length ratio on the structure and statistics of the wake and associated power output of the units.
3.1. Wake Characteristics
The truncated blade induced distinct dynamics in the wake dominated by relatively large-scale instability that led to the development of energetic coherent vortices at heights coincident with the inner tips, as illustrated in the snapshot of swirling strength field in Figure 3. The is the magnitude of the imaginary part of the complex eigenvalues of the velocity gradient tensor [26], as shown in Equation (1). There, , and are the eigenvectors corresponding to the real eigenvalue, , and a pair of complex conjugate eigenvalues, and , respectively. The sign of indicates the orientation of the swirl [27].
The particular wake dynamics induced by the blade length ratio, , resulted in faster flow recovery in the wake to the standard turbine. This is first evaluated with the time-averaged streamwise velocity shown in Figure 4. It includes the wake for the and 0.7 rotors and that for the base case, i.e., standard turbine or . By removing the lift-producing mechanism on the blades, the wake experienced noticeable changes, which are significant in the near field. There is a jet-like flow that diffused in the radial direction. This is better illustrated with selected profiles of the velocity difference at , 3.8, and 6 in Figure 5. The flow in the near wake is recovered substantially with the two truncated rotors. It is worth noting that the impact of the momentum injection in the case is still noticeable at the intermediate wake (Figure 5c). The flow recovery at the hub height shown in Figure 6 offers a complementary insight into the effect of the blade truncation along the streamwise distance. The additional jet-like flow may be particularly useful in wind farms with dense turbine arrangements as well as in heterogeneous rotors and hub heights.
The bulk dynamics of the wake is quantified with the turbulence kinetic energy distribution shown in Figure 7; here, and are the velocity fluctuations in streamwise and vertical directions. This quantity illustrates the strong influence of the blade length ratio on the levels of velocity fluctuations in the wake. It is worth stressing that a reduction of the flow fluctuations of scales larger than the rotor has a positive impact on downwind turbines as indicated in Chamorro et al. [28]; then, truncated rotors may produce reduced unsteady loading on other units when placed within an array. Please note that the secondary peak of around the hub height that merges with the primary peak at the top tip of the base case (Figure 7c), which results in maximum levels at 4–5, which does not occur in the cases with . Selected vertical profiles at the same locations to those of the mean velocity are shown in Figure 8. The turbulence levels of the rotors appeared relatively constant up to approximately the top tip height; the enhanced levels there diffused with downwind distance. The profiles illustrate the noticeable reduction of in the intermediate wake. The kinematic shear stress distribution shown in Figure 9 further illustrates the distinctive effect of the blade length ratio on the wake dynamics. It is worth pointing out the two minor peaks near the hub height within for the cases with (see the rectangular region in Figure 9b), which is modulated by the mean shear changes triggered by the blade gap close to the rotor center, which also causes the generation of energetic coherent structures shown in Figure 3. The mean shear is stronger in the near wake and diffuses notoriously by . These changes are better illustrated in the profiles of Figure 10; the near-distribution is substantially different from that of a standard turbine.
A basic assessment of the representative scales in the wake can be obtained through the integral time scale, , defined as:
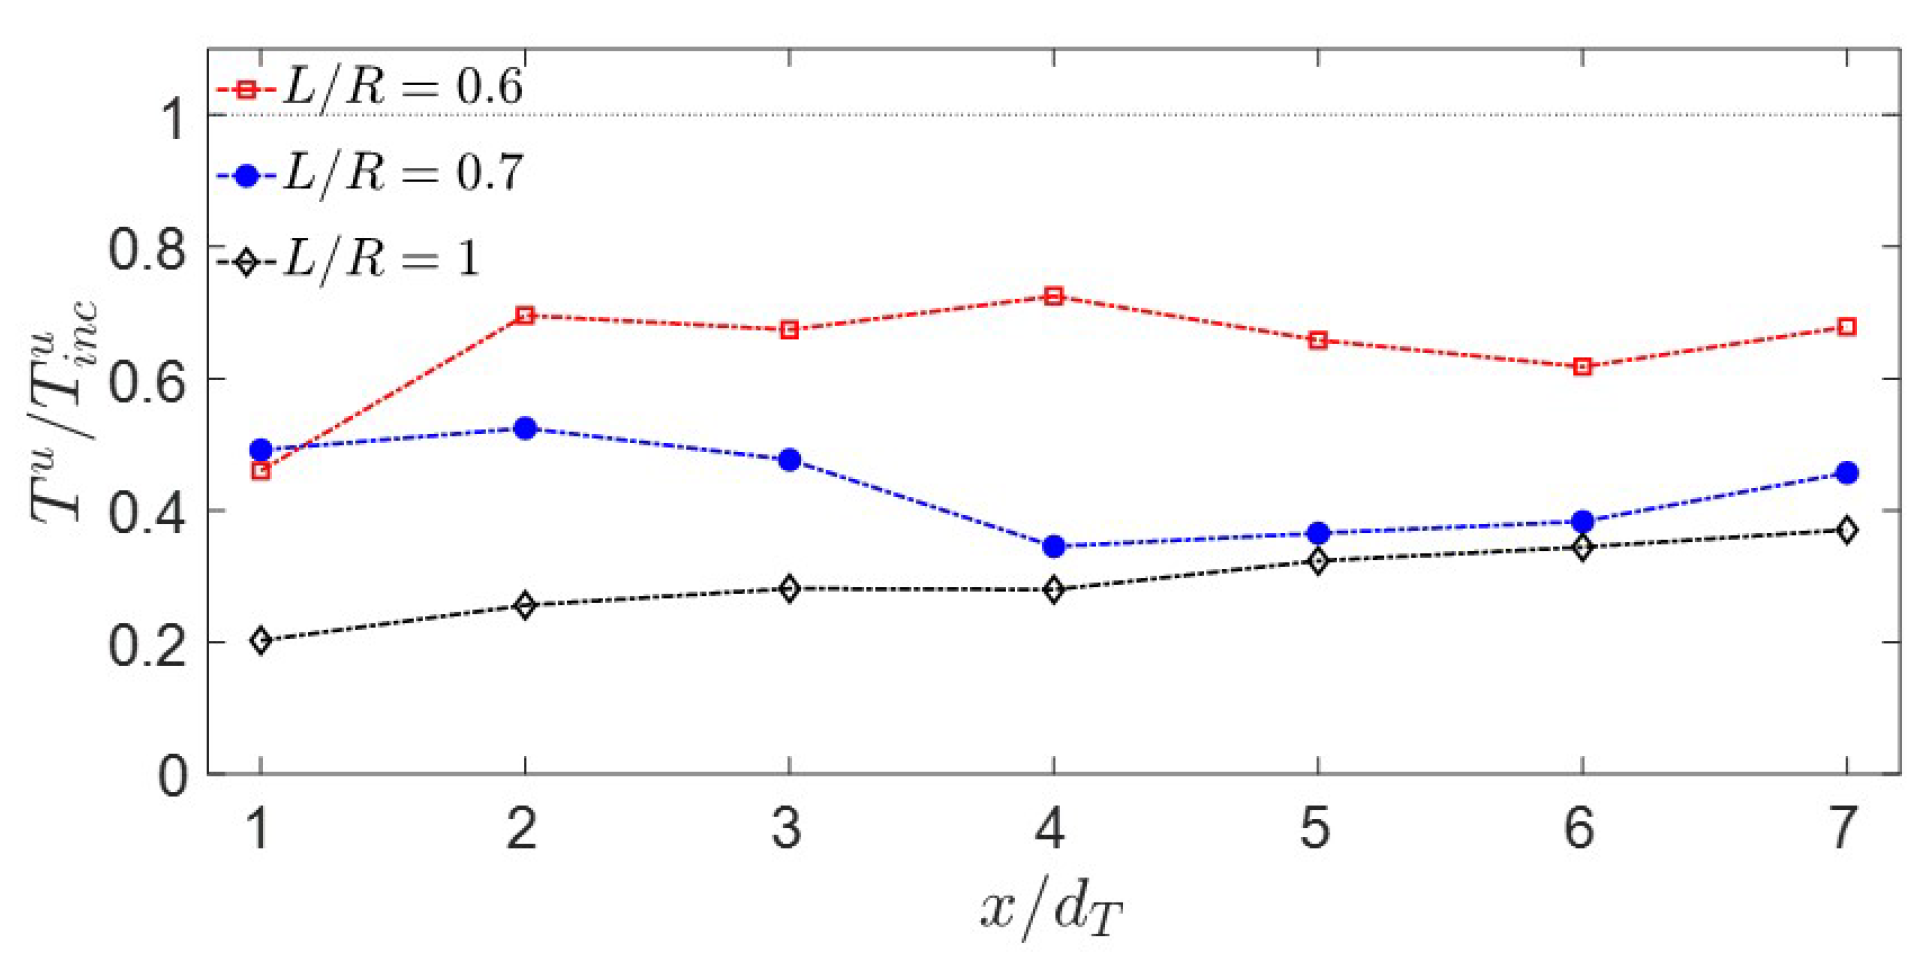
where is the time lag, and is the streamwise velocity variance. For practical purposes, Equation (2) is evaluated up to a time lag where is sufficiently low [29]; here, the low threshold is taken at for all interrogated locations. The modulation of on along the axis of the rotor, normalized with respect to that of the incoming flow , is shown Figure 11. In general, the integral time scale distribution reveals the strong influence of the blade length ratio on the large-scale motions; increased with reduced . Interestingly, the largest of the truncated rotor within the distance investigated (up to ) was located in the very near wake (). The turbine exhibited minor changes of throughout the streamwise location interrogated. The change of the integral length scale with may indicate a redistribution of the turbulent energy across a frequency band relevant for the unsteady loading and power output fluctuations of the turbines [30].
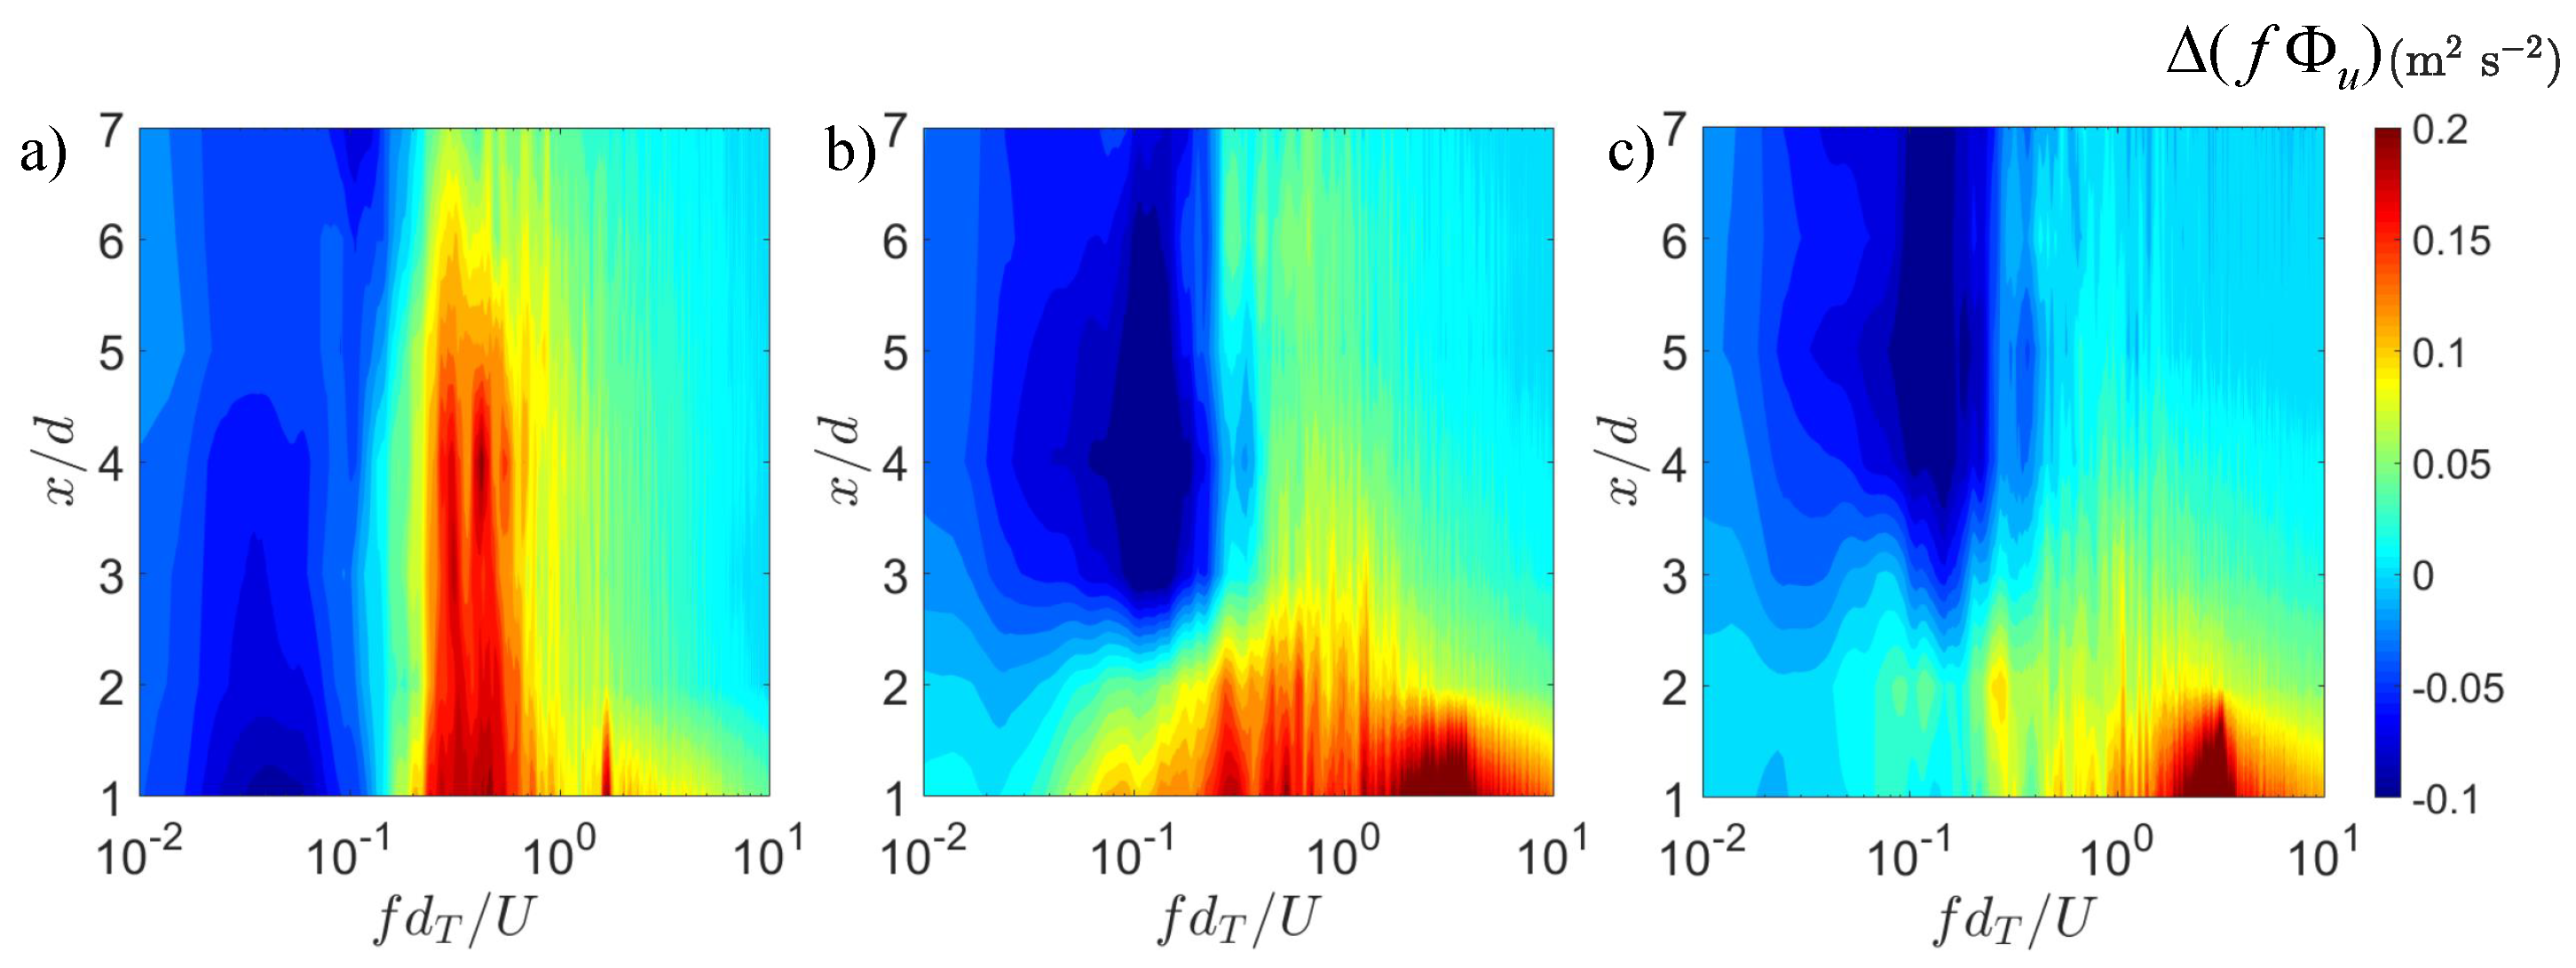
The expected redistribution of the energy content in the wake of each truncated rotor to that of the incoming flow is evident in Figure 12 with the difference between the compensated velocity spectra of the wake and incoming turbulence at hub height, i.e., along the streamwise distance. The alters the turbulence energy distribution across relevant frequencies and along the wake ().
3.2. Effect of Blade Length Ratio on the Power Output
Insight on the influence of blade length ratio on the turbine performance can be obtained with the mean power, , and structure of the power fluctuations () of the turbines in each of the cases. The mean power of the turbine was , where is the mean power of the base case (standard turbine, ); the power of the turbine resulted . Reduction in the swept area and local inner tip effects are mainly responsible for the power decrease of the truncated units. The truncated rotors also exhibited reduced power fluctuations, as indicated in the spectral distribution, , shown in Figure 13. The reduction of power fluctuations was monotonic with a reduction of and occurred across the frequency range.
The changes in the wake dynamics induced by the truncated turbines are expected to produce a positive impact on standard turbines placed downwind of the truncated units. In light of the mean velocity distributions discussed earlier, a truncated turbine may offer benefits in dense arrays. To illustrate this phenomenon, we measured the power of a standard turbine () downwind of a truncated unit, both located at the central row of a wind farm; see basic schematic in Figure 1c. The power output of the interrogated turbine was obtained in 9 scenarios, namely turbine arrays with three streamwise turbine separations (, 5 and 6) and three types of upwind turbines (, 0.7 and 1). These scenarios are summarized in Figure 14. It is worth noting the comparatively significant power increase with a change from the to of the upwind turbine regardless of the array layout. Note also that the power gain of the downwind turbine decreased non-linearly with the turbine separation; this is particularly relevant for dense turbine arrays.
4. Conclusions
The truncated rotors produced a jet-like flow in the wake that induced relatively large-scale instability and generated distinct small-scale vorticial motions. As a result, the mean flow in the wake increased with increasing blade length ratio (); the mean shear and turbulence levels reduced with increasing , and the vertical profiles of the Reynolds shear stress exhibited local minimum and maximum in the near wake induced by the relatively high shear at heights coincident with the inner tips. The mean power reduced significantly with increased . However, standard turbines placed downwind of the truncated counterparts produced more power than those in the wake of other standard units. The relative power gain of the downwind units increased non-linearly with reduced inter-turbine separations. In the content of a wind farm, there are various competing factors that determine the potential benefit of this strategy. Indeed, the reduced power production of truncated turbines may be compensated with the reduced need for structural and electro-mechanical components as well as with the enhanced power output of downwind turbines. These competing factors suggest a techno-economic optimization study for potential implementation; within this approach, different rotor sizes and hub heights are factors worth being considered. Future work will focus on the characterization of various parameters in a wind-farm context including the aforementioned rotor and hub height variability as well as topographic modulation and the role of relative position of a truncated turbine.
Author Contributions
S.C. and Y.J. performed the experiments, processed the data and drafted the manuscript; L.P.C. defined the concept, analysis and edited the manuscript. All authors have read and agree to the published version of the manuscript.
Funding
The authors greatly appreciate the research support from Bruce G. Koe.
Conflicts of Interest
The authors declare no conflict of interest.
References
- Electricity in the United States—Energy Explained, Your Guide To Understanding Energy (EIA, 2019). Available online: https://www.eia.gov/energyexplained/index.cfm?page=electricity_in_the_united_states (accessed on 1 March 2020).
- Cost and Performance Characteristics of New Generating Technologies, Annual Energy Outlook 2019. U.S. Energy Information Administration. Available online: https://www.eia.gov/outlooks/aeo/assumptions/pdf/table_8.2.pdf (accessed on 1 March 2020).
- Saravanan, P.; Parammasivam, K.M.; Rajan, S. Pressure distribution of rotating small wind turbine blades with winglet using wind tunnel. J. Sci. Ind. Res. 2012, 71, 425–429. [Google Scholar]
- Tobin, N.; Hamed, A.; Chamorro, L. An Experimental Study on the Effects ofWinglets on the Wake and Performance of a ModelWind Turbine. Energies 2015, 8, 11955–11972. [Google Scholar] [CrossRef] [Green Version]
- Khaled, M.; Ibrahim, M.M.; Hamed, H.E.A.; AbdelGwad, A.F. Investigation of a small Horizontal–Axis wind turbine performance with and without winglet. Energy 2019, 187, 115921. [Google Scholar] [CrossRef]
- Nagai, B.M.; Ameku, K.; Roy, J.N. Performance of a 3 kW wind turbine generator with variable pitch control system. Appl. Energy 2009, 86, 1774–1782. [Google Scholar] [CrossRef]
- Muljadi, E.; Butterfield, C.P. Pitch-controlled variable-speed wind turbine generation. IEEE Trans. Ind. Appl. 2001, 37, 240–246. [Google Scholar] [CrossRef] [Green Version]
- Gebraad, P.; Thomas, J.J.; Ning, A.; Fleming, P.; Dykes, K. Maximization of the annual energy production of wind power plants by optimization of layout and yaw-based wake control. Wind Energy 2017, 20, 97–107. [Google Scholar] [CrossRef] [Green Version]
- Qian, G.; Ishihara, T. A new analytical wake model for yawed wind turbines. Energies 2018, 11, 665. [Google Scholar] [CrossRef] [Green Version]
- Howland, M.F.; Lele, S.K.; Dabiri, J.O. Wind farm power optimization through wake steering. Proc. Natl. Acad. Sci. USA 2019, 116, 14495–14500. [Google Scholar] [CrossRef] [PubMed] [Green Version]
- Duquette, M.M.; Visser, K.D. Numerical implications of solidity and blade number on rotor performance of horizontal-axis wind turbines. J. Sol. Energy Eng. 2003, 125, 425–432. [Google Scholar] [CrossRef]
- Kenway, G.; Martins, J. Aerostructural shape optimization of wind turbine blades considering site-specific winds. In Proceedings of the 12th AIAA/ISSMO Multidisciplinary Analysis and Optimization Conference, Victoria, BC, Canada, 10–12 September 2008; p. 6025. [Google Scholar]
- Clifton-Smith, M.; Wood, D. Further dual purpose evolutionary optimization of small wind turbine blades. J. Phys. Conf. Ser. 2007, 75, 012017. [Google Scholar] [CrossRef]
- Jureczko, M.; Pawlak, M.; Mężyk, A. Optimisation of wind turbine blades. J. Mater. Process. Technol. 2005, 167, 463–471. [Google Scholar] [CrossRef]
- Wang, L.; Tang, X.; Liu, X. Blade design optimisation for fixed-pitch fixed-speed wind turbines. ISRN Renew. Energy 2012, 2012, 682859. [Google Scholar] [CrossRef] [Green Version]
- Tenghiri, L.; Khalil, Y.; Abdi, F.; Bentamy, A. Optimum design of a small wind turbine blade for maximum power production. IOP Conf. Ser. Earth Environ. Sci. 2018, 161, 012008. [Google Scholar] [CrossRef]
- Hassanzadeh, A.; Hassanabad, A.H.; Dadvand, A. Aerodynamic shape optimization and analysis of small wind turbine blades employing the Viterna approach for post-stall region. Alex. Eng. J. 2016, 55, 2035–2043. [Google Scholar] [CrossRef] [Green Version]
- Renewable Energy Technologies: Cost Analysis Series, Issue 5/5: Wind Power, IRENA(2012). Available online: https://www.irena.org/DocumentDownloads/Publications/RE_Technologies_Cost_Analysis-WIND_POWER.pdf (accessed on 1 March 2020).
- Renewable Power Generation Costs in 2018, IRENA(2019). Available online: https://www.irena.org/-/media/Files/IRENA/Agency/Publication/2019/May/IRENA_Renewable-Power-Generations-Costs-in-2018.pdf (accessed on 1 March 2020).
- Adrian, R.J.; Meinhart, C.D.; Tomkins, C.D. Vortex organization in the outer region of the turbulent boundary layer. J. Fluid Mech. 2000, 422, 1–54. [Google Scholar] [CrossRef] [Green Version]
- Shiu, H.; Van Dam, C.; Johnson, E.; Barone, M.; Phillips, R.; Straka, W.; Fontaine, A.; Jonson, M. A design of a hydrofoil family for current-driven marine-hydrokinetic turbines. In Proceedings of the 2012 20th International Conference on Nuclear Engineering and the ASME 2012 Power Conference, Anaheim, CA, USA, 30 July–3 August 2012; pp. 839–847. [Google Scholar]
- Barone, M.F.; Johnson, E.; Fontaine, A.A.; Jonson, M.L.; Meyer, R.S.; Straka, W.A.; van Dam, C.; Shiu, H. A 1: 8.7 Scale Water Tunnel Test of an Axial Flow Water Turbine. In Proceedings of the 1st Marine Energy Technology Symposium, METS13, Washington, DC, USA, 10–11 April 2013; pp. 10–11. [Google Scholar]
- Jin, Y.; Liu, H.; Aggarwal, R.; Singh, A.; Chamorro, L. Effects of freestream turbulence in a model wind turbine wake. Energies 2016, 9, 830. [Google Scholar] [CrossRef] [Green Version]
- Liu, H.; Hayat, I.; Jin, Y.; Chamorro, L. On the evolution of the integral time scale within wind farms. Energies 2018, 11, 93. [Google Scholar] [CrossRef] [Green Version]
- Ohya, Y. Wind-tunnel study of atmospheric stable boundary layers over a rough surface. Bound.-Layer Meteorol. 2001, 98, 57–82. [Google Scholar] [CrossRef]
- Zhou, J.; Adrian, R.J.; Balachandar, S.; Kendall, T. Mechanisms for generating coherent packets of hairpin vortices in channel flow. J. Fluid Mech. 1999, 387, 353–396. [Google Scholar] [CrossRef]
- Wu, Y.; Christensen, K.T. Population trends of spanwise vortices in wall turbulence. J. Fluid Mech. 2006, 568, 55–76. [Google Scholar] [CrossRef] [Green Version]
- Chamorro, L.P.; Lee, S.J.; Olsen, D.; Milliren, C.; Marr, J.; Arndt, R.; Sotiropoulos, F. Turbulence effects on a full-scale 2.5 MW horizontal-axis wind turbine under neutrally stratified conditions. Wind Energy 2015, 18, 339–349. [Google Scholar] [CrossRef]
- Chamorro, L.; Hill, C.; Morton, S.; Ellis, C.; Arndt, R.; Sotiropoulos, F. On the interaction between a turbulent open channel flow and an axial-flow turbine. J. Fluid Mech. 2013, 716, 658–670. [Google Scholar] [CrossRef]
- Chamorro, L.P.; Guala, M.; Arndt, R.E.A.; Sotiropoulos, F. On the evolution of turbulent scales in the wake of a wind turbine model. J. Turbul. 2012, 13, 1–13. [Google Scholar] [CrossRef]
Figure 1.
(a) Basic schematic of the experimental setup illustrating the PIV locations; (b) details of the modified rotors with the lift-producing section restricted to the outer part of the rotor highlighting the winglets at both ends; (c) diagram of the turbine array with a truncated unit.
Figure 1.
(a) Basic schematic of the experimental setup illustrating the PIV locations; (b) details of the modified rotors with the lift-producing section restricted to the outer part of the rotor highlighting the winglets at both ends; (c) diagram of the turbine array with a truncated unit.

Figure 2.
Characteristics of the incoming turbulent boundary layer. (a) Mean velocity , (b) turbulence intensity /, and (c) kinematic shear stress . The horizontal, dashed line indicates the hub height location of the turbine rotor.
Figure 2.
Characteristics of the incoming turbulent boundary layer. (a) Mean velocity , (b) turbulence intensity /, and (c) kinematic shear stress . The horizontal, dashed line indicates the hub height location of the turbine rotor.

Figure 3.
Instantaneous swirling strength in the near wake of the truncated rotor. The horizontal-dashed lines indicate the inner tips.
Figure 3.
Instantaneous swirling strength in the near wake of the truncated rotor. The horizontal-dashed lines indicate the inner tips.

Figure 4.
Mean velocity distribution, , in the central plane for the turbines with blade length ratios of (a) 0.6, (b) 0.7, and (c) 1.
Figure 4.
Mean velocity distribution, , in the central plane for the turbines with blade length ratios of (a) 0.6, (b) 0.7, and (c) 1.

Figure 5.
Profiles of the normalized streamwise velocity difference, , for the turbines with rotors , 0.7 and 1 at (a) 2.6, (b) 3.8 and (c) 6.
Figure 5.
Profiles of the normalized streamwise velocity difference, , for the turbines with rotors , 0.7 and 1 at (a) 2.6, (b) 3.8 and (c) 6.

Figure 6.
Mean velocity distributions along the turbine rotor axis (hub height) for the rotors with 0.6, 0.7, and 1.
Figure 6.
Mean velocity distributions along the turbine rotor axis (hub height) for the rotors with 0.6, 0.7, and 1.

Figure 7.
Turbulence kinetic energy, , for the cases with the turbine (a) ; (b) ; (c) .

Figure 8.
Profiles of the turbulence kinetic energy, , for the turbines with rotors , 0.7 and 1 at (a) 2.6, (b) 3.8 and (c) 6.
Figure 8.
Profiles of the turbulence kinetic energy, , for the turbines with rotors , 0.7 and 1 at (a) 2.6, (b) 3.8 and (c) 6.

Figure 9.
Kinematic shear stress for the cases with the turbine (a) ; (b) ; (c) .

Figure 10.
Profiles of the kinematic shear stress, , for the turbines with rotors , 0.7 and 1 at (a) 2.6, (b) 3.8 and (c) 6.
Figure 10.
Profiles of the kinematic shear stress, , for the turbines with rotors , 0.7 and 1 at (a) 2.6, (b) 3.8 and (c) 6.

Figure 11.
Integral time scale distribution normalized by that of the incoming flow along the rotor axis for various .
Figure 11.
Integral time scale distribution normalized by that of the incoming flow along the rotor axis for various .

Figure 12.
Difference of the compensated velocity spectra between the wake and incoming flow for the (a) 1, (b) 0.7 and (c) 0.6 rotors at the central plane of the wake within .
Figure 12.
Difference of the compensated velocity spectra between the wake and incoming flow for the (a) 1, (b) 0.7 and (c) 0.6 rotors at the central plane of the wake within .

Figure 13.
Power output spectra of turbines with various blade length ratios. The subplot shows the standard deviation of power output.
Figure 13.
Power output spectra of turbines with various blade length ratios. The subplot shows the standard deviation of power output.

Figure 14.
Mean power output () of a standard turbine () downwind of a truncated turbine located at the central row of a wind farm. is the mean power of the isolated base case.
Figure 14.
Mean power output () of a standard turbine () downwind of a truncated turbine located at the central row of a wind farm. is the mean power of the isolated base case.

© 2020 by the authors. Licensee MDPI, Basel, Switzerland. This article is an open access article distributed under the terms and conditions of the Creative Commons Attribution (CC BY) license (http://creativecommons.org/licenses/by/4.0/).
Share and Cite
MDPI and ACS Style
Cheng, S.; Jin, Y.; Chamorro, L.P. Wind Turbines with Truncated Blades May Be a Possibility for Dense Wind Farms. Energies 2020, 13, 1810. https://doi.org/10.3390/en13071810
AMA Style
Cheng S, Jin Y, Chamorro LP. Wind Turbines with Truncated Blades May Be a Possibility for Dense Wind Farms. Energies. 2020; 13(7):1810. https://doi.org/10.3390/en13071810
Chicago/Turabian StyleCheng, Shyuan, Yaqing Jin, and Leonardo P. Chamorro. 2020. "Wind Turbines with Truncated Blades May Be a Possibility for Dense Wind Farms" Energies 13, no. 7: 1810. https://doi.org/10.3390/en13071810
Note that from the first issue of 2016, this journal uses article numbers instead of page numbers. See further details here.