Article

An Experimental Investigation of the External Wind Effects on the Ceiling Temperature Distribution of Fire-Induced Thermal Flow in a Corridor Connected to a Compartment

State Key Laboratory of Fire Science, University of Science and Technology of China, Hefei 230026, China
*
Author to whom correspondence should be addressed.
Energies 2020, 13(7), 1826; https://doi.org/10.3390/en13071826
Submission received: 11 March 2020 / Revised: 26 March 2020 / Accepted: 3 April 2020 / Published: 9 April 2020

Abstract

:
Fire-induced thermal flow is the greatest threat to trapped people and the heat-resistant quality of building structures. This paper presents an experimental investigation of the effects of external wind on the ceiling temperature distribution of fire-induced thermal flow in a one-sixth scale corridor connected to a compartment. In the experiments, the fire source was placed in the compartment with hot thermal flow spilled into the connected corridor. The heat release rate (HRR) was changed from 10 to 20 kW and the external wind velocity was changed from 0 to 2.09 m/s. The ends of the corridor could be adjusted to be fully or partially open to the environment with dam-boards arranged at the ends of the corridor. An effective corridor HRR, Qcorridor, was defined to account for the amount of the spilled plume into the corridor. Results show that the temperature under the ceiling changed in a non-monotonic way with wind velocity: it first increased and then decreased with wind velocity. It was revealed that the dam-boards at the corridor opening had an evidently shielding effect, leading to higher temperature compared to the fully open environment. Finally, uniform correlations are proposed for predicting the attenuation law of ceiling temperature profiles in corridors for different wind conditions.

1. Introduction

Smoke and toxic gases are the major factors causing death in fire accidents, and about 85% of deaths in building fires are due to inhalation of toxic fumes [1]. In high-rise buildings there are many long and narrow corridors that connect rooms; as shown in Figure 1, the room–corridor structure is one of the most typical forms of architecture. Once a fire occurs in a room, the smoke can spread quickly through the corridor and into other rooms on the same floor. At the same time, due to the narrow and long structure of corridors, high-temperature smoke can easily accumulate under the ceiling and is difficult to remove quickly, posing a significant threat to any trapped people and the building structure [2,3]. In addition, buildings are usually under the influence of windy environments, and the external wind pressure rises with the height of floors [4]. The smoke movement and temperature distribution in the corridors can be significantly affected by external wind. Therefore, this paper chooses the room–corridor structure shown in Figure 1 as the research object, and systematically studies the effect of external wind on the smoke movement behavior and temperature distribution in a corridor connected to a compartment.
Extensive studies on the smoke movement and temperature distribution in corridor-like structures have been reported previously. Zhao et al. [2] studied the ceiling temperature distribution and critical exhaust volumetric flow rate in a long-distance subway tunnel with a two-point extraction ventilation system, and developed an empirical equation to predict the critical exhaust volumetric flow rate. Gao et al. [5] studied the temperature distribution of fire-induced thermal flow under a tunnel ceiling for different sidewall constraint strength. Ye et al. [6] performed a multi-scale analysis of the hot gas temperature field and the burning behavior in an urban utility tunnel, based on bench-scale, full-scale, and model-scale fire tests. In their study, the two-dimensional gas temperature fields and longitudinal maximum temperature distributions were investigated and the authors proposed a predictive model. With respect to the room–corridor configuration, Ewens [7] studied the evolution of smoke transport in a room–corridor test rig, results showed that as the smoke temperature in the corridor decreased, the residual hydrocarbons were oxidized more thoroughly than CO and smoke particles. Wieczorek [8] pointed out that the entrainment process of the ceiling jets and the initial temperature has a great impact on the smoke distribution. Yang et al. [9] explored the spatial distribution characteristics of toxic and harmful gases in the process of smoke transport in the corridor. However, the influence of external wind velocity was not considered in the above studies. Strong external wind can greatly affect the spread of smoke.
Buildings are always located in a windy environment, and the profile of ambient wind velocity is usually presented by a power law profile of height [10]. When fire occurs, external wind might flow into the compartment or corridor from broken windows. For high-rise buildings, in particular, the wind effect is significant and can play an important role in smoke movement characteristics [11]. Therefore, fire engineers would normally take the influence of external wind into account for high-rise buildings, and such a design may be considered an over-design. In most countries, the cut-off point for high-rise buildings has been set variously between 23 m (75 feet) and 30 m (100 feet), or about seven to ten stories [12]. Chen et al. [11,13] and Huang et al. [14] made earlier efforts to investigate the external wind effect on a compartment fire through experimental works, adopting a 0.6 m cube enclosure with windows open to the environment. Their results showed that the external wind had an obvious influence on the burning strength of the fire in a compartment. Himoto et al. [15] carried out a series of reduced-scale experiments to investigate the thermal behaviors of window spill plume under the influence of external wind, and a model of window plume behavior was developed by adopting a two-dimensional line heat source assumption. With respect to the research relating to the external wind effect on the thermal plume properties in long and narrow corridor-like structures, Li et al. [16] and Ingason et al. [17] carried out two series of model-scale experimental tests to research the maximum temperature beneath a tunnel ceiling with longitudinal ventilation and proposed a widely used predictive correlation. Kurioka et al. [18] proposed an empirical equation to predict the maximum excess gas temperature beneath the tunnel ceiling for relatively larger ventilation wind velocity, which was verified by Hu et al. [19] in their full-scale experiments. Agred et al. [20] conducted a comparative study to characterize the characteristics of fire smoke layers using different methods in ventilated conditions. However, the effects of the external wind on the characteristics of buoyant thermal flow and temperature distribution in a corridor connected to a compartment or a room has rarely been addressed, and the related knowledge is therefore insufficient.
In recent years, the evolution of digital computers has further enhanced the reliance on computational models to better understand and predict the fire phenomenon [21]. Suitable numerical simulation tools have been adopted by researchers and fire engineers to solve the fire-related problems. A well-calibrated numerical model can yield the same results as for a real size building and can easily be generalized. Schrefler et al. [22] successfully exploited an algorithm for the simulation of thermal fluid–structural coupling in a tunnel fire, which was carried out by developing a master code that controlled solvers dedicated to the fluid mechanics and solid mechanics simulation. Moreover, the Fire Dynamics Simulator (FDS) developed by NIST (National Institute of Standards and Technology) was also been used as a computational fluid dynamics model of fire-driven fluid flow [23,24]. However, actual fire scenarios are highly complicated in reality, and numerical models for combustion, radiation, soot production, and pyrolysis, etc., need to be validated for their representation of reality. The approach of physical scale modeling is also an important and effective tool for analyzing specific fire scenarios [16], from which Froude modeling is adopted to ensure that the results can be extrapolated to real size buildings.
Therefore, in this study, by adopting Froude modeling, a series of model-scale experiments were conducted to study the influence of external wind on the buoyant thermal plume behavior and temperature distribution in a corridor connected to a fire compartment. The research results can help us better understand this fire scenario and provide guidance and assistance in improving the engineering application of fire detection and suppression systems.

2. Experimental Procedure

The experiments were conducted in a 1/6th scale building structure with a long corridor connected to a compartment. The approach of physical modeling has been well established and evolved into an effective way to study burning and smoke movement in buildings [5,6]. Froude modeling was adopted to ensure that the results can be extrapolated to real size buildings. The main requirement of Froude modeling is that the Froude number, which characterizes the ratio between inertia and buoyancy forces, is preserved. By keeping the Froude number constant, the transformation relationships between physical scale modeling and real scale building can be given by [16,25]:
Q m Q r = ( l m l r ) 5 / 2
V m V r = ( l m l r ) 1 / 2
T m = T r
where Q is heat release rate (HRR), V is flow velocity, T is temperature, l denotes the length scale, and lm/lr is the scale ratio (1/6 in this work). The subscripts ‘m’ and ‘r’ represent the model and real scale parameters, respectively.
The compartment is 0.6 m long, 0.6 m wide, and 0.6 m high, and is joined to the corridor by a door (0.2 m wide and 0.4 m high). The left side of door is 0.25 m from the end of corridor. The corridor is 3.6 m long, 0.3 m wide, and 0.6 m high. The frame of the corridor and compartment is made from stainless steel with a thickness of 1 mm and covered by 20 mm fireproof board from within. In order to account for different ventilation conditions, the end of the corridor can be changed to be fully or partially open to the environment; in the latter case, both ends of the corridor are covered by a dam-board with a hole (0.4 m high and 0.2 m wide) located in its center. Figure 2 shows the schematic diagram and detailed dimensions of the model-scale building structure.
A 0.1 m square porous gas burner was used as the fire source, which was placed at the center of the compartment, 0.1 m above the floor. Propane was chosen as the fuel; by changing the fuel supply rate, different fire powers can be obtained. The combustion heat of propane was 46.45 kJ/g [26]. In the experiments, 3 increasing HRRs were used (10 kW, 15 kW, and 20 kW). Based on the Froude modeling, the original size of the fire in real scale corresponds to 882 kW, 1323 kW and 1764 kW. As a gas burner was used in this work, the preset heat release rate (HRR) depends on the fuel supply rate and is not affected by external wind. However, external wind through the corridor can affect the amount of thermal plume flowing into the corridor from the fire room. Each test was repeated three times to ensure repeatability.
The temperature field in the corridor was measured by K-type stainless steel-sheathed thermocouples. The diameter of the thermocouple was 1.0 mm. The detailed arrangement of the thermocouples is shown in Figure 3. There were 12 vertical strings of thermocouples in total. The distances between each string and the corridor left opening were 0.06 m, 0.36 m, 0.66 m, 0.96 m, 1.26 m, 1.56 m, 1.86 m, 2.16 m, 2.46 m, 2.76 m, 3.06 m, and 3.36 m, with an interval of 0.3 m. In each string, 6 thermocouples are evenly distributed at distances of 0.01 m, 0.12 m, 0.24 m, 0.36 m, 0.48 m, and 0.59 m under the ceiling of the corridor.
The external wind at the left end of the corridor was generated by a wind tunnel, supplying the screened air flow velocity of 0–5 m/s. The total length of the wind tunnel was 20 m. The test section of the tunnel was 6 m long, 1.8 m wide, and 1.8 m high. In the section, the screened wind was stable with a turbulence intensity of the order of 1%–3%. The schematic diagram of the wind tunnel is shown in Figure 4. To determine the wind velocity, four hotwire anemometers were arranged vertically 1 m from the left end of the corridor. The resolution of the hotwire anemometer was 0.01 m/s. In the experiments, the wind velocity was changed to 0 m/s, 0.2 m/s, 0.5 m/s, 0.85 m/s, 1.24 m/s, 1.52 m/s, 1.85 m/s, and 2.09 m/s, successively. The original wind velocity in real scale ranged from 0 m/s to 5.2 m/s. Before each experiment, the mechanical fan was turned on for about 10 min to keep the screened wind velocity stable.

3. Results and Discussion

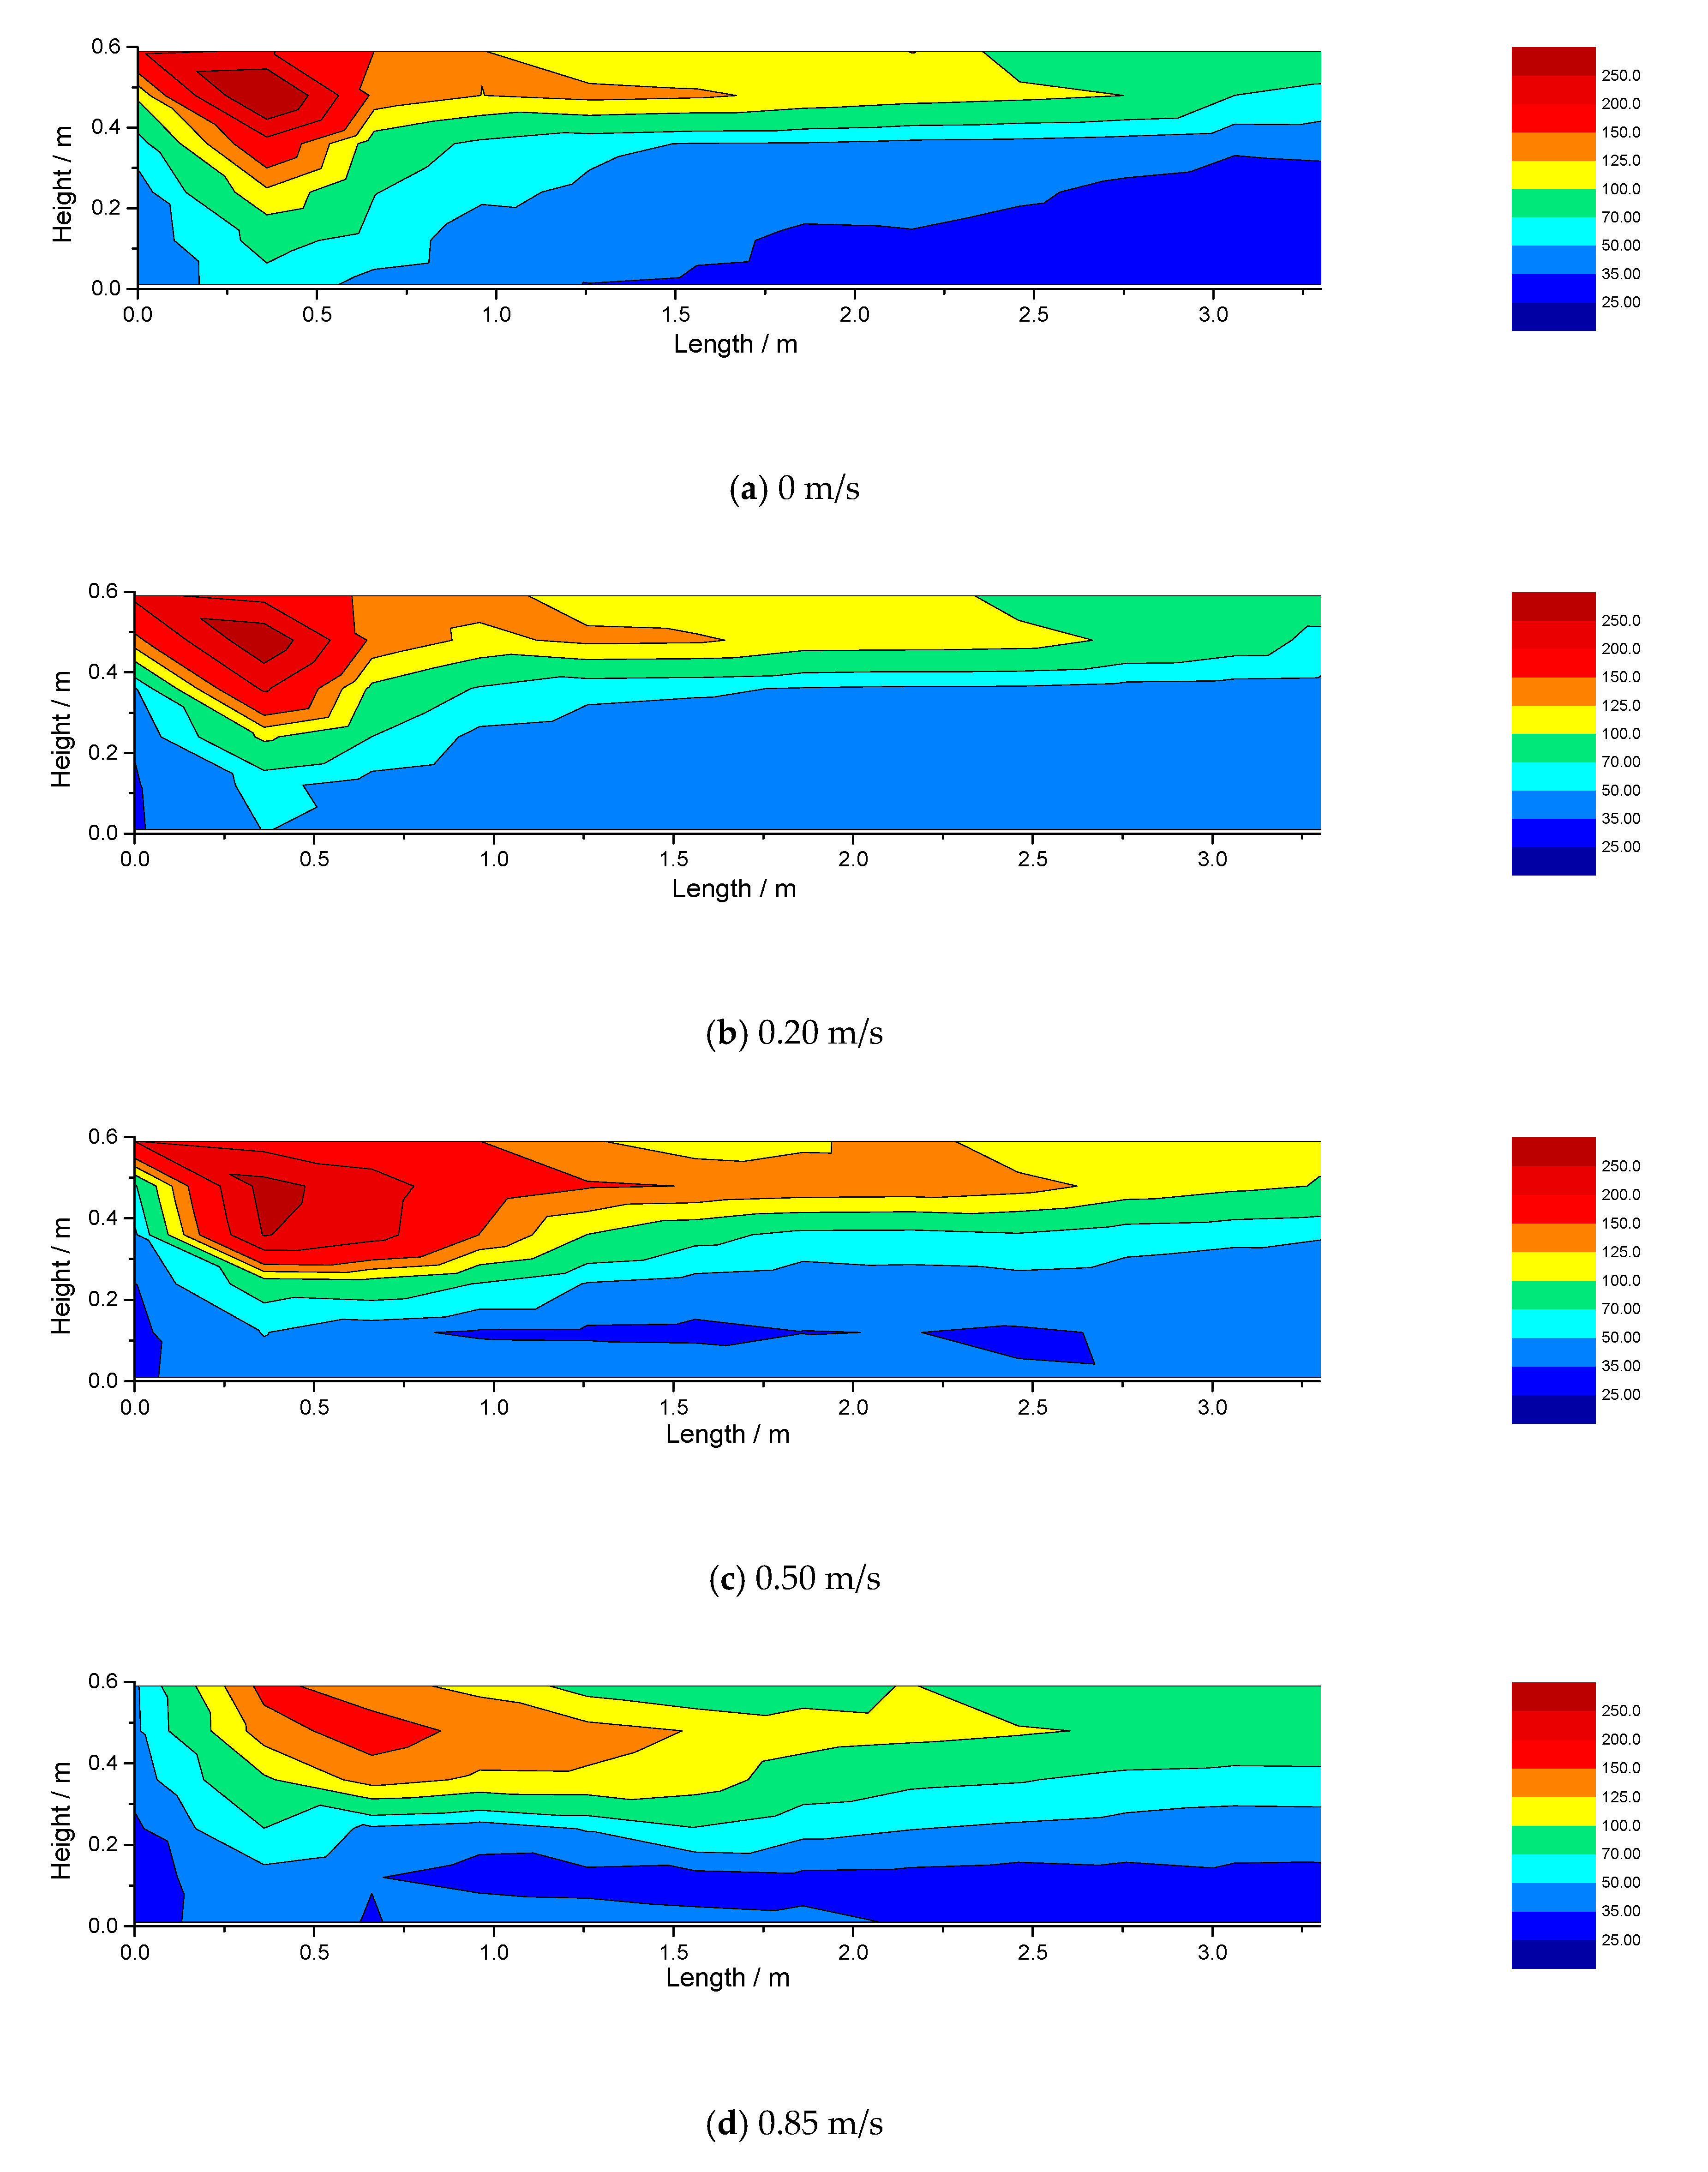
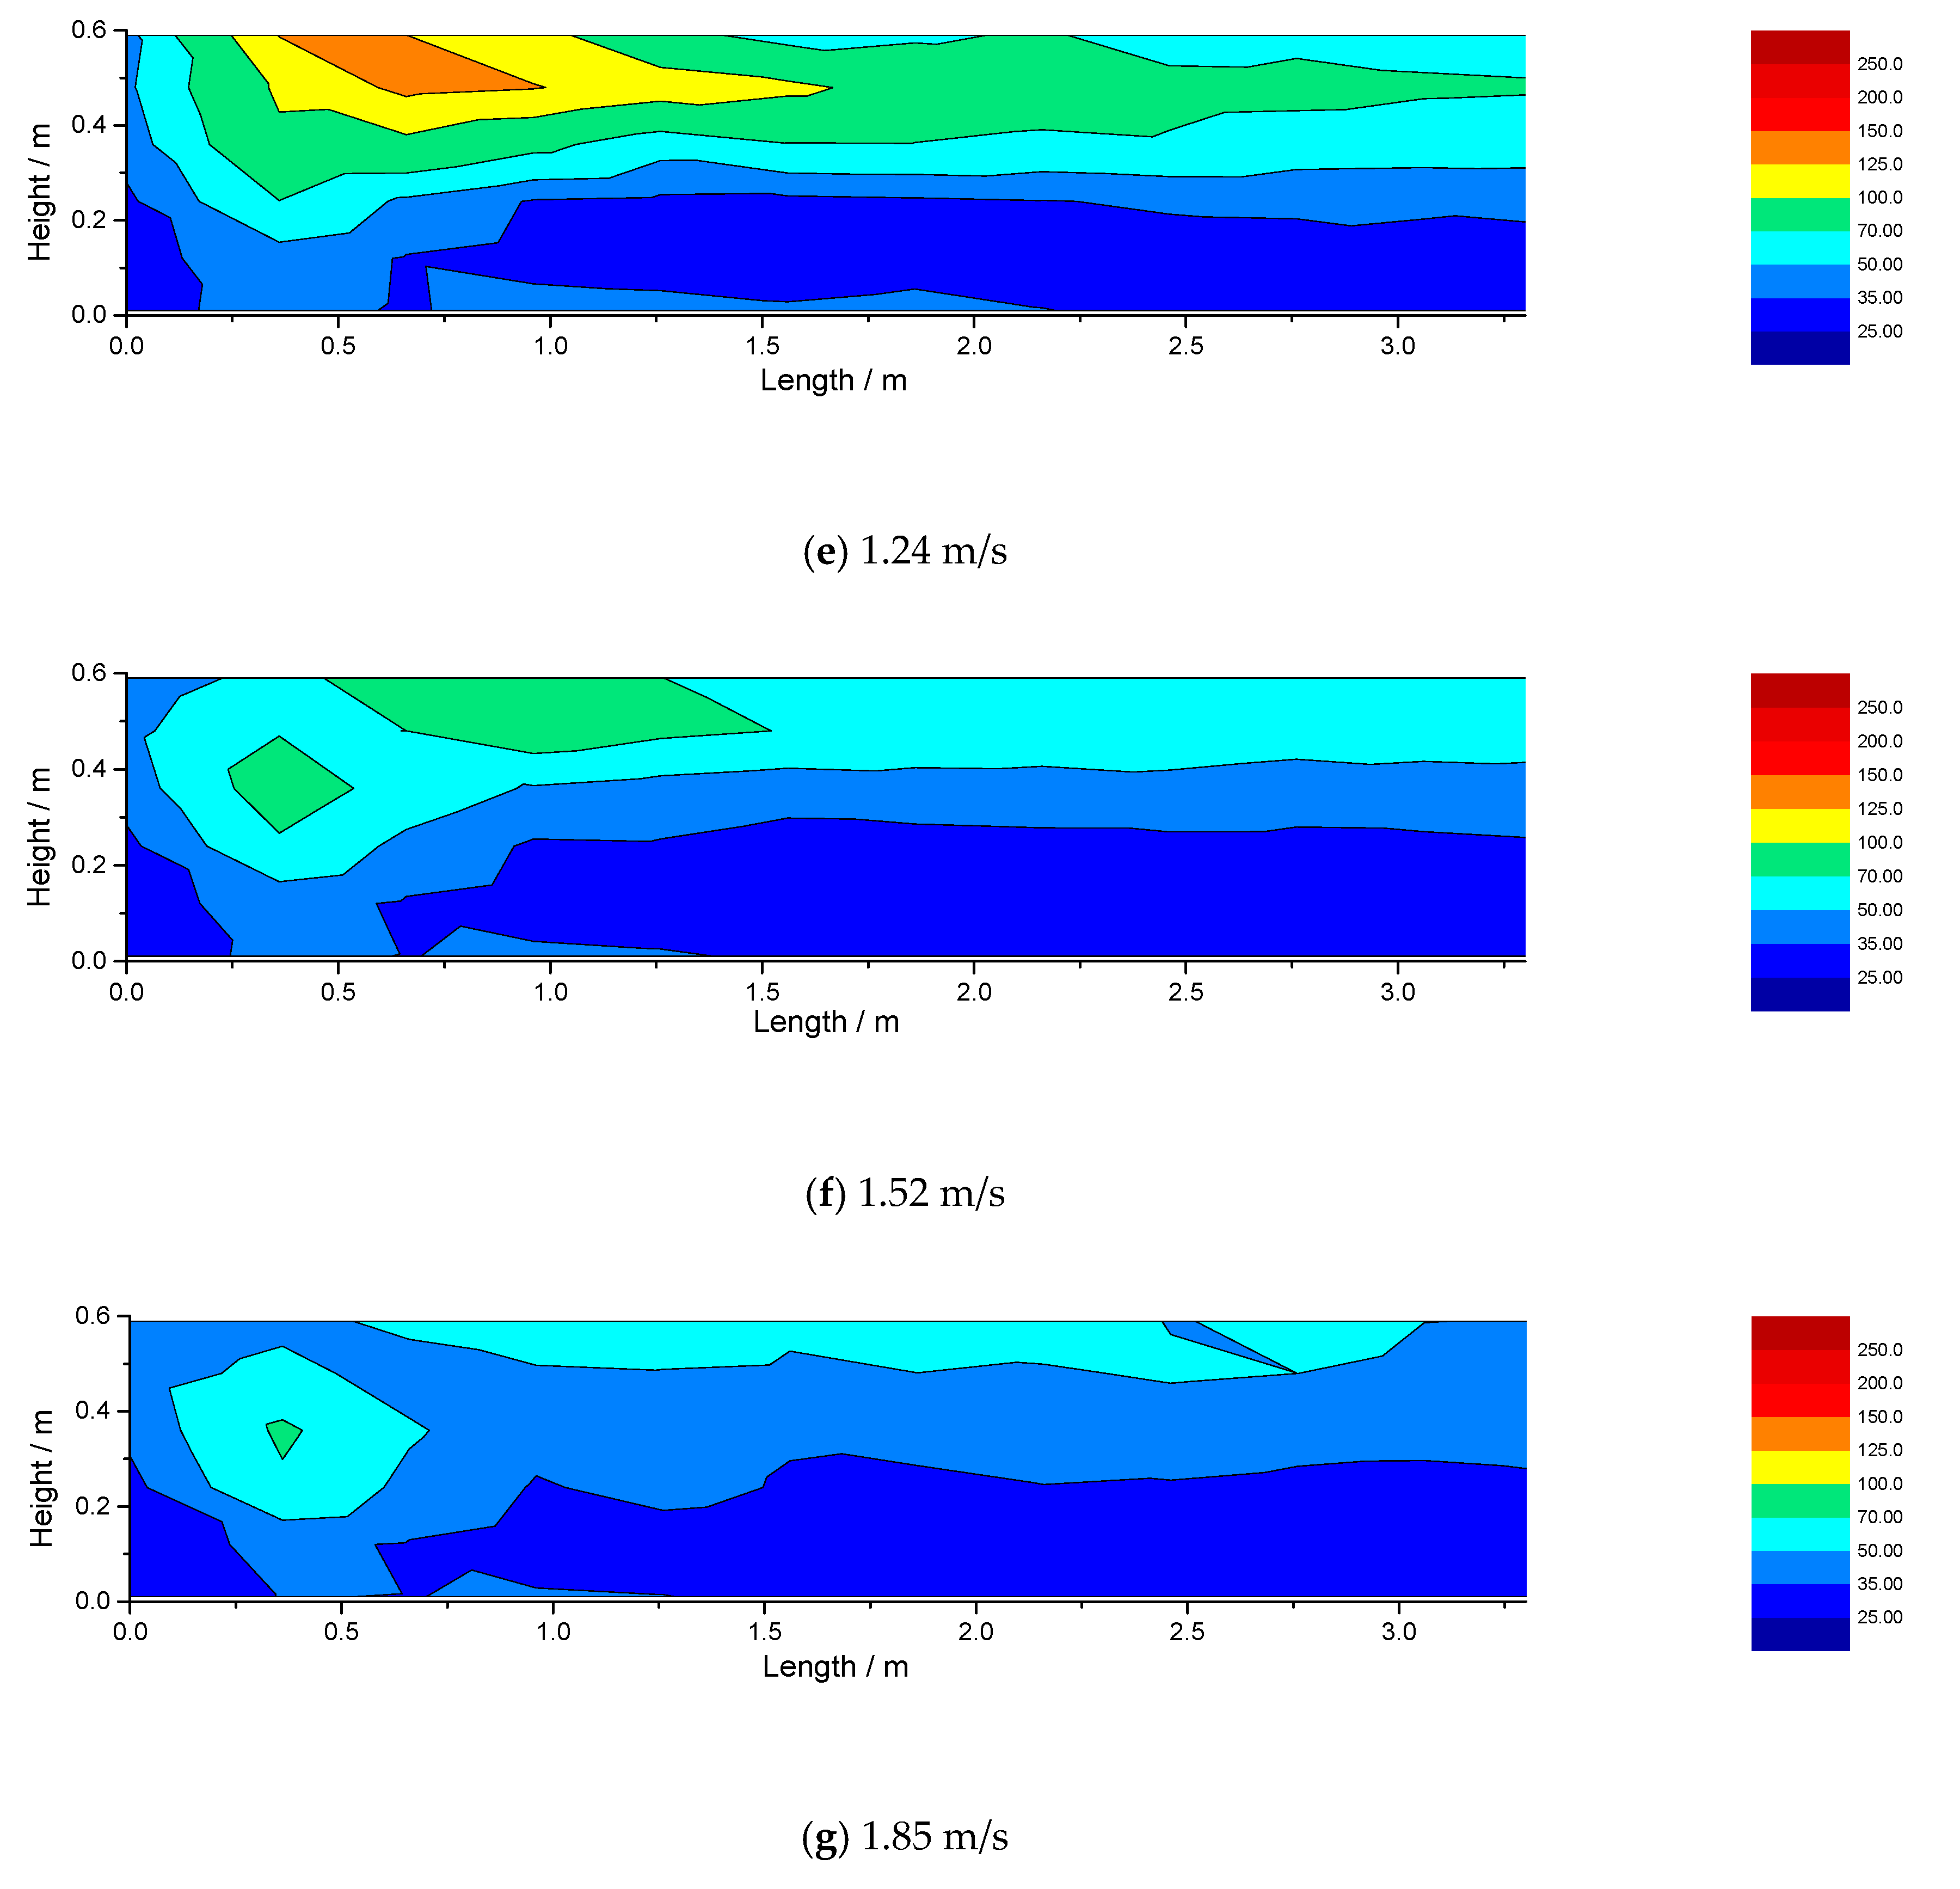
3.1. Spilled Thermal Plume into the Corridor

When fire occurs in a compartment, air is supplied to the compartment through the door that connects the compartment and the corridor. If the HRR is small, the supplemental air is sufficient enough (well-ventilated) for the compartment fire to be fuel-controlled, meaning that the fuel can be combusted completely in the compartment. However, if the HRR is so large that the supplemental air is not enough, the compartment fire becomes ventilation-controlled, in which the unburned flame will spill out of the compartment and spread into the corridor. Therefore, it is important to evaluate the combustion conditions of the compartment fire under experimental HRRs (10 kW, 15 kW, and 20 kW). Previous experimental studies [27,28] have confirmed that if the HRR in the compartment is larger than 1500 A H , the supplemental air will become insufficient for combustion, leading to flame spilling out of the compartment, where A and H are the area and the height of the opening, respectively. For this condition, the critical HRR for flame spilling over can be calculated as 75.9 kW, which is much larger than all the experimental HRRs, meaning that there will be no flame spilling out of the compartment.
Figure 5 shows the temperature profiles in the corridor for a fire HRR of 20 kW. It can be seen that both the distribution of hot smoke gas and the smoke layer thickness show an increasing trend at the beginning. However, with the continuous increase of wind velocity, an increasing amount of cold ambient air blows into the corridor and the temperature profile gradually decreases to close to the ambient temperature. Obviously, the external wind has a significant influence on the temperature profile in the corridor, which can be used to affect the design of fire detectors and the smoke control system.
Figure 6 shows the maximum temperature under the corridor ceiling for different opening conditions. It can be seen that for all the velocities and HRRs, T m a x is less than 250 ℃, which is much smaller than the flame temperature, i.e., only the hot smoke spills into the corridor from the compartment. As shown in Figure 6, with the increase of velocity, T m a x rises first increases and then decreases with external wind velocity. The reason for this is that the ventilation affects not only the temperature distribution below the ceiling but also the amount of spilled hot plume. To account for the spilled plume in the corridor, an effective HRR, Qeff, is defined. The more the spilled hot plume, the larger is the HRR. Obviously, the value of Qeff in the corridor is directly related to the total HRR in the compartment and the external wind velocity.
In general, the external wind performs two effects on the temperature field in the corridor. Firstly, the increasing wind velocity brings more ambient air to the spilled thermal flow, resulting in the decrease of T m a x . Secondly, according to the Bernoulli theorem, the increase of cross wind velocity will also cause more thermal plume spilling out, which increases the effective HRR in the corridor and leads to the increase of T m a x . For smaller wind velocity, the increasing effect dominates and T m a x shows an increase with V, while, when the wind velocity is too large, the cooling effect then dominates and causes T m a x to decrease. For comparison, Figure 6b shows the variation of the maximum temperature below the ceiling in the corridor when the dam-boards are added at both ends of the corridor. As can be seen from the figure, the dam-board has a significant effect on the maximum temperature in the corridor. When the external wind velocity is relatively small, the flow field in the corridor is almost unaffected by the wind velocity. As the wind velocity increases to larger values, owing to the shielding effect of the dam-board, T m a x   is larger than in the case without the dam-board (see Figure 6a).
For different wind velocities, Li et al. [16] provides the prediction relationship of the maximum temperature under a tunnel ceiling, as shown in Equations (4) and (5):
Δ T max = { Q V b 1 / 3 H 5 / 3 , V > 0.19 17.5 Q 2 / 3 H 5 / 3 , V 0.19
V = V / ( g Q b ρ a c p T a ) 1 / 3
where H is the distance from the burner surface to the ceiling, b is the radius of the fire source, ρa is the density of ambient air, cp is the specific heat capacity, Ta is the ambient temperature, g is the gravitational acceleration, and Q is the heat release rate. The dimensionless velocity V′ is to characterize the relative size of wind velocity in the tunnel. The critical value of V′ is 0.19. When V′ < 0.19, the wind velocity is small and the external wind has no obvious influence on the maximum temperature. When V′ > 0.19, the wind velocity is relatively large, and the external wind has a larger influence on the maximum temperature under the ceiling.
For the hot thermal plume spilling from the compartment to the corridor, the amount of the spilled plume can be assumed to be generated by a virtual fire source in the corridor. The virtual source has the same dimension as the original fire, and the HRR of the virtual fire source depends on the amount of spilled smoke into the corridor, corresponding to Qcorridor. This is the key factor that affects the smoke movement and temperature distribution in the corridor. Therefore, the maximum temperature below the ceiling is determined by the corridor HRR of the spilled plume rather than the total HRR in the compartment. Based on Equation (4), the HRR in corridor can be calculated for different external wind conditions:
Q corridor = { V b 1 / 3 H 5 / 3 Δ T max , V > 0.19 Δ T max 3 / 2 H 5 / 2 73 , V 0.19
Thus, to determine the Qcorridor, the region of V′ for different external wind velocities must first be distinguished. The critical HRR, Qcritical, (corresponding to V′ = 0.19) for different wind velocities can be calculated by Equation (5), as shown in Table 1. It can be seen from the table that when the wind velocity exceeds 0.5 m/s, the calculated critical HRR is much larger than the total HRRs of 10–20 kW. Thus, it can be concluded that V′ > 0.19 when V exceeds 0.5 m/s and V′ < 0.19 when V is smaller than 0.5 m/s.
Therefore, the effective HRR for a corridor fully or partially open to the environment can be calculated based on Equation (6). As shown in Figure 7, for both opening circumstances, Qcorridor increases first and then decreases with the external wind velocity. For the corridor fully open to the environment, the maximum Qcorridor are 98.4%, 79.2%, and 75.2% of the total HRRs. For the corridor partially closed with dam-boards (Figure 7b), the maximum Qcorridor exceeded the total HRR of the fire source in the compartment. The reason for this is that the dam-boards seriously weakened the influence of the external wind by accumulating a thicker hot thermal layer under the ceiling. Thus, it is more difficult for the heat to be dissipated compared to the cases with no dam-board, leading to higher ceiling temperatures and effective corridor HRR.

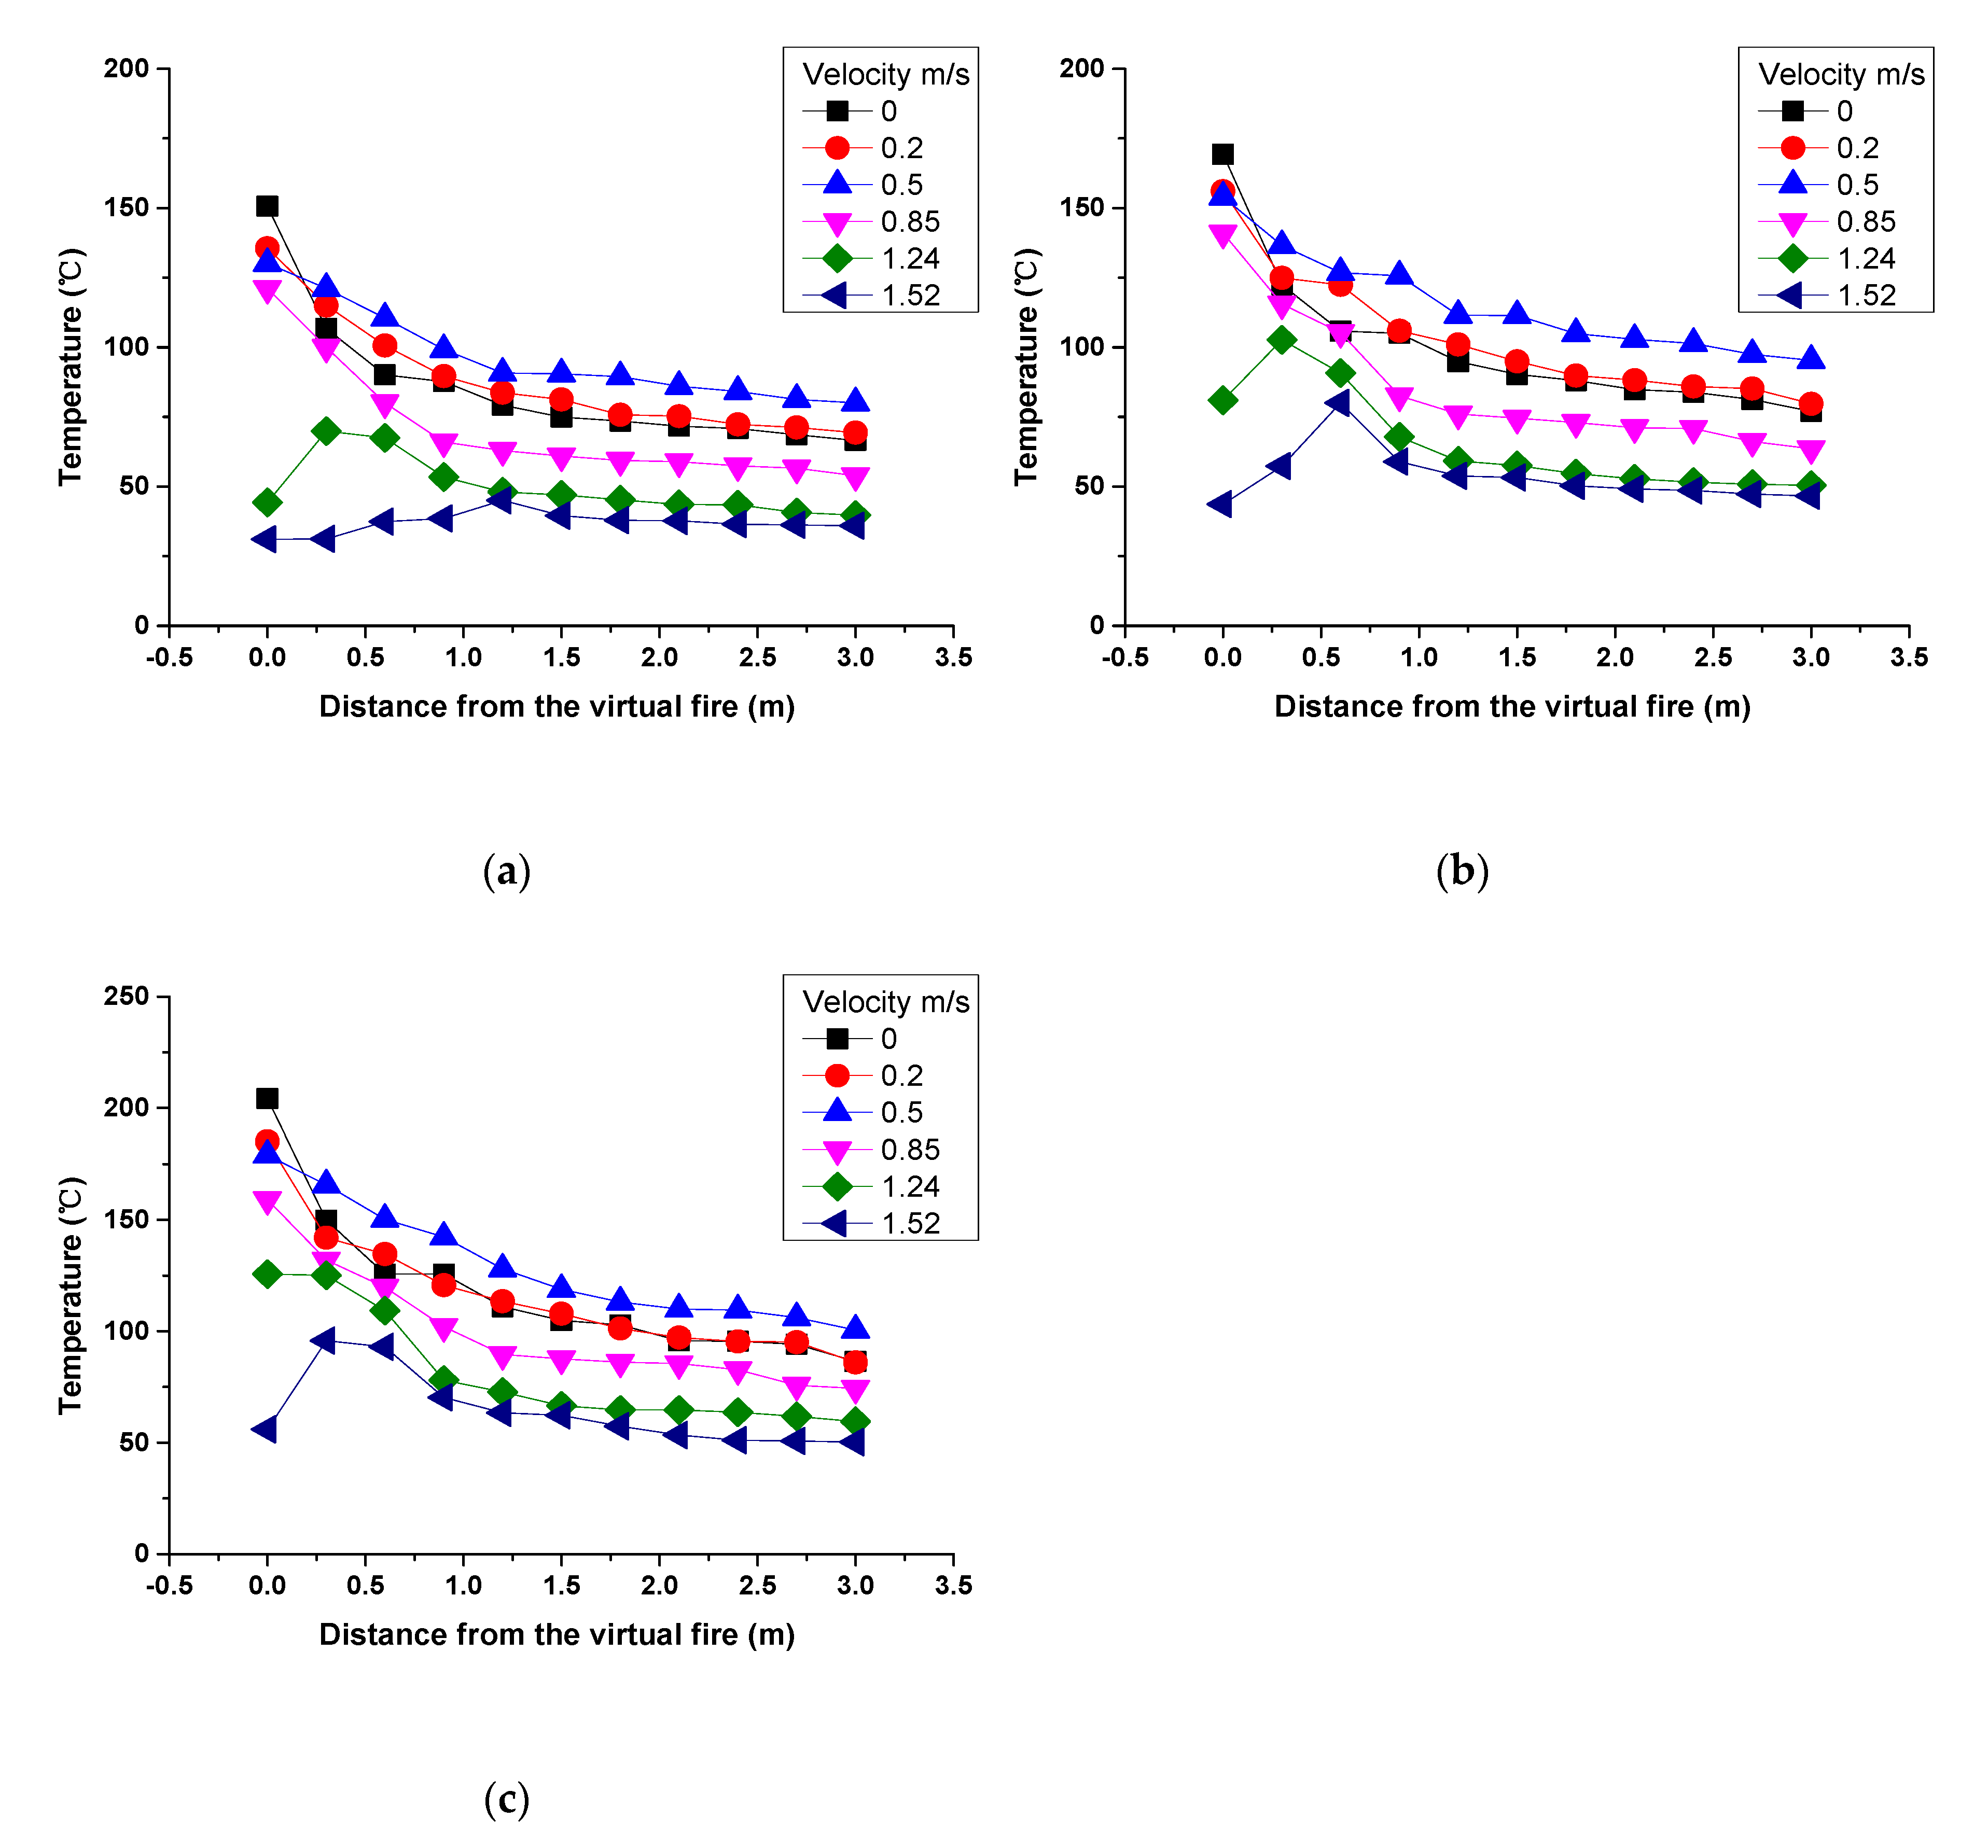
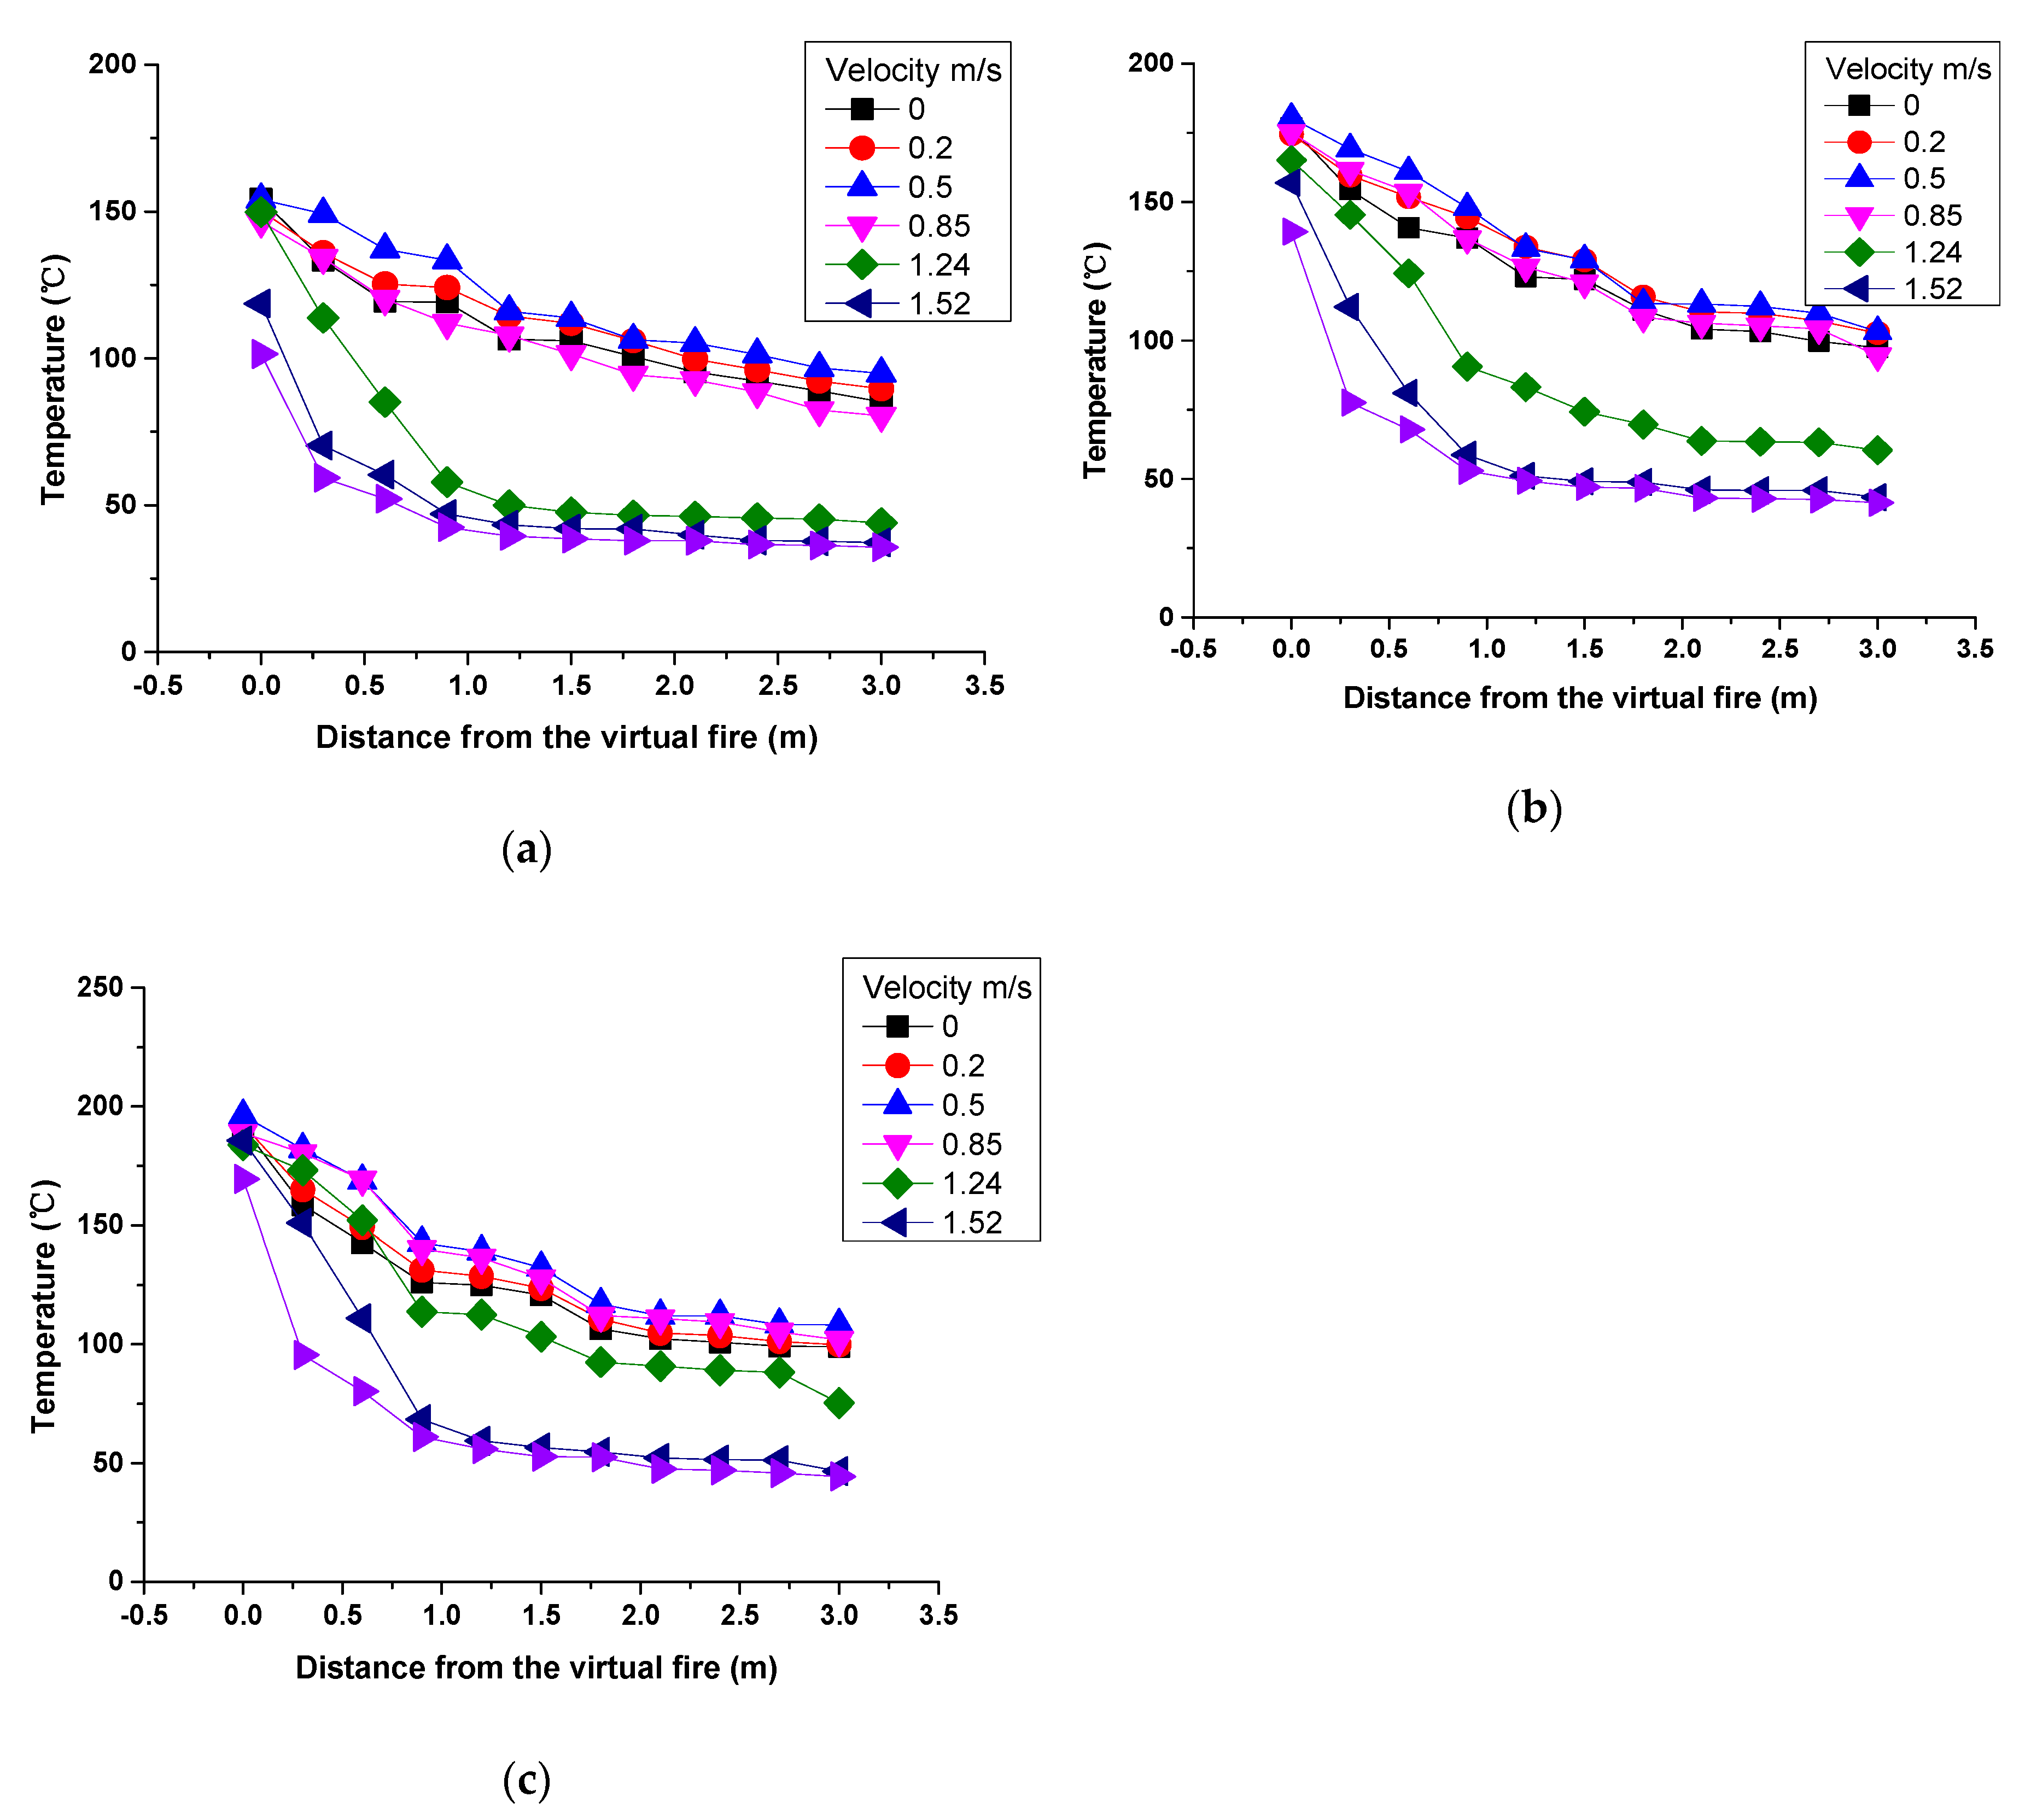
3.2. Ceiling Temperature Distribution

Figure 8 shows the temperature distribution under the corridor ceiling for different HRRs, with the corridor end open to the environment. As shown in the figure, it can be seen that the position of the maximum ceiling temperature changes with the wind velocity. To be specific, when the wind velocity is small, the maximum ceiling temperature appears at the place of the spilled flow (x = 0, 0.36 m from the left end of corridor). As the wind velocity increases, the spilled smoke plume gradually inclines to the corridor downstream forced by the inertia force of the longitudinal wind, and the position of the ceiling maximum temperature then also shifts downstream, e.g., for wind velocity of 1.52 m/s, the maximum temperature appears at x = 1.2 m for HRR of 10 kW. With the increase of HRR, it can be seen that for the same wind velocity, the shifting phenomenon of the position of the maximum ceiling temperature disappears, since the larger the HRR, the larger the buoyancy force of the spilled plume to resist the inertia force of the ambient wind, and the harder it is for the position of the maximum ceiling temperature to be shifted downstream.
At the same time, it can be seen that the influencing mechanism of the external wind is very complex. The ceiling temperature does not monotonously change with the wind velocity. When the wind rate is small, the ceiling temperature increases gradually with the wind velocity, and as the wind velocity rises to 0.5 m/s, the ceiling temperature reaches its maximum value. Thereafter, the ceiling temperature shows a decreasing trend to the minimum value for the largest wind velocity.
As a contrast, Figure 9 gives the ceiling temperature profiles with a dam-board arranged at the corridor end. Obviously, there are two patterns for the variation of ceiling temperature distributions with wind velocity. Firstly, when the wind velocity is small (0–0.85 m/s), the ceiling temperature varies slightly with the distance from the virtual fire source and the wind velocity. However, if the wind velocity is too high, the smoke accumulation zone will be damaged. Thus, the ceiling temperature decreases and remains relatively stable for a high wind velocity. That is, for relatively small wind velocity, the dam-board plays an important part near the virtual fire, and the nearby temperature profile is less influenced by the wind. However, the sheltering effect of the dam-board gradually diminishes and the ceiling temperature drops when the wind velocity increases.
In order to study the temperature distribution, the maximum temperature ∆Tmax under the ceiling is selected as the reference temperature, and the position where ∆Tmax appears is used as the reference point xmax because ∆Tmax is directly related to the HRR. By using ∆Tmax to normalize the temperature increase, the dimensionless temperature increase at different positions under the ceiling is obtained as ∆Tx/∆Tmax. Figure 10 shows the relationship between the non-dimensional temperature increase and the dimensionless distance under the ceiling in the corridor under different wind velocities. It can be seen that when the wind velocity is constant, the non-dimensional temperature rise ∆Tx/∆Tmax is independent of the HRR. It decreases with the increasing distance, and shows an exponential decay. Previous studies have also confirmed that the temperature distribution under the ceiling has an exponential distribution for narrow and long building structures such as tunnels and corridors [27]. Therefore, it is reasonable to fit the relationship curve between the non-dimensional temperature rise ∆Tx/∆Tmax and the dimensionless distance (xxmax)/H by using an exponential form. It can be seen that the form of the sum of two exponential functions can well describe the attenuation of smoke temperature in corridor. The formula for the non-dimensional temperature rise below the ceiling in the corridor is given as follows:
Δ T x / Δ T max = a e 0.28 ( x x max ) H + b e 0.71 ( x x max ) H
Comparing the results under different wind velocities, the coefficients of the fitting formula remain unchanged, and the impact of wind velocity is mainly reflected in the coefficients of a and b, and a + b ≈ 1, i.e., at the reference point (the position of the maximum temperature increase), the dimensionless temperature increase should be 1. Substituting b ≈ 1 − a into Equation (7):
Δ T x / Δ T max = a e 0 . 028 ( x x max ) H + ( 1 a ) e 0 . 71 ( x x max ) H
Figure 11 shows the variation of coefficient a under different wind velocities. The dimensionless wind velocity can be defined as   V / g H . It can be seen that the coefficient a first increases with the increase of the dimensionless wind velocity and reaches the maximum value when V / g H = 0.23 (V = 0.5 m/s). At this time, the temperature increase below the ceiling reaches its largest value. As the dimensionless wind velocity increases, the mechanism of the external wind on the temperature increase gradually changes and a begins decrease with V / g H . When   V / g H   > 0.38, the wind velocity is large enough, the temperature distribution below the ceiling approaches a uniform value, and the non-dimensional temperature increase ∆Tx/∆Tmax is independent of the wind velocity. Then, as the wind velocity continues to increase, the coefficient a remains basically unchanged. Therefore, as the ceiling temperature does not change monotonously with the wind velocity, the promote zone, inhibit zone, and stable zone correspond to the three different changing tendencies of ceiling temperature in the corridor with the increase of wind velocity. The promote zone is defined as the range ( V / g H 0.23 ) in which the ceiling temperature increases with wind velocity to its maximum value. The inhibit zone is defined as the range ( 0.23 < V / g H < 0.38 ) in which the ceiling temperature decreases with wind velocity. The stable zone is defined as the range ( V / g H 0.38 ) in which the ceiling temperature is basically unchanged with wind velocity.
Figure 8 can be expressed as follows:
a = { V / g H + 0.39 1.5 V / g H + 0.96 0.39 V / g H 0.23 0.23 < V / g H < 0.38 V / g H 0.38
According to the aforementioned analysis, for cases with dam-boards at both ends of the corridor, the dam-board can counteract the effect of the ambient wind and significantly change the flow regime of smoke below the corridor ceiling, which further causes the maximum temperature, temperature distribution and stratification stability of smoke to change.
Likewise, the dimensionless temperature increase ∆Tx/∆Tmax and the dimensionless distance (x-xmax)/H are selected to study the temperature distribution below the ceiling for cases with dam-boards. Figure 12 shows the variation of the dimensionless temperature increase with varying wind velocities. It can be seen from the figure that the dimensionless temperature increase attenuates exponentially with dimensionless distances. However, because the dam-board resists the influence of ambient wind on the smoke layer, the dimensionless temperature rise ∆Tx/∆Tmax is higher than that of the case without a dam-board. In order to quantify the effect of the dam-board, the correlation of temperature increase distribution for cases with dam-boards is also derived based on the dimensionless correlation of temperature increase of cases without dam-boards. In other words, the dam-board does not change the distribution law of the temperature rise below the ceiling. Due to the smoke accumulation effect caused by the dam-board, the coefficient a in the expression of temperature increase is different from that without the dam-board, and the value a can serve as the direct parameter to quantify the effect of the dam-board.
The coefficient a that characterizes the change of temperature increase can be obtained based on the variation of dimensionless temperature rise ∆Tx/∆Tmax with dimensionless distance (xxmax)/H at different wind velocities, as shown in Figure 13. It can be observed from the figure that with the increase of dimensionless wind velocity, the dimensionless temperature increase below the ceiling is a piecewise function of V / g H . When V / g H 0.23 , the dimensionless temperature increase gradually increases with increasing wind velocity for the same position below the ceiling, and then reaches its peak at V / g H = 0.23 . For 0.23 < V / g H < 0.69 , the larger wind velocity takes more heat and therefore leads to the decrease of ∆Tx/∆Tmax. As the wind velocity continues to increase ( V / g H 0.69 ), the coefficient of a transits to the stable zone and finally ∆Tx/∆Tmax does not change with increasing wind velocity. The expression of coefficient a for the corridor with a dam-board at the ends can be expressed as:
a = {   0.40 V / g H + 0.53   V / g H + 0.85   0.16 V / g H 0.23 0.23 < V / g H < 0.69 V / g H 0.69
By comparison, it can be concluded that when the wind velocity is in the promote zone, the temperature increase for cases with dam-boards is higher than that without dam-boards for the same dimensionless distance. Moreover, the critical wind velocity at which ∆Tx/∆Tmax reaches the stable zone becomes larger compared to the case without dam-boards.

4. Conclusions

This paper investigates the effect of external wind on the smoke accumulation and temperature distribution in a typical building structure of a corridor connected to a compartment that is on fire. Major findings include:
(1)
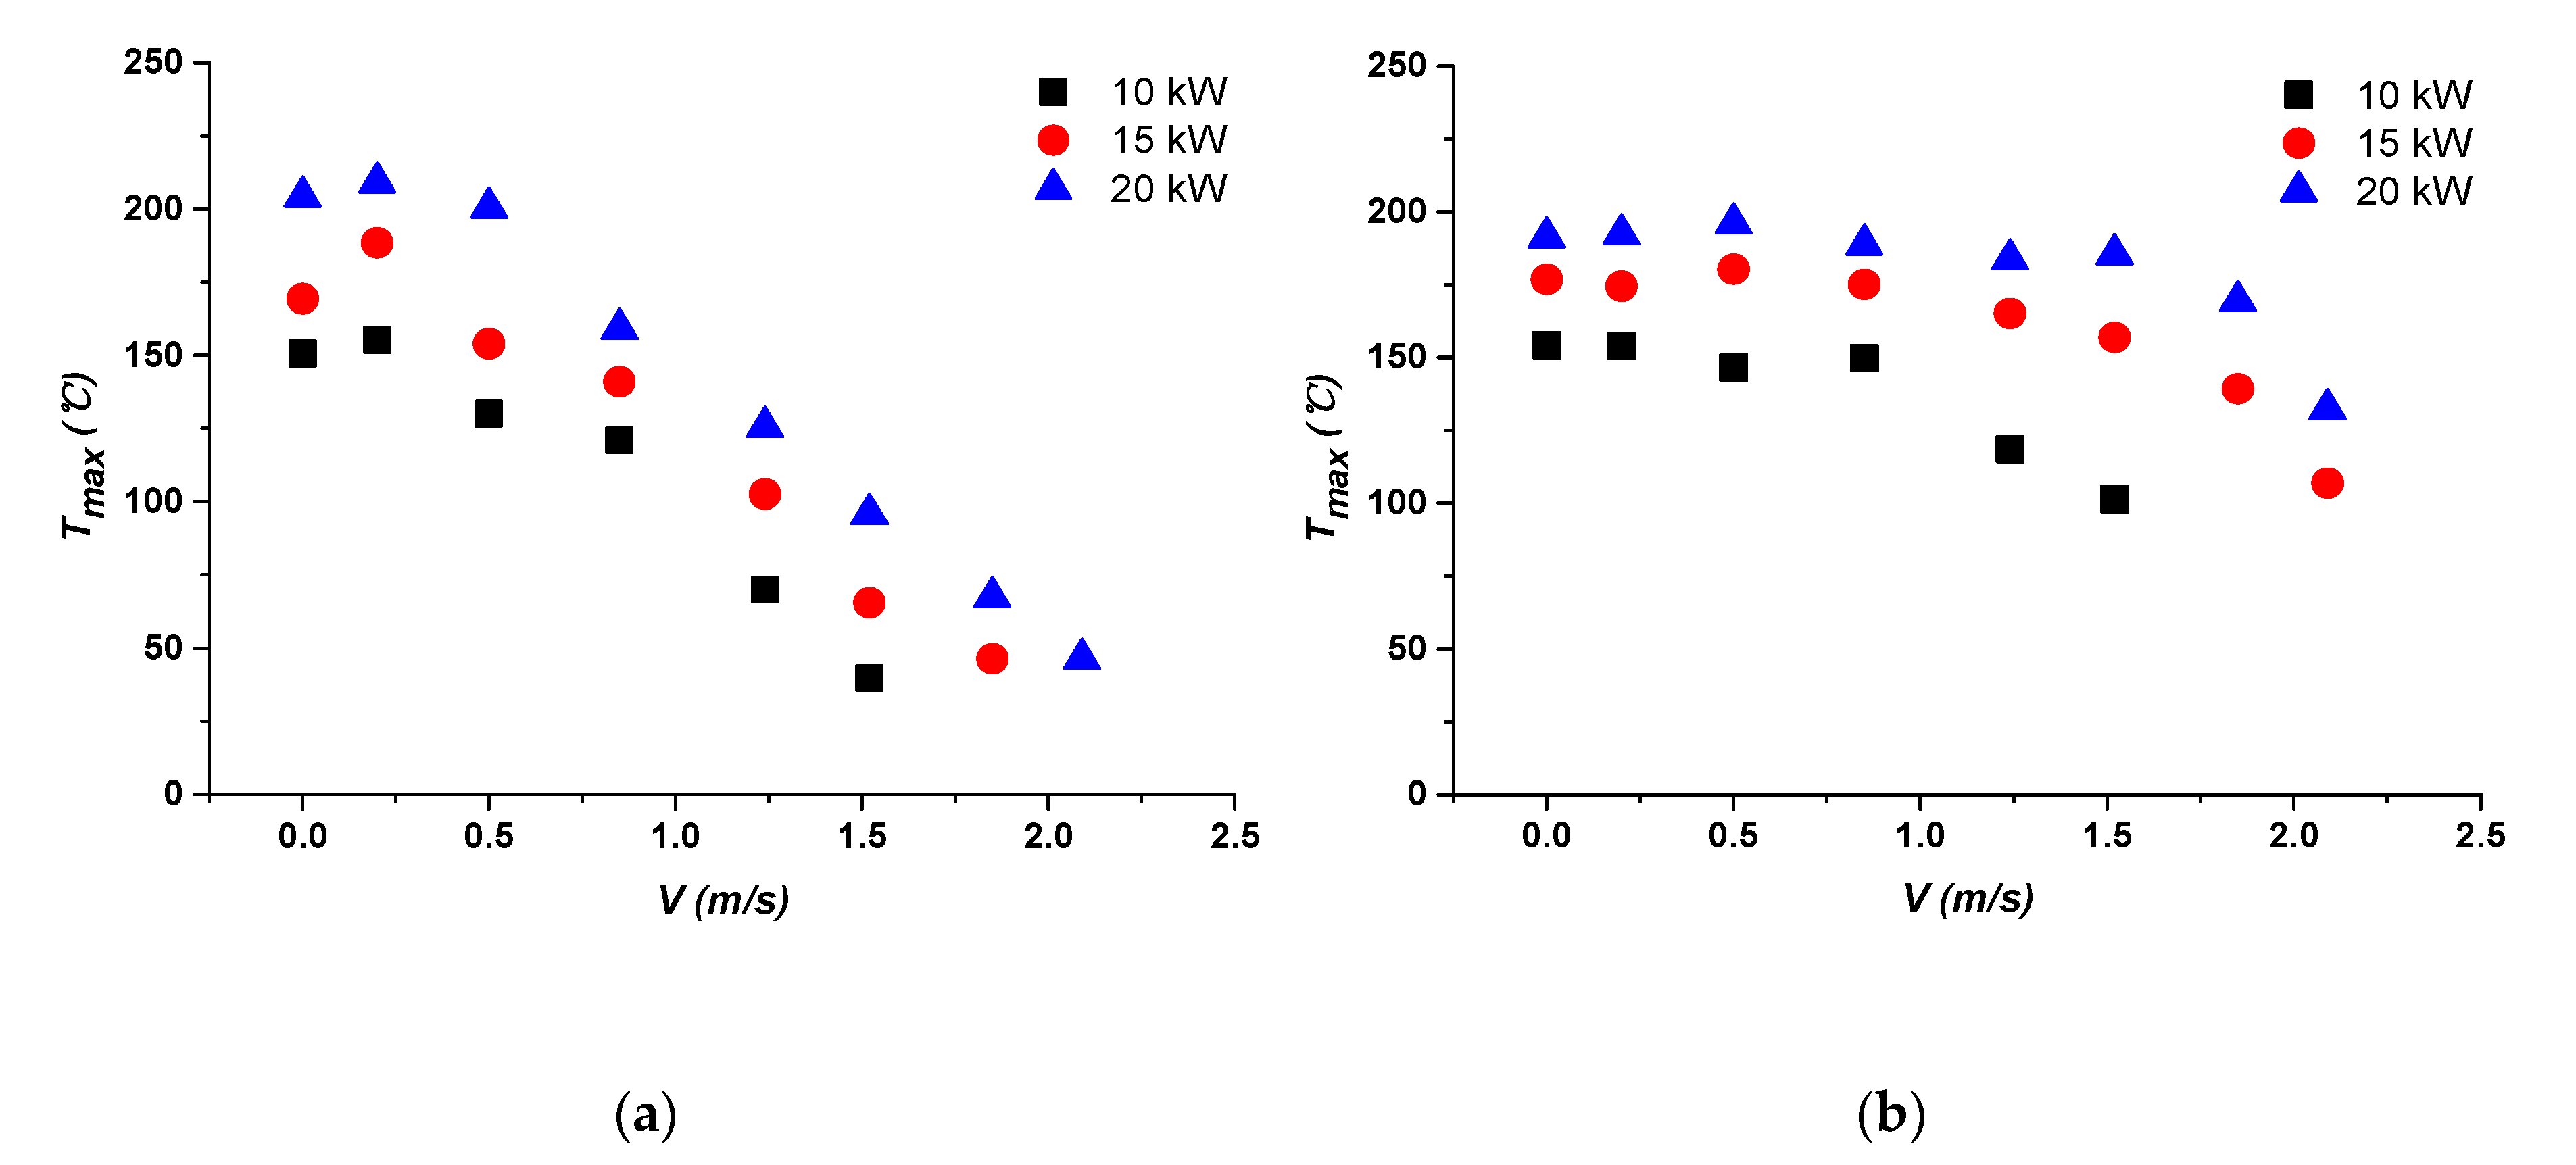
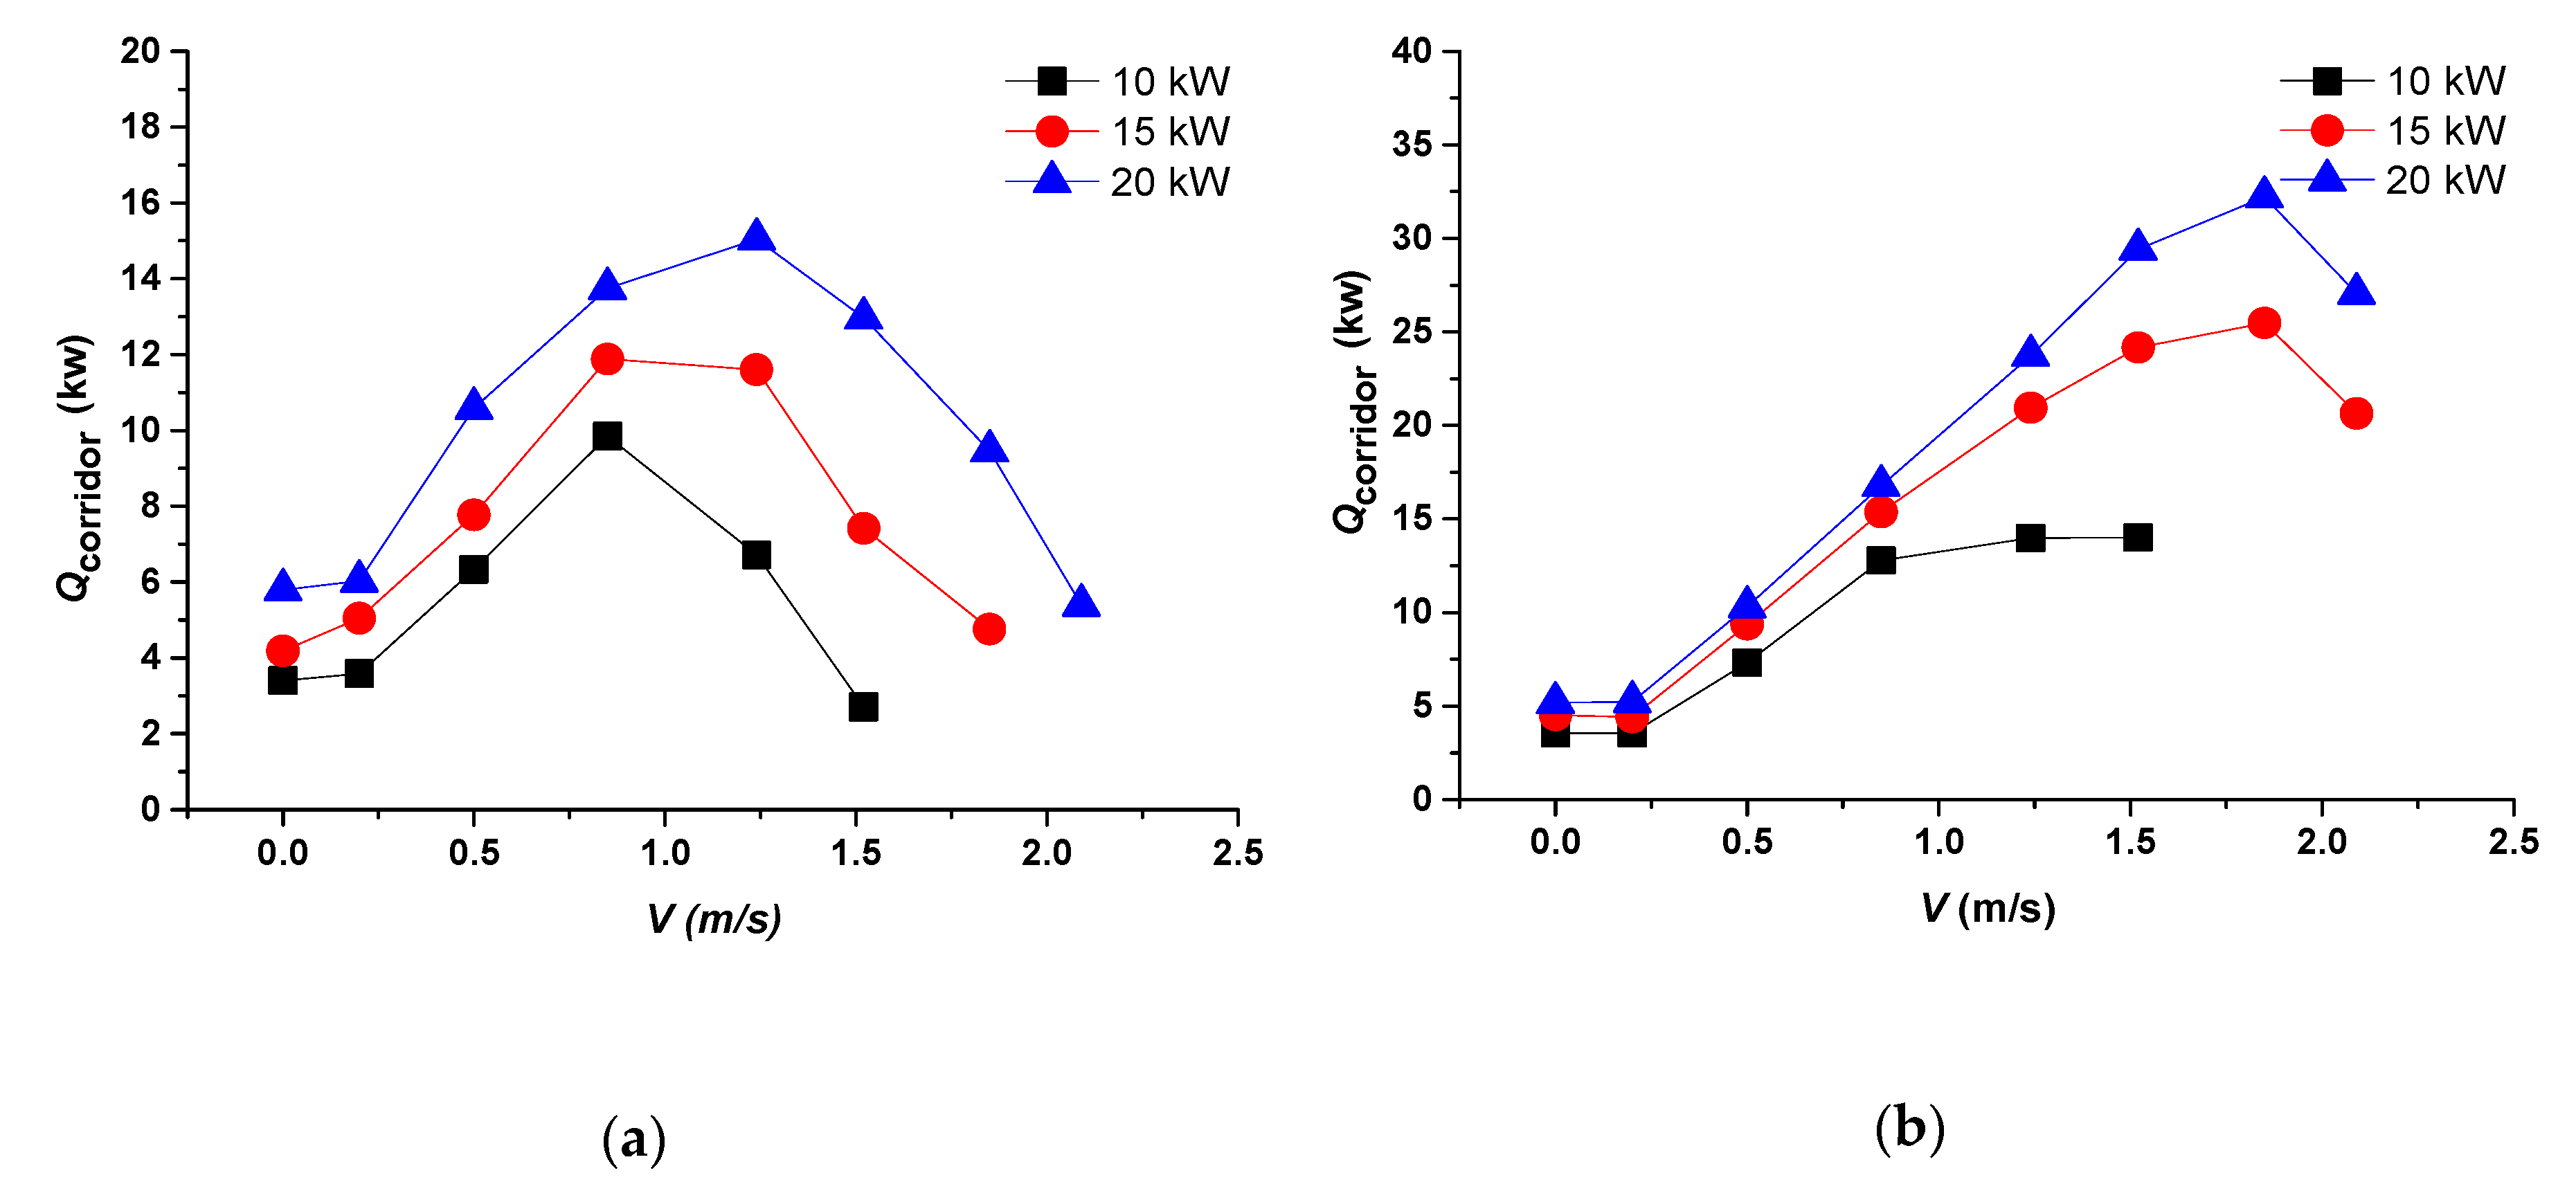
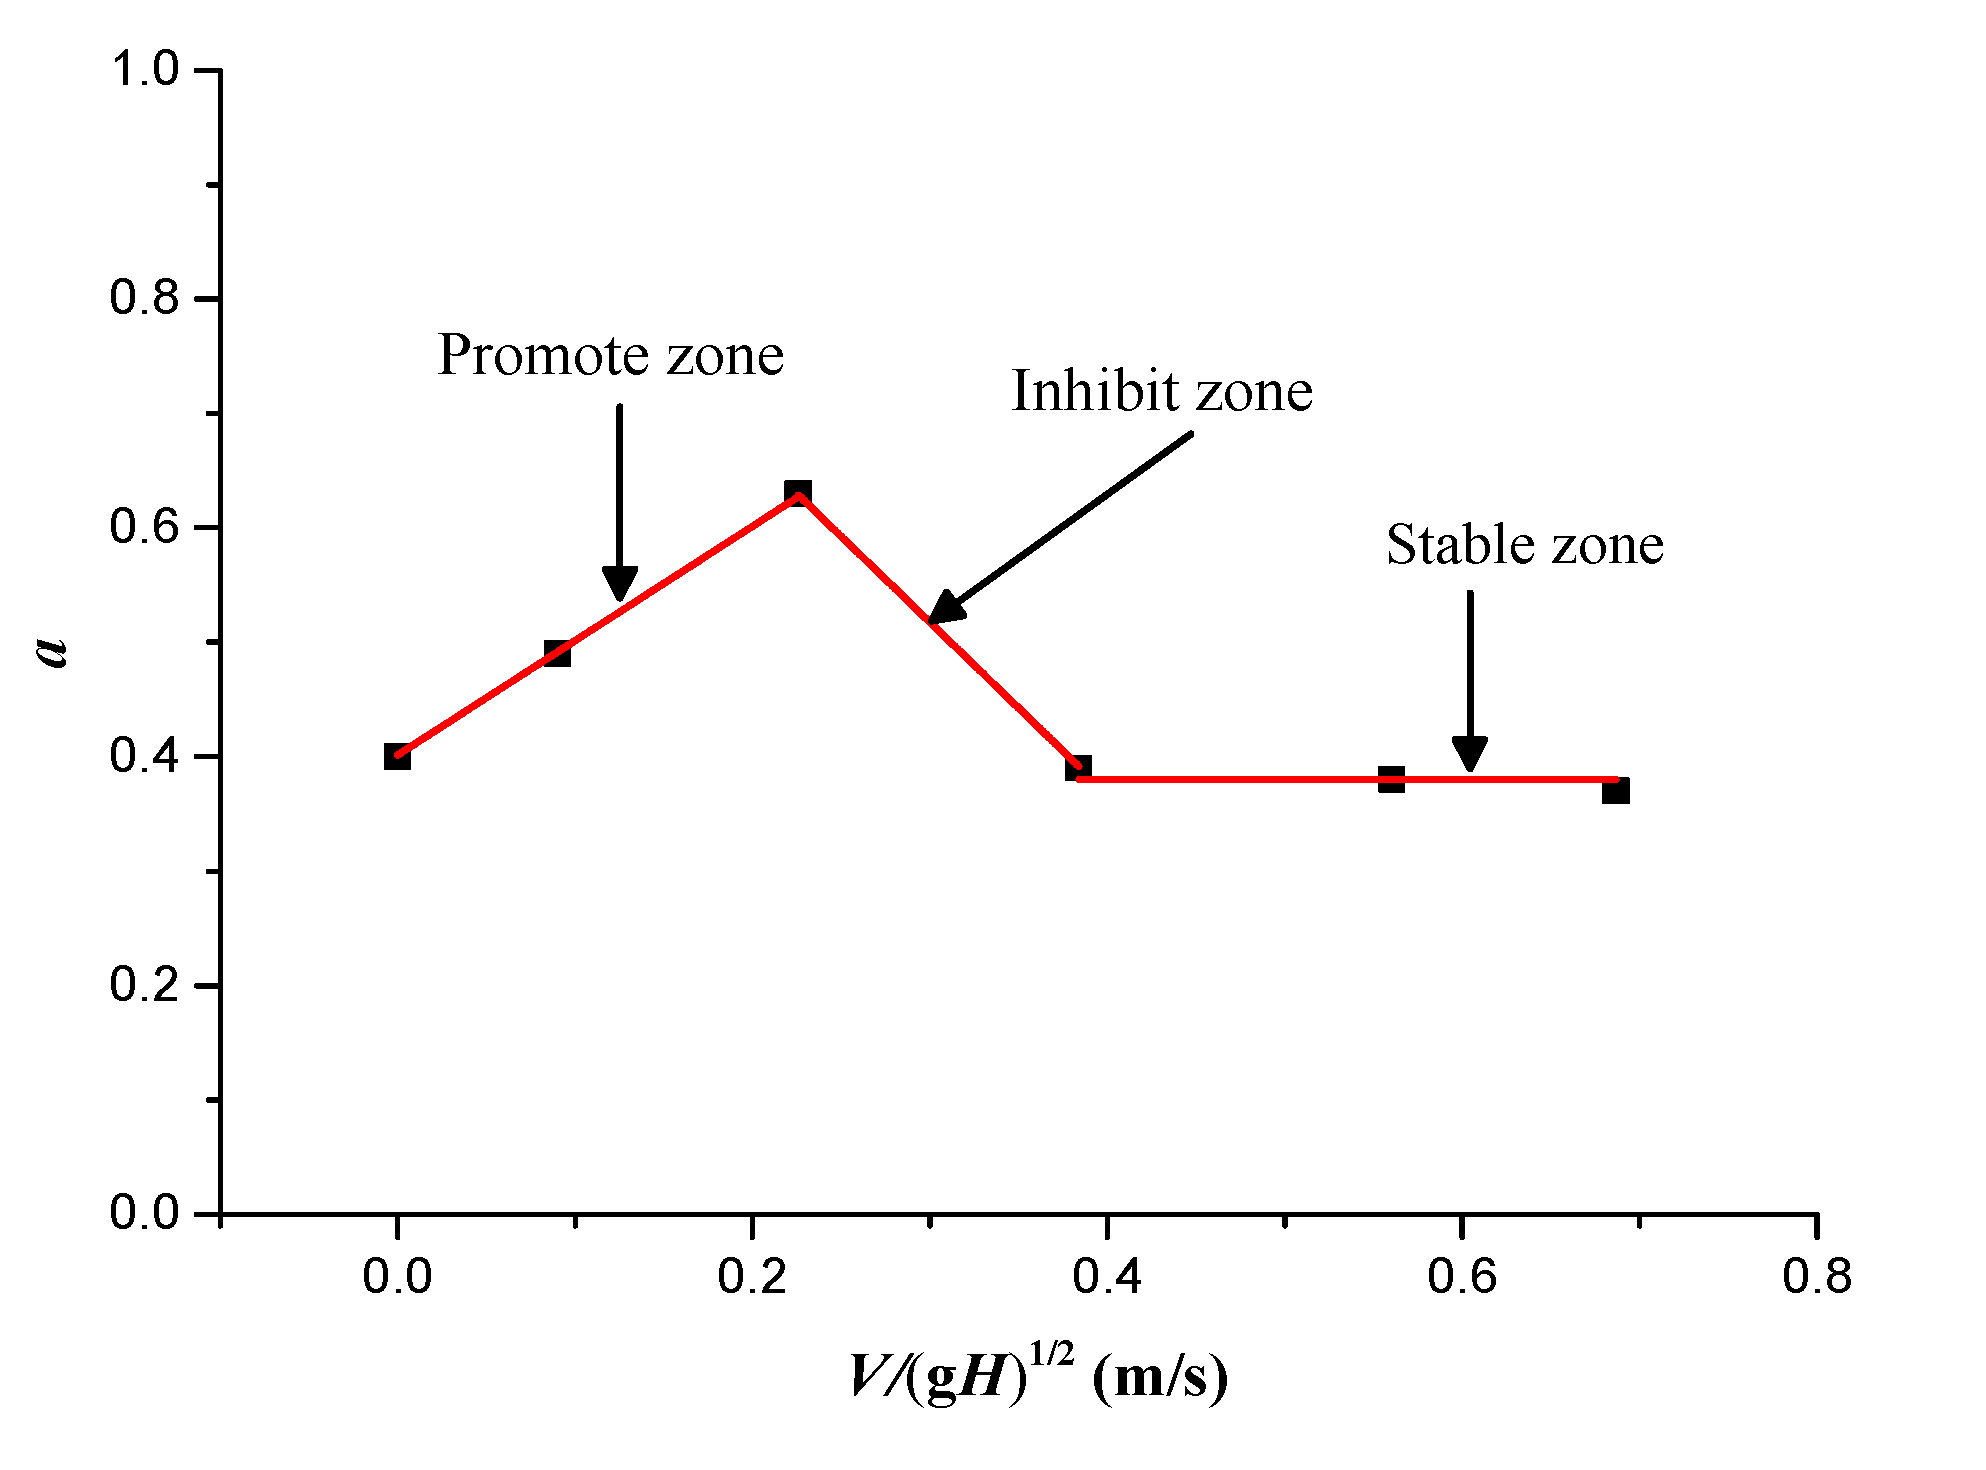
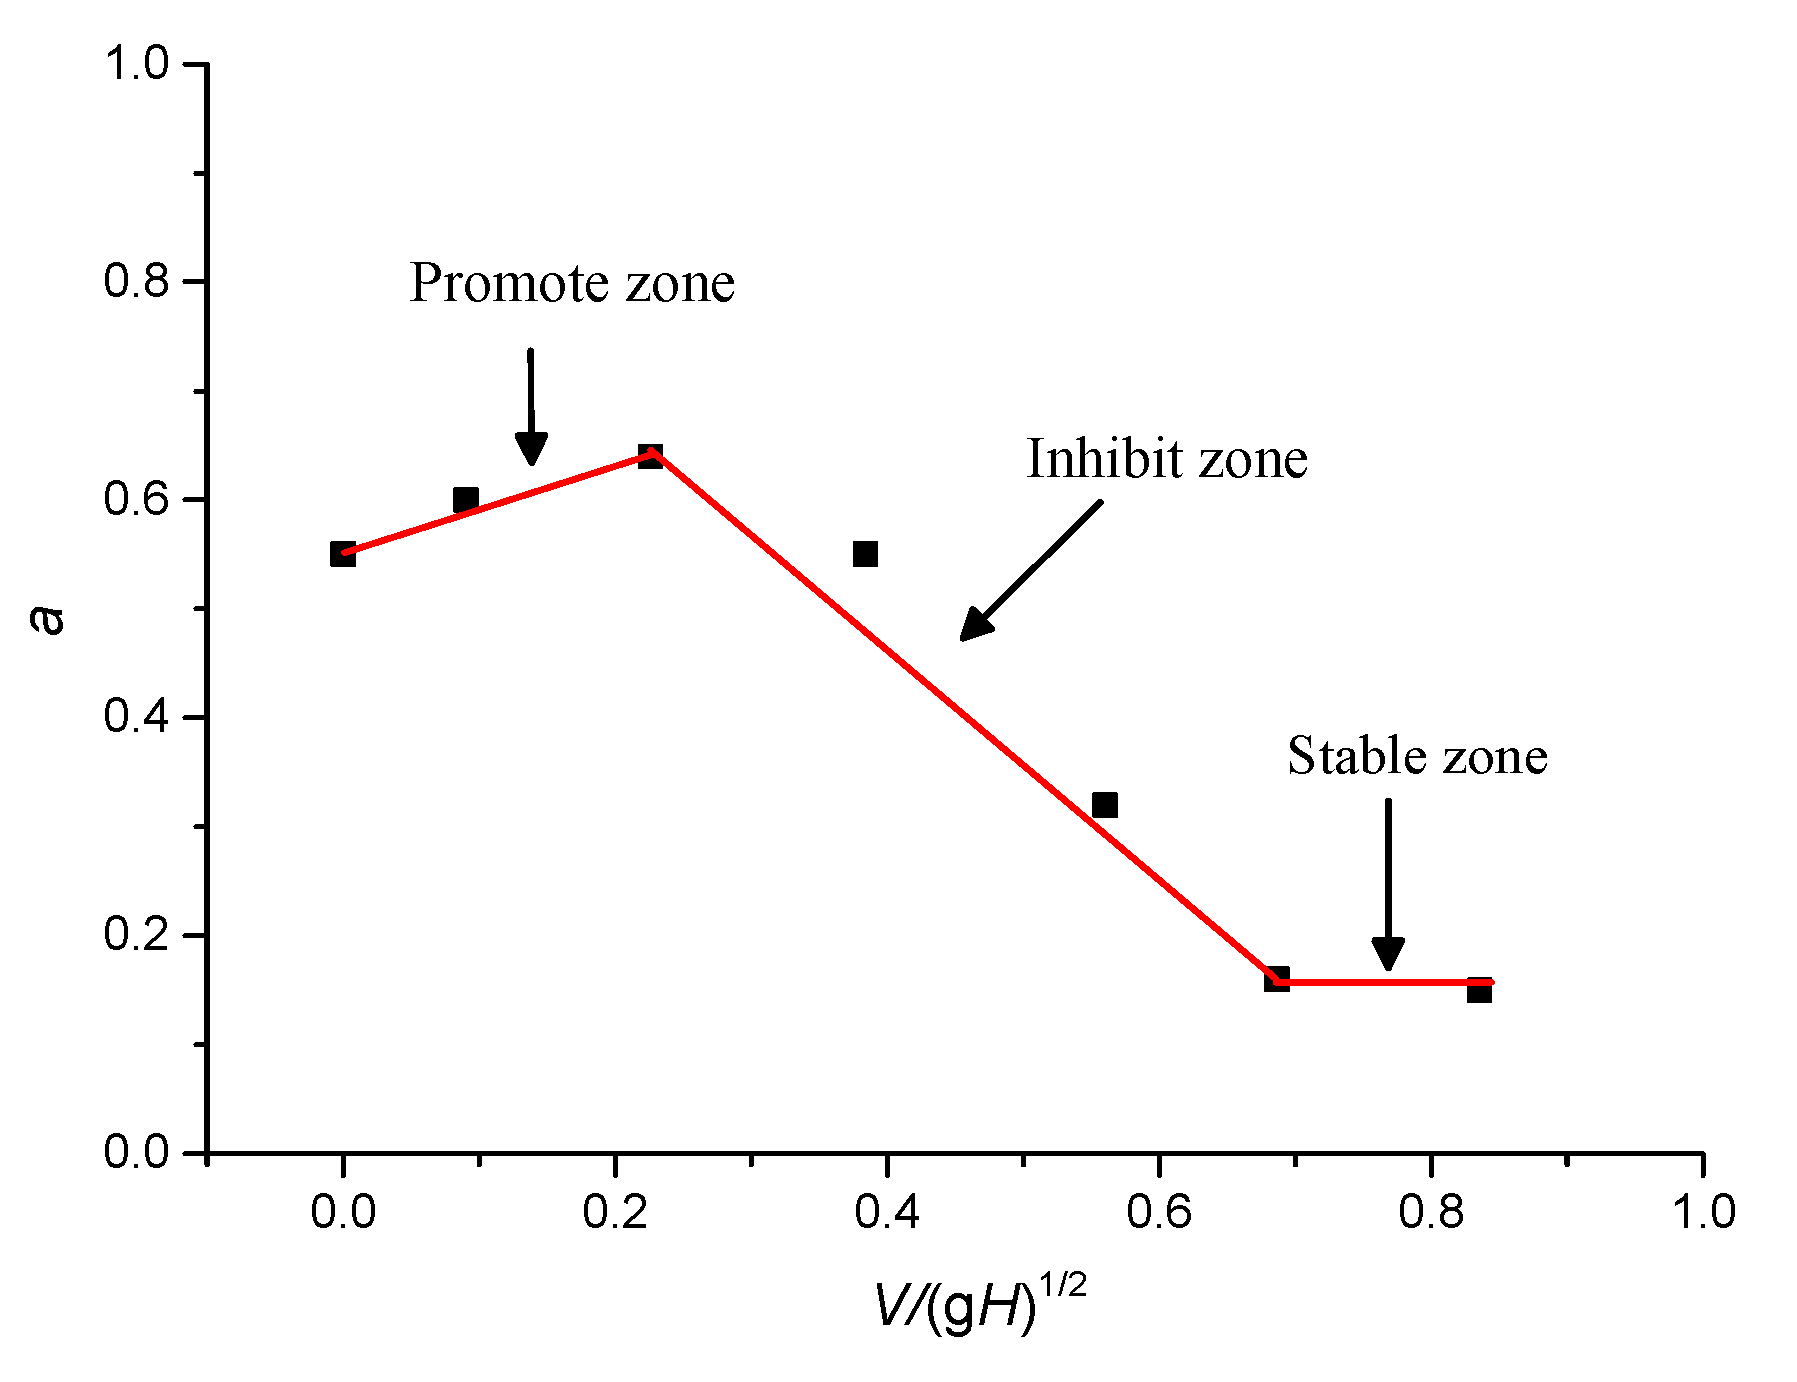
With the increase of wind velocity, the external wind has two effects on the temperature profile in the corridor. With the continuous increase of wind velocity, the temperature profile will first increase with wind velocity and then decrease, owing to its effect on the spilled smoke into the corridor. Based on the predictive correlation for the ceiling maximum temperature, an effective HRR, Qcorridor, is defined to account for the amount of the spilled thermal plume into the corridor.
(2)
The dam-boards at the end of the corridor opening have an obvious influence and play an important role on the smoke accumulation and temperature distribution in the corridor. For the same HRR and wind velocity, the cases with dam-boards at the corridor openings have evidently higher temperatures.
(3)
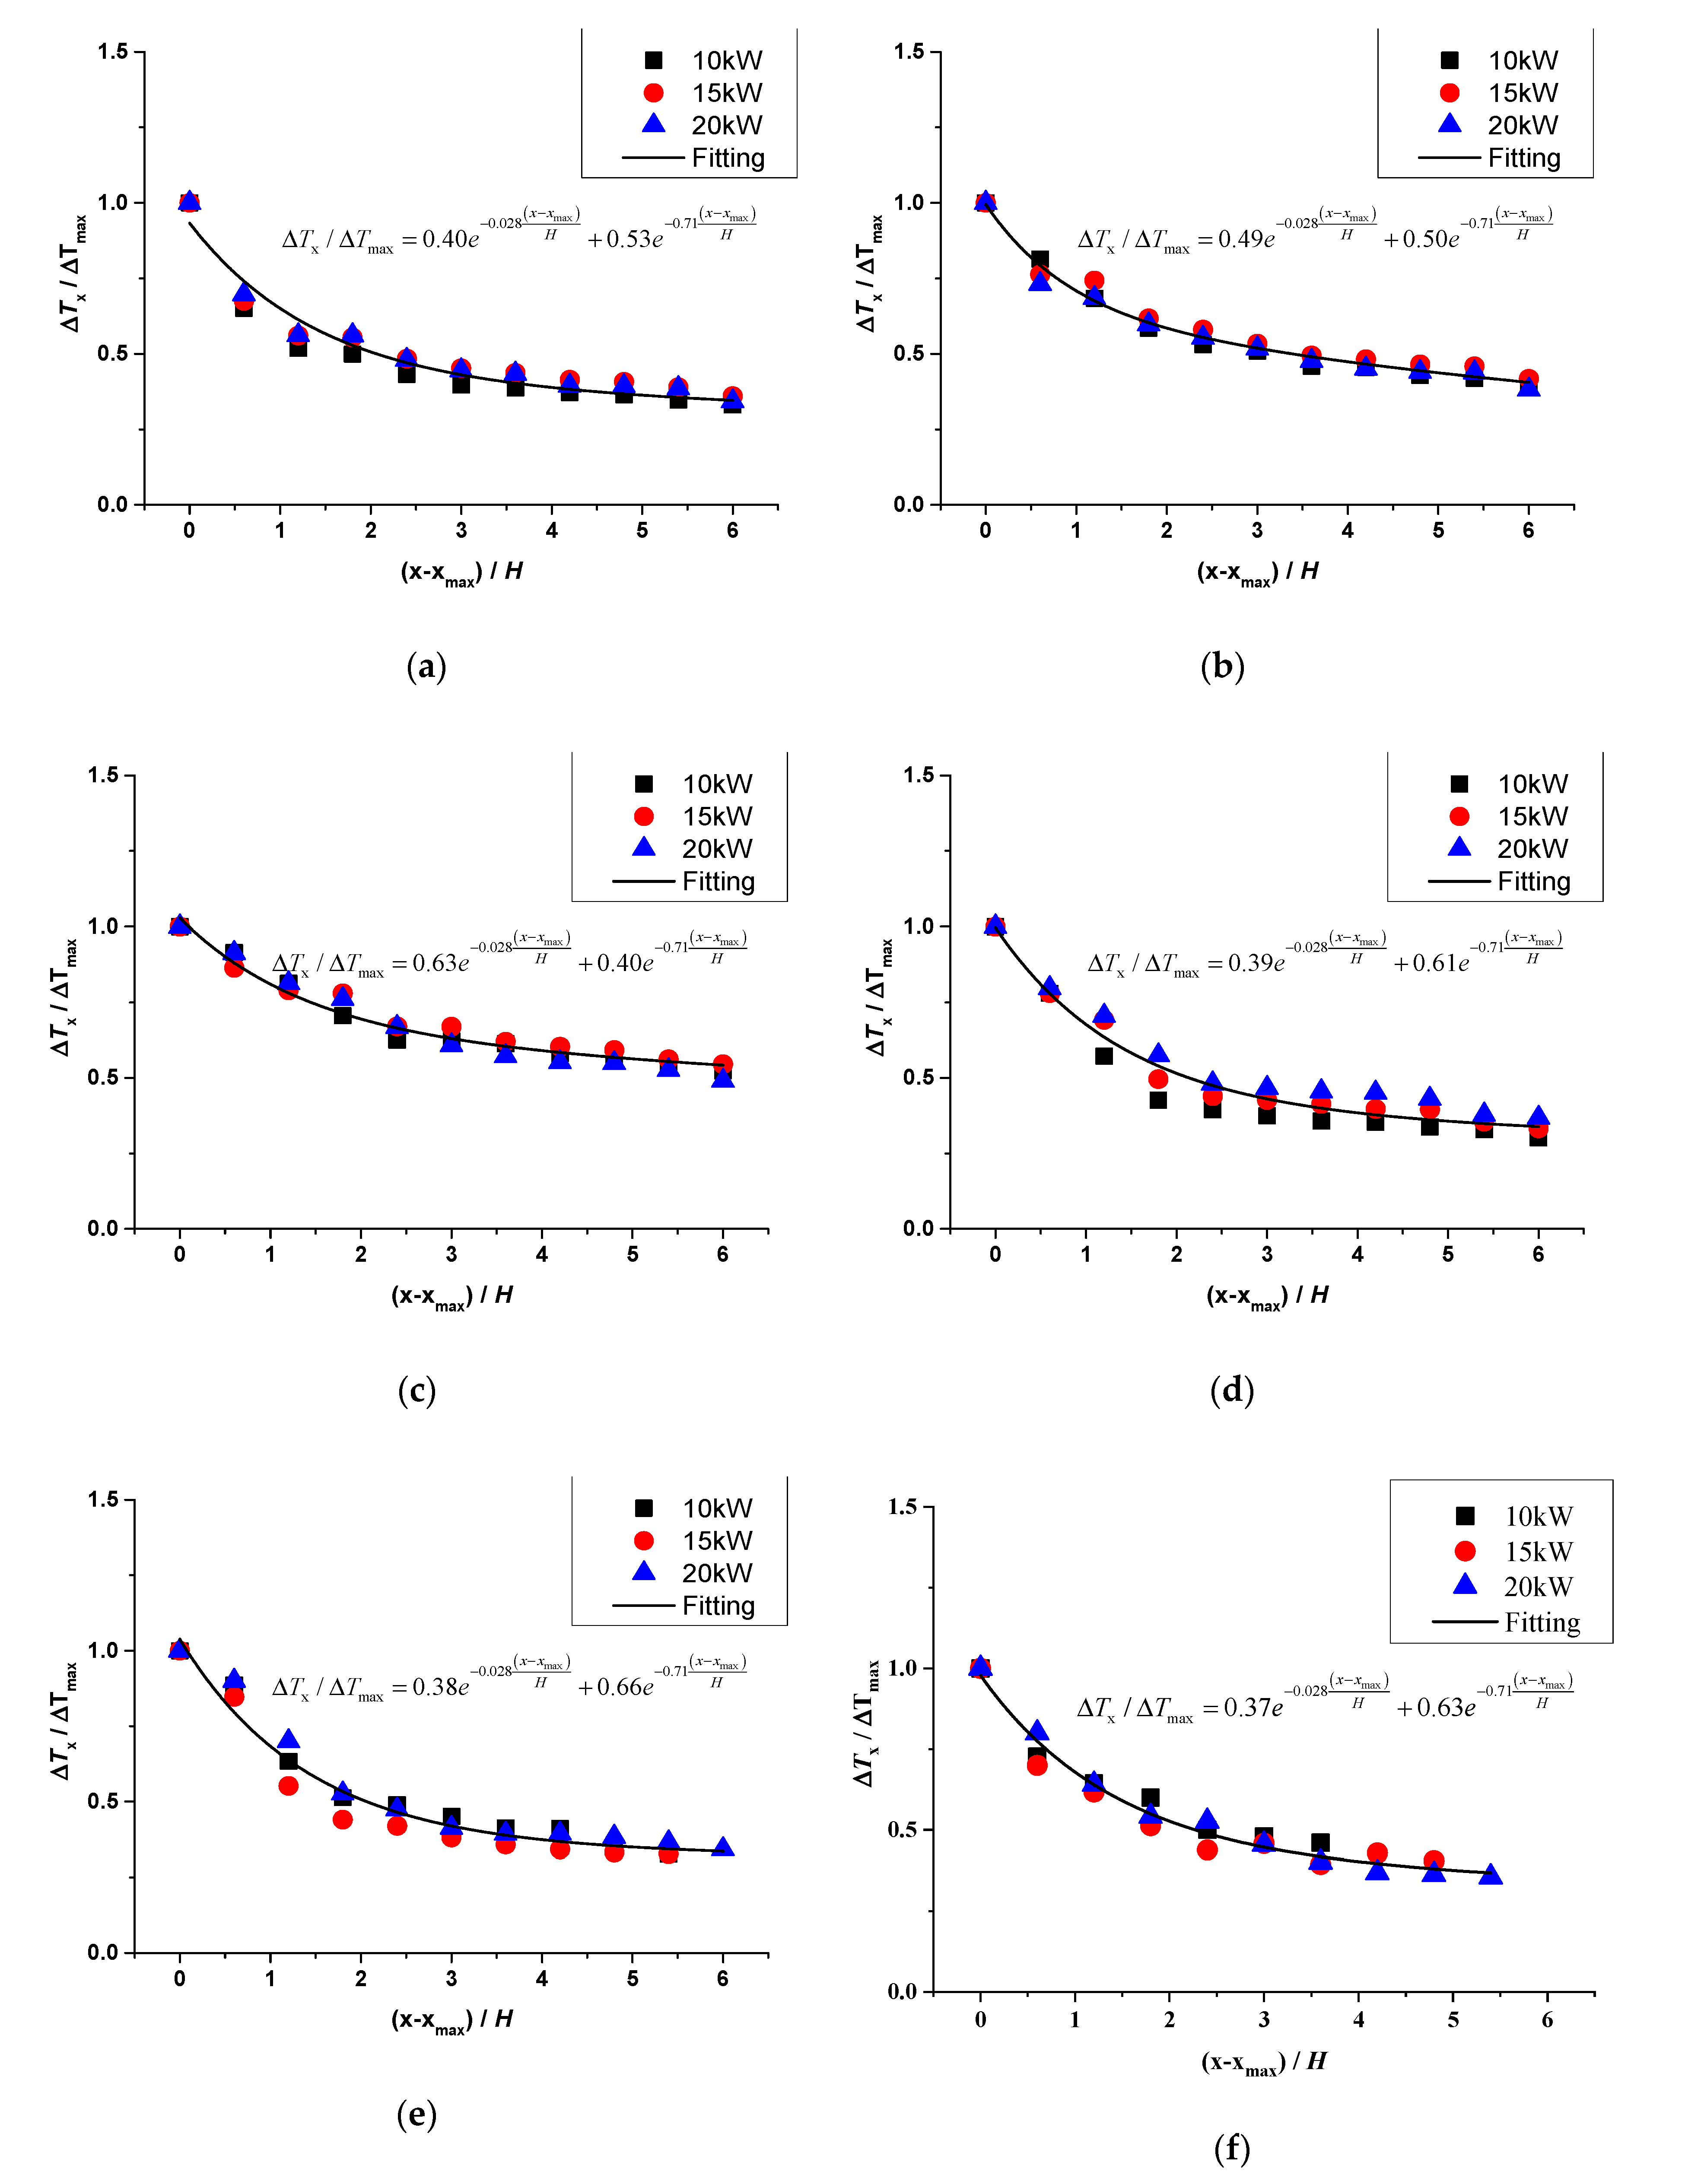
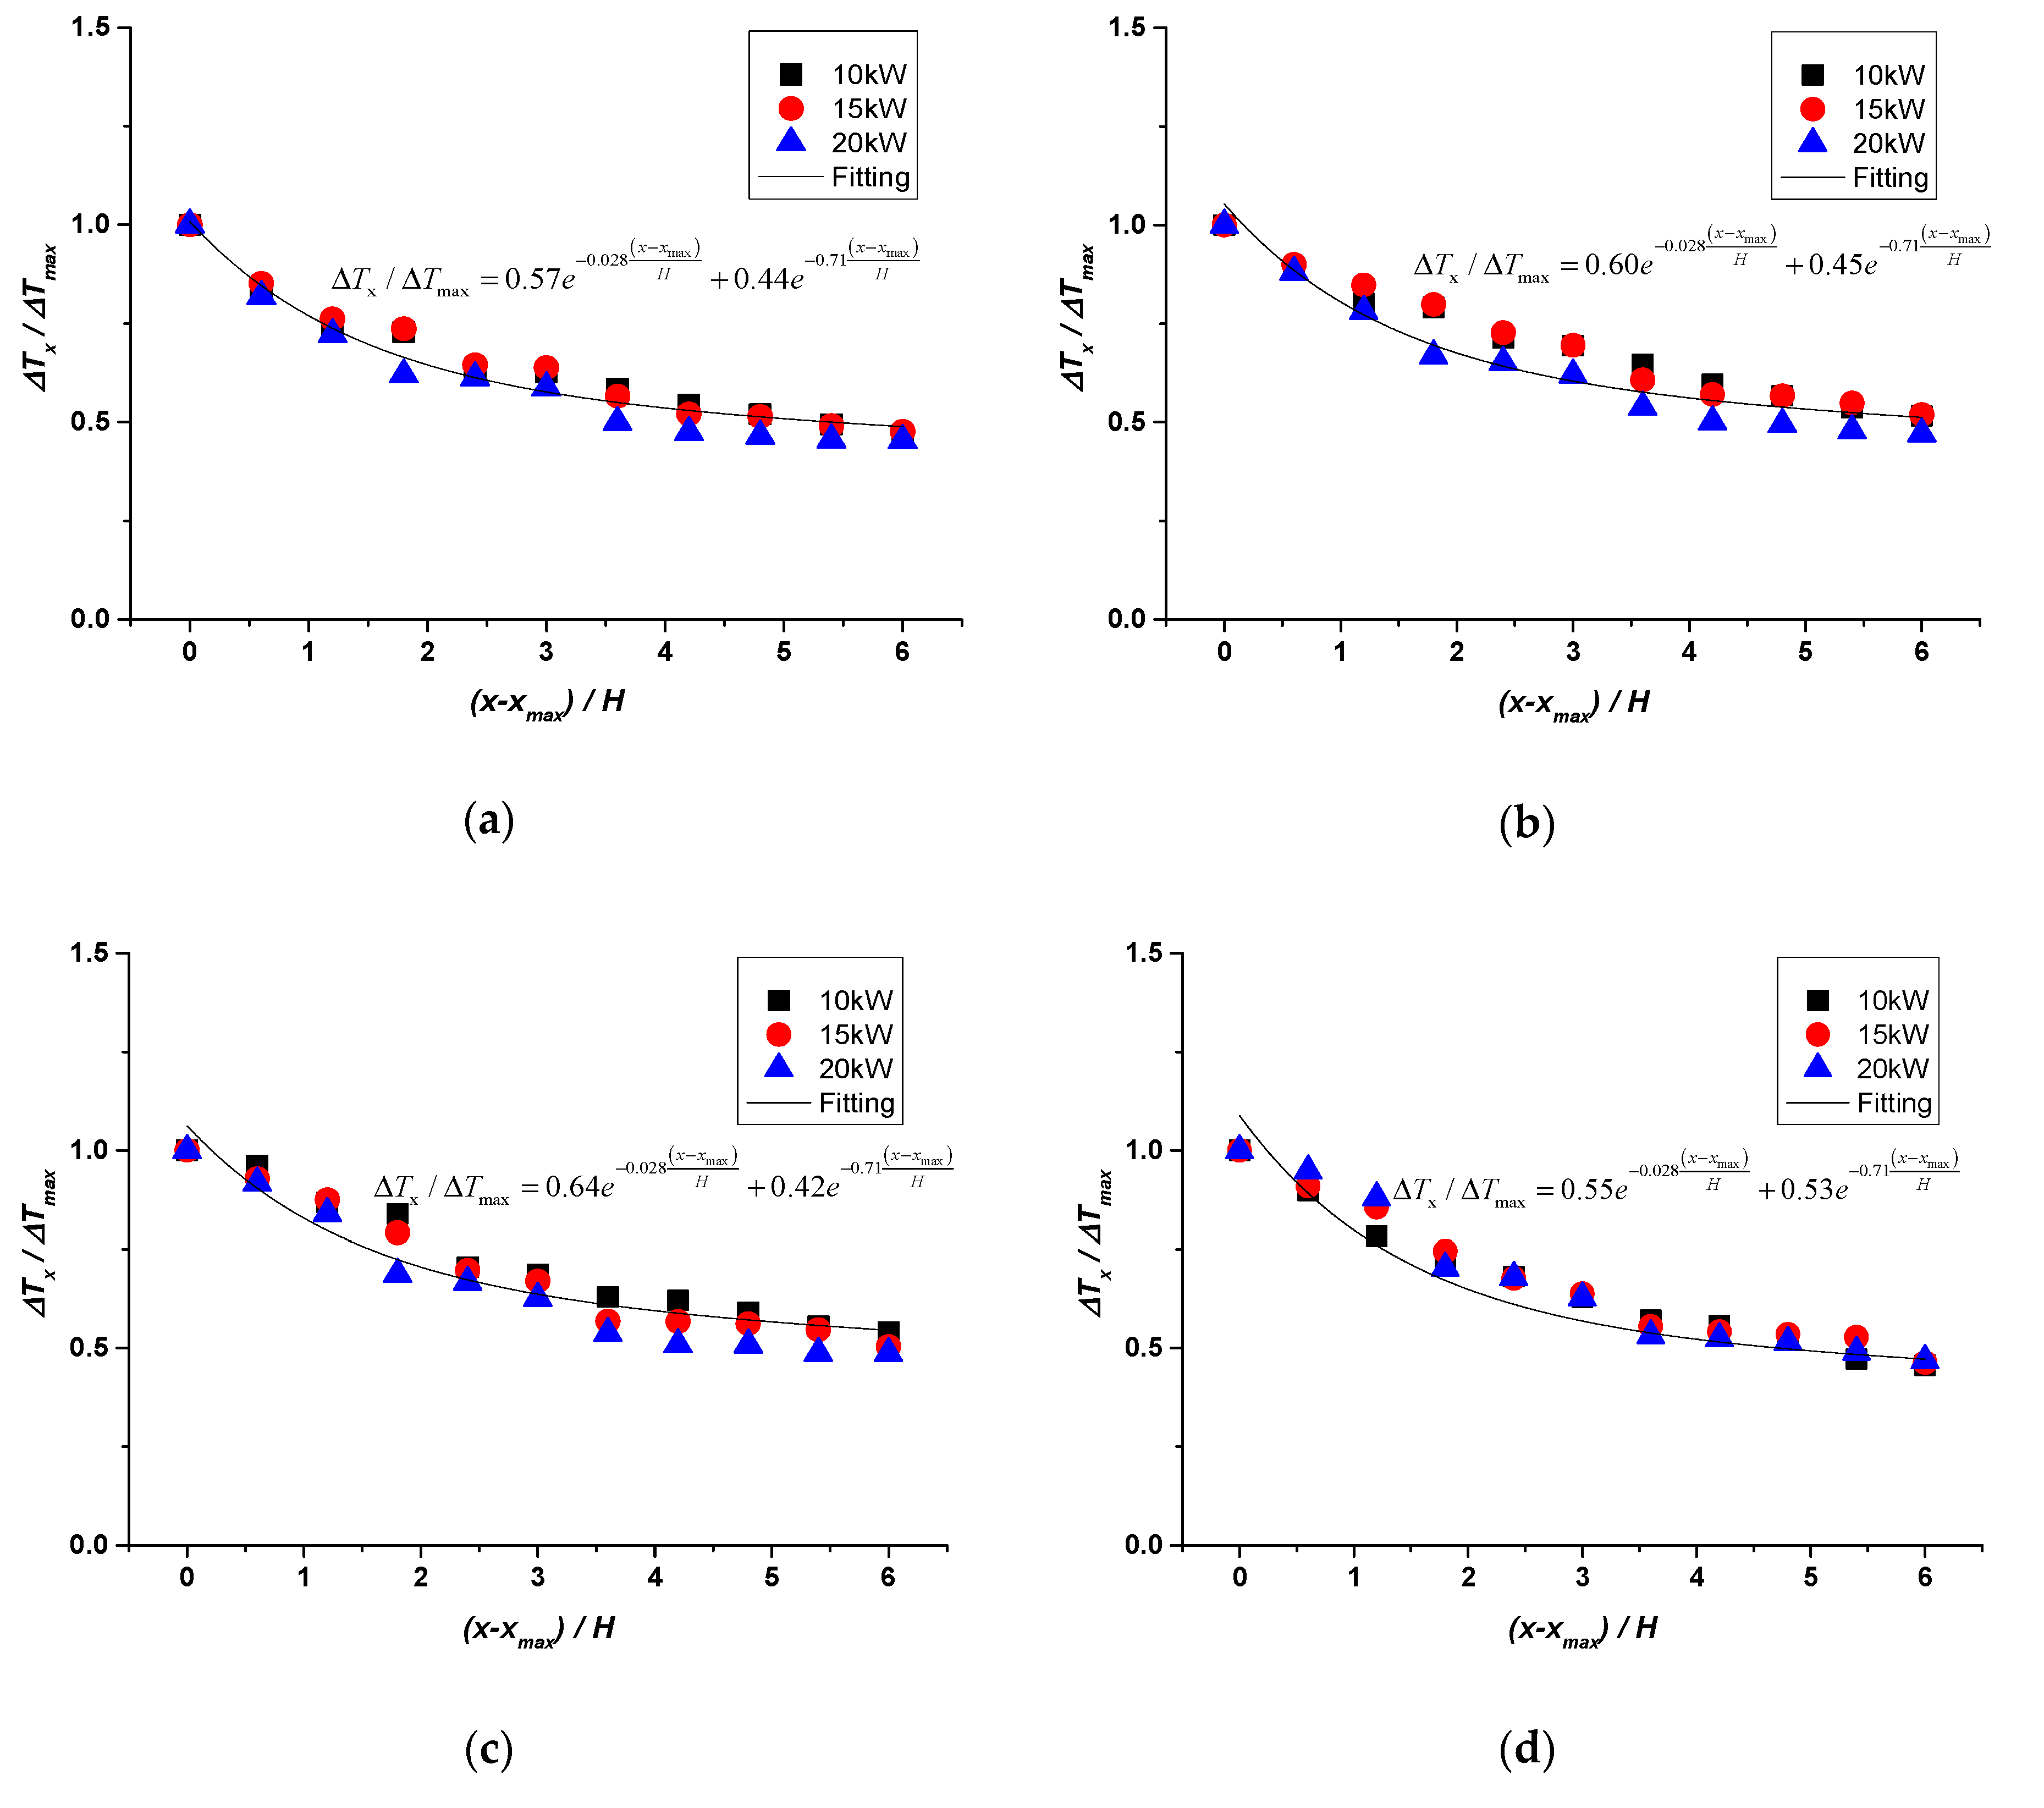
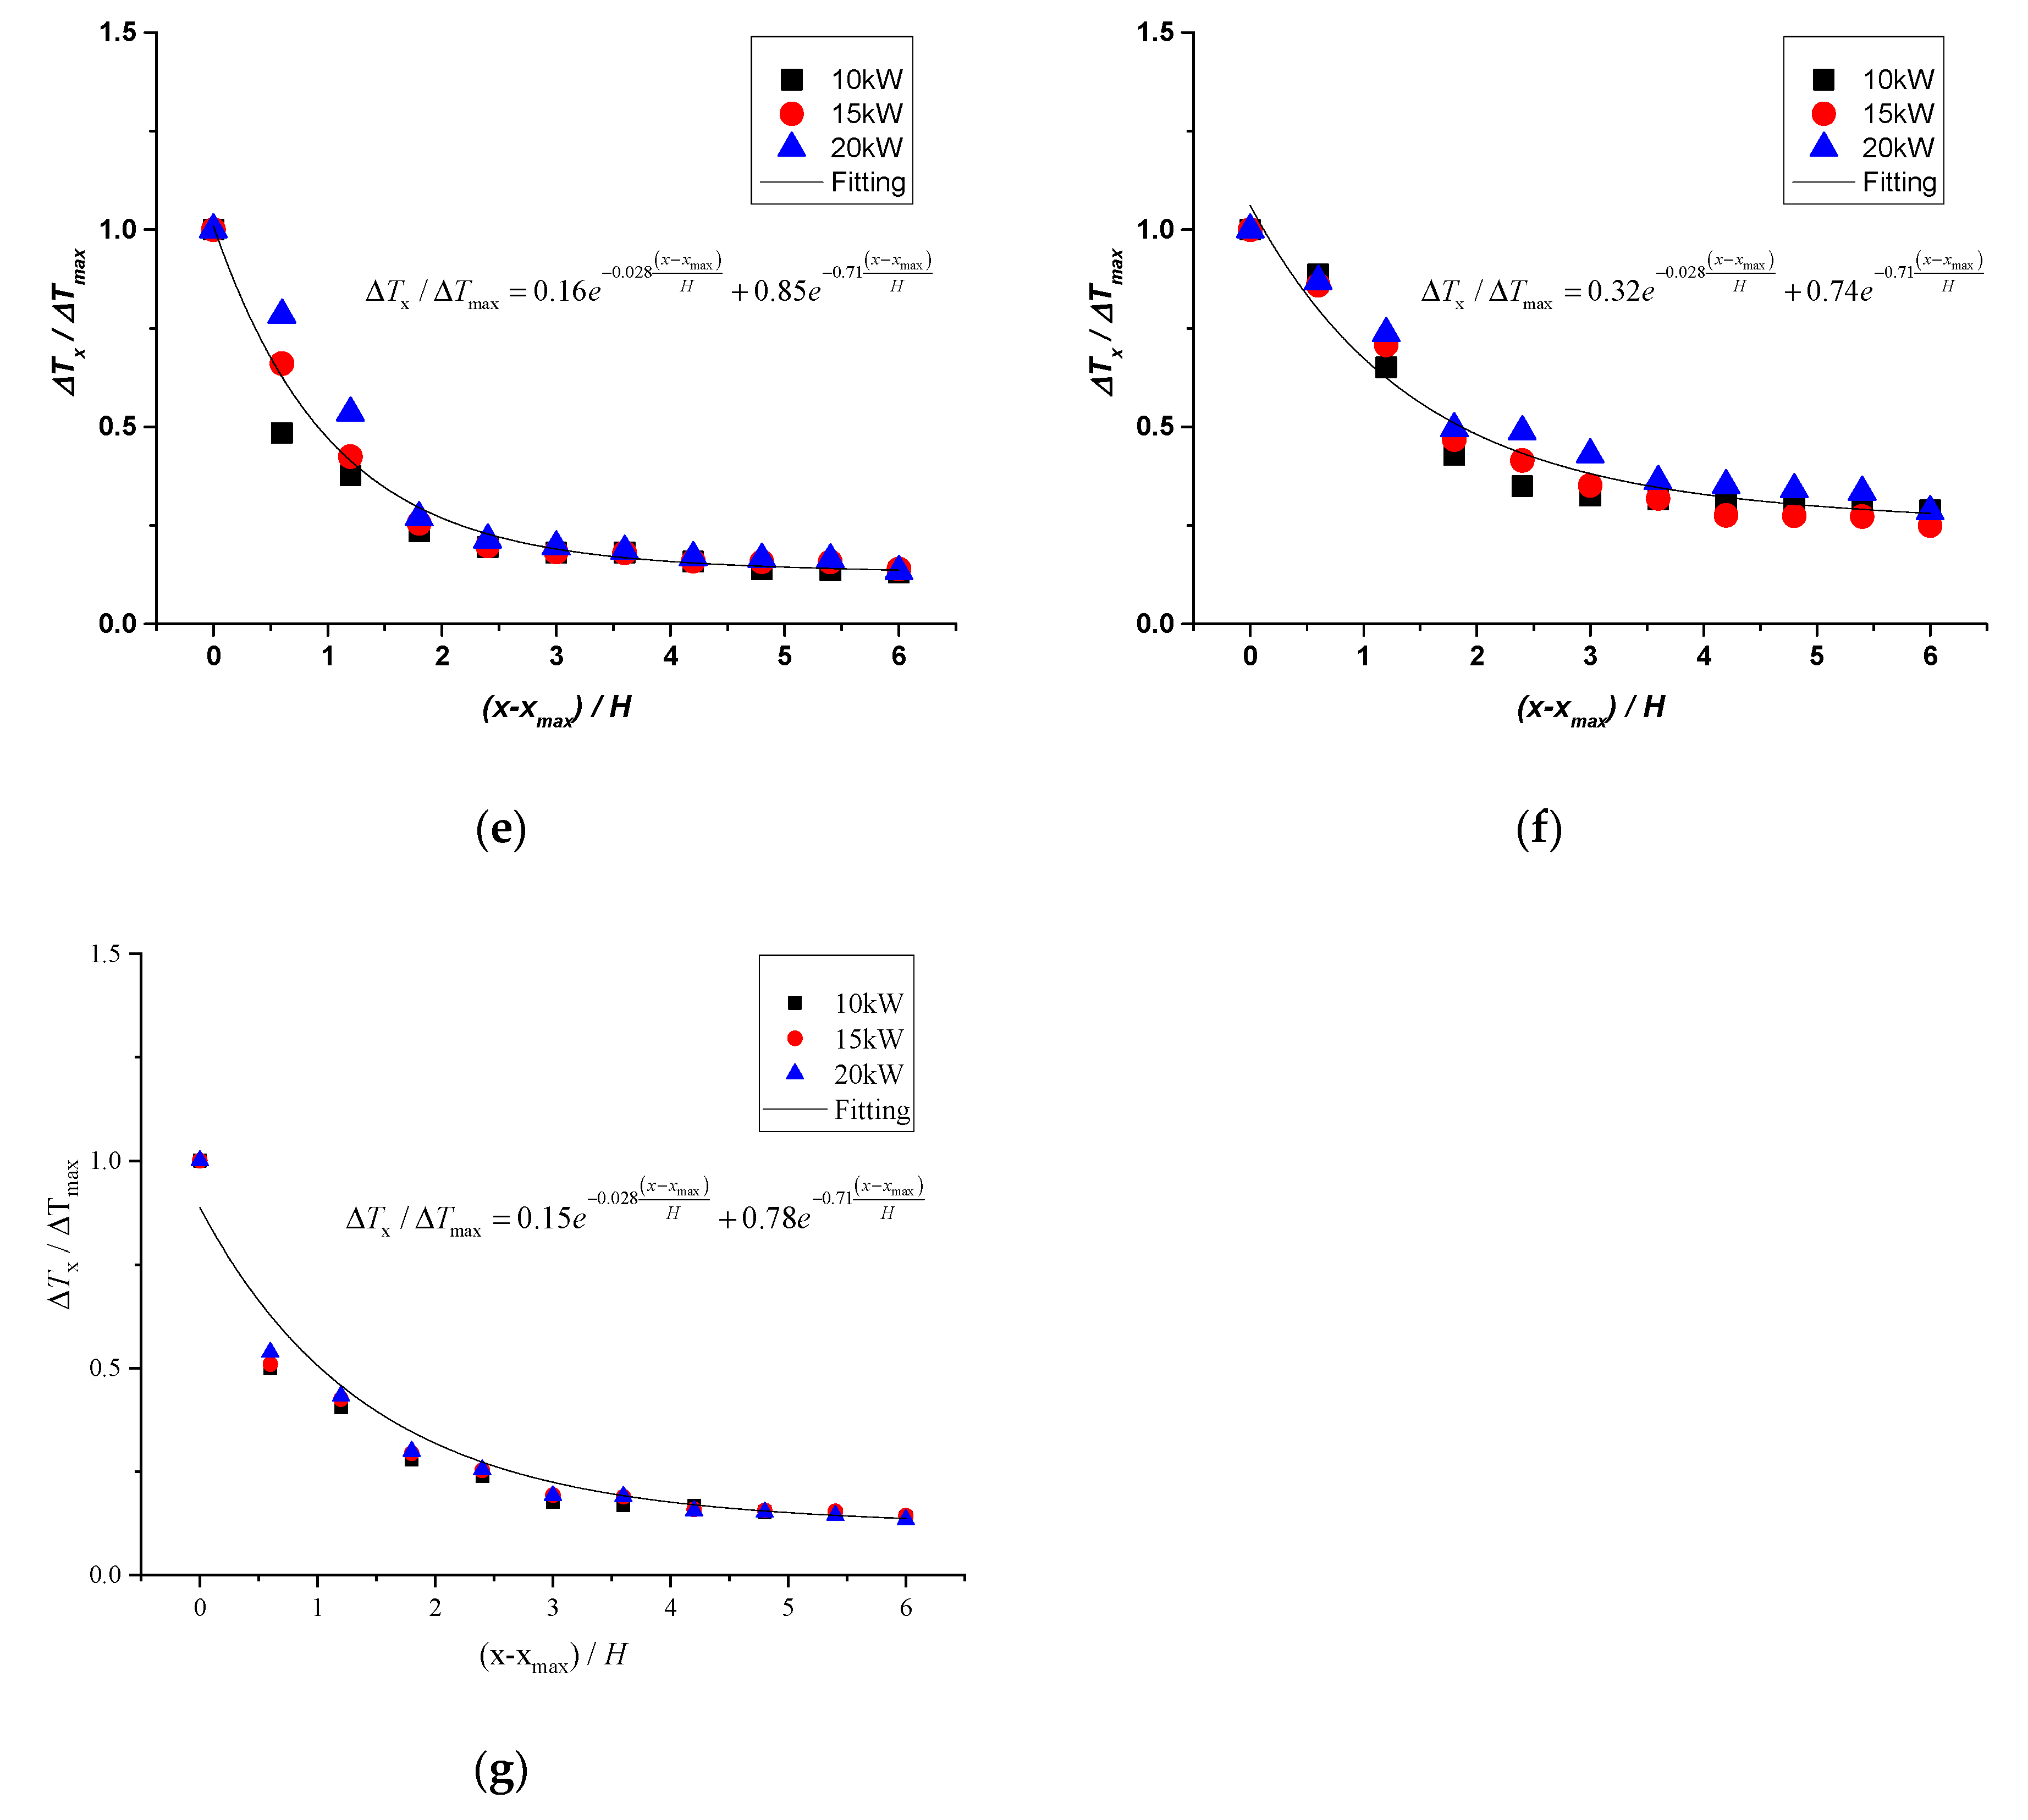
Taking the maximum ceiling temperature ∆Tmax as the reference temperature, the temperature distribution under the ceiling can be well fitted by the sum of two exponential functions. Uniform correlations are proposed for predicting the attenuation law of ceiling excess temperature in the corridor for the corridor ends both with and without dam-boards.
In fire engineering, the applications of this work relate to the effects of ambient wind on internal fire protection systems, such as smoke control and ceiling-temperature detection systems. In order to control the smoke transportation to other parts of building through longitudinal or vertical passages, it is necessary for various smoke-control approaches that are currently in use to take the potential influence of external wind into account in their design.

Author Contributions

Conceptualization, B.C.; methodology, B.C., K.Y.; software, B.C., Y.Z.; formal analysis, B.C., Y.H.; investigation, B.C., Y.H., H.L.; writing—original draft preparation, B.C.; writing—review and editing, K.Y.; supervision, L.Y., X.Z.; project administration, L.Y.; funding acquisition, L.Y. All authors have read and agreed to the published version of the manuscript.

Funding

This research was funded by National Key R&D Program of China under Grant No. 2016YFC0800603, the Key Research Program of the Chinese Academy of Sciences (No. QYZDB-SSW-JSC029) and the Fundamental Research Funds for the Central Universities (No. WK6030000097, No. WK2320000040).

Acknowledgments

The authors would like to thank Xiaoyu Ju and Qiang Wang for their help in the wind tunnel experiments.

Conflicts of Interest

The authors declare no conflict of interest.

References

  1. DiGuiseppi, C.; Edwards, P.; Godward, C.; Roberts, I.; Wade, A. Urban residential fire and flame injuries: A population based study. Injury Prev. 2000, 6, 250–254. [Google Scholar] [CrossRef] [PubMed] [Green Version]
  2. Zhao, P.; Yuan, Z.; Yuan, Y.; Yu, N.; Yu, T. A Study on Ceiling Temperature Distribution and Critical Exhaust Volumetric Flow Rate in a Long-Distance Subway Tunnel Fire with a Two-Point Extraction Ventilation System. Energies 2019, 12, 1411. [Google Scholar] [CrossRef] [Green Version]
  3. Gao, Z.; Ji, J.; Wan, H.; Li, K.; Sun, J. An investigation of the detailed flame shape and flame length under the ceiling of a channel. Proc. Combust. Inst. 2015, 35, 2657–2664. [Google Scholar] [CrossRef]
  4. Park, J.-C.; Kim, I.-H.; Jung, H.-J. Feasibility Study of Fluctuating Wind Pressure around High-Rise Buildings as a Potential Energy-Harvesting Source. Energies 2019, 12, 4032. [Google Scholar] [CrossRef] [Green Version]
  5. Gao, Z.; Wan, H.; Ji, J.; Bi, Y. Experimental prediction on the performance and propagation of ceiling jets under the influence of wall confinement. Energy 2019, 178, 378–385. [Google Scholar] [CrossRef]
  6. Ye, K.; Zhou, X.; Yang, L.; Tang, X.; Zheng, Y.; Cao, B.; Peng, Y.; Liu, H.; Ni, Y. A Multi-Scale Analysis of the Fire Problems in an Urban Utility Tunnel. Energies 2019, 12, 1976. [Google Scholar] [CrossRef] [Green Version]
  7. Ewens, D. The Transport and Remote Oxidation of Compartment Fire Exhaust Gases. Master’s Thesis, Virginia Polytechnic Institute, Blacksburg, VA, USA, 1994. [Google Scholar]
  8. Wieczorek, C.J. Carbon Monoxide Generation and Transport from Compartment Fires. Ph.D. Thesis, Virginia Polytechnic Institute and State University, Blackburg, VA, USA, 2003. [Google Scholar]
  9. Yang, L.Z.; Feng, W.X.; Ye, J.Q. Experimental research on the spatial distribution of toxic gases in the transport of fire smoke. J. Fire Sci. 2008, 26, 45–62. [Google Scholar]
  10. Blocken, B.; Carmeliet, J. Pedestrian wind environment around buildings: Literature review and practical examples. J. Therm. Envel. Build. Sci. 2004, 28, 107–159. [Google Scholar] [CrossRef]
  11. Chen, H.; Liu, N.; Zhang, L.; Deng, Z.; Huang, H. Experimental study on cross-ventilation compartment fire in the wind environment. Fire Saf. Sci. 2008, 9, 907–918. [Google Scholar] [CrossRef]
  12. Craighead, G. High-Rise Security and Fire Life Safety; Butterworth-Heinemann: Oxford, UK, 2009. [Google Scholar]
  13. Chen, H.X.; Liu, N.A.; Chow, W.K. Wind tunnel tests on compartment fires with crossflow ventilation. J. Wind Eng. Ind. Aerodyn. 2011, 99, 1025–1035. [Google Scholar] [CrossRef]
  14. Huang, H.; Ooka, R.; Liu, N.; Zhang, L.; Deng, Z.; Kato, S. Experimental study of fire growth in a reduced-scale compartment under different approaching external wind conditions. Fire Saf. J. 2009, 44, 311–321. [Google Scholar] [CrossRef]
  15. Himoto, K.; Tsuchihashi, T.; Tanaka, Y.; Tanaka, T. Modeling thermal behaviors of window flame ejected from a fire compartment. Fire Saf. J. 2009, 44, 230–240. [Google Scholar] [CrossRef] [Green Version]
  16. Li, Y.Z.; Lei, B.; Ingason, H. The maximum temperature of buoyancy-driven smoke flow beneath the ceiling in tunnel fires. Fire Saf. J. 2011, 46, 204–210. [Google Scholar] [CrossRef]
  17. Ingason, H.; Li, Y.Z. Model scale tunnel fire tests with longitudinal ventilation. Fire Saf. J. 2010, 45, 371–384. [Google Scholar] [CrossRef]
  18. Kurioka, H.; Oka, Y.; Satoh, H.; Sugawa, O. Fire properties in near field of square fire source with longitudinal ventilation in tunnels. Fire Saf. J. 2003, 38, 319–340. [Google Scholar] [CrossRef]
  19. Hu, L.H.; Huo, R.; Peng, W.; Chow, W.K.; Yang, R.X. On the maximum smoke temperature under the ceiling in tunnel fires. Tunn. Undergr. Space Technol. 2006, 21, 650–655. [Google Scholar] [CrossRef]
  20. Agred, S.; Benarous, A.; Karmed, D.; Loukarfi, L. Simplified Calculation Methods on Smoke and Temperature Stratification in Ventilated Compartments, Conference on Multiphysics Modelling and Simulation for Systems Design; Springer: Cham, Switzerland, 2014; pp. 9–18. [Google Scholar]
  21. Yeoh, G.H.; Yuen, K.K. Computational Fluid Dynamics in Fire Engineering: Theory, Modelling and Practice; Butterworth-Heinemann: Oxford, UK, 2009. [Google Scholar]
  22. Schrefler, B.A.; Codina, R.; Pesavento, F.; Principe, J. Thermal coupling of fluid flow and structural response of a tunnel induced by fire. Int. J. Numer. Meth. Eng. 2011, 87, 361–385. [Google Scholar] [CrossRef]
  23. Mcgrattan, K.; Hostikka, S.; Mcdermott, R.; Floyd, J.; Weinschenk, C.; Overholt, K. Fire Dynamics Simulator User’s Guide; National Institute of Standards and Technology: Gaithersburg, MA, USA, 2018. [Google Scholar]
  24. Zhao, G.; Beji, T.; Merci, B. Study of FDS simulations of buoyant fire-induced smoke movement in a high-rise building stairwell. Fire Saf. J. 2017, 91, 276–283. [Google Scholar] [CrossRef]
  25. Emori, R.I.; Saito, K. Model rules on motion of smoke and gases in building fires. Bull. Jpn. Assoc. Fire Sci. Eng. 1979, 29, 41–49. [Google Scholar]
  26. Drysdale, D. Fire Science and Combustion. In An Introduction to Fire Dynamics, 3rd ed.; Drysdale, D., Ed.; John Wiley and Sons: Chichester, UK, 2011; p. 20. [Google Scholar]
  27. Lee, Y.P.; Delichatsios, M.A.; Silcock, G.W.H. Heat flux and flame heights in facades from fires in enclosures of varying geometry. Proc. Combust. Inst. 2007, 31, 2521–2528. [Google Scholar] [CrossRef]
  28. Delichatsios, M.A.; Lee, Y.P.; Tofilo, P. A new correlation for gas temperature inside a burning enclosure. Fire Saf. J. 2009, 44, 1003–1009. [Google Scholar] [CrossRef]
Figure 1. The typical room–corridor structure in buildings.
Energies 13 01826 g001
Figure 2. Schematic diagram and detailed dimensions of model-scale building structure: (a) top view; (b) side view.
Energies 13 01826 g002
Figure 3. Arrangement of the thermocouples.
Energies 13 01826 g003
Figure 4. Schematic diagram of the wind tunnel: (a) wind tunnel; (b) dimensions of wind tunnel.
Energies 13 01826 g004
Figure 5. The temperature profile for the heat release rate (HRR) of 20 kW (fully open to the environment).
Energies 13 01826 g005aEnergies 13 01826 g005b
Figure 6. The maximum temperature under the ceiling of the corridor: (a) fully open to the environment; (b) partially open to the environment.
Energies 13 01826 g006
Figure 7. Effective HRR in the corridor (Qcorridor): (a) fully open to the environment; (b) partially open to the environment.
Energies 13 01826 g007
Figure 8. The ceiling temperature distribution for the corridor open to the environment: (a) HRR of 10 kW; (b) HRR of 15 kW; (c) HRR of 20 kW.
Energies 13 01826 g008
Figure 9. The ceiling temperature distribution for corridor partially open to the environment (with dam-board at the end): (a) HRR of 10 kW; (b) HRR of 15 kW; (c) HRR of 20 kW.
Energies 13 01826 g009
Figure 10. Ceiling temperature distribution relative to distance for corridor open to the environment: (a) 0 m/s; (b) 0.2 m/s; (c) 0.5 m/s; (d) 0.85 m/s; (e) 1.24 m/s; (f) 1.52 m/s.
Energies 13 01826 g010
Figure 11. The coefficient a relative to wind velocity   V / g H for the corridor open to the environment.
Energies 13 01826 g011
Figure 12. Ceiling temperature distribution relative to distance with a dam-board at the corridor end: (a) 0 m/s; (b) 0.2 m/s; (c) 0.5 m/s; (d) 0.85 m/s; (e) 1.24 m/s; (f) 1.52 m/s; (g) 1.85 m/s.
Energies 13 01826 g012aEnergies 13 01826 g012b
Figure 13. The coefficient a relative to wind velocity   V / g H with dam-board at the corridor ends.
Energies 13 01826 g013
Table 1. The critical HRR for different wind velocities.
Velocity (m/s)0.20.50.851.241.521.852.09
Qcritical (kW)2.1032.84161.34500.90922.61663.42398.4

