Article

An Unstructured Model for Anaerobic Treatment of Raw Cheese Whey for Volatile Fatty Acids Production

by
Claudio B-Arroyo
1,
Antonio Lara-Musule
2,
Ervin Alvarez-Sanchez
2,
Gloria Trejo-Aguilar
3,
Juan-Rodrigo Bastidas-Oyanedel
4,* and
Eliseo Hernandez-Martinez
1,*
1
Facultad de Ciencias Químicas, Universidad Veracruzana, Xalapa Veracruz 91090, Mexico
2
Facultad de Ingeniería Mecánica-Eléctrica, Universidad Veracruzana, Xalapa Veracruz 91090, Mexico
3
Departamento de Biotecnología, Universidad Autónoma Metropolitana, Iztapalapa, Cd. Mexico 09340, Mexico
4
SDU-KBM, Department of Chemical Engineering, Biotechnology and Environmental Technology, University of Southern Denmark, 5230 Odense, Denmark
*
Authors to whom correspondence should be addressed.
Energies 2020, 13(7), 1850; https://doi.org/10.3390/en13071850
Submission received: 1 March 2020 / Revised: 3 April 2020 / Accepted: 9 April 2020 / Published: 10 April 2020
(This article belongs to the Special Issue Bioenergy from Organic Waste)

Abstract

:
The whey is a byproduct of the dairy industry that, if not treated properly, can cause serious environmental pollution problems. Anaerobic treatment is an alternative for its recovery, since, in addition to reducing the organic load. it allows the generation of value-added products such as volatile fatty acids (VFA) and biogas. However, the process is very complex and requires specific operating conditions that guarantee its stability and favor the production of value-added compounds. In this work, an unstructured mathematical model is proposed to evaluate the dynamic behavior of the stages of the anaerobic degradation process of the whey (i.e., hydrolysis, acidogenesis, acetogenesis and methanogenesis). The proposed model considers the dynamic variation in pH during the experiment. To validate the model, an experimental set was carried out at pH and temperature conditions that favor the production of VFAs. Experimental results show that the anaerobic treatment of the raw cheese whey favors pH = 5.5; for T = 40 °C, the maximum VFA production is obtained (30.71 gCOD L−1), and for T = 35 °C, a 45.81% COD degradation is reached. The proposed model considers the effect of pH and temperature and it is validated in the region where the experimental tests were carried out. The model parameters were estimated using the Levenberg–Marquardt method, obtaining coefficients of determination R2 > 0.94. The proposed model can describe the dynamic behavior of the key variables in the anaerobic treatment of raw cheese whey at different pH and temperature conditions, finding that VFA production is favored at pH ≥ 7, while the highest COD removal results in acidic conditions

1. Introduction

The dairy industry is one of the most important food industries in the world. About 50 thousand tons of cheese are produced annually, which represents an approximate production of 500 thousand liters of whey [1]. Cheese whey is characterized by its high organic load, mainly composed of lactose, proteins and lipids. In addition, whey chemical oxygen demand values range from 60 to 190 gCOD L−1 and have a biodegradability of 60% to 99% [2]. For its valorization, there are different processes that range from the generation of other products (e.g., cheese spread, energy drinks), to its treatment through biotechnological processes to produce value-added products such as volatile fatty acids (VFAs) and/or biogas [3,4]. However, such technologies are not available to all industries, specifically small and medium-sized companies that lack the resources to implement processes for the recovery of whey. A common practice is to pour the whey directly into the environment without any treatment, which causes serious environmental pollution problems [5].
By determining the appropriate operating conditions, anaerobic cheese whey treatment can be an economically viable alternative. However, whey is a complex substrate requiring a rigorous study to determine the conditions that maintain the requirements of each consortium of microorganisms and achieve maximum process performance [6]. In general, the variables that have an impact on the overall stability of the process are the oxidation state of carbon in the substrate, pH, and temperature, as well as the hydraulic retention time (HRT) and the reactor set-up. For example, Calero et al. [7] evaluated the influence of pH, sludge retention time (SRT) and organic loading rate (OLR) in the fermentation of cheese whey to produce volatile fatty acids (VFA), finding that, depending on the operating conditions, different types of VFA are generated. For pH conditions between 5 and 6, the production of acetic and propionic acids is favored. On the other hand, lower OLR favored the production of propionic and valeric acids, while higher OLR increased the production of butyric acid. Several studies have found that pH is a key variable in fermentation that significantly influences the VFA concentration and composition, where the adequate pH value depends on the type of substrate [8,9,10]. Jankowska et al. [8] carried out a study on the effect of substrate complexity and pH on the VFA production, identifying that, at neutral pH, the production of VFA from whey is favored. Yang et al. [9] studied the effect of HRT and pH on the thermophilic anaerobic treatment of cheese whey by response surface methodology. For the selective VFA production (acetic and butyric acids), they found that, at acid operating conditions (pH < 6.5) and HRT > 1 d, VFA production is favored. De Gioannis et al. [10] studied the dark fermentation of cheese whey by hydrogen production, analyzing the pH effect on mesophilic conditions. Their results indicated that hydrogen production was affected by factors such as the substrate and inoculum characteristics and pH operating. For VFA production, the process was favored by decreasing the substrate–inoculum ratio concentration.
The experimental evaluation of the key variables effects in the overall process performance is usually expensive and requires long experimentation time. Mathematical modeling can be an alternative to complement the study of anaerobic treatment, since it can contribute to a better understanding of the dynamic process, delimit the operating conditions, and help to implement control and optimization strategies [11,12,13]. Despite the advantages of mathematical models, the determination of the parameters described by the biochemical reactions in each process stage is not a simple task. Methodologies based on parametric estimation allow the calculation of model parameters, avoiding the necessity of large experimental sets, and providing approximations with good accuracy about the dynamic process behavior [14,15]. Addressing this approach, models have recently been proposed for the anaerobic treatment of complex substrates [16,17]. For example, Arudchelvam et al. [16] proposed a kinetic model to predict the rate of VFA production in the dark fermentation of cattle manure and a heat-treated inoculum for the removal of methanogenic consortia in a batch reactor. The proposed model is based on the anaerobic digestion model (ADM1) for the hydrolytic and acidogenic stages with pH inhibition. The numerical simulations obtained with the model showed good correspondence with the experimental data (R2 > 0.8). Wang et al. [17] adapted the ADM1 model to evaluate alkaline sludge fermentation, considering the four stages of the process (hydrolysis, acidogenesis, acetogenesis and methanogenesis). The validity and applicability of the model proposed were examined, using experimental data on fermentation products from four independent sludge alkaline fermentation studies. Model proposals for the treatment of crude whey have not been widely addressed. Blanco et al. [18] conducted a study considering synthetic cheese whey in a dark fermentation. They propose an unstructured model to evaluate the dynamic profiles of hydrogen and VFA production, including the effects of pH inhibition. Likewise, the co-digestion of the whey with cow manure or glycerin has been proposed [19,20,21], where the process’s potential to produce VFA and biogas is evaluated. Therefore, mathematical modeling can contribute to the improvement in operating conditions, allowing for the proper valorization of organic waste. Although different unstructured model proposals have been published to date, the interaction between the four stages of anaerobic digestion is very complex and depends on multiple factors, so it is necessary to do a specific study of each substrate, especially for complex substrates such as cheese whey.
Recent works on the anaerobic treatment of cheese whey have been published [22,23,24], however the determination of the operating conditions that favor VFA production using raw whey has been poorly addressed. In addition, the reported works suggest a pretreatment of cheese whey prior to anaerobic treatment with the purpose of increasing the degradability of the substrate and favoring the by-product generation [2,7,25]. Nevertheless, pretreatment increases the number of unit operations, so its potential application in small and medium industries can be limited. In this sense, in this work an unstructured mathematical model for anaerobic treatment of raw cheese whey to VFA production is presented. Although temperature and pH are critical parameters, since they play a relevant role in the control of metabolism and growth of microbial consortia, the proposed model considers the effects of pH and temperature on the VFA production performance. The model parameters were estimated by the Levenberg–Marquardt algorithm using a set of experiential data from the anaerobic fermentation of raw cheese whey at mesophilic temperatures. The proposed model at different pH and temperature conditions was evaluated, finding good correspondence between the estimated dynamic profiles and the experimental data, with high correlation coefficients (R2 > 0.94). This suggests that the proposed model can evaluate the anaerobic fermentation process for the treatment of raw cheese whey at different pH and temperature ranges, which could reduce the time and cost of experimentation.

2. Materials and Methods

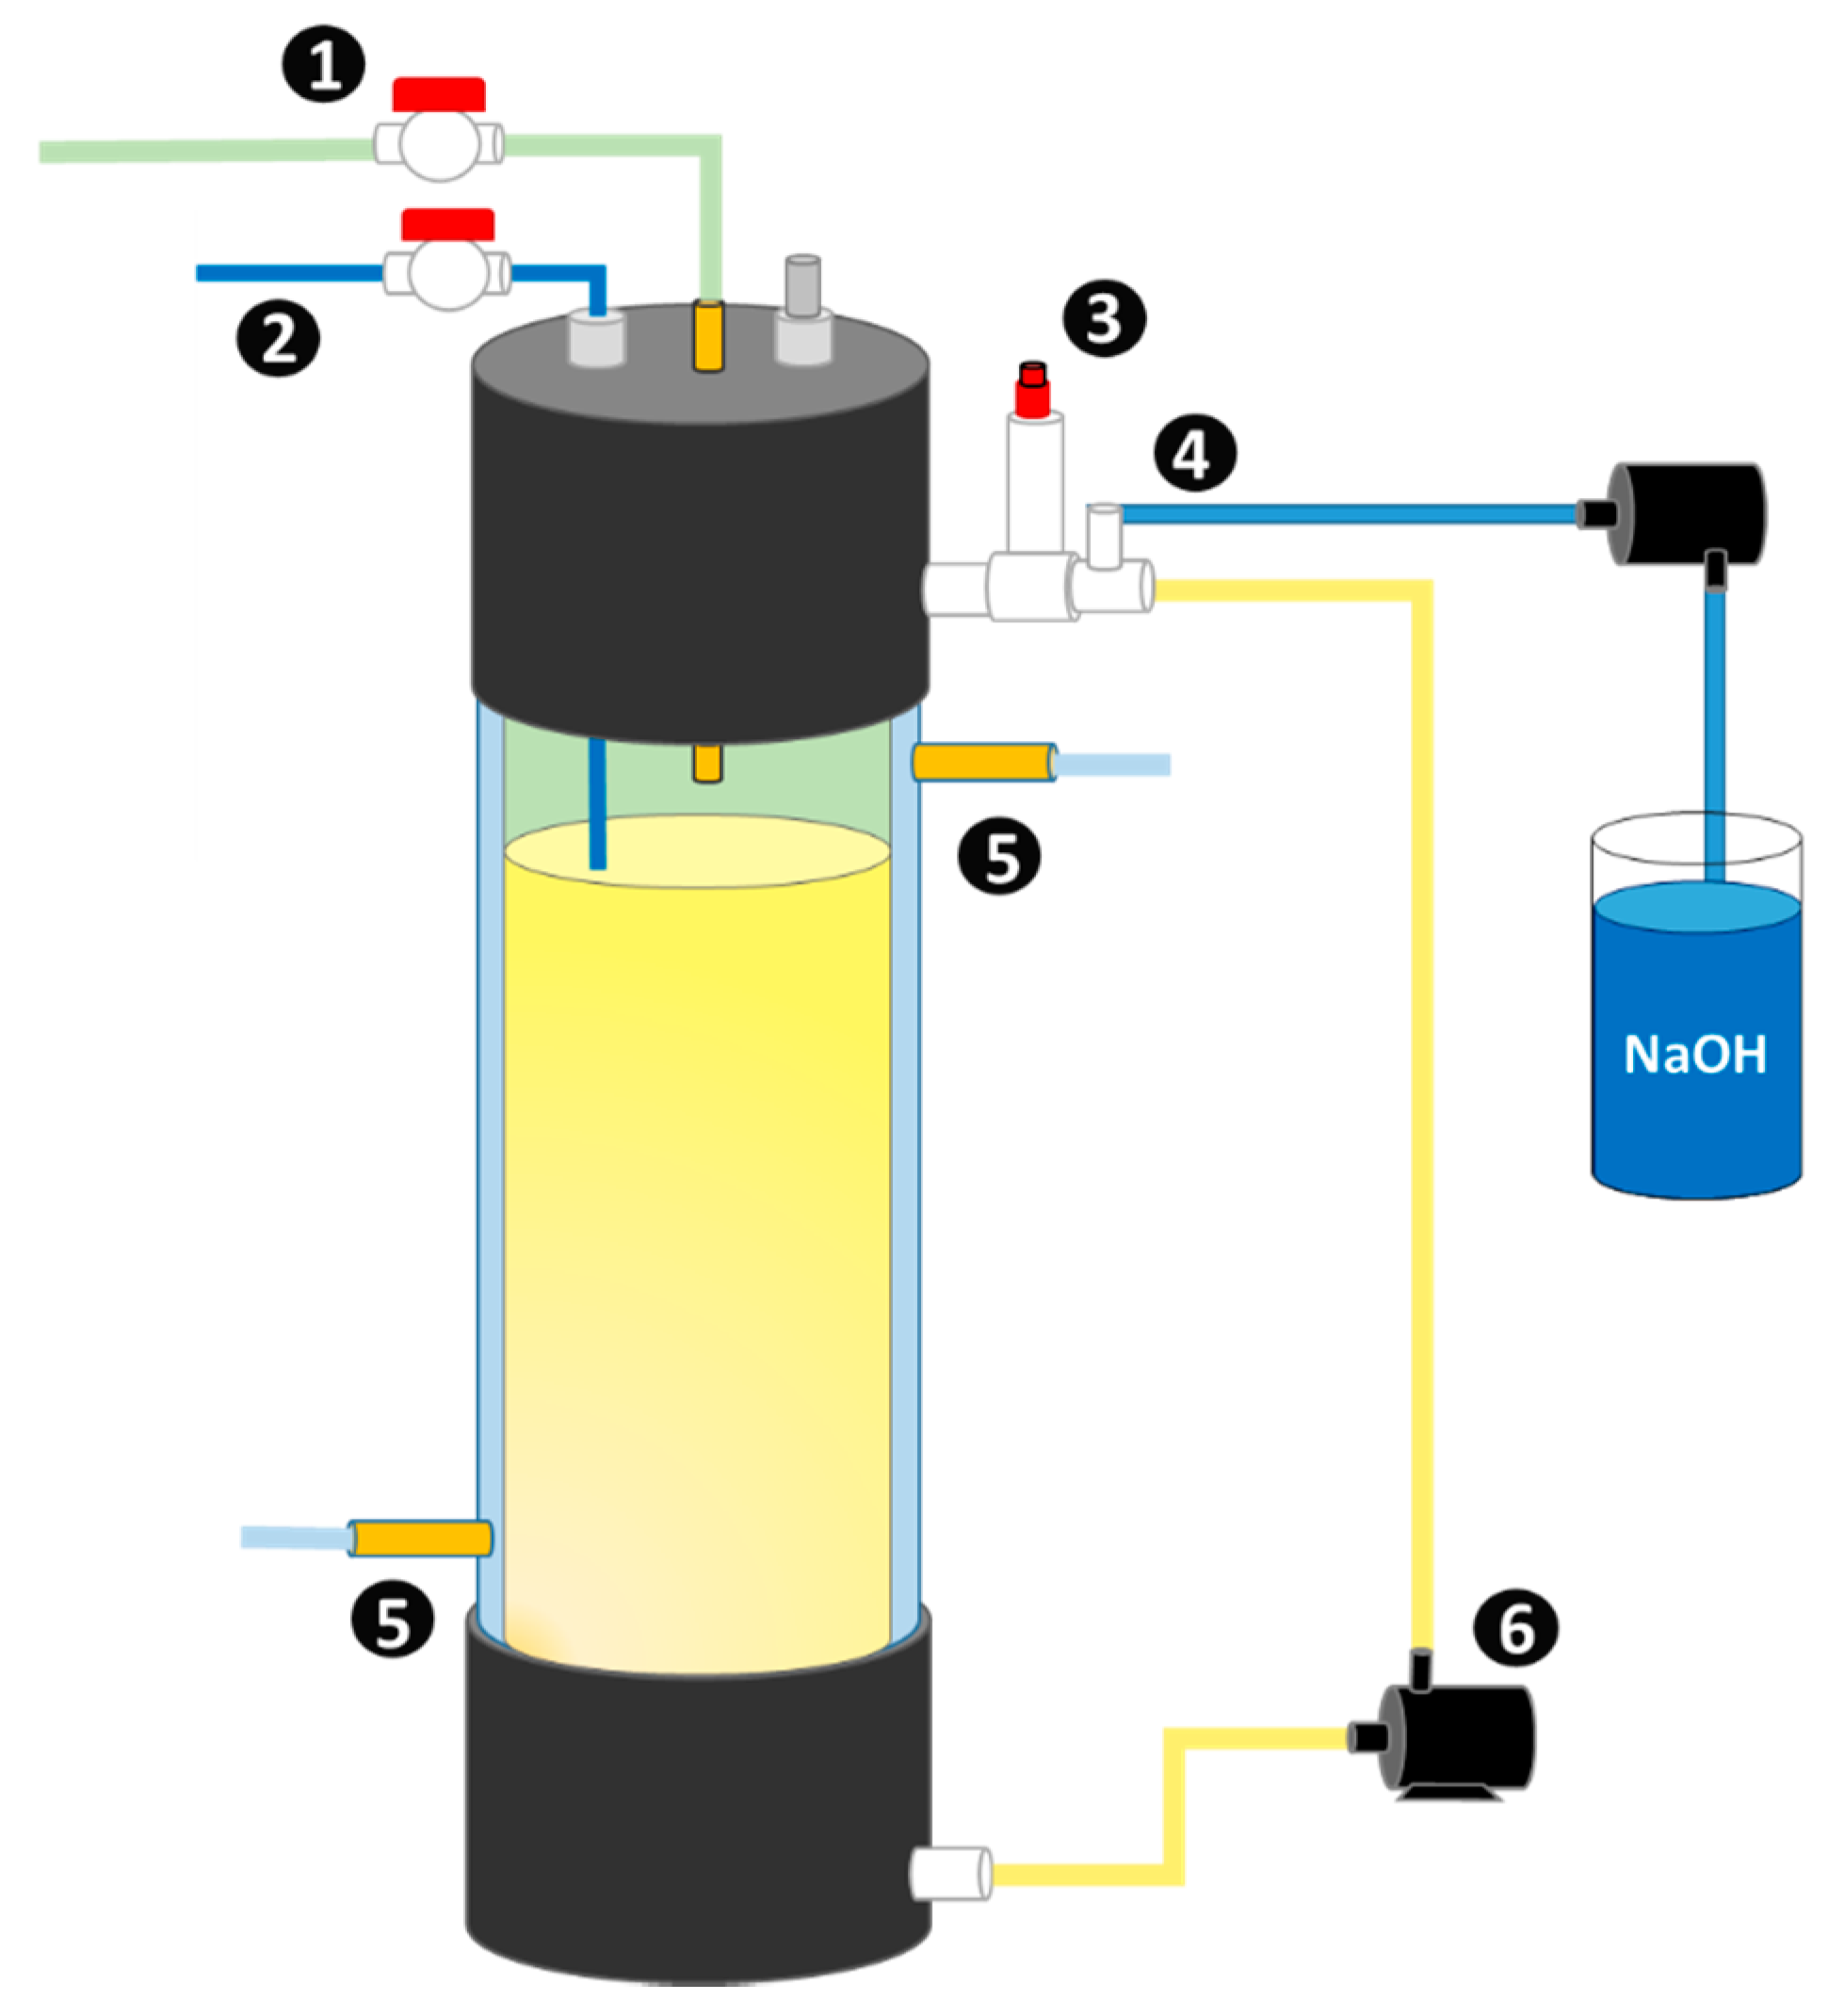
2.1. Experimental Setup

The anaerobic fermentation of raw cheese whey was carried out in an anaerobic sequencing batch reactor (AnSBR) with an effective volume of 5.1 L (Figure 1). For SRT = 120 h, each experiment was operated in batches independently, i.e., after one experiment the digester is completely unloaded, and the next run is subsequently loaded.
The sludge used as an inoculum was conditioned in a laboratory-scale anaerobic digester fed with raw cheese whey (OLD = 3.6 gCOD L−1 d−1) under conditions of 33 °C, pH = 8.0, HRT = 30 d, and has been operated for 365 days. All experimental runs were performed in duplicate, using fresh raw cheese whey as a substrate collected from a community dairy located in Coacoatzintla Veracruz, México. The process operation was carried out under mesophilic conditions, considering two temperatures, 35 and 40 °C, and two pH values, 5.5 and 7.5. pH, and temperature values coincide with the reported conditions, where the operation is stable and VFA production is favored [7,26,27].
The cheese whey and inoculum were characterized by determining the concentration of fat, protein, lactose, total carbohydrates (TCH), volatile fatty acids (VFA), total solids (TS), volatile suspended solids (VSS), as well as the chemical oxygen demand (COD) and alkalinity.
Standard techniques were used to determine COD [28] and VSS [29]. Total carbohydrates and proteins concentration were determined according to Dubois et al. [30] and Bradford et al., [31], respectively. An Agilent gas chromatograph (model 7820 A) equipped with a capillary column and a flame ionization detector was used to determine the concentrations of short-chain organic acids. Conversion factors were used to pass VFA, TCH, VSS and protein concentration to the COD equivalent concentration [32,33]. Biogas production was determined daily by using the volumetric methodology [34], samples were taken every 12 hours and its composition was measured by gas chromatography a Gow Mac 580 series gas chromatograph, with an isothermal column oven and helium and hydrogen as hauling gas.

2.2. Mathematical Modelling

For the mathematical modeling of the anaerobic digestion process of the whey, an unstructured model based on the ADM1 is proposed in a batch configuration [35], considering three phases: hydrolysis, acidogenesis-acetogenesis and methanogenesis. The process consists of consecutive stages, i.e., the product of the previous stage is the substrate for the next one. For the simplification of the model, the main compounds of each of the stages are grouped into a single substrate [36]. In the first stage, the hydrolytic bacteria (Xh) degrade to the initial substrate, S1, which is mainly represented by the long-chain components such as carbohydrates, proteins and lipids [37]. The dynamic profiles can be described by
d S 1 d t = μ h X h Y X h / S 1
d X h d t = μ h X h K d h X h
where YXh/S1 is the hydrolytic biomass yield coefficient (g(Xh)/g(S1)), Kdh is the death constant of the hydrolytic bacteria. The model kinetic to predict hydrolysis phase is described with a first-order kinetic, where the growth rate of hydrolytic biomass is given by
μ h = K h S 1
Kh is the hydrolytic constant (h−1). As the product of the first stage is obtained, the second substrate (S2), represents simple organic compounds such as carbohydrates and amino acids (g L−1) [37,38]. Thus, the acidogenic bacteria (XA) consume S2 to produce fatty acids (A), that can be described as
d S 2 d t = μ h X h Y S 2 / X h μ a X A Y X a / S 2
d X A d t = μ a X A K d a X A
where YS2/Xh and YXa/S2 are yield coefficients of production (g(S2)/g(Xh)) and degradation (g(XA)/g(S2)) of substrate S2, respectively. Acidogenesis is described by Monod type kinetic such as,
μ a = μ a m a x S 2 K S 2 + S 2
µamax is the maximum growth rate (h−1). Finally, in the methanogenesis stage, the methanogenic biomass (Xm) produce biogas (B), such as [36]
d A d t = μ a X a Y A / X a μ m X m Y X m / A
d X m d t = μ m X m K d m X m
d B d t = μ m X m Y B / X m
where YA/Xa, YXm/A and YCH4/Xm are yield coefficients of production (g(A)/g(Xa)) and degradation (g(Xm)/g(A)) of A, and yield coefficient of methane production (g(CH4)/g(Xm)), respectively. Methanogenesis is the most sensitive phase of the process; because of this, a direct VFA inhibition was considered and, for description, Haldane kinetic is used
μ m = μ m m a x A K A + A + A 2 / K I m
µm is the methanogenic growth rate by Haldane model, KIm is an inhibition constant (g(A) L−1) [36].

2.2.1. Temperature and pH Effects

Despite the importance of the temperature and pH effects on the process stability, traditionally these variables are not considered in the modeling, or only the individual effects are considered. Models that include the effect of pH focus on the inhibition in the metabolism of microbial consortia due to changes in pH [35,39], while the effect of temperature has been included in the kinetic model of microbial growth [40,41]. Considering both effects, Moguel-Castañeda et al. [42] presented an AD model for tequila vinasses treatment, which obtained good correspondence between the results in experimental tests and model predictions at different conditions of pH and temperature. However, the functions that describe the effects of pH and temperature are empirical relationships that require the estimation of at least five parameters for each function, which can limit the application of the model when insufficient experimental data are available. So, in order to generate a simplified model, in this work, the effects of inhibition by pH on the growth rate of the acidogenic and methanogenic biomass are incorporated, such that [35]
μ a m a x = μ a o p t ϕ 1 γ ( p H )
μ m m a x = μ m o p t ϕ 2 γ ( p H )
where γ(pH) is given by:
γ ( p H ) = { exp [ 3 ( p H p H max p H max p H min ) 2 ] p H < p H max 1 p H > 1
pHmin and pHmax are the minimum and maximum values that can be achieved in the process. It is important to note that pH mainly influences acidogenic bacteria [18]. The proposed model can establish the intervals of pH where both microbial consortia activities would be favored.
In order to include the effect of pH and temperature in a wide range of operating conditions, it is possible to generate a function of the parameters that exhibit greater variation against changes in those parameters. A simplified model can be described as a first order polynomial of two variables, pH and temperature [42], such as
ξ = a p H + b T + c
where ξ represents a parameter of the model, while a, b and c are constant parameters that must be estimated. The determination of the parameters ξ are carried out by applying the parametric sensitivity analysis to the proposed model, where the most sensitive parameters are identified, that is, the parameters that present the greatest change with changes in pH and temperature.
The estimation of the parameters of the model described by Equations (1)–(14) was performed using nonlinear regression techniques based on the Levenberg–Marquard least squares minimization algorithm [11]. The Levenberg–Marquardt algorithm was implemented in Matlab R2019b software. To verify the goodness of fit to the proposed mathematical model, the traditional coefficient of determination (R2) was calculated.

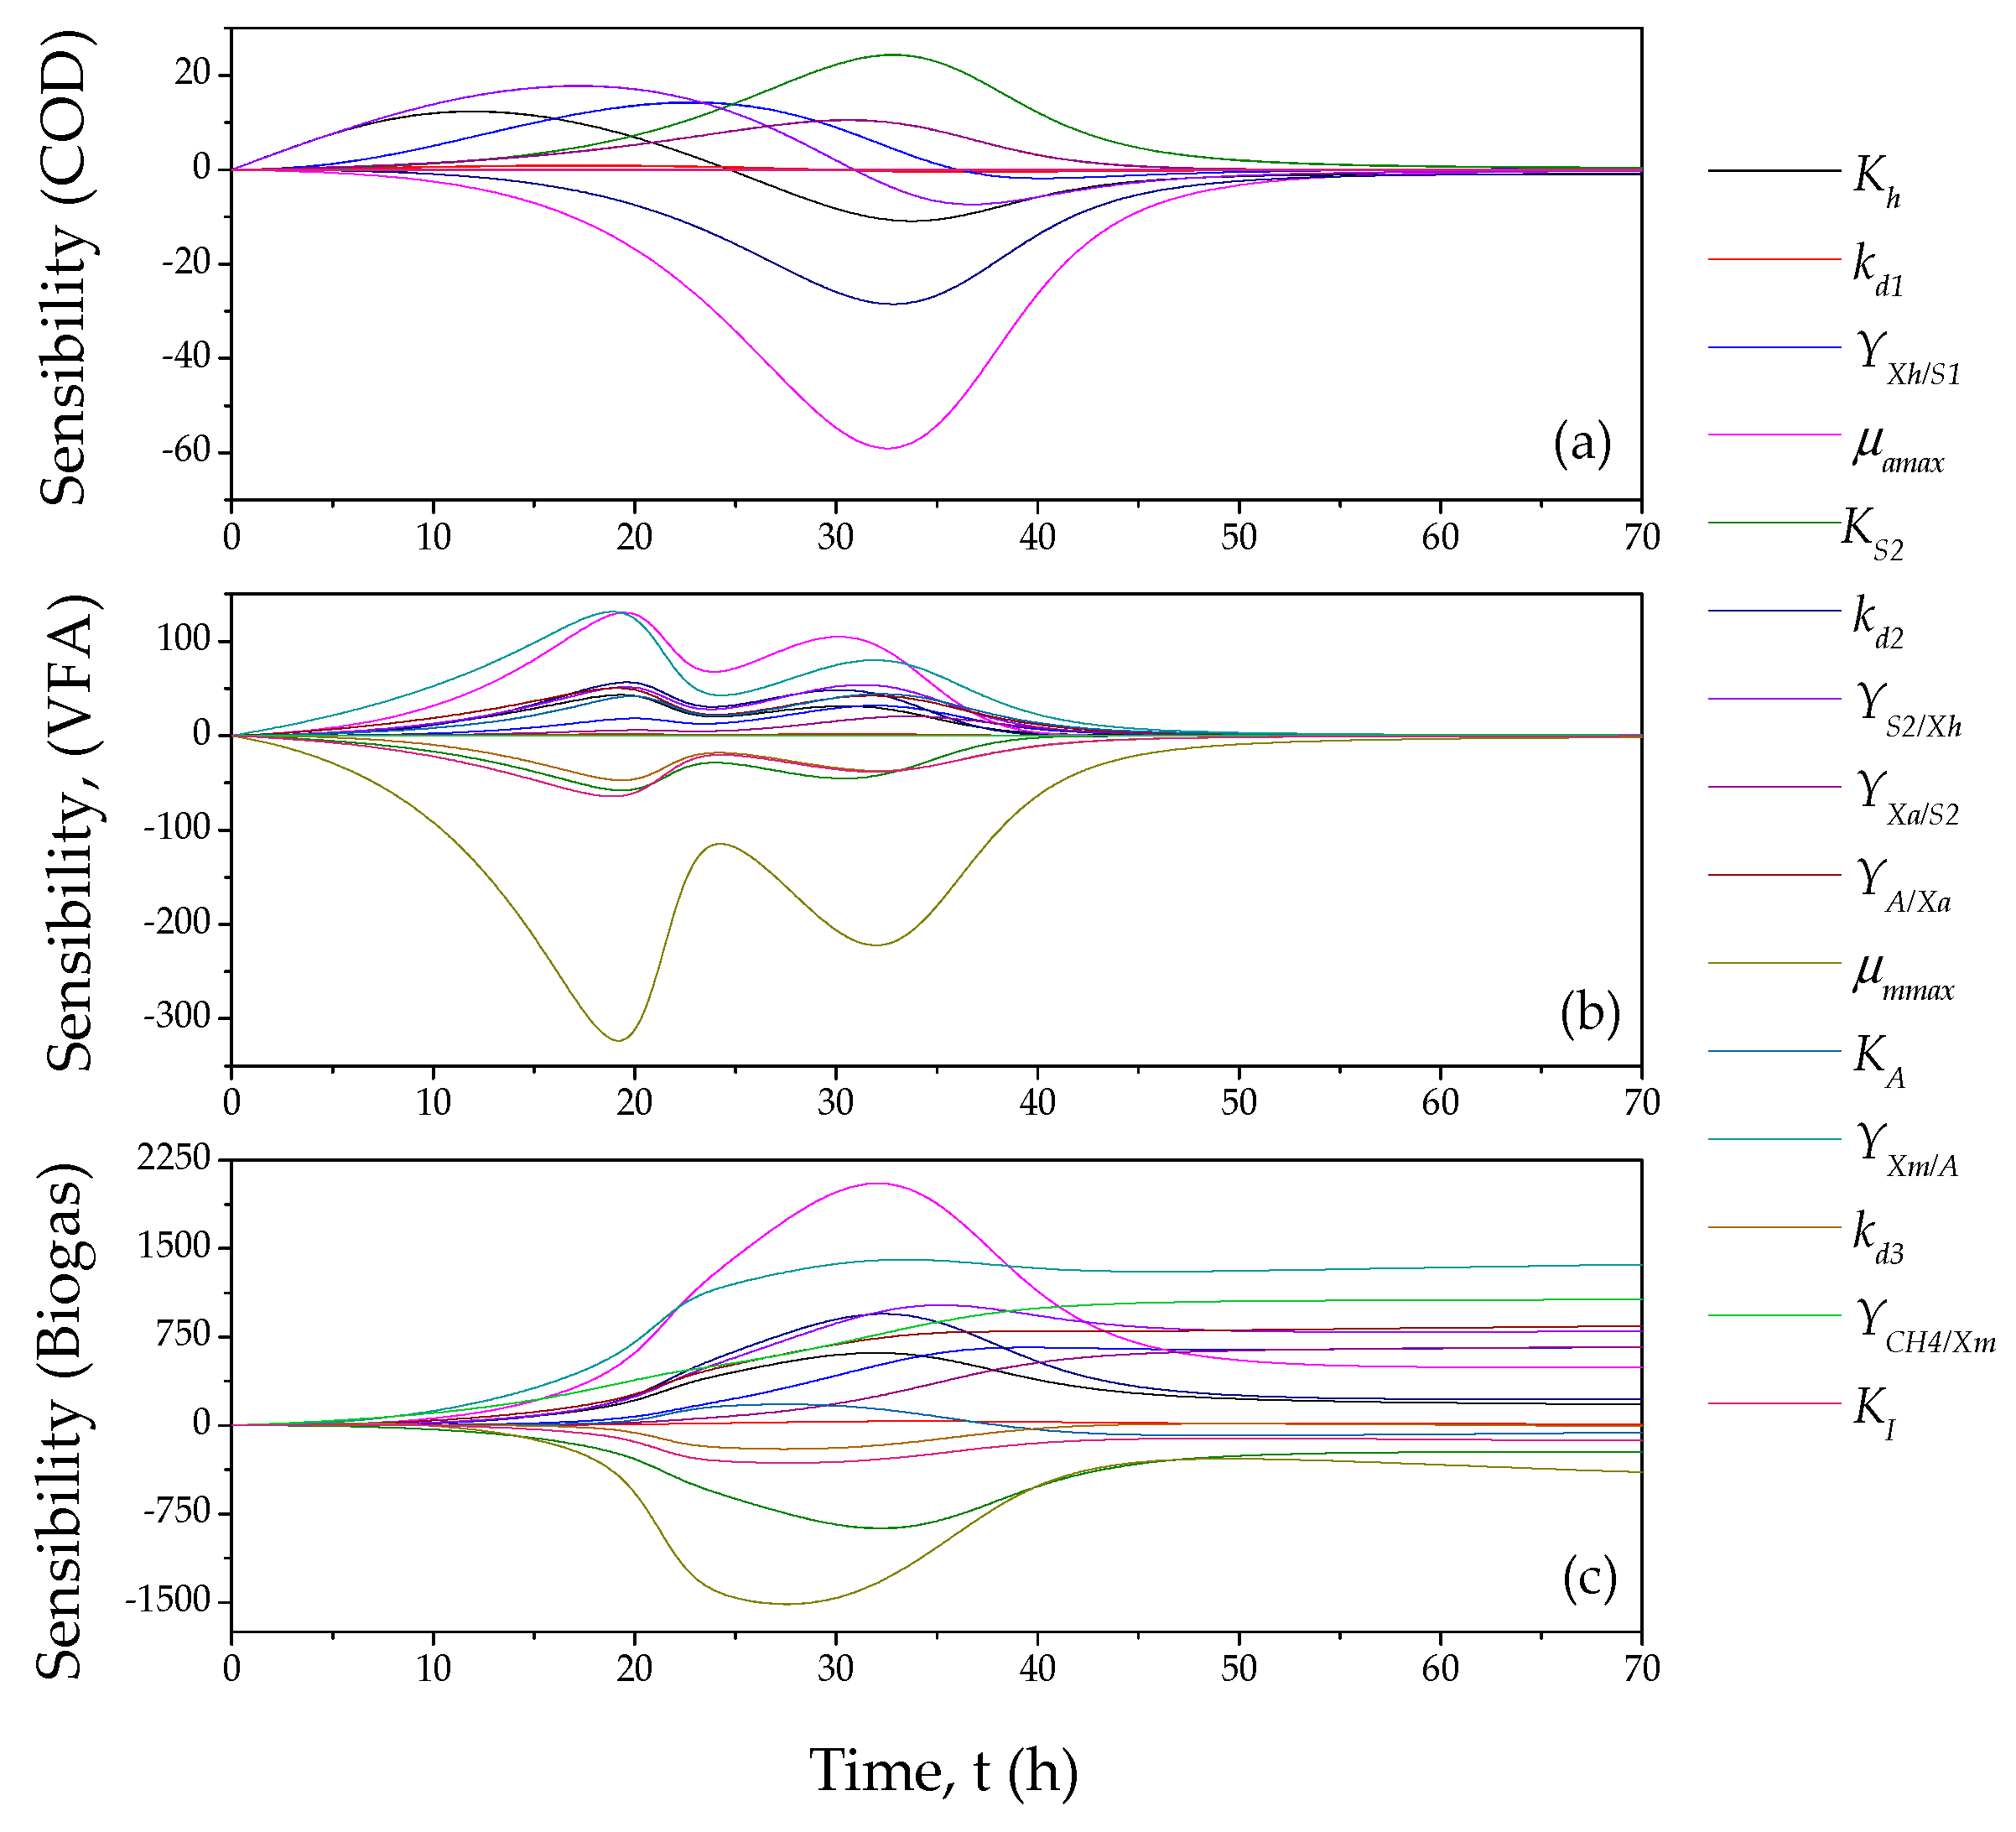
2.2.2. Sensibility Analysis

In order to determine the most sensitive parameters to pH and T change, the variation between such parameters was calculated by local sensitivity functions are computed simultaneously with AD model such that [43]
d Z j d t = [ f x ] ( x , P , t ) Z j + [ f P j ] ( x , P , t )
where Zj is the sensibility function, f are the mass balances described by Equations (1)–(13), x are state variables (i.e., COD, VFA and biogas), and P is the fitted parameter vector.

3. Results and Discussion

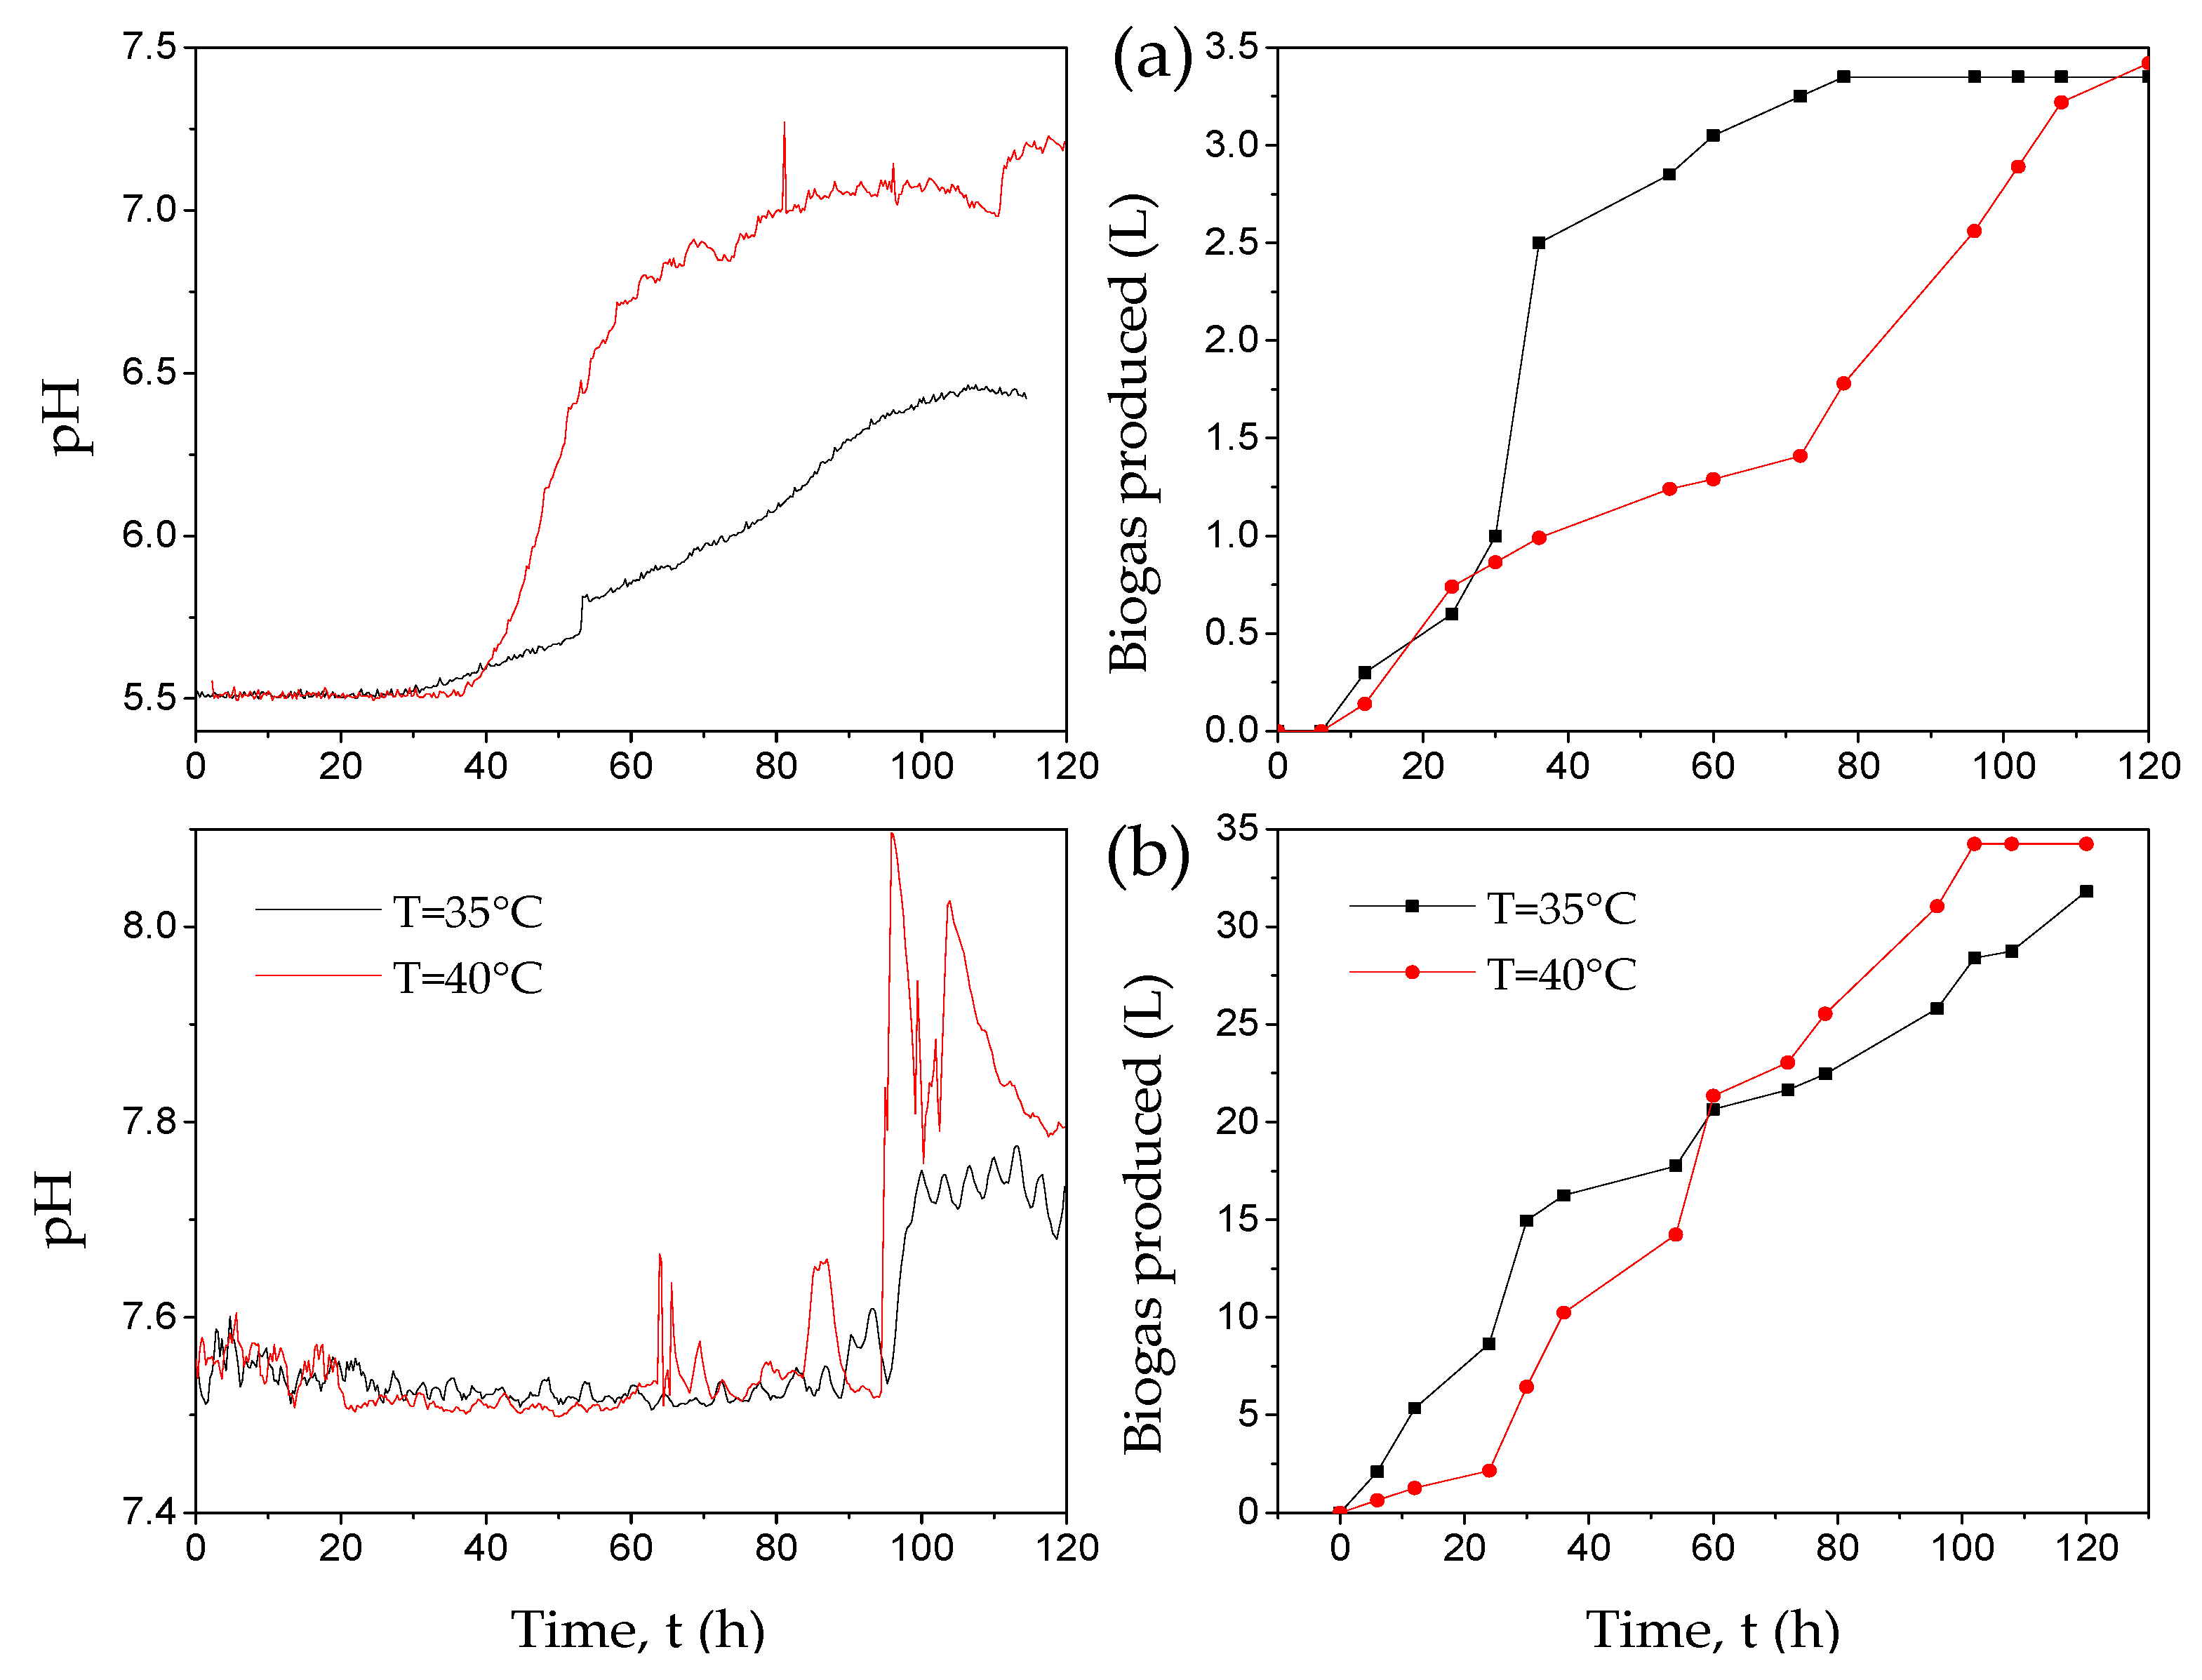
3.1. Experimental Tests

Table 1 shows the physicochemical characteristics of the fresh raw cheese whey and inoculum used in the experimental tests. It is observed that COD is significantly higher than reported by Gelegenis et al. [44] and Calero et al., [7]. The inoculum showed a COD = 32.5 gCOD L−1, where 28.56 g L−1 corresponds to VFA, while the protein concentration was 7.22 g L−1 and carbohydrate concentration was 0.94 g L−1. The amount of COD and VSS indicate that it has a high proportion of microbial biomass.
Four experimental essays in different pH-Temperature pair conditions: 1) pH = 5.5, T = 35 °C; 2) pH = 5.5, T = 40 °C; 3) pH = 7.5, T = 35 °C; and 4) pH = 7.5, T = 40 °C were carried out, in order to evaluate the effect of initial pH and temperature on VFA production. The results obtained in the experimental tests are summarized in Table 2, showing the degradation percentages of carbohydrates, proteins and COD, as well as the VFA production. For the experimental trials evaluated, the carbohydrates showed the highest degradation rate, reaching a reduction between 98.3%–99.1%, where the greatest degradation is reached at pH = 7.5 and T = 35 °C. In all the essays, a low COD removal is observed, obtaining a maximum percentage of COD removal of 45.81% at conditions of pH = 5.5 and T = 35 °C.
For all the experimental tests carried out, the pH control system was only established to avoid acidification of the system, i.e., when the pH is lower than the initial pH, a NaOH solution is added. Figure 2 shows the dynamic profiles of the pH, where it is observed that the pH does not remain constant during the process operation. At initial pH = 5.5, the system tends to alkaline after 40 h of operation, reaching pH values of 6.4 and 7.2 at T = 35 and 40 °C, respectively. While at initial pH = 7.5, the increase in pH was observed after 90 h of operation, reaching pH values of 7.7 and 8.1 at T = 35 and 40 °C, respectively. In addition, it can be noticed that when the pH begins to increase, the production of biogas also increases, which can be due to the generation of alkaline agents such as sodium bicarbonate [45]. This suggests that the pH changes are strongly related to the adaptation of the consortium of microorganisms that promote biogas generation. So, the pH has an important influence on the biogas production in the treatment of raw cheese whey.
Figure 2 shows that temperature does not significantly influence biogas production, however, it does have an important role in the degradation of COD and in the total VFA production. Table 2 shows that, at initial pH = 5.5, the degradation of the COD decreases from 45.8% to 39.2% when the operating temperature changes from 35 to 40 °C, while the total production of VFA increases by 25%, going from 24.3 gCOD L−1 to 30.7 gCOD L−1. For initial pH = 7.5, there is up to a 50% increase in COD degradation and a 25% increase in total VFA production at 40 °C operating temperature.

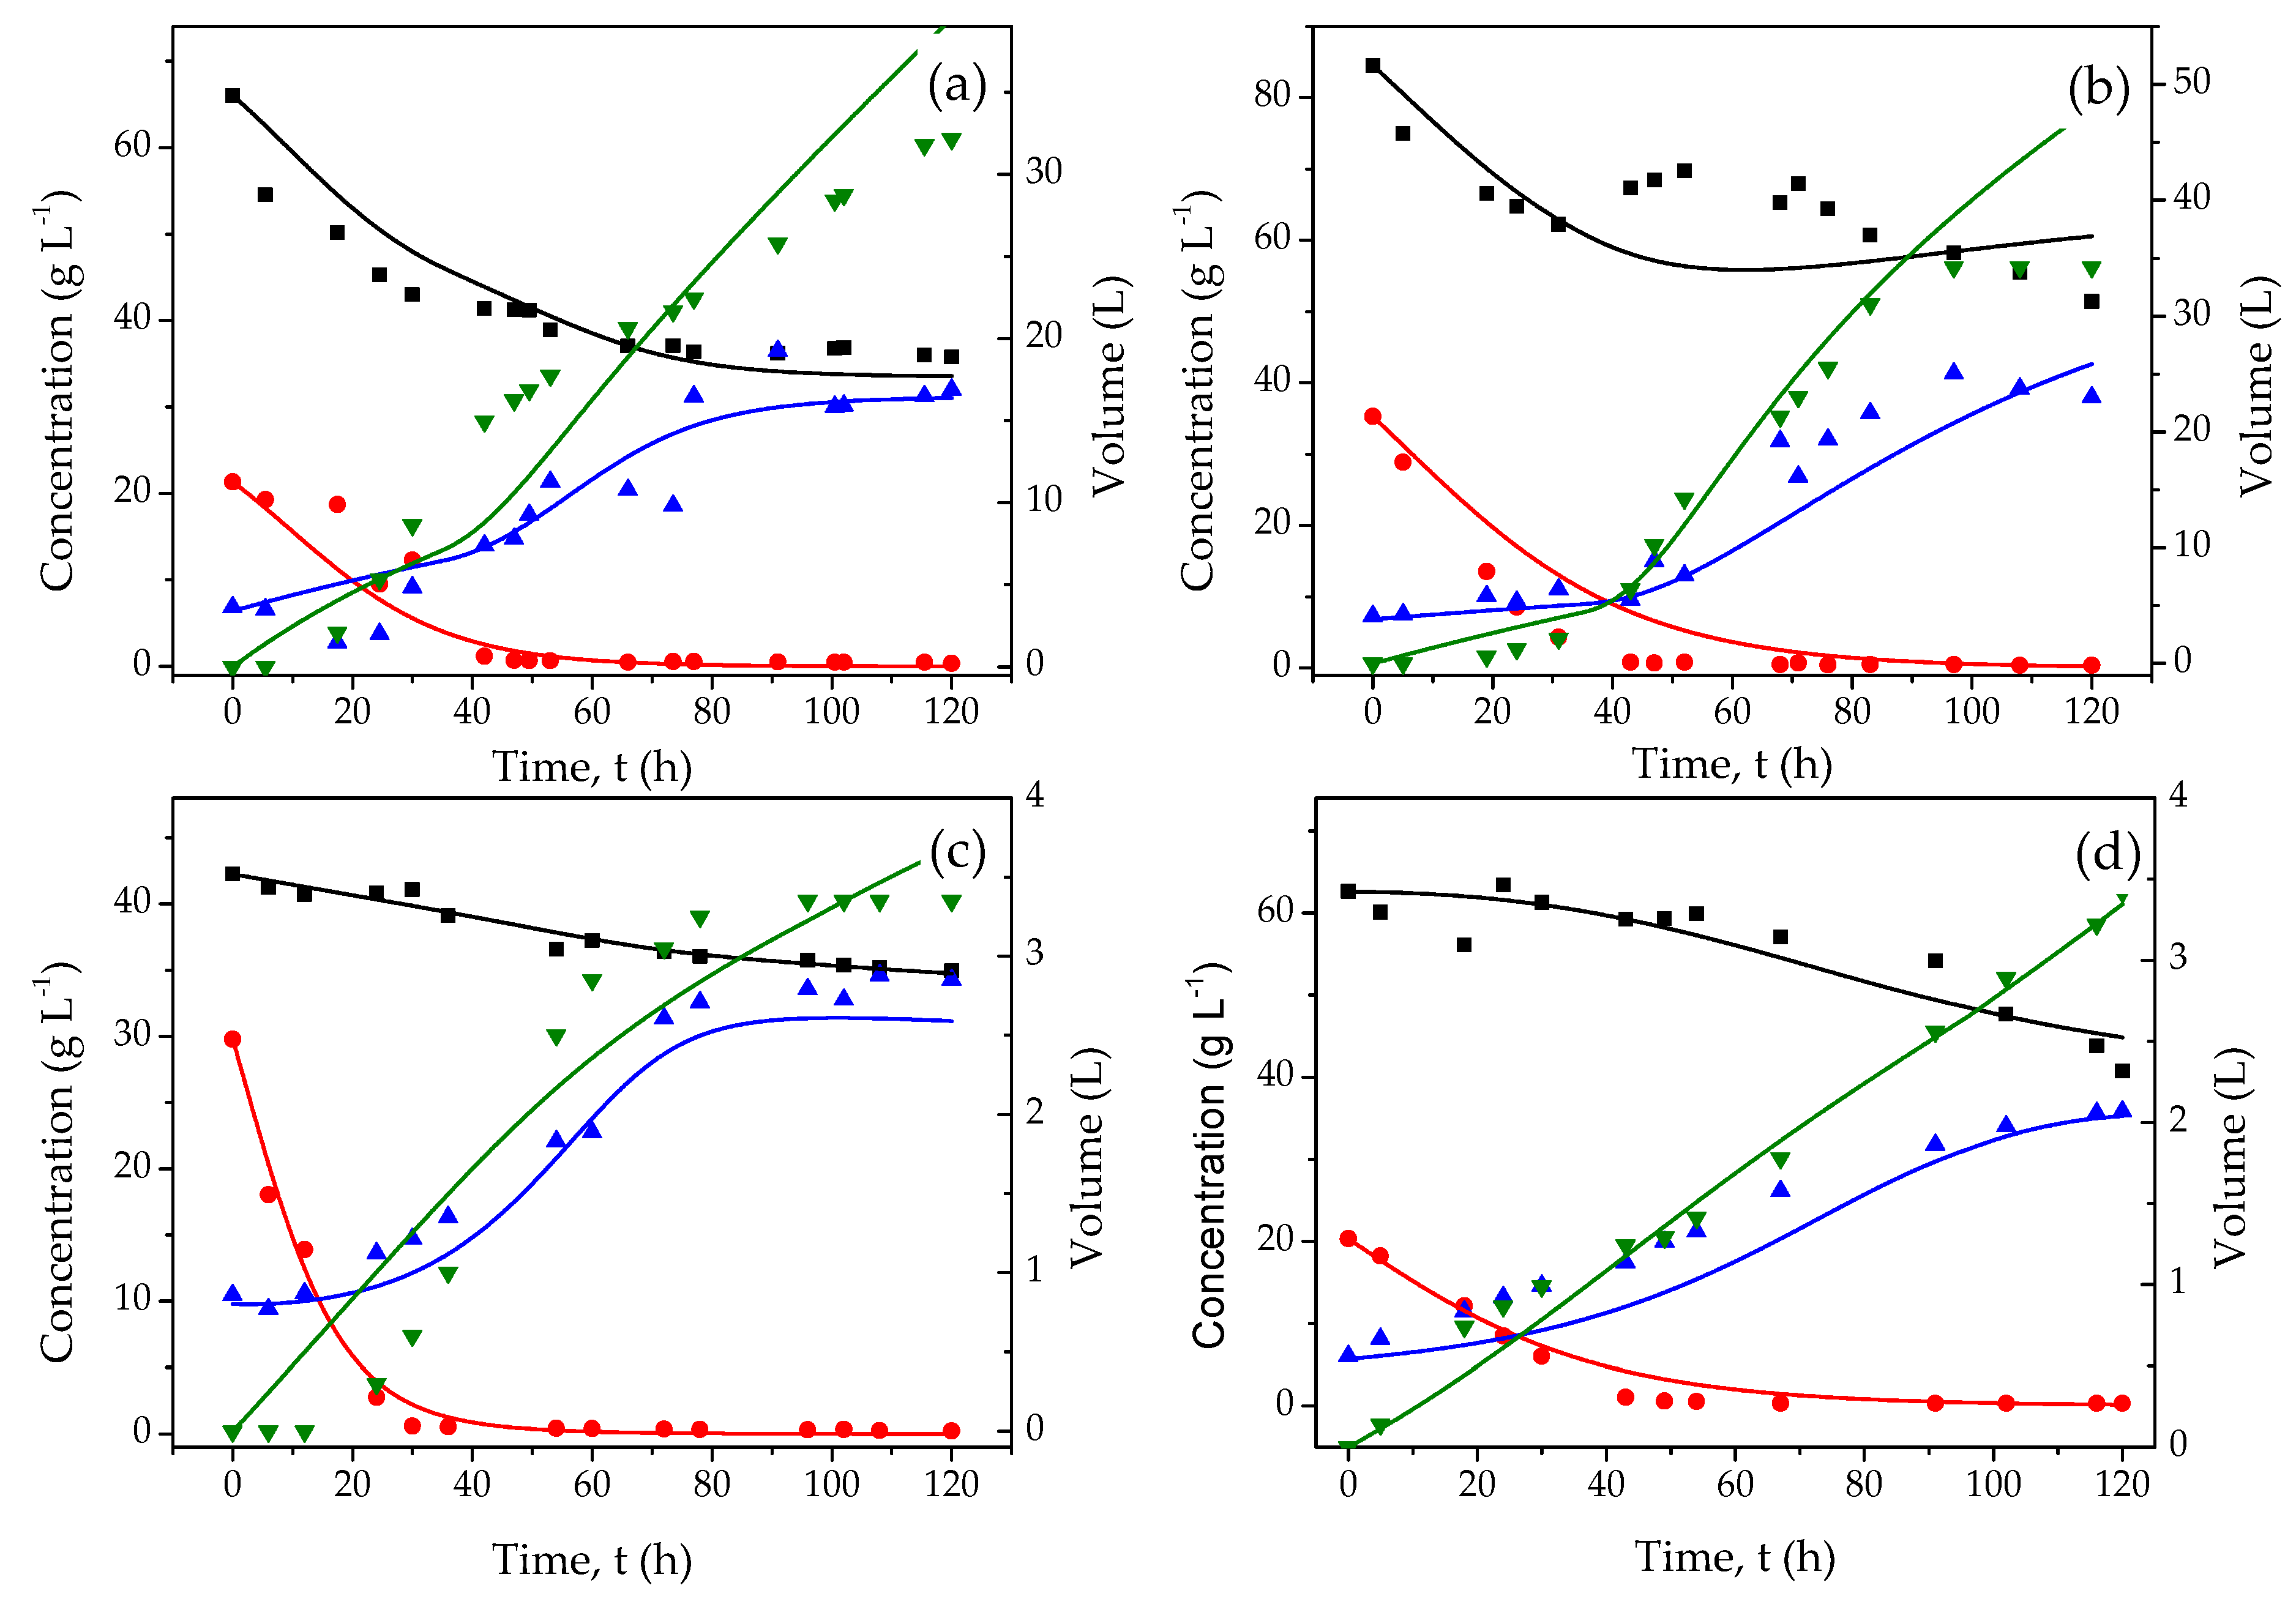
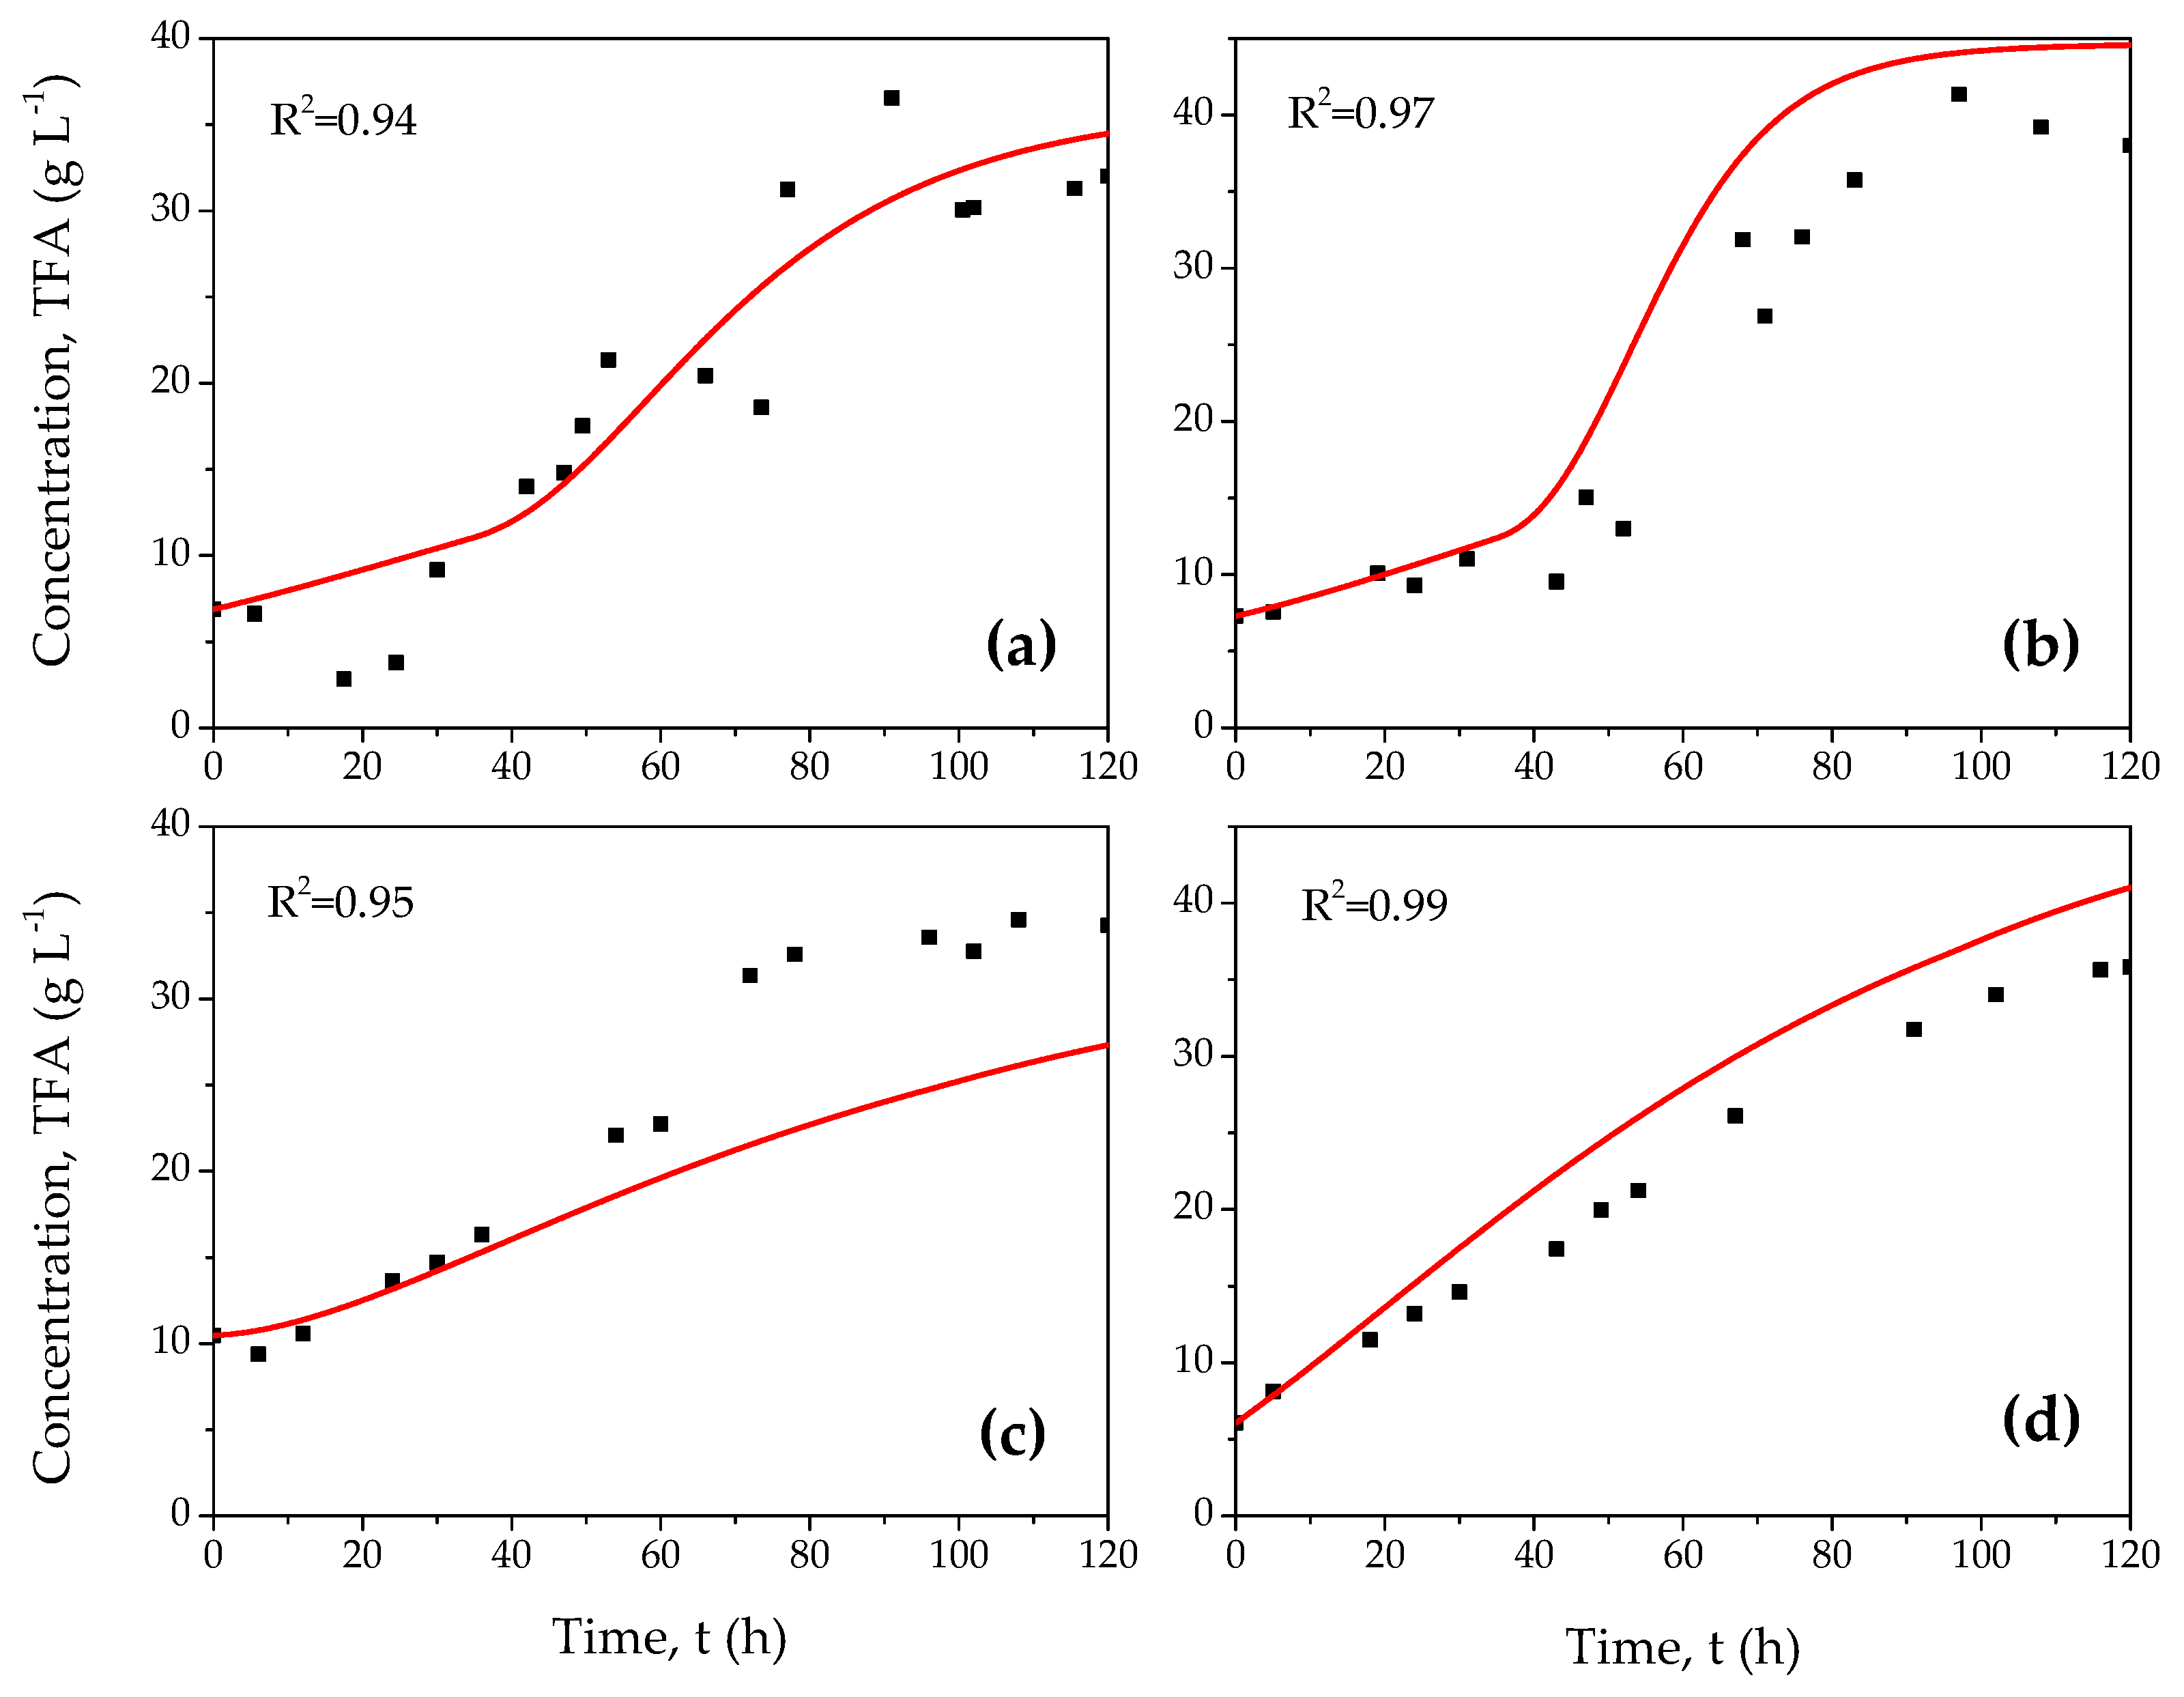
3.2. Mathematical Model

To evaluate the performance of the proposed model described by Equations (1)–(13), model parameters were estimated using the experimental data collected for each experimental condition. Figure 3 shows the dynamic profiles of COD, VFA, and CH4 obtained by the proposed model compared with the experimental data for all the tested pH and temperature combinations.
Notice that high determination coefficients are obtained (R2 > 0.95), which indicates that the proposed model could accurately estimate the key variables’ behavior during the anaerobic treatment of raw cheese whey at different pH and temperature conditions. Table 3 shows the estimated parameter values, which agree with the data reported in the current literature and remain in the same order of magnitude for all the operating conditions evaluated [36,37,42]. However, it is noteworthy that, for each experimental condition evaluated, the estimated parameters exhibit a different value, which is associated with the process performance, where, for each condition, different proportions of by-products are obtained (Table 2). The yield coefficients express the relationship between the by-products generated (VFA and biogas) or the material consumed (COD) by the number of microorganisms in each consortium, so these coefficients are expected to show significant variations [46]. Table 3 shows that the variables YA/Xa, YCH4/Xm, YXa/S2 and KS2 are the ones that show the highest percentage of change. For example, the value of KS2 at conditions of (pH = 5.5, T = 40 °C) and (pH = 7.5, T = 35 °C) is 220.1 and 10.3, respectively, i.e., they decrease in an order of magnitude.
By implementing the sensitivity analysis described in Section 2.2.2, Figure 4 shows the local sensitivity analysis of the model parameters on the key variables (COD, VFA and biogas), where it can be corroborated that the most sensitive parameters are YA/Xa, YCH4/Xm, YXa/S2 and KS2. Thus, to have a more robust model that can predict the effect of pH and temperature in a wide range of operating conditions, it is possible to generate a function of the parameters that exhibit greater variation against changes in pH and temperature. A simplified model can be described as a first order polynomial of two variables, pH and temperature as described in Equation (14). Considering the sensibility results, temperature and pH functions were proposed such as YA/Xa = a1pH + b1T + c1, YCH4/Xm = a2pH + b2T + c2, YXa/S2 = a3pH + b3T + c3 and KS2 = a4pH + b4T + c4. To estimate the parameters ai, bi and ci, i = 1, 2, 3 and 4 the average of the parameters reported in Table 3 is performed, and the model is readjusted using the Levenberg–Marquardt algorithm. The calculated values are ai = [908.4, −48.859, −163.95, −1.673 × 10⁵], bi = [0, 0.47, 0, 0] and ci = [−4434.14, 453.92, 2518.92, 1.26 × 10⁶].
Once the parameters of the complete model have been estimated (i.e., proposed functions of pH and temperature), it is verified that the model can estimate the dynamic behavior of the key variables to the pH and temperature conditions experimentally evaluated. Figure 5 shows the dynamic of VFA production obtained with the proposed model compared to the experimental data, where it is identified that the mathematical model satisfactorily describes the dynamic behavior of the VFA production for the four tested conditions, obtaining coefficients of determination greater than 0.94. The best adjustments are reached when T = 40 °C, which corresponds to where the highest final amount of VFA is obtained. Therefore, the proposed model correctly represents the effect of pH and temperature on the anaerobic treatment of whey.
Finally, to identify the region where VFA production and COD degradation are favored, the model with a dependence on pH and temperature was evaluated in the range of 5 < pH < 8 and 30 °C < T < 45 °C. Considering a simulation time of 120 h, Figure 6 shows the VFA production and COD diminution profiles, finding that the numerical simulation results correspond to those obtained experimentally. According to the prediction of the model, it can be observed that the conditions that favor the VFA production using raw crude whey are at a neutral or alkaline pH and temperature above 40 °C. Under controlled pH conditions, it has been reported that the conditions that favor the VFA generation using whey as substrate should be a slightly acidic pH (pH = 5.5–6) at mesophilic conditions (T = 35–37 °C) [7,26,27]. However, if pH is not controlled, the system naturally self-regulates under alkaline conditions and VFA production is favored at pH ≥ 7. While the highest COD removal results in acidic conditions.

4. Conclusions

In this paper, an unstructured mathematical model that considers the effects of pH and temperature during the anaerobic treatment of raw cheese whey for VFA production is proposed. To assess the validity of the proposed model, an experimental set was performed at different initial pH and temperature conditions. For the experimental tests, a pH control system was not implemented, so the pH showed dynamic changes during the process. In order to include the effects of pH and temperature, a parametric sensitivity analysis was performed to identify the kinetic parameters with the greatest influence of such variables. Proposing parameters YA/Xa, YCH4/Xm, YXa/S2 and KS2 as functions of pH and temperature, the mathematical model can satisfactorily predict the dynamics of the relevant variables (COD, VFA and biogas) in the anaerobic fermentation of raw cheese whey for different pH and temperature conditions. Then, the proposed unstructured model could be used to evaluate the process performance in a greater range of pH and temperature values. Numerical simulations using the proposed model suggest that, for raw cheese whey with COD = 74.24 g L−1 in conditions where pH is not controlled and SRT = 120 h, the VFA production is favored at pH ≥ 7 and T > 40 °C, while greater COD removal is obtained in acidic conditions.

Author Contributions

Conceptualization, E.A.-S. and E.H.-M.; experimental methodology, A.L.-M., G.T.-A. and C.B.-A.; writing—review and editing, C.B.-A., E.H.-M. and J.-R.B.-O.; visualization, J.-R.B.-O.; funding acquisition, E.H.-M. All authors have read and agreed to the published version of the manuscript.

Funding

This research was funded by National Council for Science and Technology, grant number 247690 and The APC was funded by University of Southern Denmark.

Acknowledgments

This work was supported by “Dynamic characterization of whey anaerobic treatment for biogas production using fractal analysis of time-series” at CONACyT grant 247690. Thanks to Adalberto Cortes and Isaac Linares for their support with the implementation of the experimental system.

Conflicts of Interest

The authors declare no conflict of interest.

References

  1. FAO. Food and Agriculture Organization of the United Nations Statistics Division. Available online: http://www.fao.org/faostat/en/#data/QP/visualize (accessed on 2 December 2019).
  2. Prazeres, A.R.; Carvalho, F.; Rivas, J. Cheese whey management: A review. J. Environ. Manag. 2012, 110, 48–68. [Google Scholar] [CrossRef]
  3. Escalante, H.; Castro, L.; Amaya, M.P.; Jaimes, L.; Jaimes-Estévez, J. Anaerobic digestion of cheese whey: Energetic and nutritional potential for the dairy sector in developing countries. Waste Manag. 2018, 71, 711–718. [Google Scholar] [CrossRef] [PubMed]
  4. Bastidas-Oyanedel, J.R.; Bonk, F.; Thomsen, M.H.; Schmidt, J.E. Dark fermentation biorefinery in the present and future (bio)chemical industry. Rev. Environ. Sci. Biotechnol. 2015, 14, 473–498. [Google Scholar] [CrossRef]
  5. Imeni, S.M.; Pelaz, L.; Corchado-Lopo, C.; Busquets, A.M.; Ponsá, S.; Colón, J. Techno-economic assessment of anaerobic co-digestion of livestock manure and cheese whey (Cow, Goat & Sheep) at small to medium dairy farms. Bioresour. Technol. 2019, 291, 121872. [Google Scholar]
  6. Appels, L.; Baeyens, J.; Degrève, J.; Dewil, R. Principles and potential of the anaerobic digestion of waste-activated sludge. Prog. Energy Combust. Sci. 2008, 34, 755–781. [Google Scholar] [CrossRef]
  7. Calero, R.R.; Lagoa-Costa, B.; Fernandez-Feal, M.M.D.C.; Kennes, C.; Veiga, M.C. Volatile fatty acids production from cheese whey: Influence of pH, solid retention time and organic loading rate. J. Chem. Technol. Biotechnol. 2018, 93, 1742–1747. [Google Scholar] [CrossRef]
  8. Jankowska, E.; Chwialkowska, J.; Stodolny, M.; Oleskowicz-Popiel, P. Volatile fatty acids production during mixed culture fermentation–The impact of substrate complexity and pH. Chem. Eng. J. 2017, 326, 901–910. [Google Scholar] [CrossRef]
  9. Yang, K.; Yu, Y.; Hwang, S. Selective optimization in thermophilic acidogenesis of cheese-whey wastewater to acetic and butyric acids: Partial acidification and methanation. Water Res. 2003, 37, 2467–2477. [Google Scholar] [CrossRef]
  10. De Gioannis, G.; Friargiu, M.; Massi, E.; Muntoni, A.; Polettini, A.; Pomi, R.; Spiga, D. Biohydrogen production from dark fermentation of cheese whey: Influence of pH. Int. J. Hydrogen Energy 2014, 39, 20930–20941. [Google Scholar] [CrossRef]
  11. Donoso-Bravo, A.; Mailier, J.; Martin, C.; Rodríguez, J.; Aceves-Lara, C.A.; Wouwer, A.V. Model selection, identification and validation in anaerobic digestion: A review. Water Res. 2011, 45, 5347–5364. [Google Scholar] [CrossRef]
  12. Donoso-Bravo, A.; Retamal, C.; Carballa, M.; Ruiz-Filippi, G.; Chamy, R. Influence of temperature on the hydrolysis, acidogenesis and methanogenesis in mesophilic anaerobic digestion: Parameter identification and modeling application. Water Sci. Technol. 2009, 60, 9–17. [Google Scholar] [CrossRef] [PubMed]
  13. Lauwers, J.; Appels, L.; Thompson, I.P.; Degrève, J.; Van Impe, J.F.; Dewil, R. Mathematical modelling of anaerobic digestion of biomass and waste: Power and limitations. Prog. Energy Combust. Sci. 2013, 39, 383–402. [Google Scholar] [CrossRef] [Green Version]
  14. Brulé, M.; Oechsner, H.; Jungbluth, T. Exponential model describing methane production kinetics in batch anaerobic digestion: A tool for evaluation of biochemical methane potential assays. Bioprocess Biosyst. Eng. 2014, 37, 1759–1770. [Google Scholar] [CrossRef] [PubMed]
  15. García-Ochoa, F.; Santos, V.E.; Naval, L.; Guardiola, E.; Lopez, B. Kinetic model for anaerobic digestion of livestock manure. Enzyme Microb. Technol. 1999, 25, 55–60. [Google Scholar] [CrossRef]
  16. Arudchelvam, Y.; Perinpanayagam, M.; Nirmalakhandan, N. Predicting VFA formation by dark fermentation of particulate substrates. Bioresour. Technol. 2010, 101, 7492–7499. [Google Scholar] [CrossRef]
  17. Wang, D.; Liu, Y.; Ngo, H.H.; Zhang, C.; Yang, Q.; Peng, L.; Ni, B.J. Approach of describing dynamic production of volatile fatty acids from sludge alkaline fermentation. Bioresour. Technol. 2017, 238, 343–351. [Google Scholar] [CrossRef]
  18. Blanco, V.M.C.; Oliveira, G.H.D.; Zaiat, M. Dark fermentative biohydrogen production from synthetic cheese whey in an anaerobic structured-bed reactor: Performance evaluation and kinetic modeling. Renew. Energy 2019, 139, 1310–1319. [Google Scholar] [CrossRef]
  19. Hublin, A.; Zelić, B. Modelling of the whey and cow manure co-digestion process. Waste Manag. Res. 2013, 31, 353–360. [Google Scholar] [CrossRef]
  20. Lovato, G.; Ratusznei, S.M.; Rodrigues, J.A.D.; Zaiat, M. Co-digestion of whey with glycerin in an AnSBBR for biomethane production. Appl. Biochem. Biotechnol. 2016, 178, 126–143. [Google Scholar] [CrossRef]
  21. Lovato, G.; Lazaro, C.Z.; Zaiat, M.; Ratusznei, S.M.; Rodrigues, J.A.D. Biohydrogen production by co-digesting whey and glycerin in an AnSBBR: Performance optimization, metabolic pathway kinetic modeling and phylogenetic characterization. Biochem. Eng. J. 2017, 128, 93–105. [Google Scholar] [CrossRef]
  22. Mainardis, M.; Flaibani, S.; Trigatti, M.; Goi, D. Techno-economic feasibility of anaerobic digestion of cheese whey in small Italian dairies and effect of ultrasound pre-treatment on methane yield. J. Environ. Manag. 2019, 246, 557–563. [Google Scholar] [CrossRef] [PubMed]
  23. Charalambous, P.; Shin, J.; Shin, S.G.; Vyrides, I. Anaerobic digestion of industrial dairy wastewater and cheese whey: Performance of internal circulation bioreactor and laboratory batch test at pH 5–6. Renew. Energy 2020, 147, 1–10. [Google Scholar] [CrossRef]
  24. Flores-Mendoza, A.P.; Hernández-García, H.; Cocotle-Ronzón, Y.; Hernandez-Martinez, E. Methanogenesis of raw cheese whey: pH and substrate-inoculum ratio evaluation at mesophyll temperature range. J. Chem. Technol. Biotechnol. 2020. [Google Scholar] [CrossRef]
  25. Carvalho, F.; Prazeres, A.R.; Rivas, J. Cheese whey wastewater: Characterization and treatment. Sci. Total Environ. 2013, 445, 385–396. [Google Scholar] [CrossRef] [PubMed]
  26. Lee, C.; Kim, J.; Shin, S.G.; O’Flaherty, V.; Hwang, S. Quantitative and qualitative transitions of methanogen community structure during the batch anaerobic digestion of cheese-processing wastewater. Appl. Microbiol. Biotechnol. 2010, 87, 1963–1973. [Google Scholar] [CrossRef]
  27. Bengtsson, S.; Hallquist, J.; Werker, A.; Welander, T. Acidogenic fermentation of industrial wastewaters: Effects of chemostat retention time and pH on volatile fatty acids production. Biochem. Eng. J. 2008, 40, 492–499. [Google Scholar] [CrossRef]
  28. HACH. Chemical Oxygen Demand, Reactor Digestion Method; Method 8000; HACH: Loveland, CO, USA, 2000. [Google Scholar]
  29. American Public Health Association; American Water Works Association; Water Pollution Control Federation. Standard Methods for the Examination of Water and Wastewater; American Public Health Association: Washington, DC, USA, 2012. [Google Scholar]
  30. Dubois, M.; Gilles, K.A.; Hamilton, J.K.; Rebers, P.A.; Smith, F. Colorimetric method for determination of sugars and related substances. Anal. Chem. 1956, 28, 350–356. [Google Scholar] [CrossRef]
  31. Bradford, M.M. A rapid and sensitive method for the quantitation of microgram quantities of protein utilizing the principle of protein-dye binding. Anal. Biochem. 1976, 72, 248–254. [Google Scholar] [CrossRef]
  32. Parawira, W.; Murto, M.; Read, J.S.; Mattiasson, B. Volatile fatty acid production during anaerobic mesophilic digestion of solid potato waste. J. Chem. Technol. Biotechnol. Int. Res. Process Environ. Clean Technol. 2004, 79, 673–677. [Google Scholar] [CrossRef]
  33. Miron, Y.; Zeeman, G.; van Lier, J.; Lettinga, G. The role of sludge residence time in the hydrolysis of lipids, carbohydrates and proteins during the anaerobic treatment of domestic sewage. Water Res. 2000, 34, 1705–1713. [Google Scholar] [CrossRef]
  34. Drosg, B.; Braun, R.; Bochmann, G.; Al Saedi, T. Analysis and characterisation of biogas feedstocks. In The Biogas Handbook; Wellinger, A., Murphy, J., David, B., Eds.; Woodhead Publishing: Sawston, UK, 2013; pp. 52–84. [Google Scholar]
  35. Batstone, D.J.; Keller, J.; Angelidaki, I.; Kalyuzhnyi, S.V.; Pavlostathis, S.G.; Rozzi, A.; Vavilin, V.A. The IWA anaerobic digestion model no 1 (ADM1). Water Sci. Technol. 2002, 45, 65–73. [Google Scholar] [CrossRef] [PubMed]
  36. Bernard, O.; Hadj-Sadok, Z.; Dochain, D.; Genovesi, A.; Steyer, J.P. Dynamical model development and parameter identification for an anaerobic wastewater treatment process. Biotechnol. Bioeng. 2001, 75, 424–438. [Google Scholar] [CrossRef] [PubMed]
  37. Hassam, S.; Ficara, E.; Leva, A.; Harmand, J. A generic and systematic procedure to derive a simplified model from the anaerobic digestion model No. 1 (ADM1). Biochem. Eng. J. 2015, 99, 193–203. [Google Scholar] [CrossRef]
  38. Ficara, E.; Hassam, S.; Allegrini, A.; Leva, A.; Malpei, F.; Ferretti, G. Anaerobic digestion models: A comparative study. IFAC Proc. Vol. 2012, 45, 1052–1057. [Google Scholar] [CrossRef]
  39. Kiely, G.; Tayfur, G.; Dolan, C.; Tanji, K. Physical and mathematical modelling of anaerobic digestion of organic wastes. Water Res. 1997, 31, 534–540. [Google Scholar] [CrossRef]
  40. Zwietering, M.H.; Wijtzes, T.; De Wit, J.C.; Riet, K.V.T. A decision support system for prediction of the microbial spoilage in foods. J. Food Prot. 1992, 55, 973–979. [Google Scholar] [CrossRef]
  41. Luo, K.; Yang, Q.; Li, X.M.; Yang, G.J.; Liu, Y.; Wang, D.B.; Zeng, G.M. Hydrolysis kinetics in anaerobic digestion of waste activated sludge enhanced by α-amylase. Biochem. Eng. J. 2012, 62, 17–21. [Google Scholar] [CrossRef]
  42. Moguel-Castañeda, J.G.; Puebla, H.; Méndez-Acosta, H.O.; Hernandez-Martinez, E. Modeling pH and temperature effects on the anaerobic treatment of tequila vinasses. J. Chem. Technol. Biotechnol. 2020. [Google Scholar] [CrossRef]
  43. McLean, K.A.; McAuley, K.B. Mathematical modelling of chemical processes—Obtaining the best model predictions and parameter estimates using identifiability and estimability procedures. Can. J. Chem. Eng. 2012, 90, 351–366. [Google Scholar] [CrossRef]
  44. Gelegenis, J.; Georgakakis, D.; Angelidaki, I.; Mavris, V. Optimization of biogas production by co-digesting whey with diluted poultry manure. Renew. Energy 2007, 32, 2147–2160. [Google Scholar] [CrossRef]
  45. Kasali, G.B.; Senior, E.; Watson-Craik, I.A. Sodium bicarbonate effects on the anaerobic digestion of refuse. J. Chem. Technol. Biotechnol. 1989, 45, 279–289. [Google Scholar] [CrossRef]
  46. Shen, J.; Zhu, J. Kinetics of batch anaerobic co-digestion of poultry litter and wheat straw including a novel strategy of estimation of endogenous decay and yield coefficients using numerical integration. Bioprocess Biosyst. Eng. 2016, 39, 1553–1565. [Google Scholar] [CrossRef] [PubMed]
Figure 1. Experimental set-up of the AnSBR digester: (1) biogas output; (2) feeding/drain pipe; (3) pH/ORP sensor; (4) feeding NaOH solution; (5) cooling/heating system and (6) recycling pump.
Energies 13 01850 g001
Figure 2. Dynamic profiles of pH and biogas production, (a) pH = 5.5 and (b) pH = 7.5.
Energies 13 01850 g002
Figure 3. Dynamical behavior of key parameters at different operation conditions (■ CODexp, S1,exp, VFAexp, Biogas, ⸻ CODfit, S1fit, VFAfit, Biogasfit) (a) pH = 5.5, T = 35 °C; (b) pH = 5.5, T = 40 °C; (c) pH = 7.5, T = 35 °C ; and (d) pH = 7.5, T = 40 °C.
Energies 13 01850 g003
Figure 4. Local sensitivity analysis for: (a) COD, (b) VFA and (c) biogas.
Energies 13 01850 g004
Figure 5. Dynamical of VFA including pH and temperature functions at different operation conditions. (a) pH = 5.5, T = 35 °C; (b) pH = 5.5, T = 40 °C; (c) pH = 7.5, T = 35 °C; (d) pH = 7.5, T = 40 °C.
Energies 13 01850 g005
Figure 6. Numerical simulation of the proposed model in the interval of 5 < pH < 8 and 30 < T < 45, (a) VFA production and (b) COD diminution (%).
Energies 13 01850 g006
Table 1. Physicochemical characterization of the raw cheese whey and inoculum.
ParameterCheese WheyInoculum
COD (g L−1)74.24 ± 1.3532.52 ± 4.27
Total carbohydrates (TCH) (gglucose L−1)35.04 ± 1.560.94 ± 0.07
Total solids (g L−1)51.21 ± 1.3649.87 ± 0.95
Volatile solids (g L−1)36.68 ± 4.6822.46 ± 4.30
Volatile sedimented solids (g L−1)1.20 ± 0.242.15 ± 0.41
Volatile fatty acids (VFA) (gCOD L−1)0.57 ± 0.0828.56 ± 1.90
Proteins (mg L−1)27.32 ± 2.177.22 ± 1.09
pH4.72 ± 0.046.85 ± 0.08
Table 2. Results of experimental test used to evaluate the pH and temperature effects on the VFA production during anaerobic treatment of raw cheese whey.
pHT (°C)TCH Degradation (%)COD Diminution (%)Biogas (mL)VFA Generated (gCOD L−1)
5.53598.38 ± 0.8245.81 ± 1.8132,150 ± 128624.35 ± 0.61
5.54098.97 ± 0.28 39.2 ± 1.5234,241 ± 130130.71 ± 0.41
7.53599.19 ± 0.16 21.31 ± 2.653350 ± 40223.8 ± 0.44
7.54098.41 ± 0.2334.9 ± 3.543420 ± 33529.73 ± 0.29
Table 3. Estimated parameters of proposed mathematical model to four operation conditions.
ParameterpH = 5.5, T = 35 °CpH = 5.5, T = 40 °CpH = 7.5, T = 35 °CpH = 7.5, T = 40 °C
K h 0.00250.000860.00260.0013
k d 1 0.00190.001670.01120.003
Y X h / S 1 1 9.6926.5520.9319.99
μ a m a x 0.5510.1390.3030.301
K S 2 76.50220.15110.3016.24
k d 2 0.01100.009720.0990.096
Y S 2 / X h 0.000390.0008720.7623.40
Y X a / S 2 1 33.6545.330.94051.46
Y A / X a 368.465994.0713.8517.32
μ m m a x 0.04970.09960.18840.125
K A 8.162.8619.3014.06
Y X m / A 26.8984.4688.74147.26
k d 3 0.001950.000050.03120.00011
Y C H 4 / X m 489,888.98250,696.16152.21151.146
K I 35.4322.87408.52122.69
ϕ 1 0.9081.000.76100.615
ϕ 2 0.11530.08540.30420.310

