Ultracapacitors for Port Crane Applications: Sizing and Techno-Economic Analysis

1
Department of Astronautical, Electrical and Energy Engineering (DIAEE), Sapienza University of Rome, 00184 Rome, Italy
2
P2S, Inc., Long Beach, CA 90815, USA
*
Author to whom correspondence should be addressed.
Energies 2020, 13(8), 2091; https://doi.org/10.3390/en13082091
Submission received: 2 March 2020
/
Revised: 30 March 2020
/
Accepted: 7 April 2020
/
Published: 22 April 2020
(This article belongs to the Special Issue Advances in Supercapacitor Technology and Applications)
Abstract
:The use of energy storage with high power density and fast response time at container terminals (CTs) with a power demand of tens of megawatts is one of the most critical factors for peak reduction and economic benefits. Peak shaving can balance the load demand and facilitate the participation of small power units in generation based on renewable energies. Therefore, in this paper, the economic efficiency of peak demand reduction in ship to shore (STS) cranes based on the ultracapacitor (UC) energy storage sizing has been investigated. The results show the UC energy storage significantly reduce the peak demand, increasing the load factor, load leveling, and most importantly, an outstanding reduction in power and energy cost. In fact, the suggested approach is the start point to improve reliability and reduce peak demand energy consumption.
1. Introduction
It is well known that large-scale commodity (and people) transport uses the sea as a crucial and optimal route. In maritime transportation ports and harbors with power demands of tens of megawatts based on some vast consumers with a high peak level (such as giant cranes, cold ironing, etc.) require a unique power system. Hence, the electrical load areas of port facilities must be organized as microgrids pointing to the goal of a net-zero energy load system that allows a reduced impact on the network supply [1]. The nodes of the maritime highways are the ports representing strategic and critical logistic nodes, both for the strategical service and the energy consumption. Container terminals (CTs) are special zones of the ports used for the transportation of goods as an intermodal exchange between ships and ships and between ships and other transportation vectors (trucks and trains) [2]. Automated terminals are defined as terminals with at least some container handling equipment operating without direct human interaction for 100% of the duty cycle of the equipment. In most cases, drivers have been physically removed from the cranes, although in some cases drivers remain in the equipment cabins but are not needed for the entire duty cycle. There are several types of automated container terminal around the world. The case study of the present paper is Pier E of the Port of Long Beach (POLB), in which the cranes contribute to most of the power demand. The electrical power system in Pier E consists of a subpart of the whole system of the POLB, supplied by an MV/V substation 66/12 kV, owned by Southern California Edison Company [3].
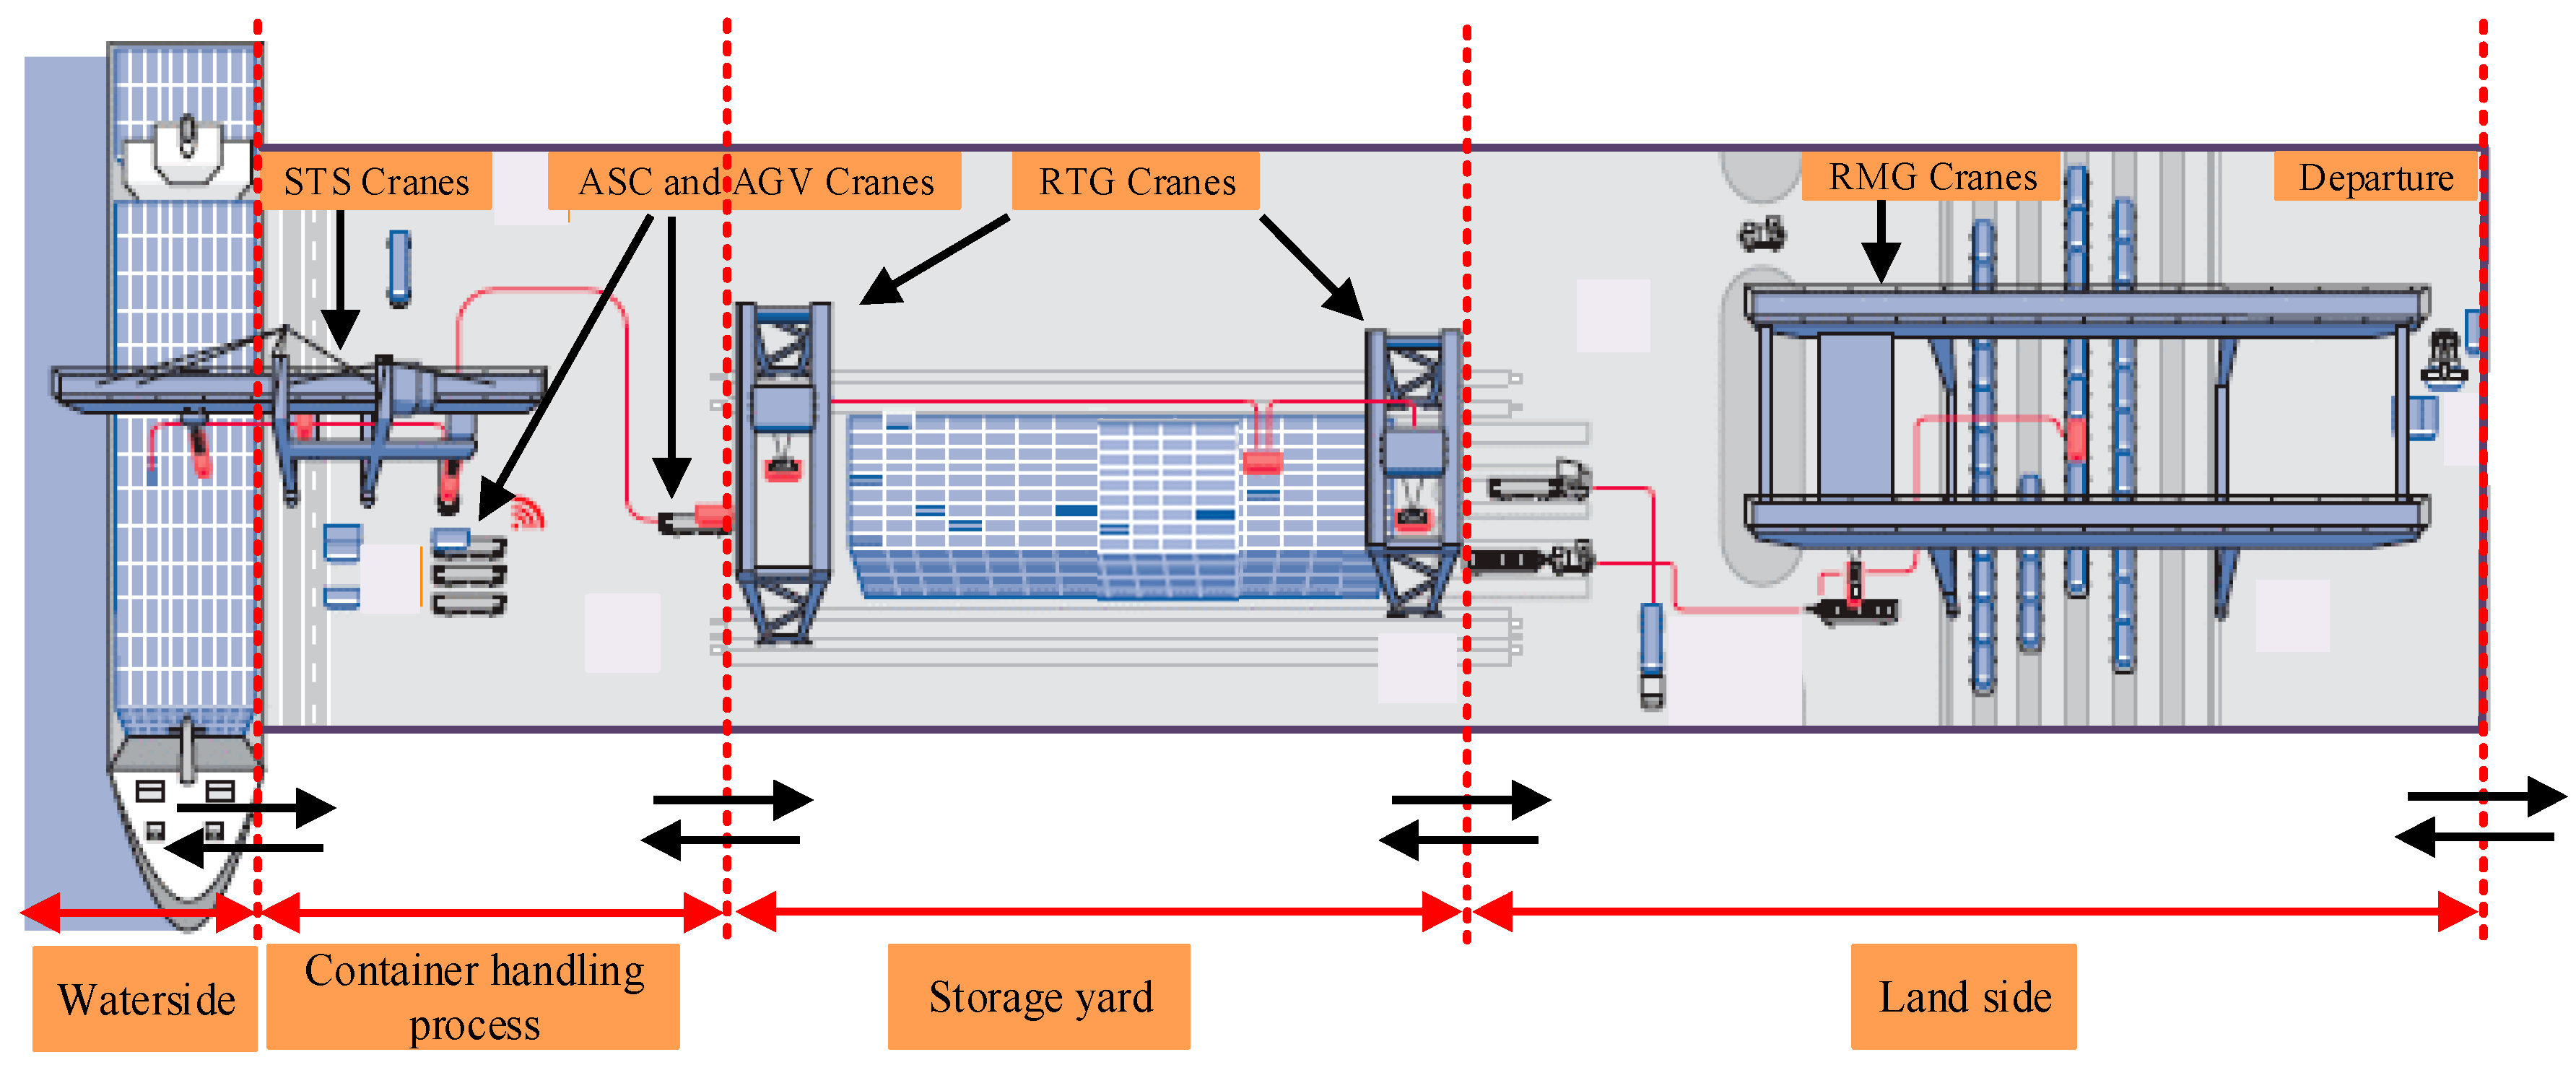
There are different types of crane in operation in a CT. First, ship to shore (STS) cranes, also well known as quay cranes (QC), act as an interface between land and ships and have to load or unload container ships as quickly as possible, usually with multiple cranes working on a single ship. The containers then have to be transported horizontally to the stacking yard behind the STS cranes. This is done by much smaller vehicles like container tractors, automated guided vehicles (AGVs), or automated straddle carriers (ASCs). Finally, the containers are stacked for the most efficient use of space and time, before they are transferred onto trucks or trains that transport them overland. In smaller terminals, this stacking can also be done by straddle carriers, but usually, this is done by rail-mounted gantry (RMG) cranes. Figure 1 provides a flow diagram of a CT operation.
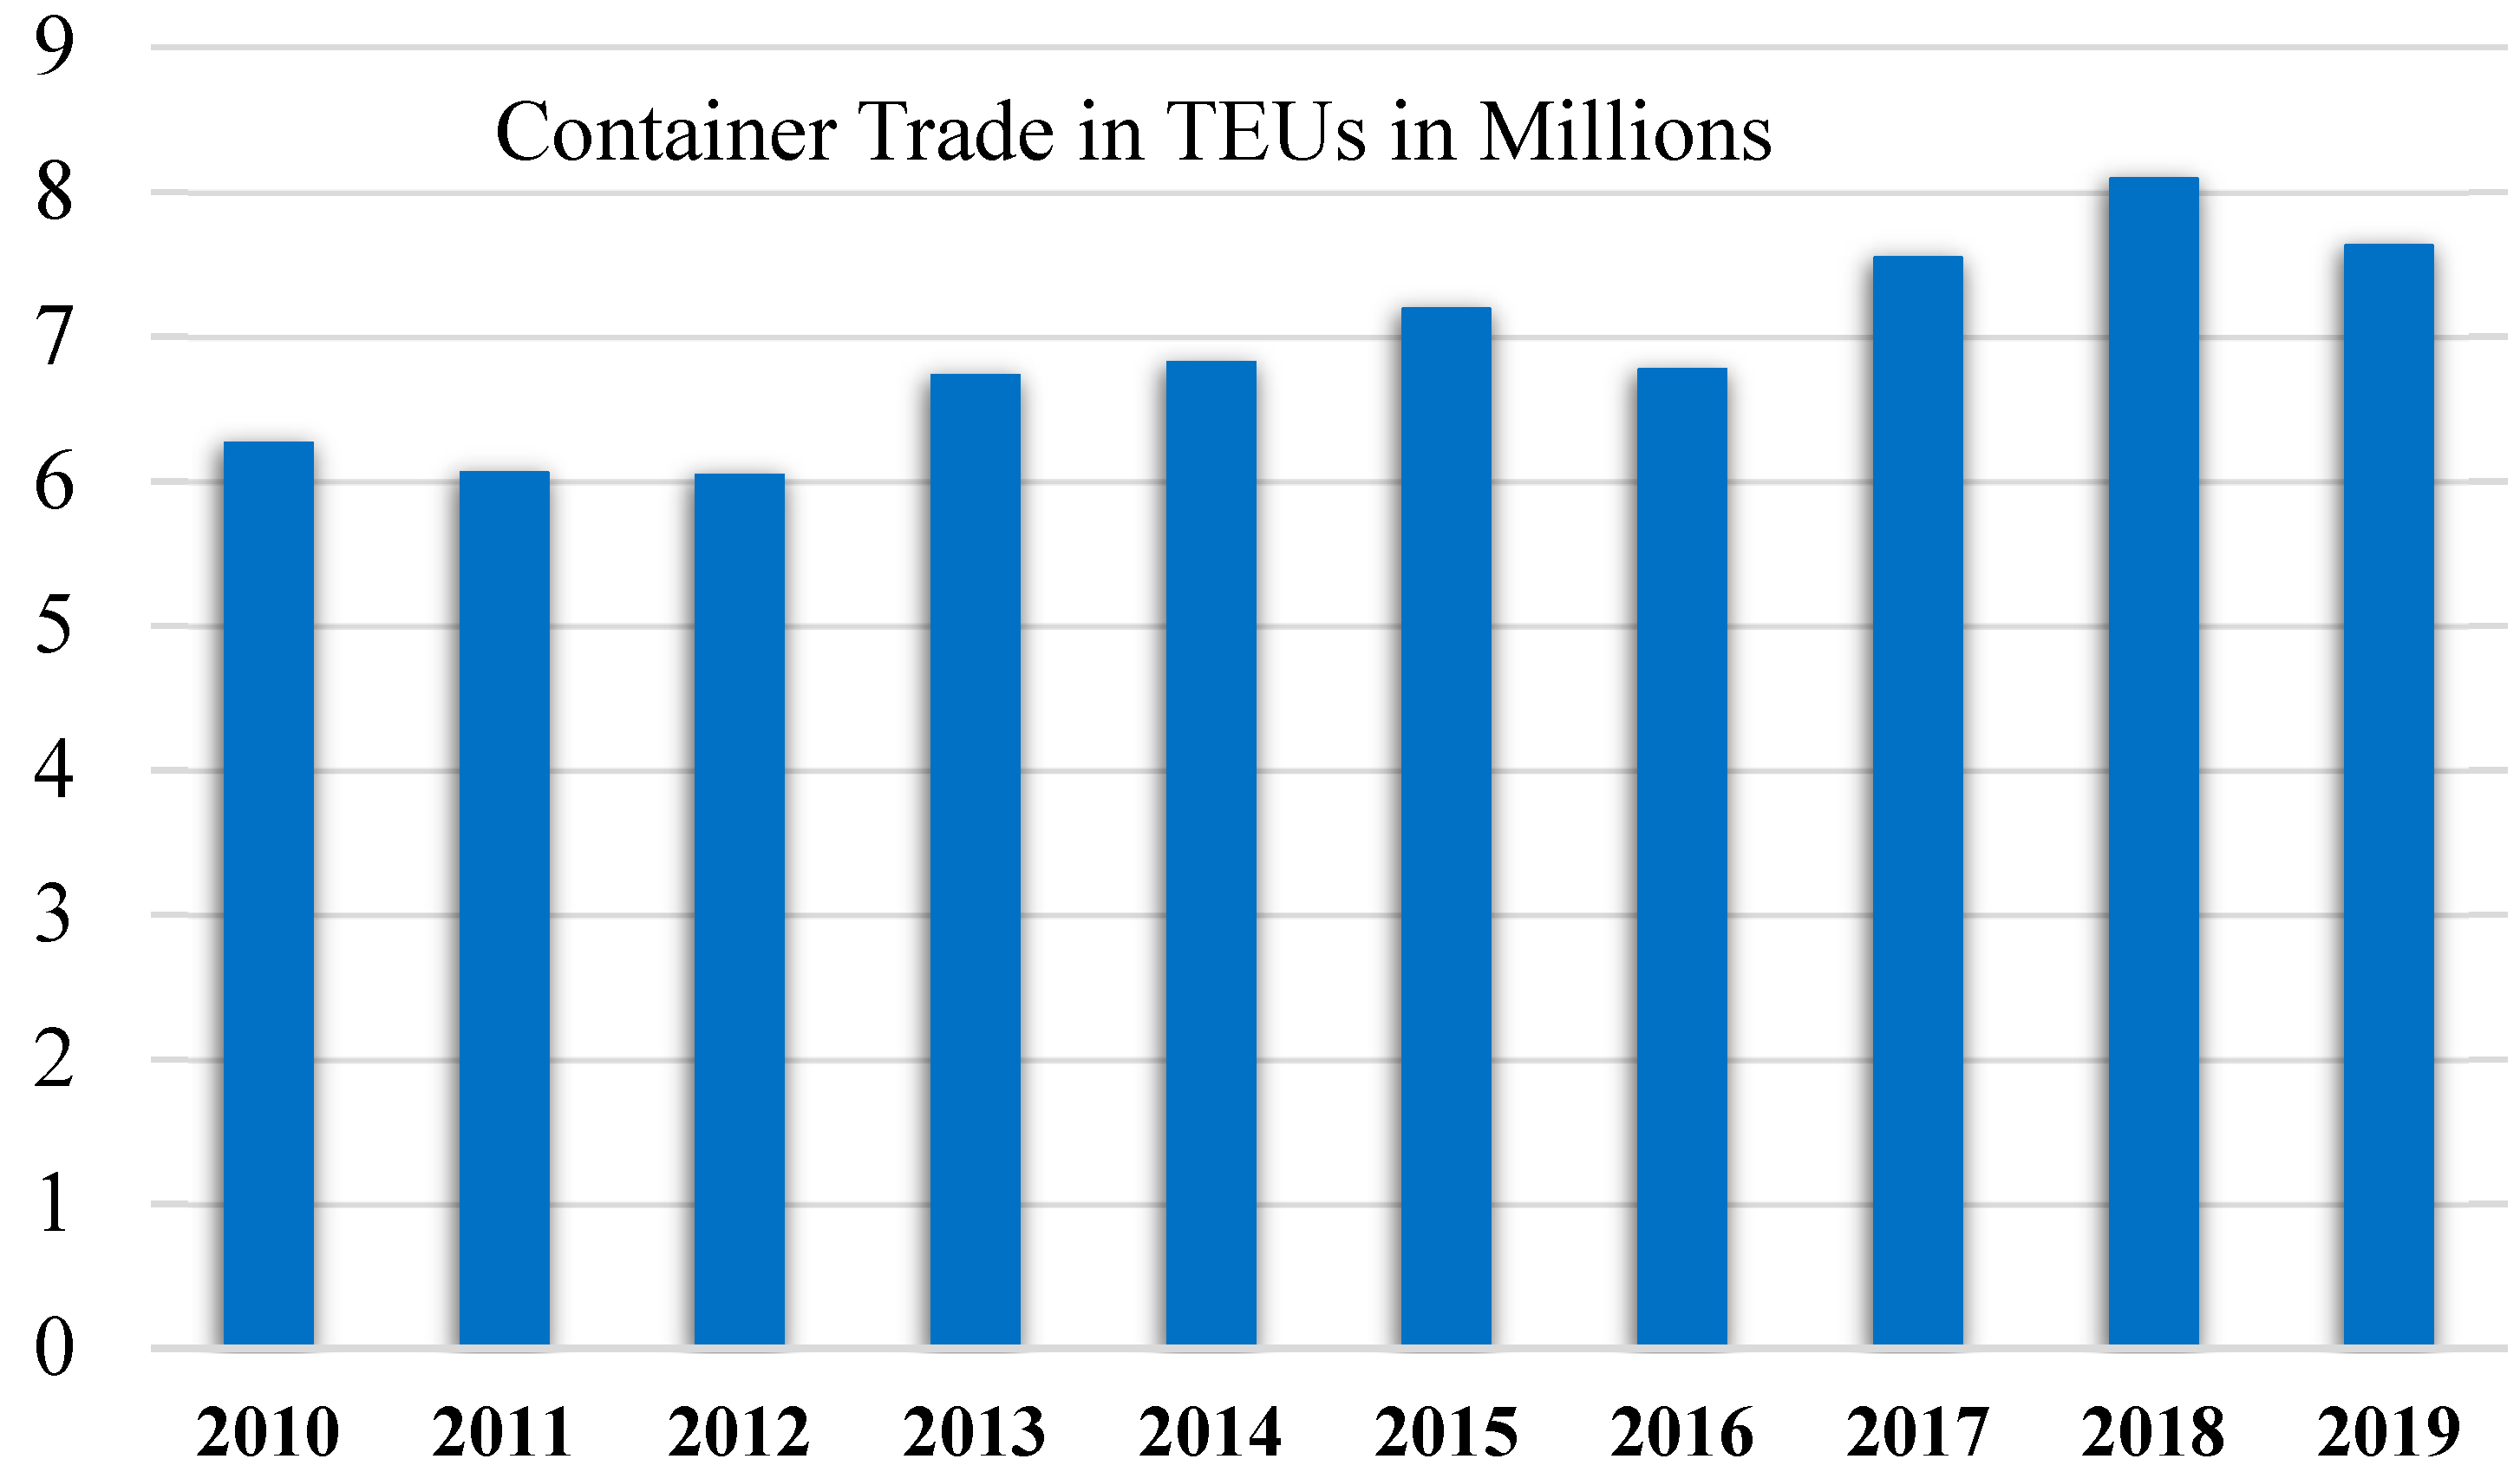
POLB is one of the busiest and thriving seaports in the world is the second busiest container port in the US, after the Port of Los Angeles (POLA), which adjoins it. With an extension of about 13 km2, it generates approximately $100 billion and provides more than 300,000 jobs. In the last few years, as shown in Figure 2, the container trades are reaching the highest level ever, and a contraction has been recorded in a ten-year period [4].
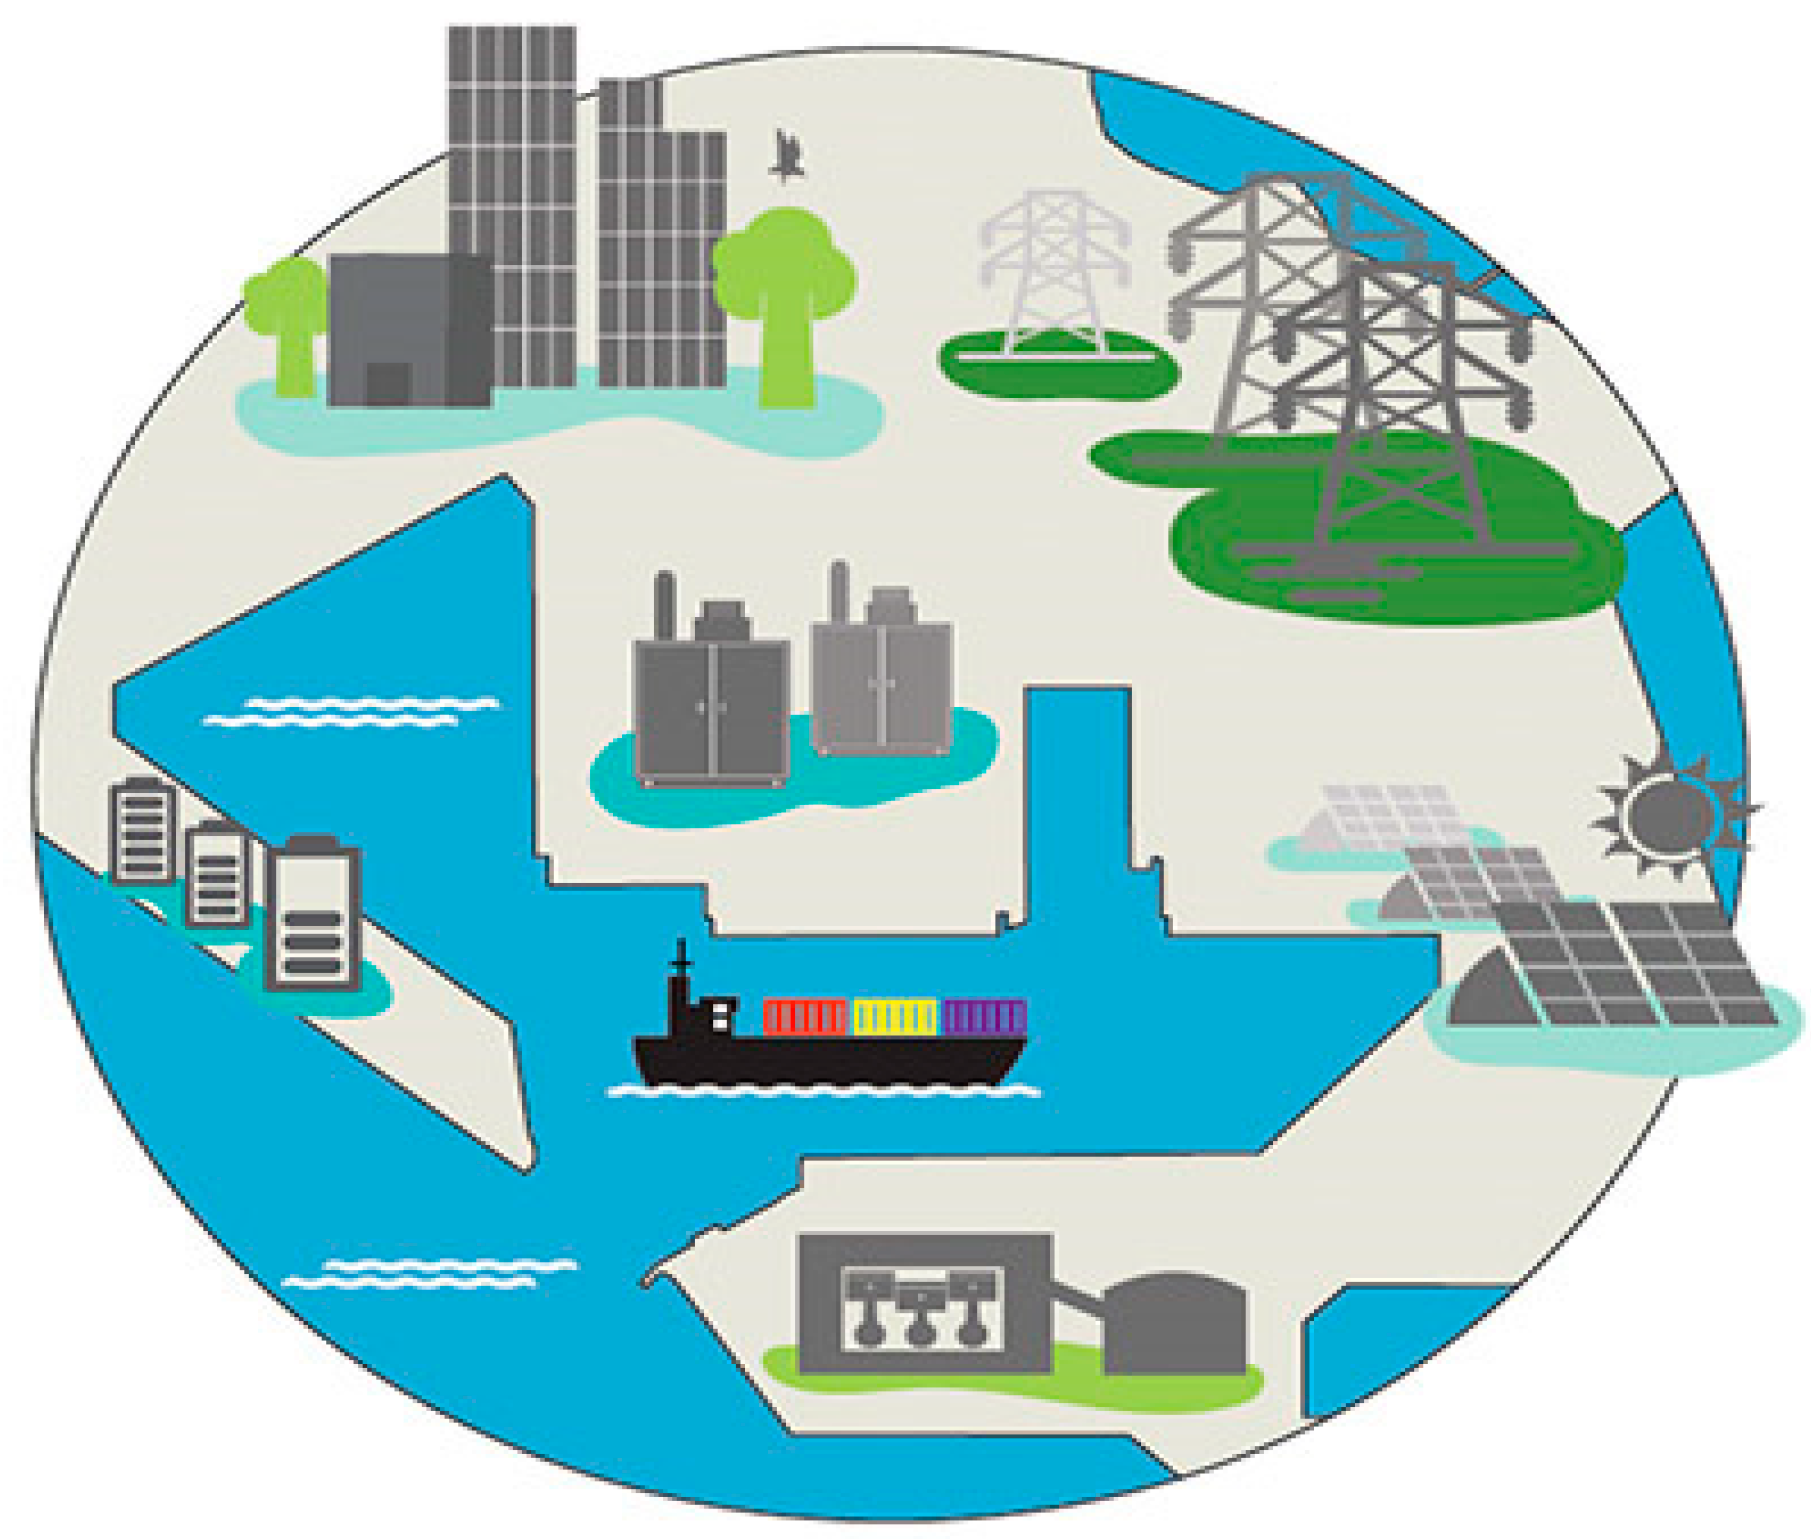
Nowadays, by expanding renewable energy sources in electrical power systems, ports authorities have encouraged the use of these units. New solutions for electrical grids are under study in the global community. The main research areas are assigned to renewables, sustainability, low or zero-emissions, smart grids, aggregation, etc. The goal is to create models for smart grids operating in seaports to optimize energy consumption and to reduce the emissions. Not only energy management but also safety and maintenance are the drivers to find new solutions [5,6]. Considering a CT port as a microgrid, such as Figure 3, requires two main infrastructures. The first is the physical assets such as power lines, breakers, transformers, conventional and renewable energy sources, and the second one is communication and control, which is necessary for communication and the controls between the physical assets, for example the local ethernet network, serial connection, microgrid controller, protective relay [7].
The new scenarios of sustainability, for electrical and energy systems in ports, can be synthesized in the 4-L pillars approach: less, leveled, local, load (also called lele-lolo approach) [8]. Since the cranes, need about 72% of the total power at Pier E (in detail, STS cranes about 37%, ASC cranes 32% and RMG around 3%) [9] with the considerable peak power demand. Hence, the most interesting aspects are the solutions related to the peak-power problem of the cranes. This paper presents a strategy to reduce the peak of the electric power for operation of the group of STS cranes and economic analysis by the integration of energy storage systems (ESSs). The strategy is the optimal sizing of the ESSs, in the first step, and the second one, the coordination of the duty-cycles of the cranes by adopting delay times and synchronization for the operation of the group of STS cranes. The control also exploits the regenerative energy produced by the cranes during some falling phase. The control strategy is based on demand-side management (DSM) with the goal of reduction in the peak (leveled L of 4-L pillars approach). A leveled use of energy aims to have a high load factor and to avoid the billing of peaks unnecessary in the average demand; less use of energy powerfully promotes the rational use of energy and considers the recovery of energy losses as a virtual energy source. Local use of energy promotes a local renewable generation for net-zero energy behavior to reduce environmental pollution and greenhouse gas emissions. Load use of energy promotes an NZELS that avoids reversing energy to the network used as a unidirectional source.
2. STS Crane Operation and Power Demand
In Pier E, double-twin lift cranes are installed with an average consumption of around 3MVA each, during operation with the normal loads, and peak power around 6 MVA for the worst cycle.
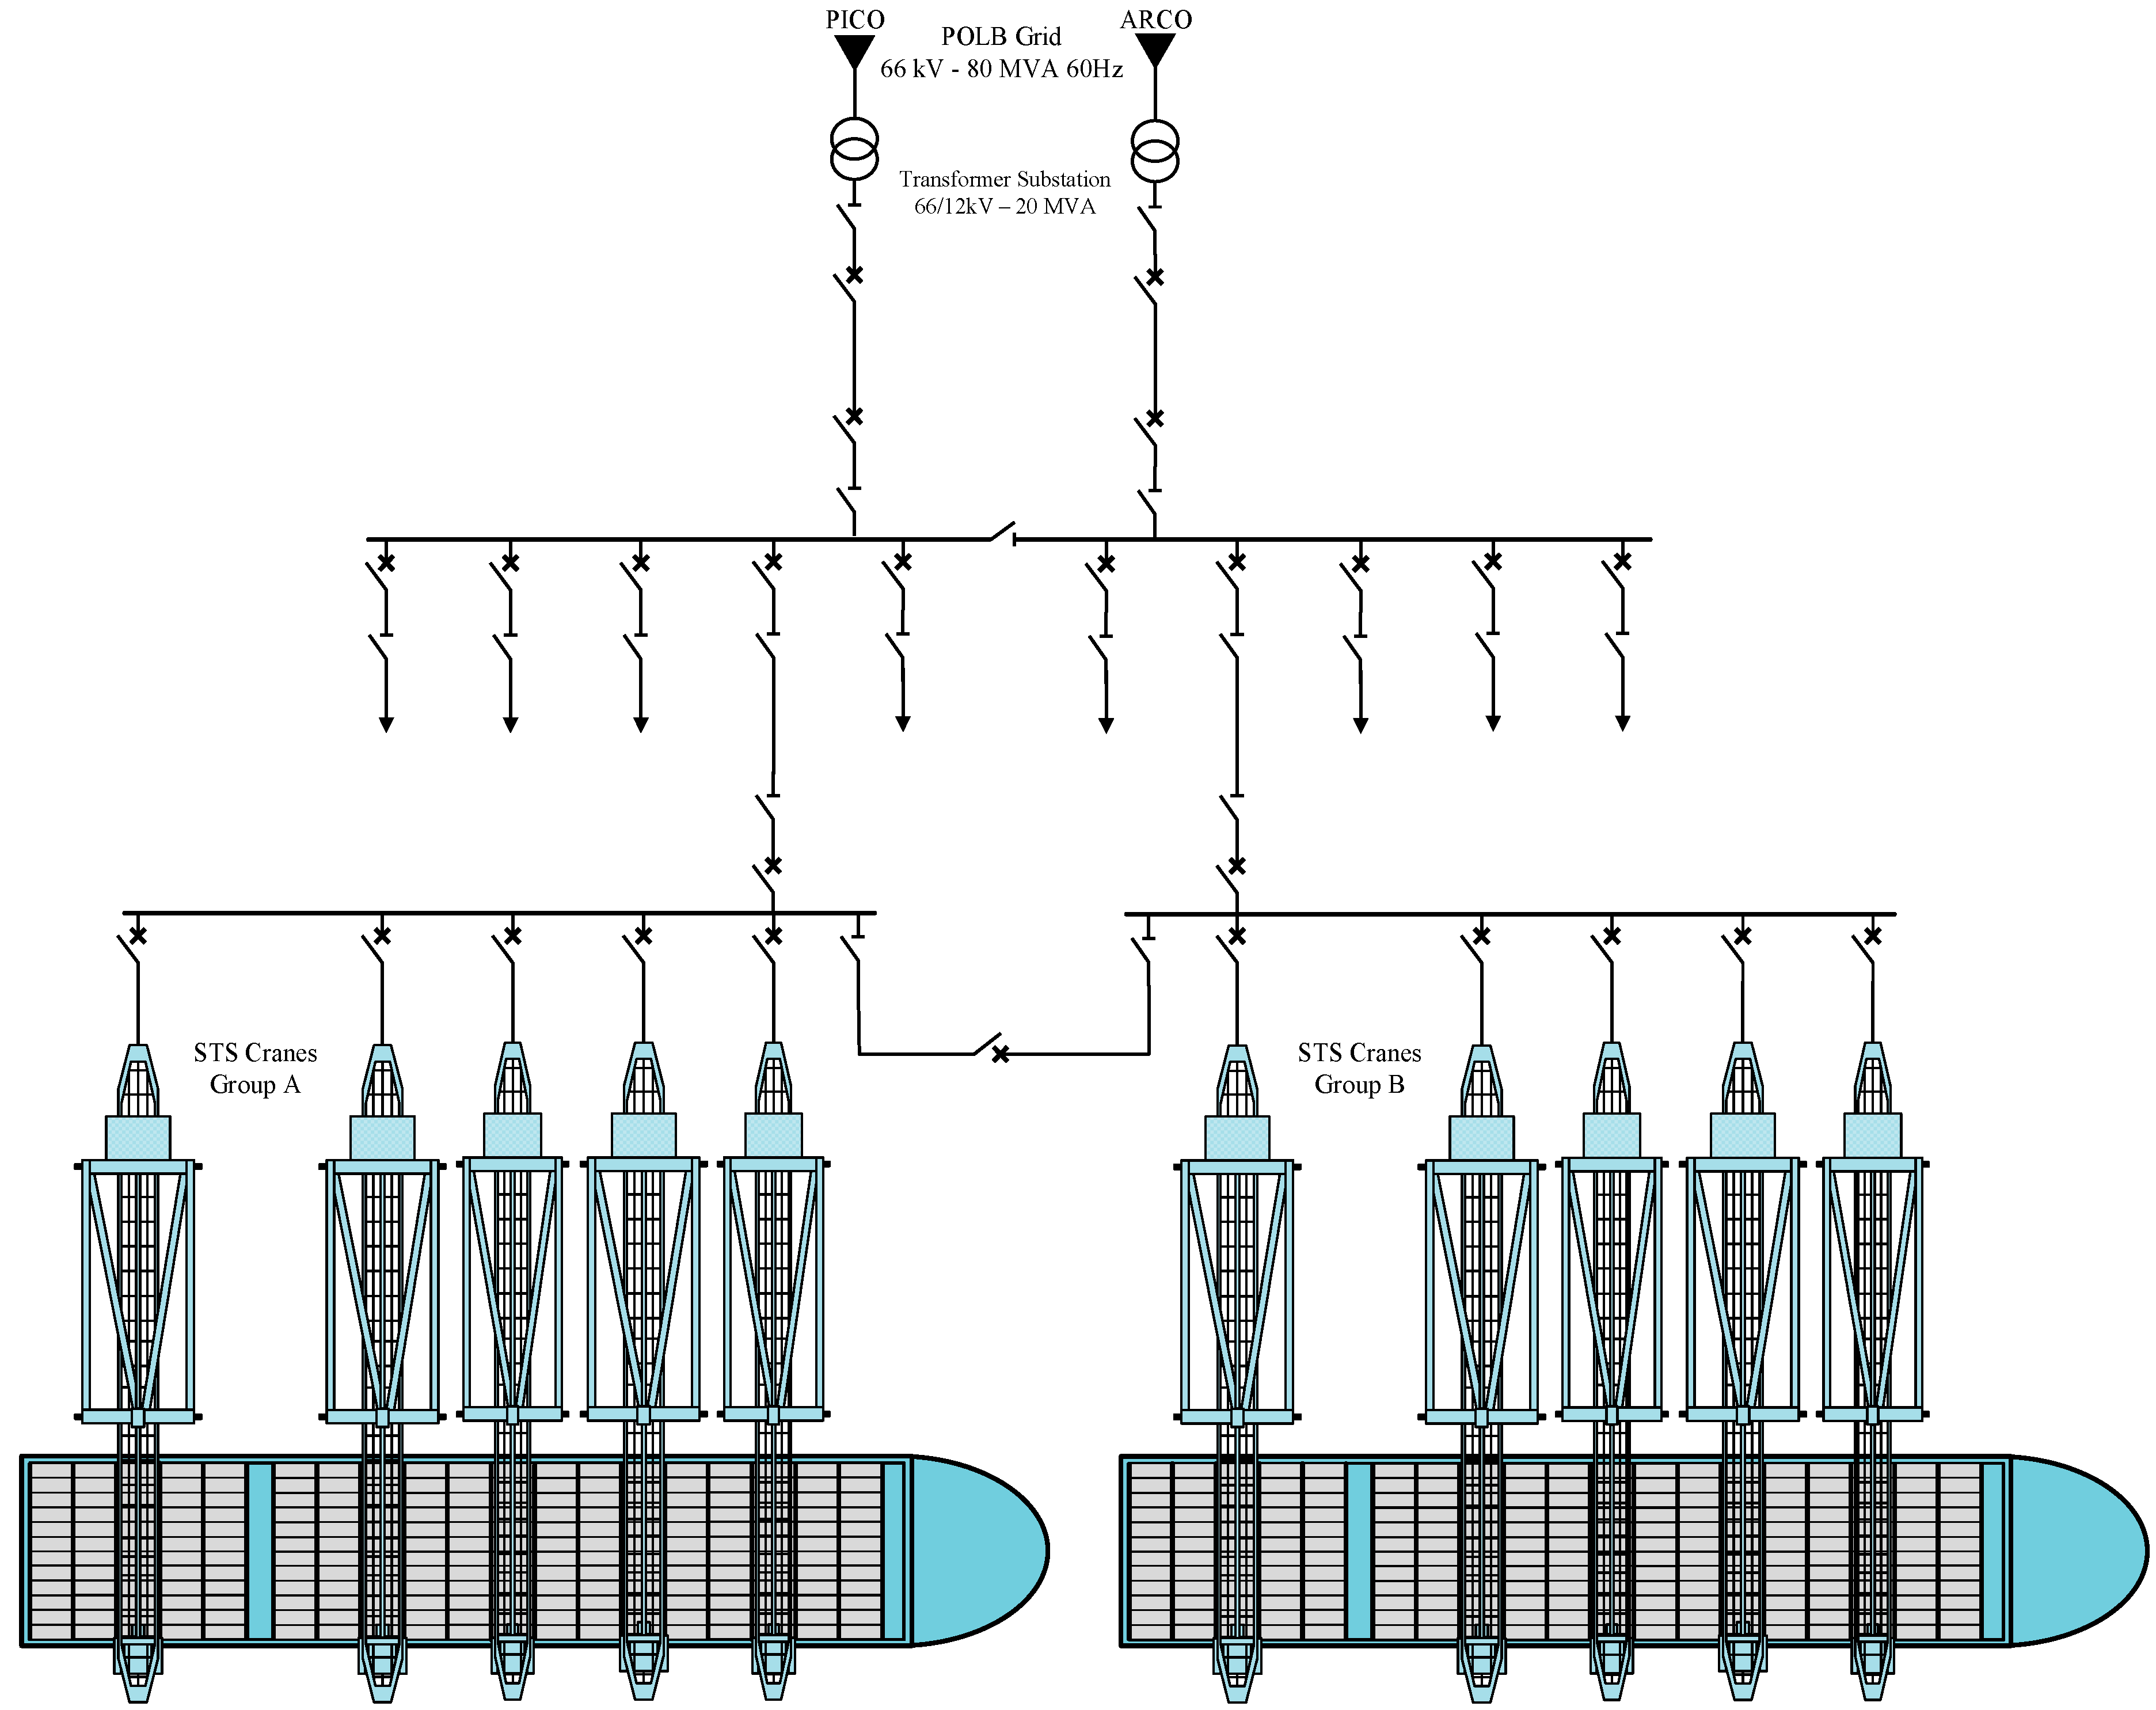
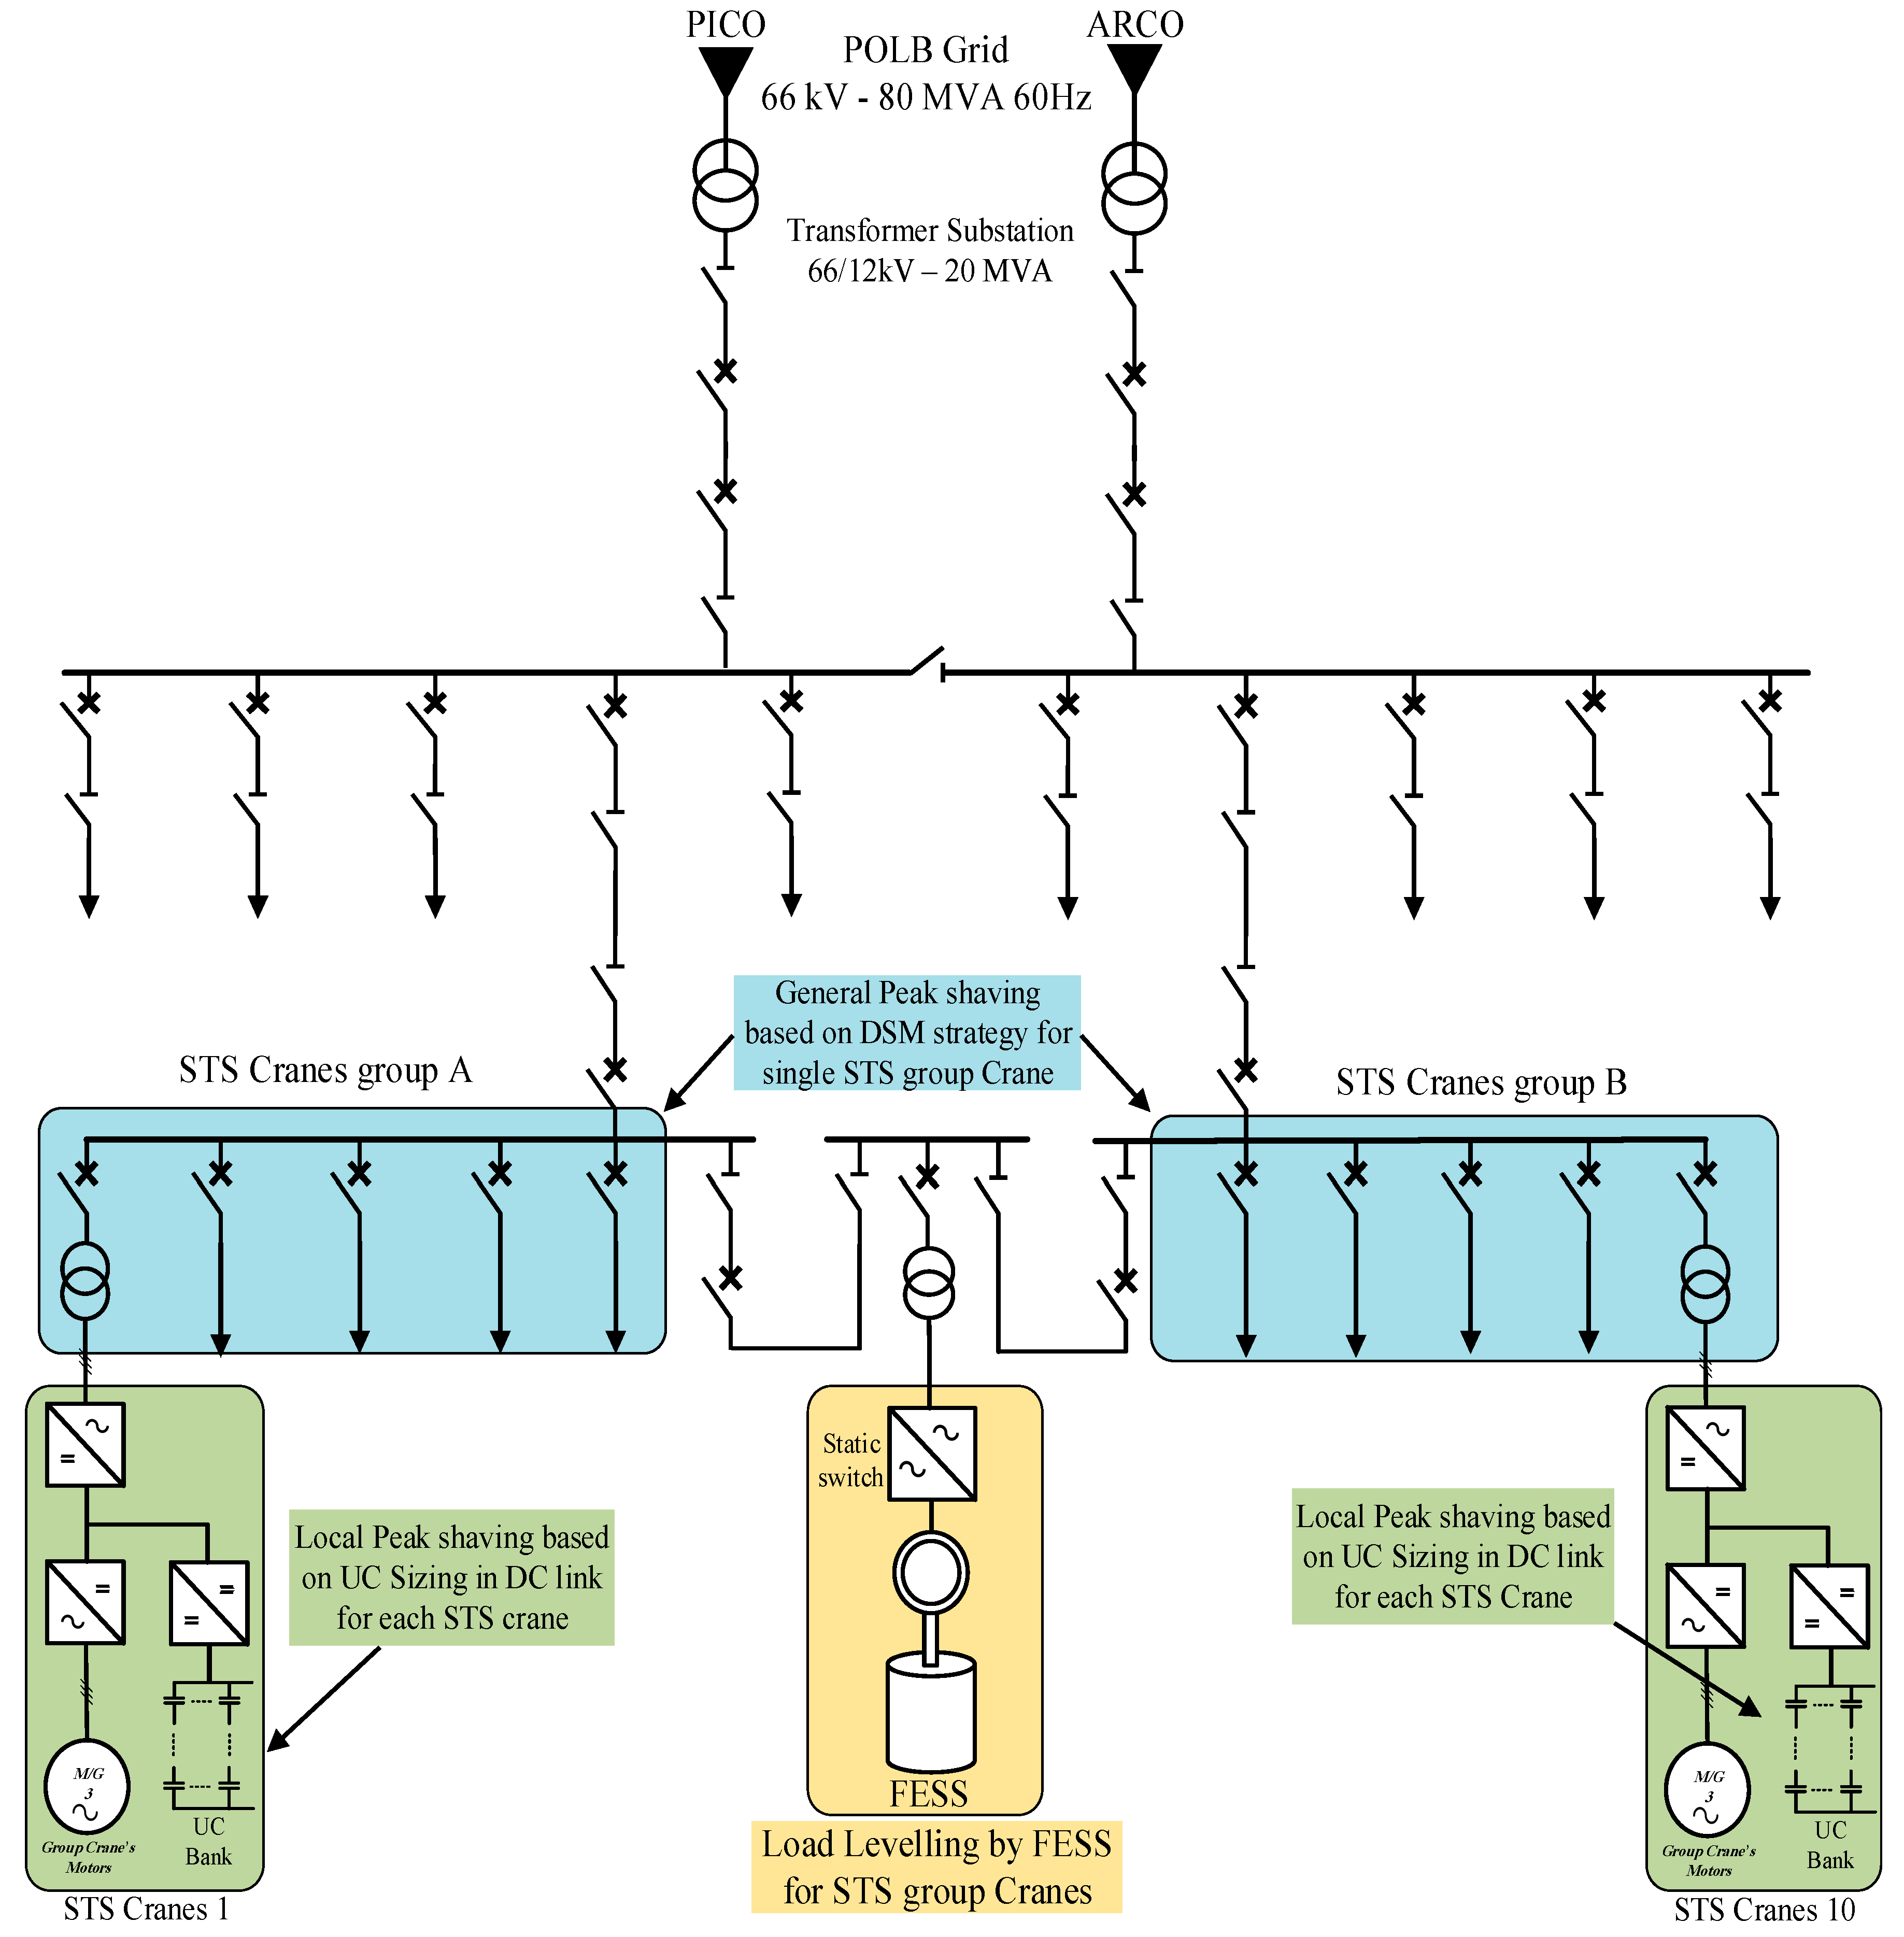
Figure 4 shows the one-line diagram for STS cranes power supply at Pier E. Presently, 10 STS cranes do the container moving for two ships at the same time. The development (in the near future) of Pier E is planned for 14 cranes to increase productivity. The minimum number of STS cranes in a group is five, and the total is 10 STS cranes. By this system, a list of different goals as below are achieved:
- STS cranes’ supply by two transformers substation increases reliability dramatically.
- In the main substation, two independent 66 kV lines with double bus-bar are recommended in which reliability is enhanced.
- The double cable lines in the STS cranes’ power substations mean that if a fault occurs, the system can reconfigure and operate without delay.
- With a double bus-bar, if a failure occurs, it could be isolated, and operation may continue normally on other berths.
However, for the mentation of these proposed aims, as a first and main step, it is required to accomplish the cranes’ duty cycle operation to reduce the peak power, or regenerative energy flows into the grid from this starting point, thus a flywheel energy storage system (FESS) is proposed [10,11].
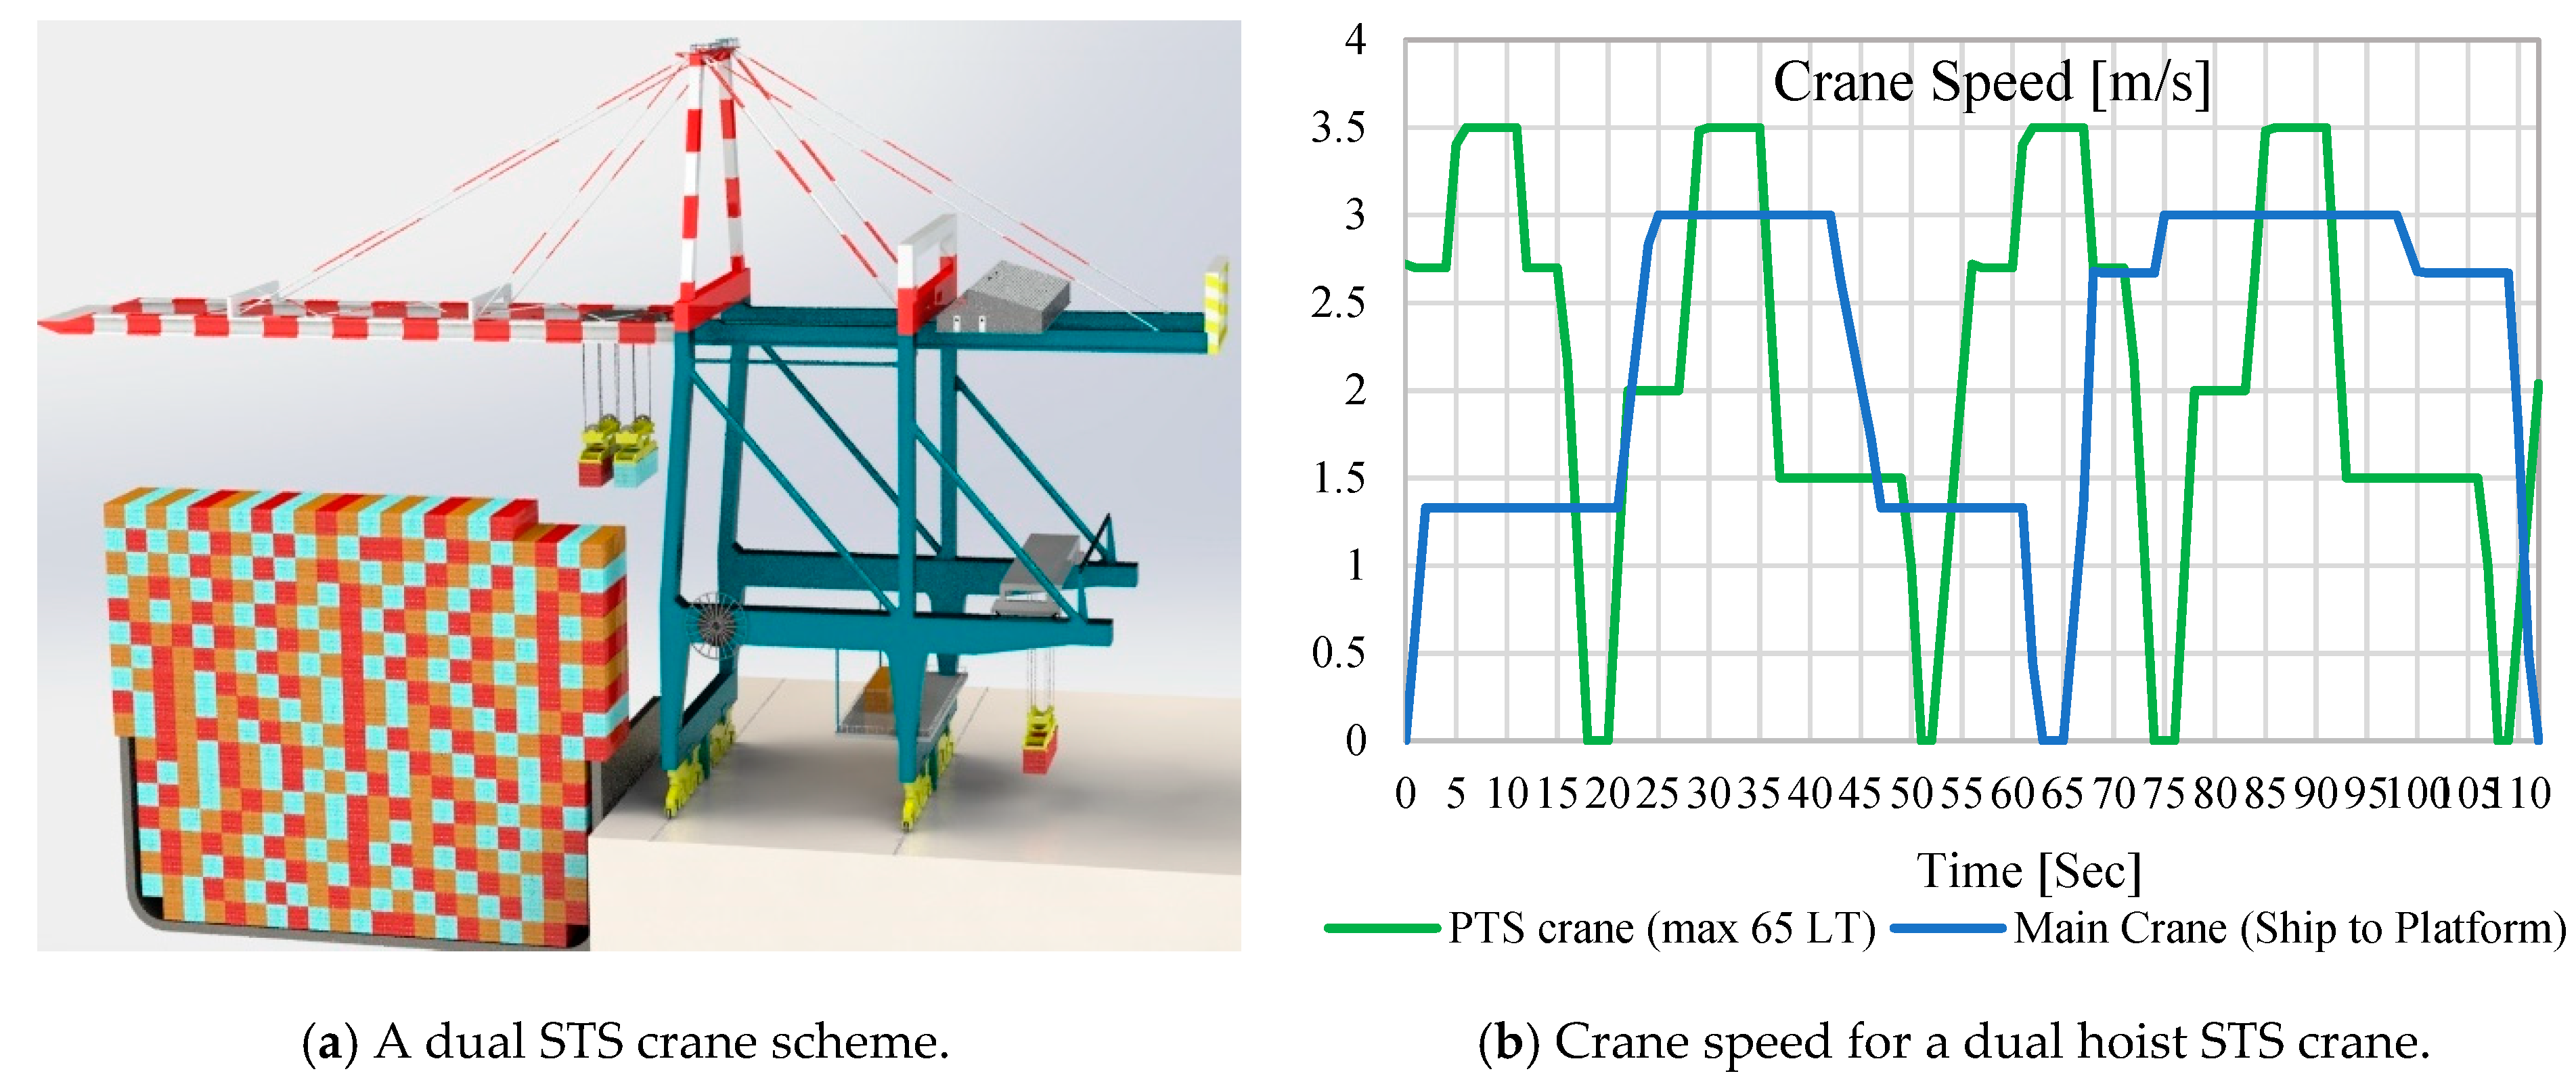
An STS crane is able to unload two 40 ft. containers at once, with a cycle that is completed by two independent cranes mounted on the same frame, while sharing a common platform. To differentiate the two cranes, two different acronyms will be used, the first one is ship to the platform (STP, more than one container for lifting) for the main dual hoist crane and the second one for the platform to shore (PTS, only a sigle container for lifting) crane. Since the PTS crane is equipped with a single hoist lifting capability, it has designed to operate two times faster than the PTS sub-crane. Table 1 shows the dimensions, both in feet and meters, of the considered crane, as well as the expected times in which the crane is expected to execute the task of the cycle.
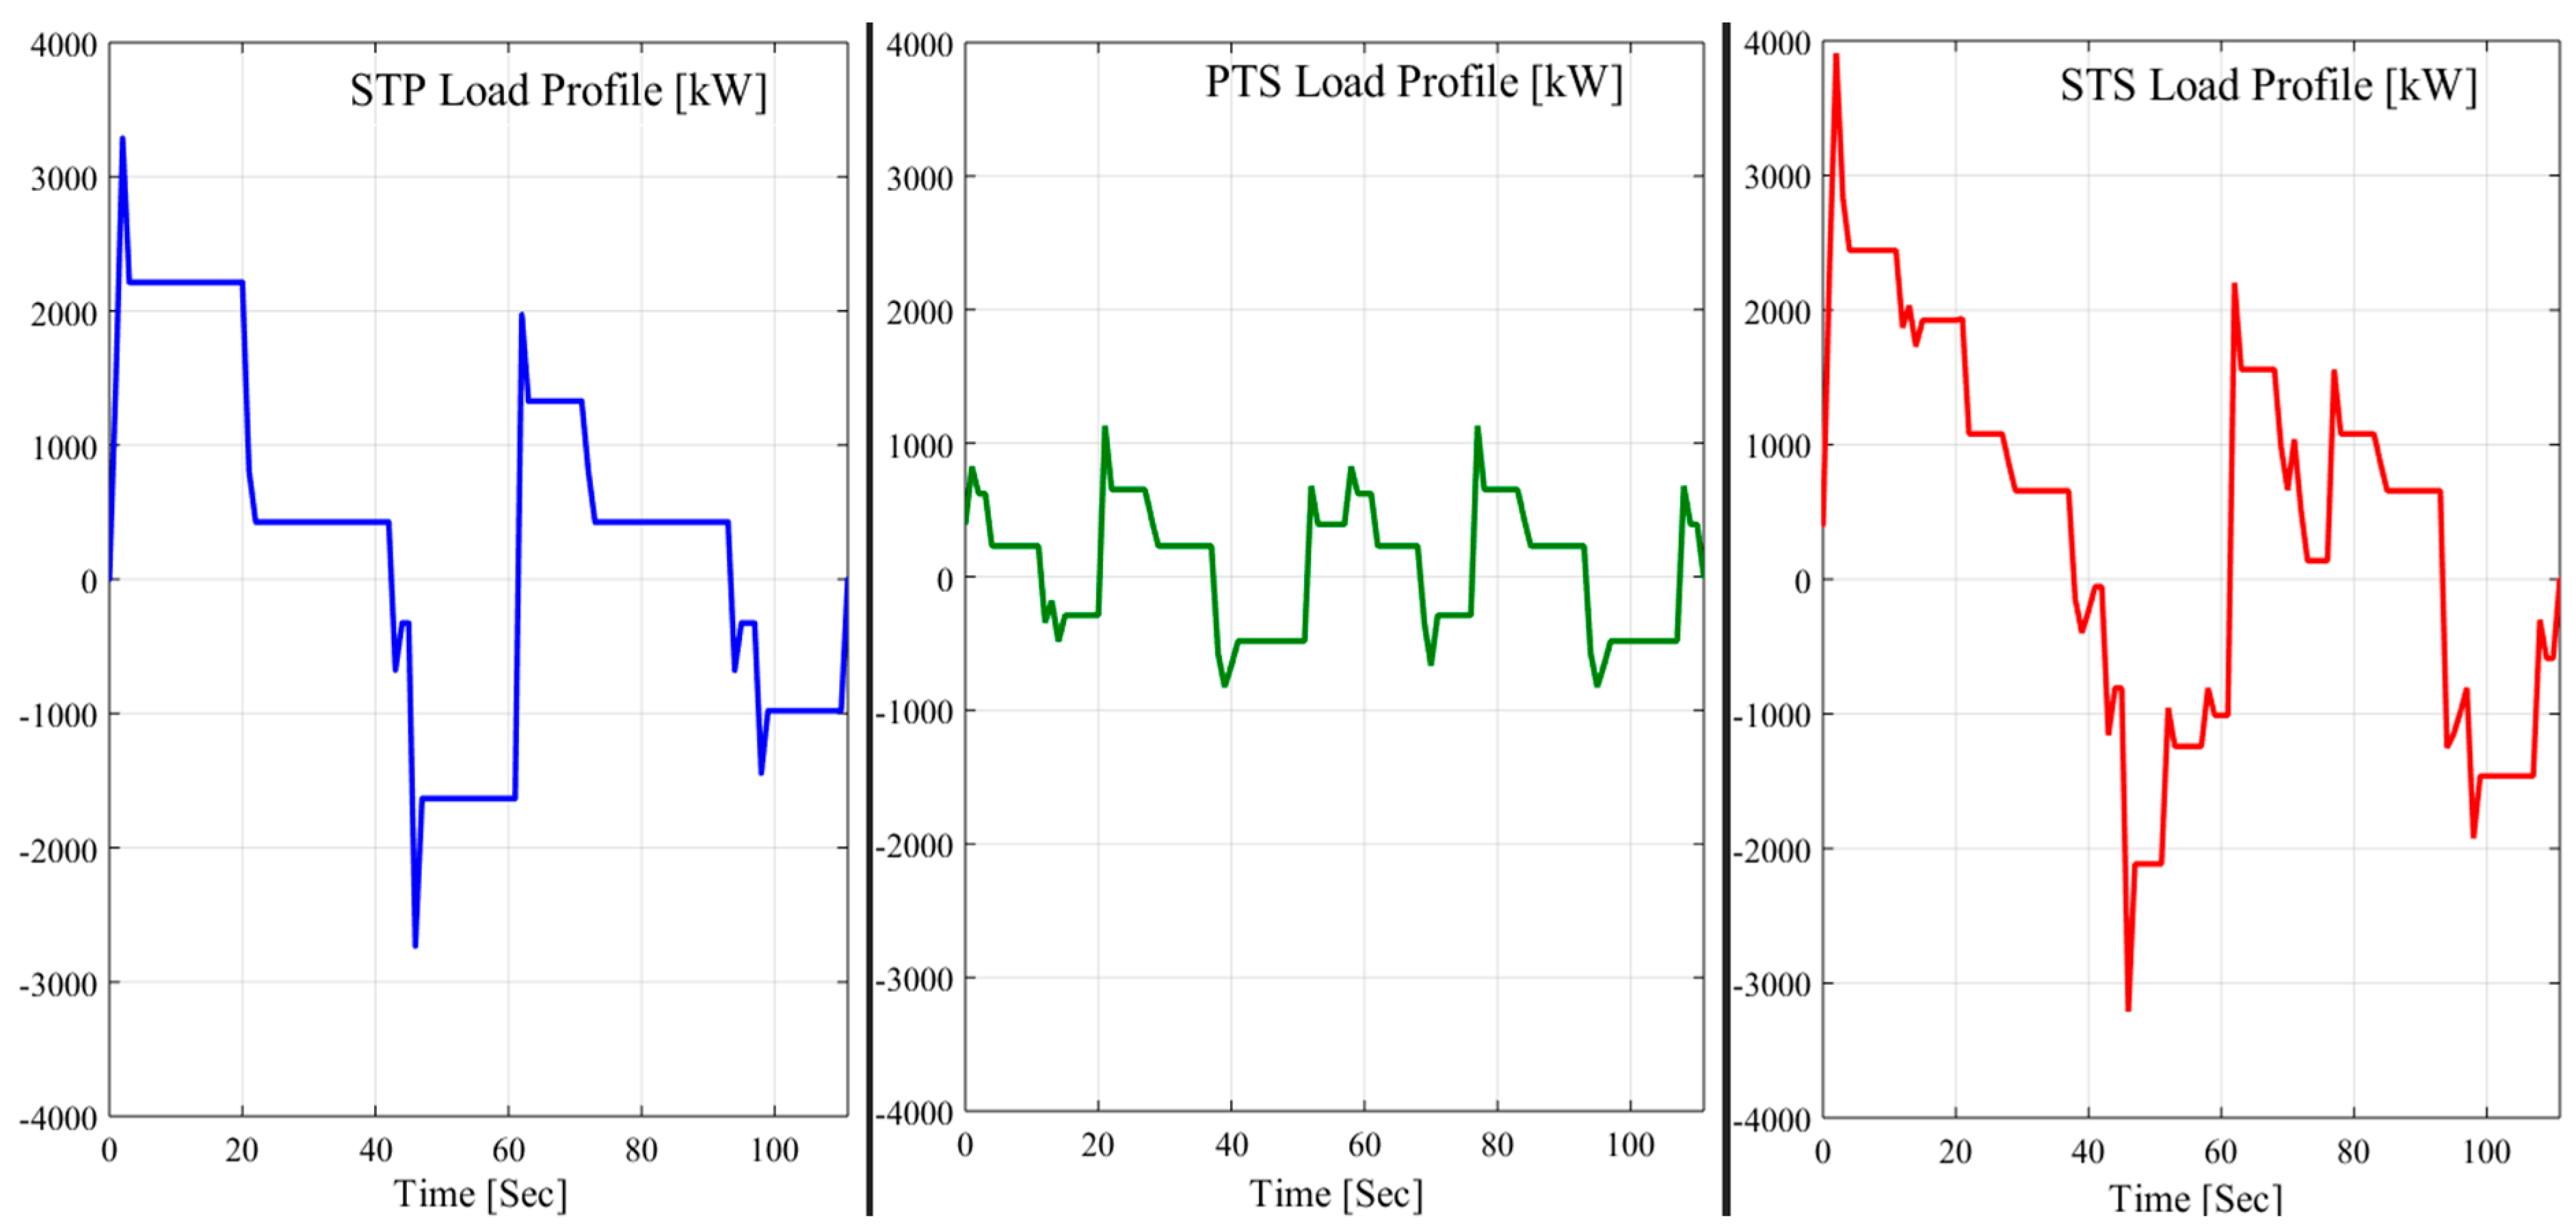
The total time needed for the main crane to complete the operation of the loading and unloading of two containers is around 112 seconds, which depends on a few factors, such as the container’s position on the ship, wind, weight, and other aleatory variables. Calculations were made considering a wind speed of less than 5 m/s, standards 65 LT containers, and the main crane in double-lift mode. Figure 5 shows the STS cranes’ scheme and speed for a reference duty cycle. The power demand for an STS crane is shown in Figure 6. The green line is for a PTS crane, the blue line for a STP crane, and the red line is the total STS crane power demand. As represented, the power consumption is very high during the main hoist operation, reaching a peak of 3908 kW, and the average power required from the grid is about 378 kW for all duty cycles.
3. ESSs Selection for Port Cranes
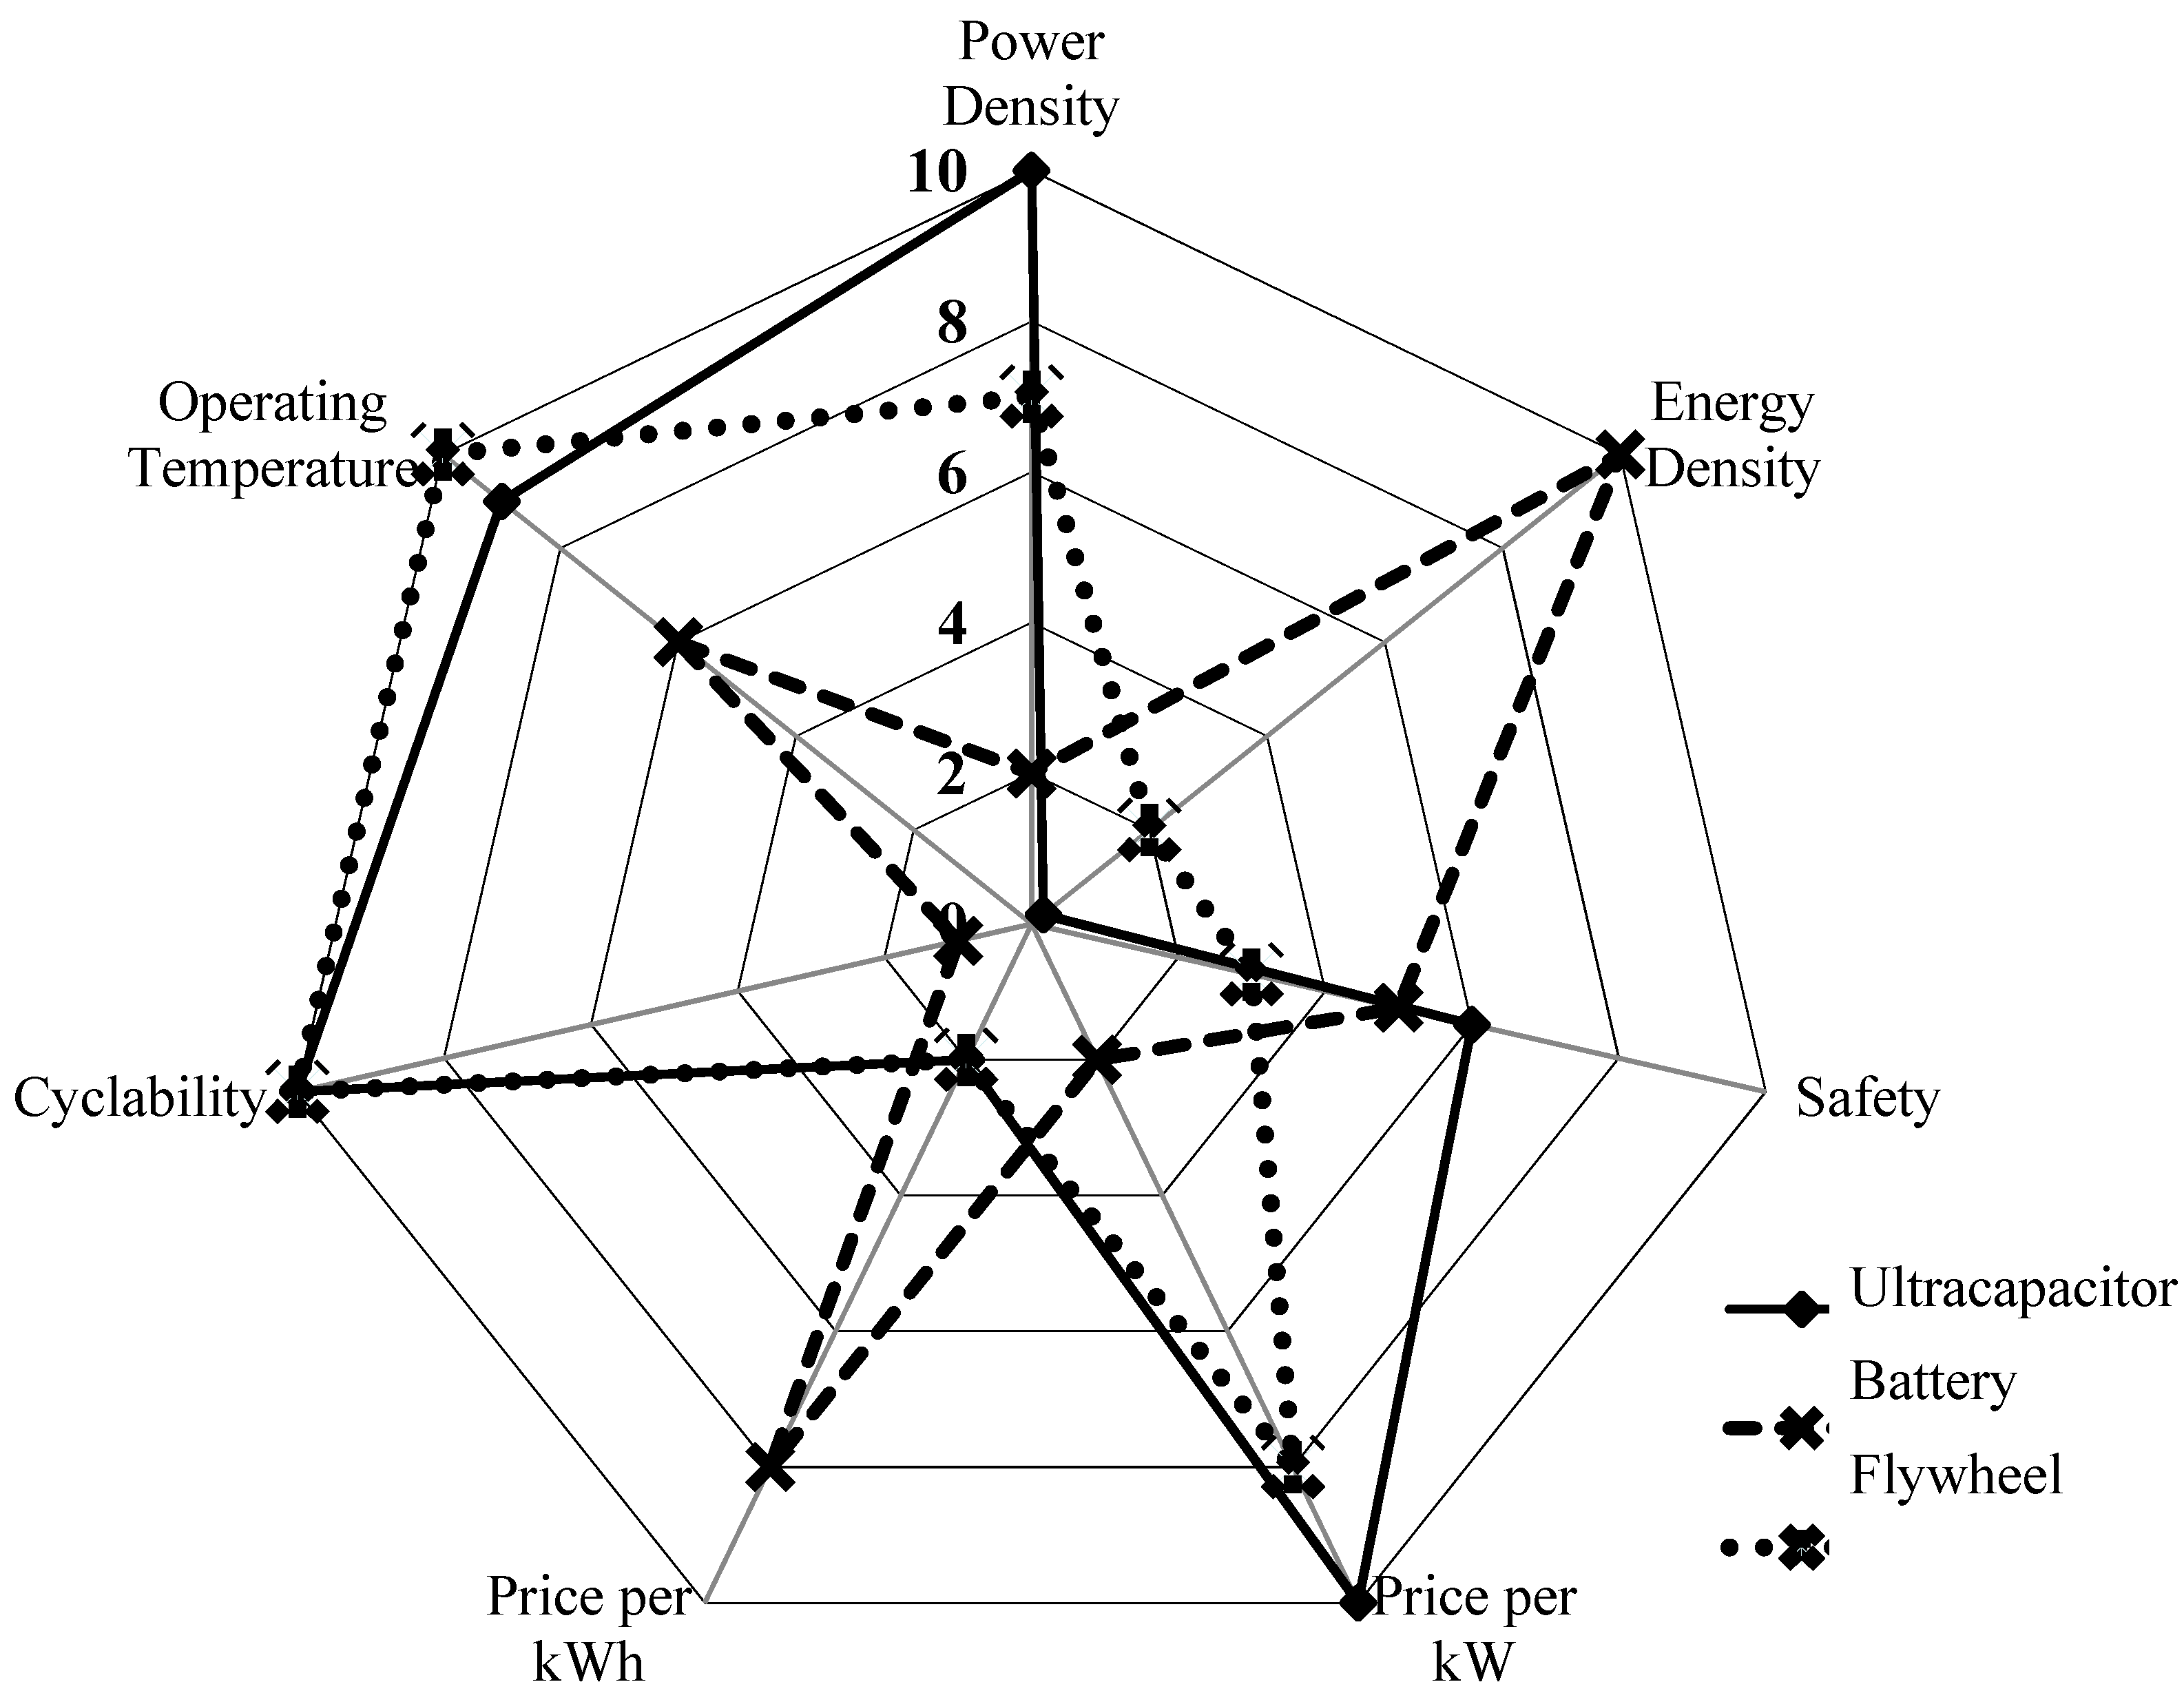
Nowadays, energy storage technologies are used for many applications, for example, power and energy balance, load levelling and peak shaving in power systems. A comparison of the main applications, such as ultracapacitors (UC), battery energy storage systems (BESS) and flywheel energy storage systems (FESS), is shown in Table 2 and Figure 7. UC technologies are proven for different applications, including for peak shaving in cranes. The benefits of power density and fast response time are essential aspects of industrial facilities.
Due to the fast power changes with the high peak value (in seconds) and independent DC link of each crane, UCs with high power density and fast response time are the best choice for peak power and cost savings. Today, UCs are used in a wide range of applications in industry and transportation [13,14].
Among the most critical applications of UCs can point to controlled electric drives [15,16], RTG cranes and elevators for braking energy [17,18,19,20,21], renewable energy (full cell [22], photovoltaic system [23] and wind turbine [24] contributions), diesel-electric generators include gantry cranes [25,26,27] and hybrid excavator machines [28], power quality, uninterruptible power supplies, and traction drives (rail, road, and off-road vehicles) [29,30,31,32].
4. UC Sizing in Terms of Required Energy and Power
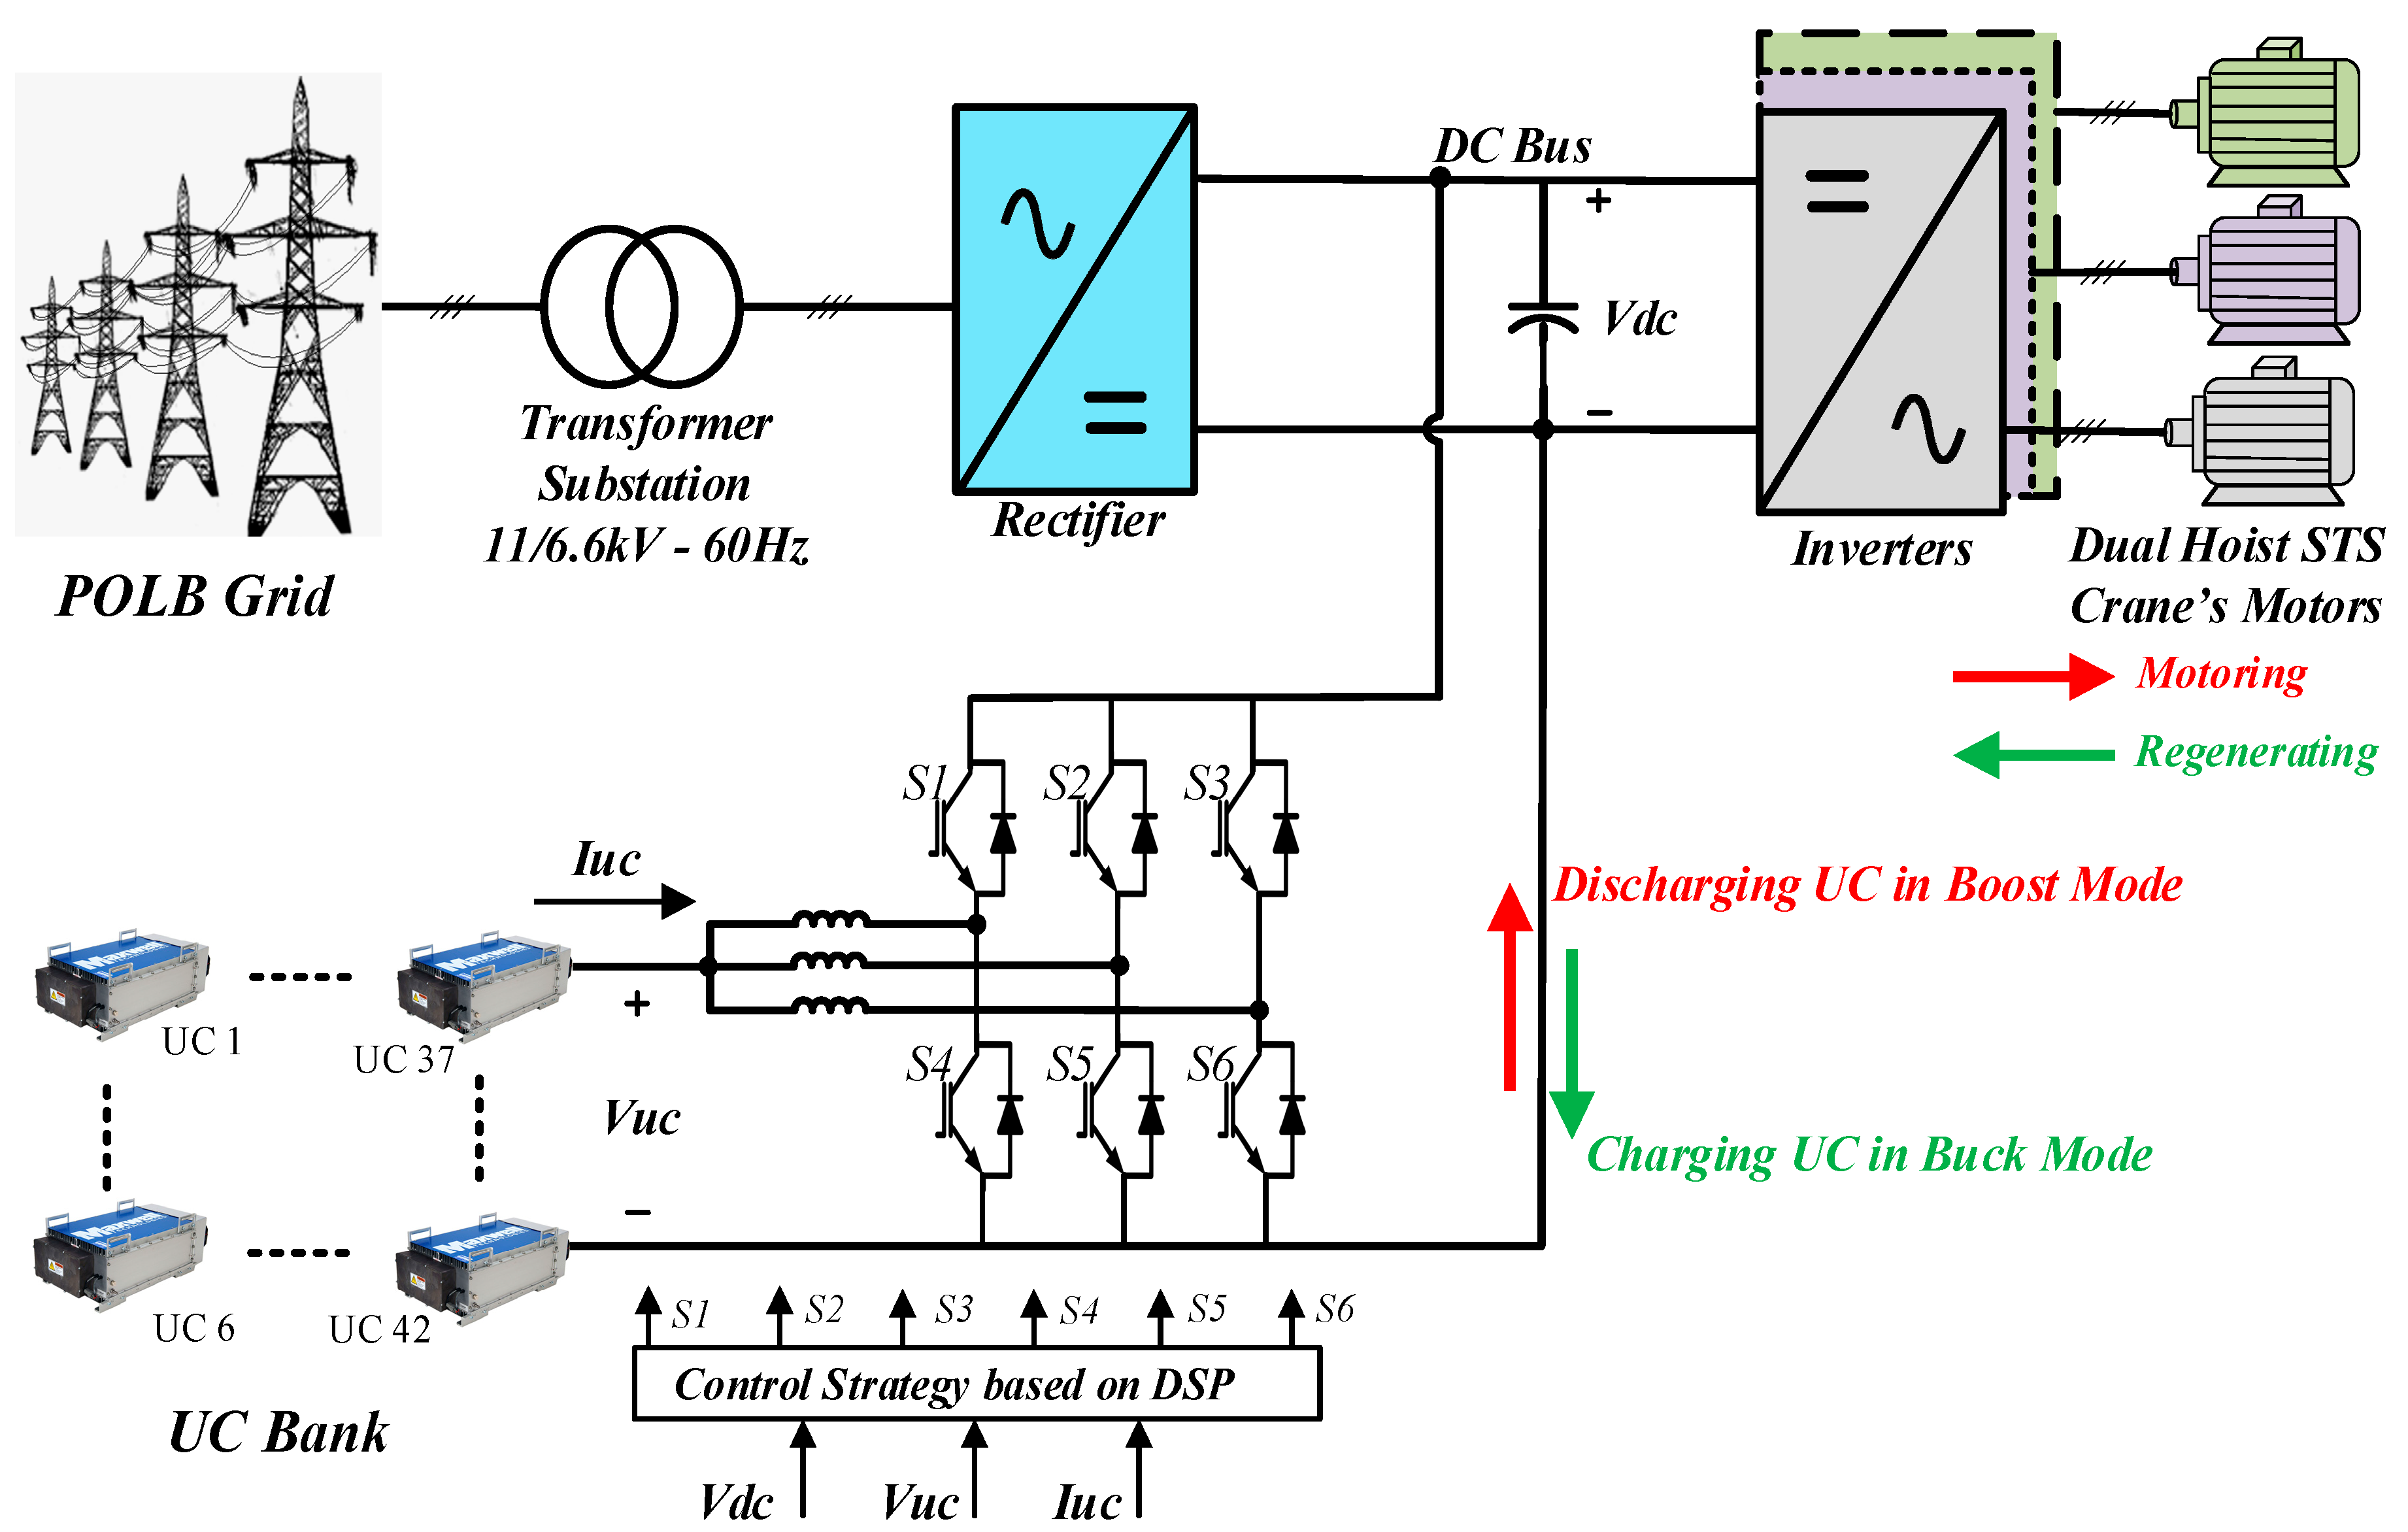
Figure 8 shows the overall scheme of the dual hoist STS crane which is connected to the POLB grid through the AC/DC/AC converters to avoid the voltage rise, leading power factor, and harmonic distortions [33]. The UC bank is connected to the DC link via the bidirectional DC/DC converter. The bidirectional DC/DC converter operates on the boost mode in which electric power is supplied from the UC stage (UC bank discharging in hoisting mode) to the dc link, and on buck mode in which electric power is absorbed from the dc link to the UC (UC bank charging in lowering mode). Bidirectional DC/DC converter applications can handle a high amount of load currents up to several hundred amperes. The control strategy of the DC/DC converter is based on a TMS320vc33 digital signal processor (DSP) which is able to do the speed and electromagnetic torque estimation [34].
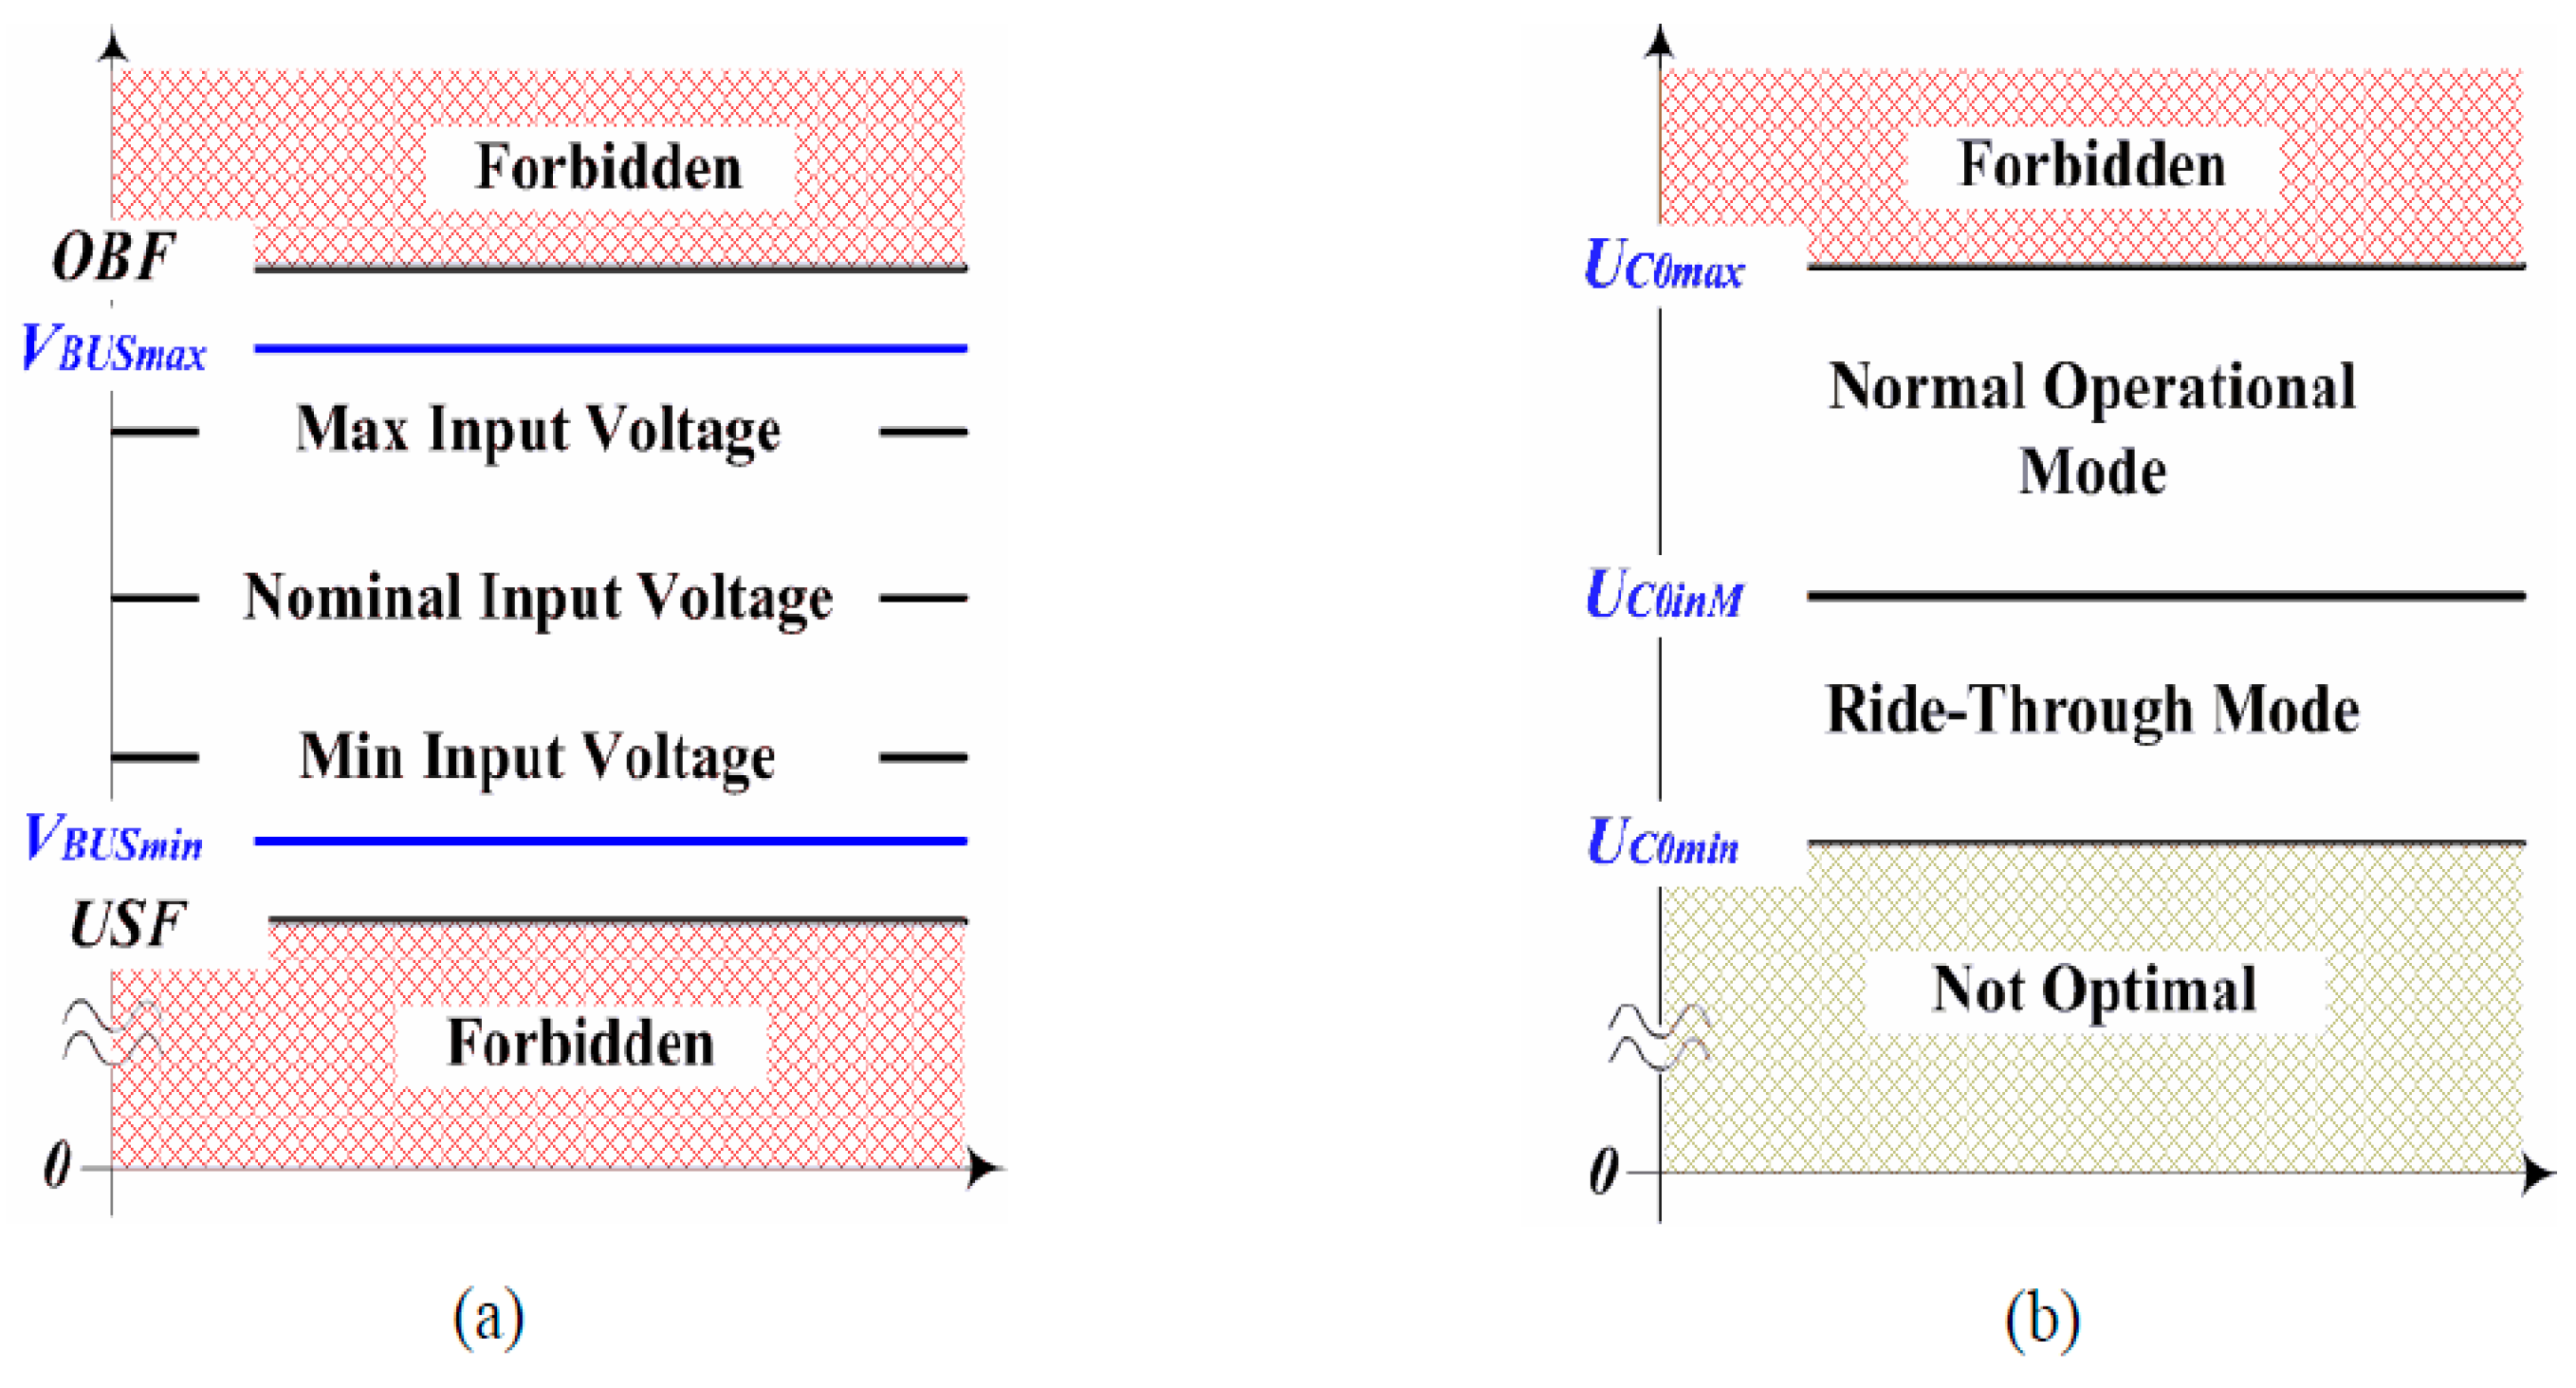
The buck-boost converter can be adjusted to keep the output voltage stable because of the varying duty cycle, which can be adjusted by a PWM generator through the internal feedback loop. Based on the required voltage for the motors in the STS cranes (460–470 V), the DC link voltage should be adjusted in such a way by some variations during receiving regenerative power from the load side (UC in charging mode in buck operation) and providing power to the loads (UC in discharging mode in boost operation), the DC link voltage must have upper and lower boundaries revealing the DC link working area.
In this regard, the VDC min and VDCmax are obtained by Equations (1) and (2) [36].
where Ma and Kr are the modulation index and coefficient for a three-phase bridge rectifier, respectively. As the UC voltage plays an outstanding role in power calculation, the upper and lower boundaries of the UC voltage must be declared based on Equations (3) and (4).
Figure 9 determines the boundary and limitation for the DC link voltage and UC bank. In this paper, Maxwell BMOD0063 P125 UC module is used for these goals with the rated capacitance 63 F, DC voltage 125 V, rated current 750 A, and maximum power 103.7 kW [37].
As the impact of this approach will increase with the increase in the number of cranes due to the maximum utilization of regenerative energy by other cranes for peak shaving, a strategy should be adopted to minimize both the peak power demand and the excess energy use in the operation of the group with a low number of STS cranes. The peak demand power levels for the dual-hoist STS crane in motoring and generating modes are 3909 kW and −3213 kW, respectively. To achieve the optimal number of UC modules, two different calculations in points of required energy and power is investigated.
4.1. UC Sizing Based on the Energy Production
In the next part, the UC sizing is performed in the required energy and operationg voltage points.
4.1.1. Capacitance Calculation Based on the Required Energy
The total amount of required capacitance is derived from the Equation (5):
Due to the nominal voltage of the UC module that is 125 V, hence the rated VDCmax, which is adjusted on 750 V, will be achieved by using six UC modules in series connection.
By six UCs in series connection, each branch equal capacitance (Cs) carried out in (7).
Consequently, the number of parallel branches which include six UCs (in series) and as a result, the total number of required UC are equal to.
4.1.2. Capacitance Calculation based on Voltage Operation Point
According to rate of energy for charging (ECH) and discharging (EDCH ) of the UC that are approximately equal to 9152 kW/cycle, the voltage of the UC working point is derived in (9).
According to operation point voltage, the total required capacitance is obtained from (10).
Due to each branch equal capacitance, 10.5 F, the number of parallel branches and the total number of required UCs are calculated by Equation (11) and the UC bank arrangements in terms of required energy is shown in Figure 10.
4.2. UC Sizing Based on the Required Power
As the UC voltage plays an outstanding role in the amount of produced power, the number of required UCs will vary dependently. In this regard, the amount of power produced by each UC module alters between its maximum and minimum boundaries that occur in the case of maximum voltage and minimum voltage, respectively.
4.2.1. PUC when the UC Voltage is Minimum (PUCmin)
According to Equation (12) [39], the amount of current that the UC module can produce depends on its state of charge (SOC). The equation is as follows:
In this regard, if the SOC > 50%, the generated current can be at the rated value, while for SOC of from 50% to 20%, the amount of current proportionately decreases with the SOC. Consequently, the SOC of all the UCs must remain above 50% in different conditions. Finally, the amount of generated power varies by the alteration of voltage because the current remains steady at the rated amount for SOC ≥ 50%. The produced power is derived from (13).
According to the minimum amount of power provided by each UC, that occurs in case of minimum voltage, the total number of UCs is obtained from above:
Due to the placement of six UCs in each branch to provide DC link maximum voltage (750 V), the total number of branches and as a result the total number of required UCs are calculated as follows:
4.2.2. PUC when the UC Voltage is Maximum (Pmax)
The upper limit of generated power is obtained in a case of rated voltage and current as follows:
As a result, the number of required UC is derived from (17).
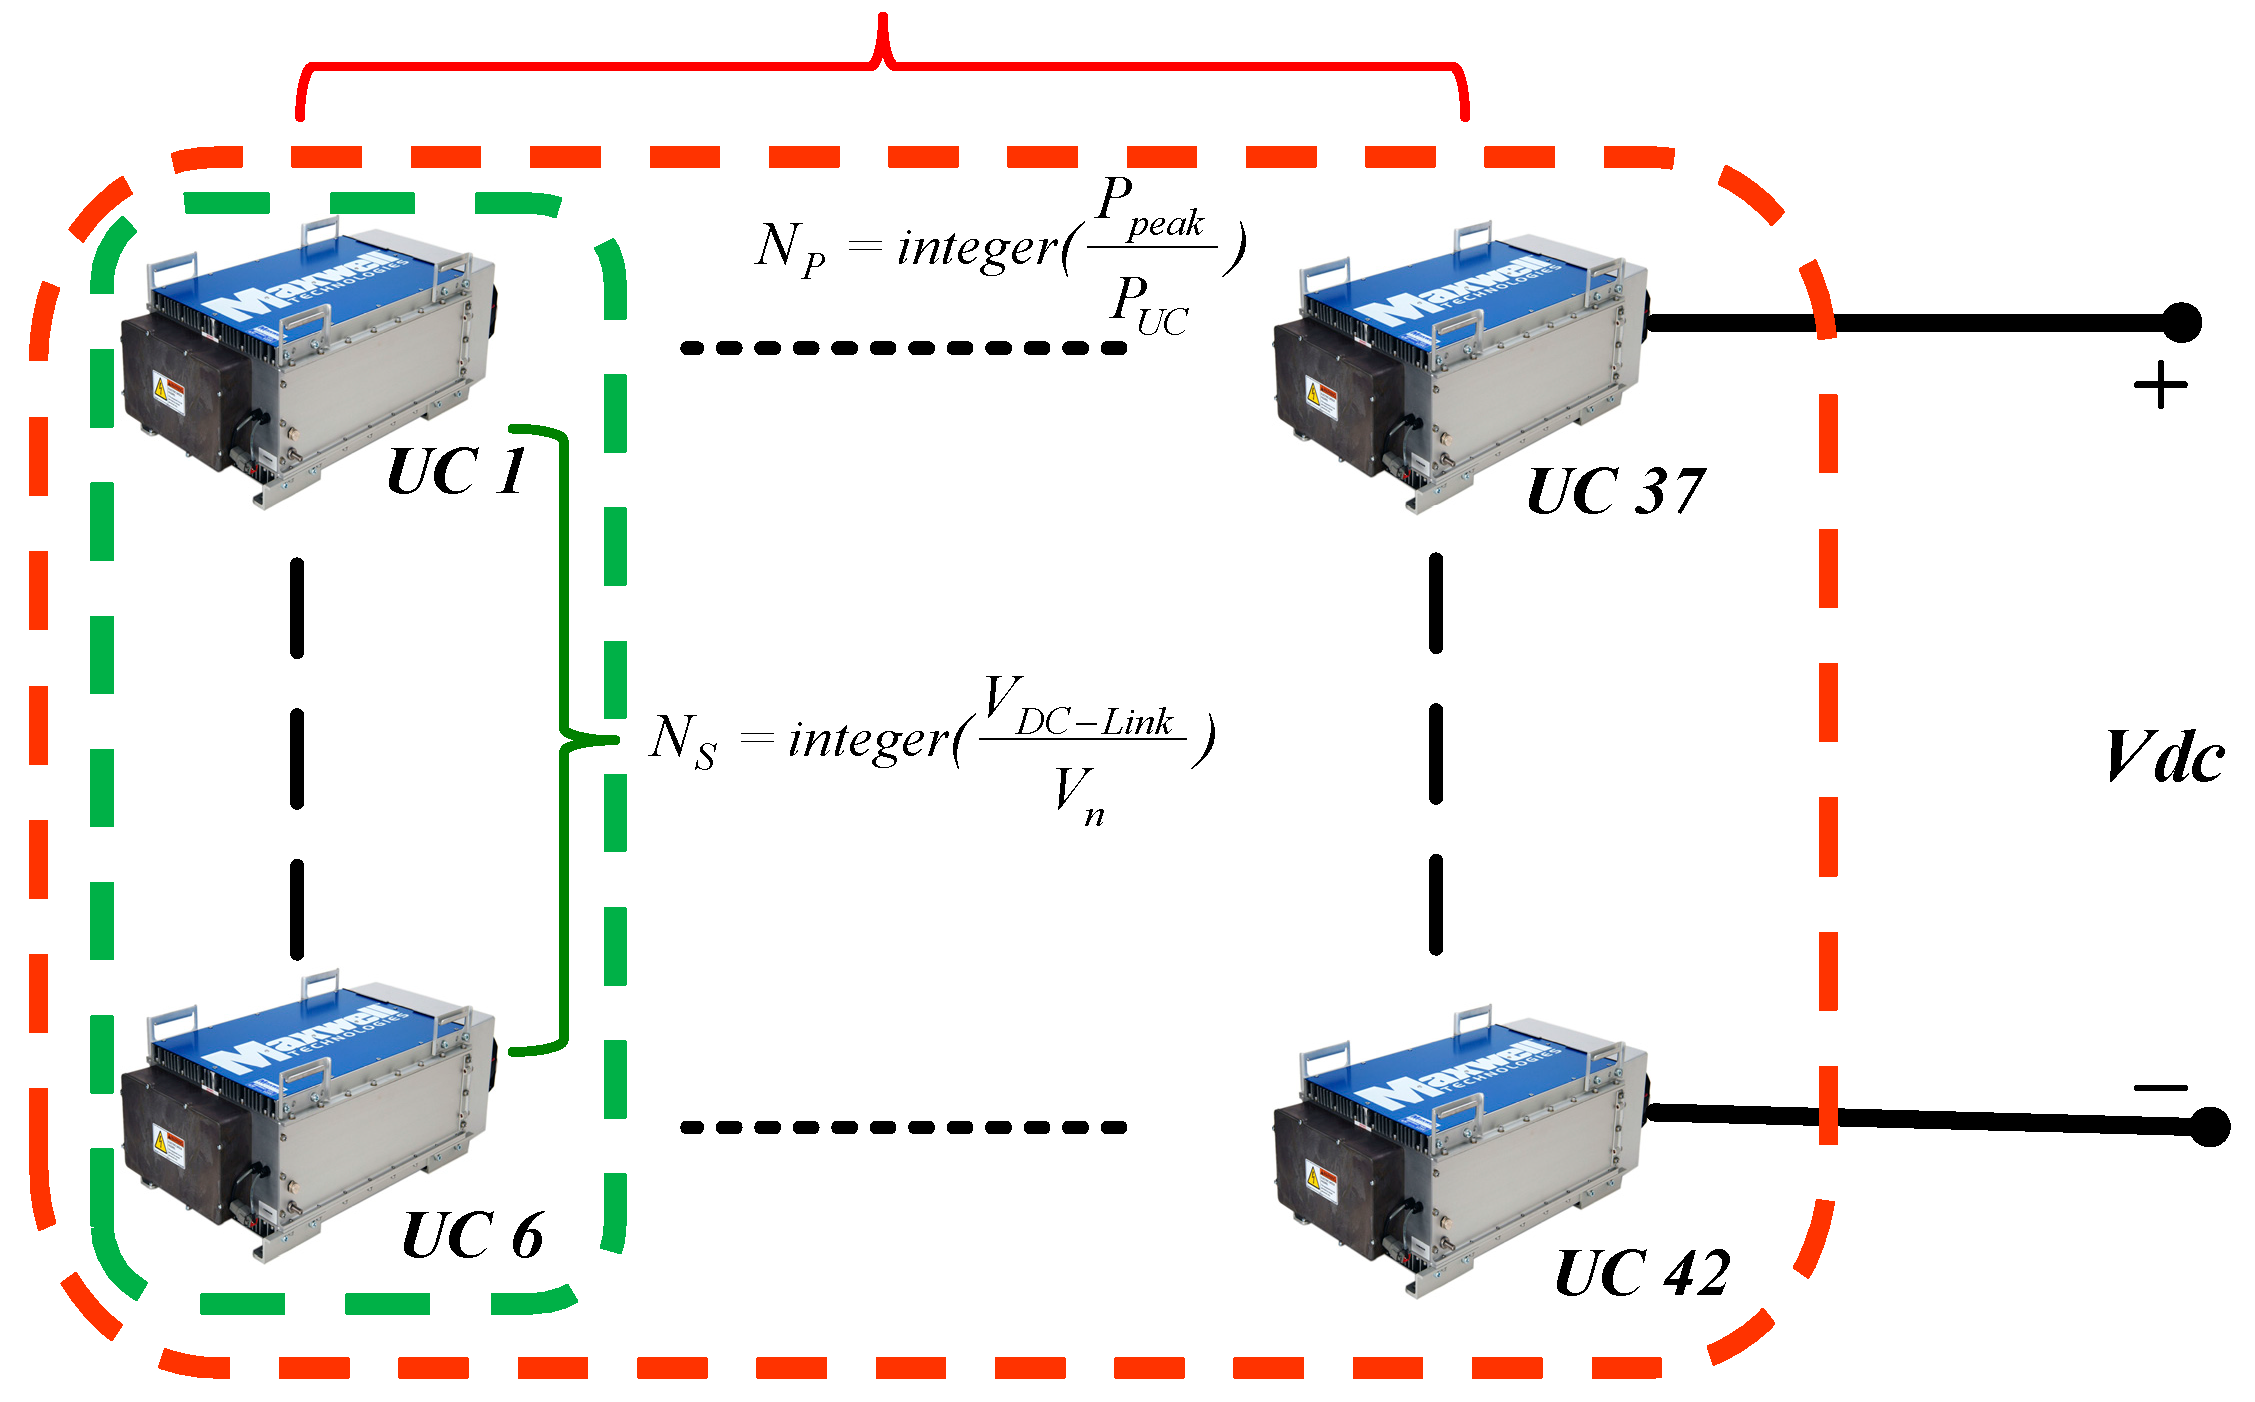
Considering six UC modules in each branch, the number of parallel branches and the total required UCs are equal to (18) and the UC bank arrangements in terms of required power is shown in Figure 11.
In order to increase the reliability of the system, the maximum value of the UC in point on energy and power evaluation should be selected, which carries out 42 UC modules in the Pmin scenario. In the next part, the cost-benefit analysis will be investigated.
5. Cost Benefits Analysis by UC Utilization
Peak shaving based on demand-side management and the integration of energy storage systems is the main step to reduce the cost of electricity, especially for industrial loads. For this goal in the STS crane, this paper considers a hierarchical control strategy to include all the modes. As the first solution, it can be done by coordinate cranes’ duty cycles for the STS crane installed in the same meter. This solution is made possible in a full automation CT. Hence, the UC sizing can decrease the local peak for each STS crane and then by duty cycle coordination for the group of STS cranes the general peak reduction has been done.
Cost Benefits for a Single STS Crane
To calculate the first invoice, Southern California Edison, the distribution operator, installs a meter at the beginning of the customer’s line, immediately before the point of delivery. The peak power recorded in a month is used to calculate “facilities demand”; the average power consumption is not involved in this calculation. The exposed cost of the energy is around 0.18 $/kWh in the USA, while the exposed cost of peak power demand is about 22 $/kW. According to Table 3, the amount of energy in motoring mode is about 91,512 kW in each cycle, of which any proportion of that can be used to reduce the energy needed to support peak values because the energy’s peak usually accounts for around 40% of the total electric bill per month in the US. In terms of financial issues, more peak power reduction causes more money-saving and cost-efficiency. In this regard, in the case of using 1% of the total available energy, the amount of obtained cost is about 20 k$ per month. Also, for 5%, 10%, and 20% energy usage, the amount of earned profit will be about 38 k$, 45 k$, and 53 k$, respectively.
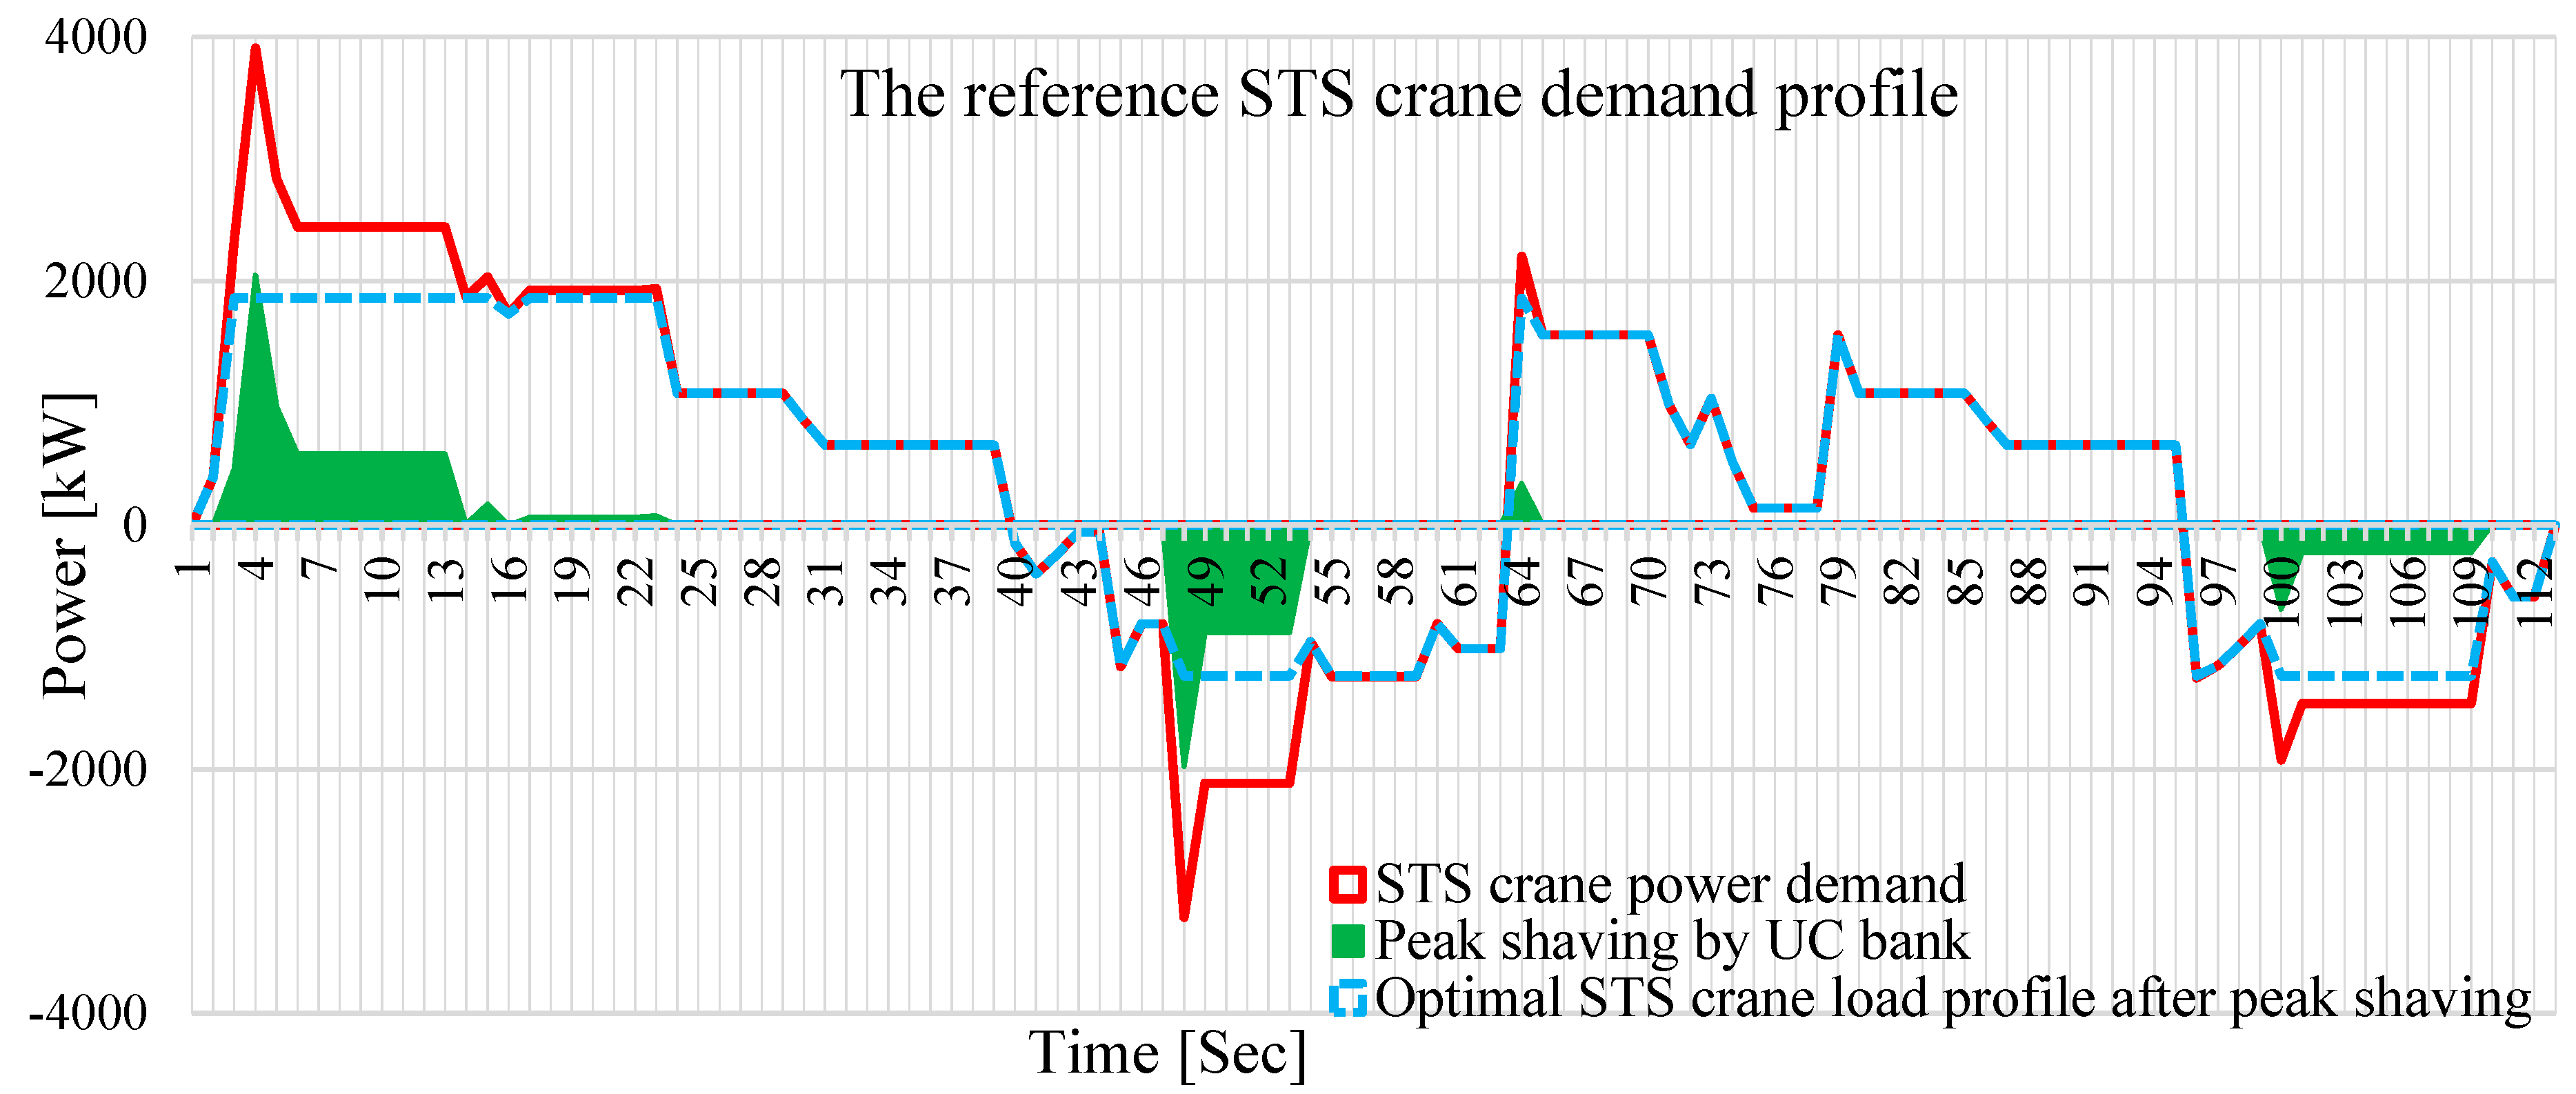
Table 4 shows the results for the different percentages of regenerative energy utilization in the generator operation of an STS crane. According to Table 4, the final result for the rate of energy that the UC bank should store is equal to 18.6% of the total regenerating energy, in the case of 10% peak shaving of the total demand power in motoring mode (Table 3). The calculations are as follows:
As can be observed in Figure 12, by the optimal UC bank sizing (from a technical and economic point of view), the power demand significantly dropped, as shown in blue. In Figure 12, the red curve is related to the conventional STS crane, the green one is the UC bank charging and discharging operation, and finally, the blue curve is the optimized load profile for the STS crane, and it has been considered as a new load profile for the next step, which will be crane’s duty cycle management.
6. Peak Shaving Optimization for the Group of STS Cranes
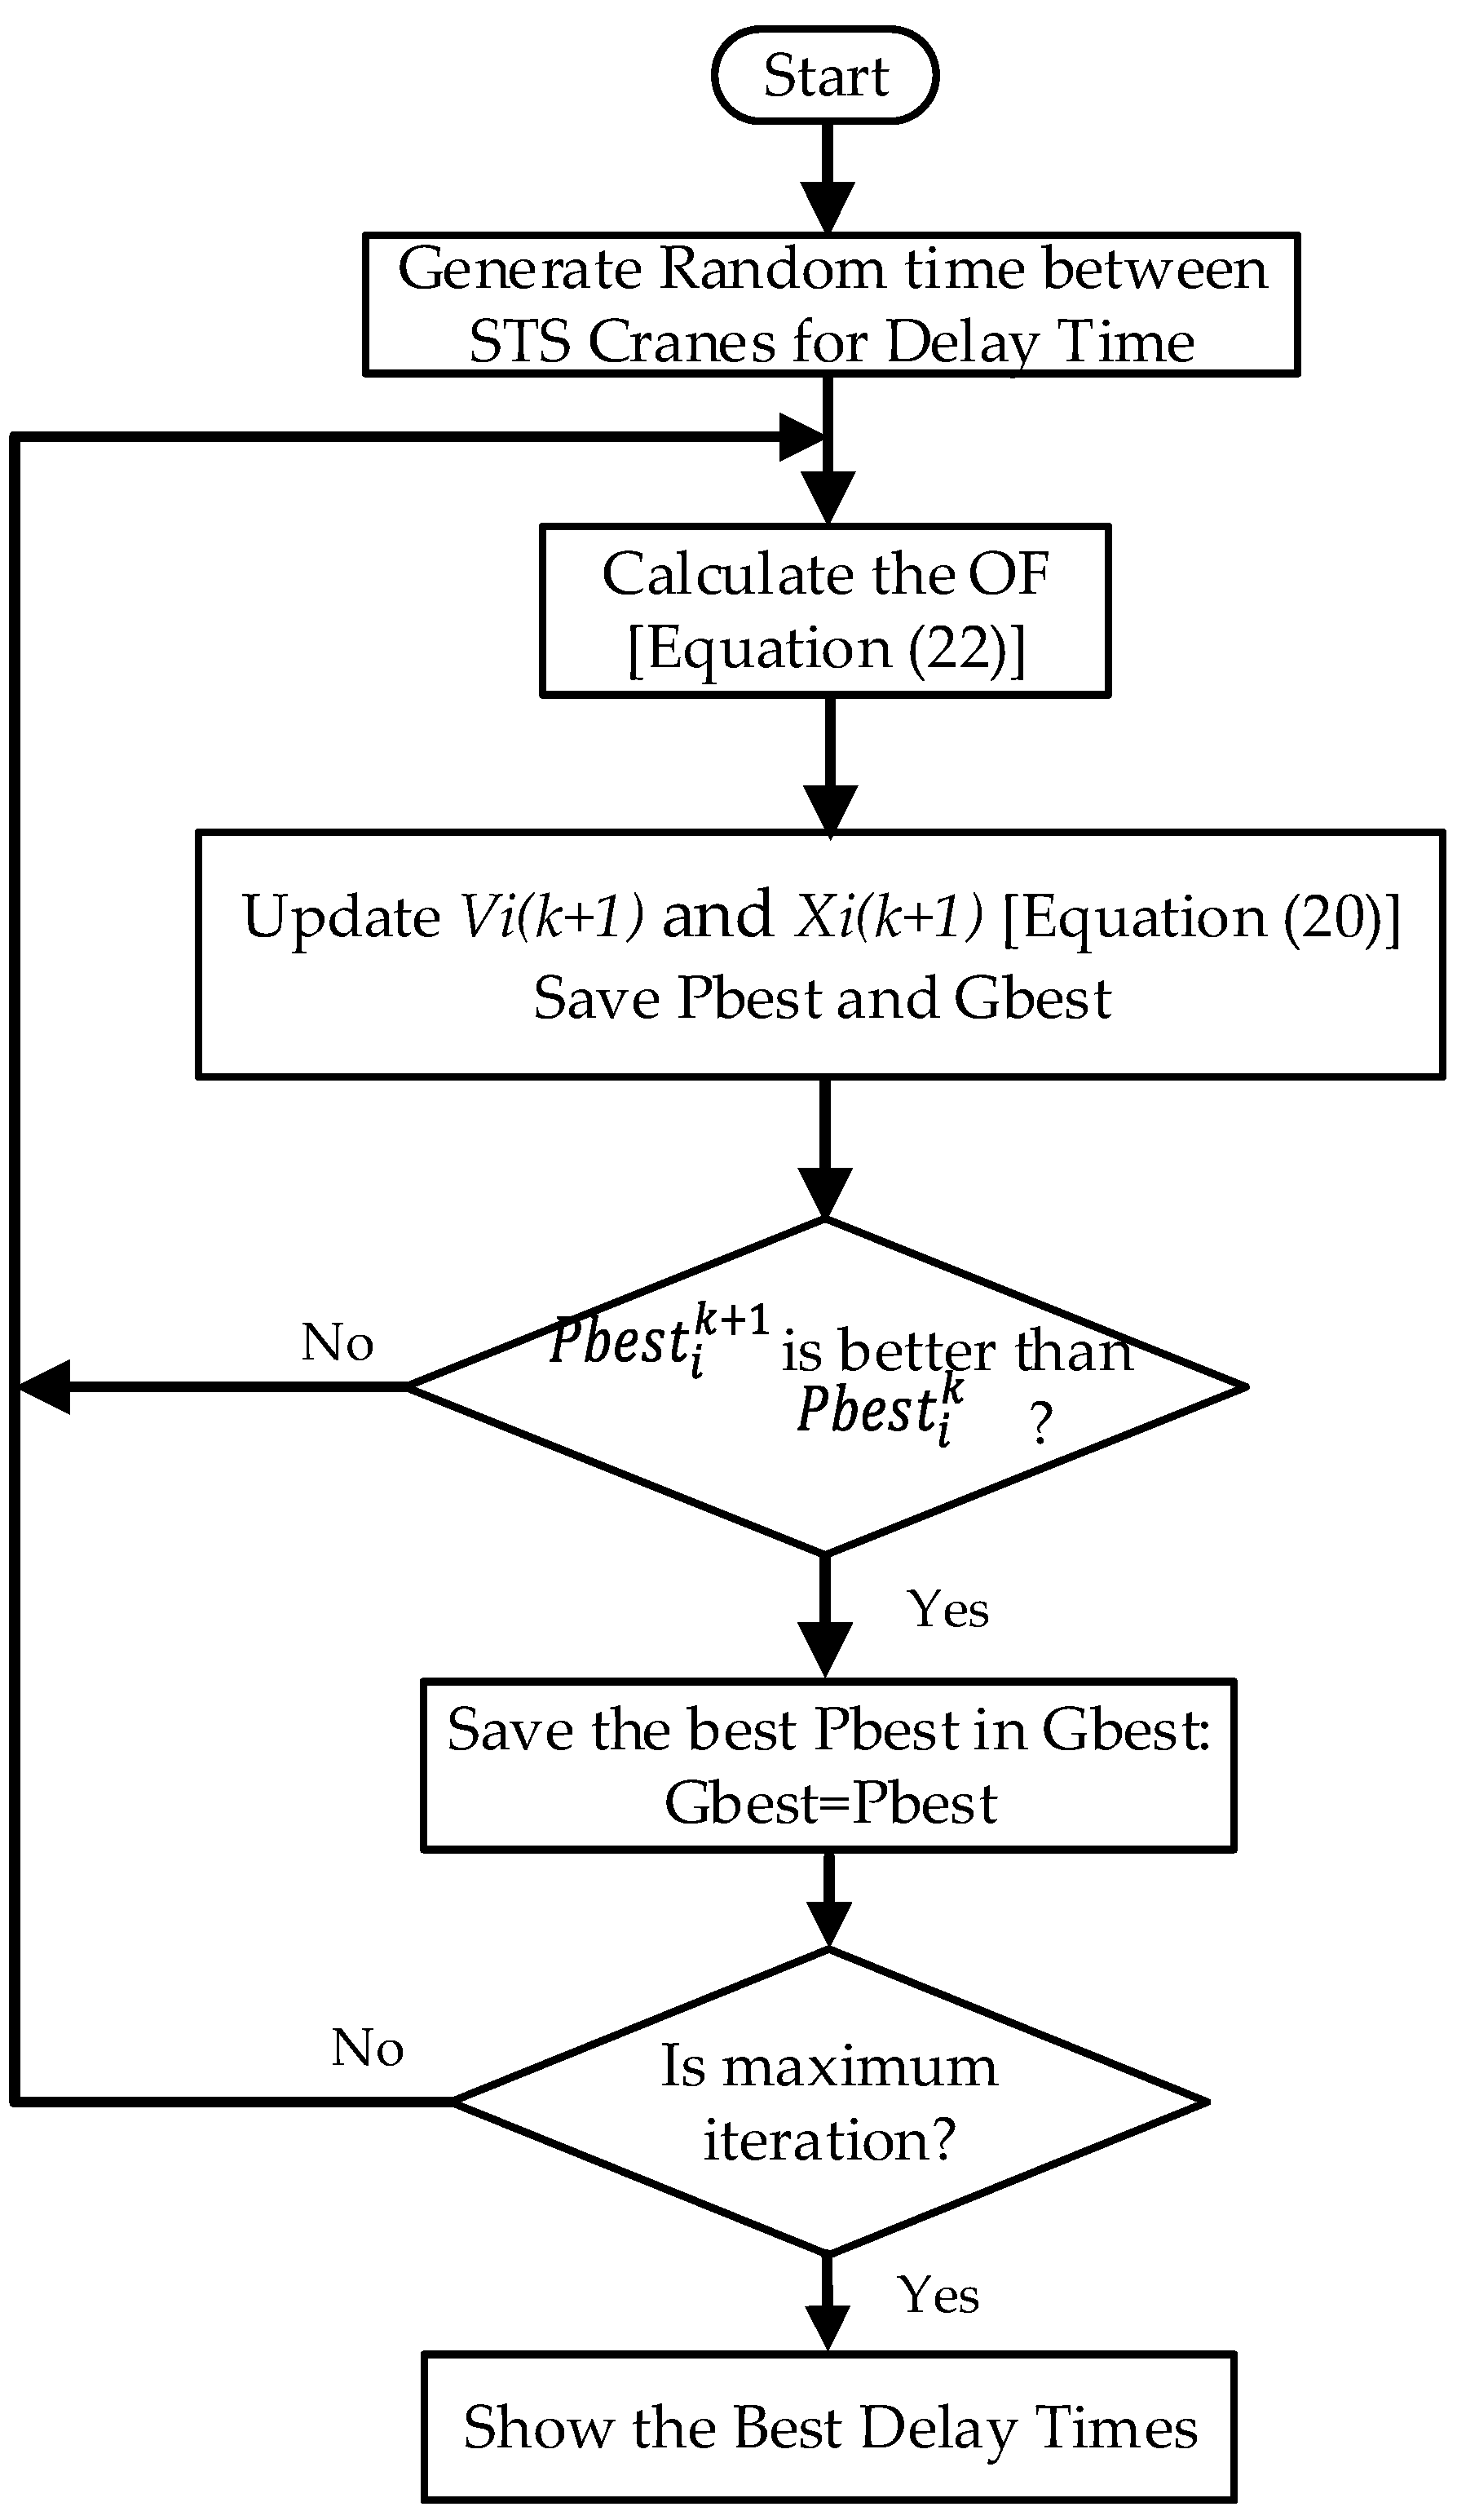
After UC sizing, to find the best delay times between STS cranes, the particle swarm optimization (PSO) algorithm was applied [40]. The PSO algorithm is a solution for optimization issues such as economic dispatch, control, and losses [41]. It is described as:
- 1.
- position (Xi) and velocity (Vi) vectors are randomly initialized with the problem dimensions. The position of each particle is based on Equation (20) based on the best particle search, the best overall band flight experience, and the velocity vector of its particle.where c1 and c2 are two positive constant integers, r1 and r2 are two random numbers with uniform distribution in the range [0~1] and w is the inertia, which is chosen as follows [20,21]:where itermax is the maximum number of repetitions, and iter is the number of repetitions.
- 2.
- Fitness of each Pbest particle is measured, and the particle that has the best Gbest fit is stored. Pbestik is the best position of the ith particle, which is based on the experience of the particle. Gbest is the best position of the particle, based on the group’s overall experience. Figure 13 shows the delay time management of the PSO flowchart for the STS crane group.
By the duty cycle management for the group of STS cranes, the normal and optimal load profile with the integration of the UC bank are the reference load profile. It is not common to use only one crane in maritime applications, but port managers used to take advantage of cranes as a group of a few ones. The minimum and the maximum number of STS cranes in the group in Pier E at POLB have been considered, respectively, as five and 10. Consequently, financial calculations are accomplished in a case of using a group of cranes. Table 5 represents the Pmax in different scenarios.
Although each crane has a peak power of 4 MW and it is predicted that the system experiences 20 MW as a peak power of a five-crane group, in normal operation the peak power level is about 10 and 14 MW for using five and 10 cranes, respectively. In addition, the system with the only DSM strategy and UC along with DSM strategy scenarios result in almost 5880 kW and 4222 kW of peak power, in a case of using five cranes. Table 6 shows the peak factor rate (P^F), which has been determined with Equation (22):
where C is a vector of optimization variables and n is the number of cranes, OF is the objective function, Pmax and Pave are the maximum and the average power of the STS cranes in each iteration in MW, and finally, P^F is the peak factor rate (P^F = Pmax/Pave).
Table 7 is related to the peak shaving percentage (%P^S), which is determined with Equation (23). Peak load shaving is a process that aims to flatten the load curve. Due to the available strategies for load peak shaving, DSM and integration of energy storage technology have been applied for peak reduction in this paper.
Table 8 shows the advantages and disadvantages of using DSM and UC methods from the port authorization point of view. The DSM method has a simple implementation, resulting in cost reduction, while the UC method provides flexible and efficient operation in comparison with the former method
Figure 14 provides an overall scheme of hierarchical STS load reduction which is applied in three different stages. First, local peak shaving is accomplished by using UC for each STS crane. In the second stage, between two STS crane groups, the general peak shaving is carried out by considering a duty cycle recognizing a specific working period for each crane. In the last stage, a flywheel energy storage system (FESS) is used in a common bus between two STS crane groups to fulfill load leveling.
7. Cost Evaluation
Financial issues, such as payback duration and total imposed costs, remain one of the most outstanding factors in the initial designing and evaluating the systems. As mentioned before, cost analysis must be carried out in a case of using a few in a group because it is common to select from 5 to 10 cranes as a group in maritime affairs rather than using a single crane. Payback duration will be calculated according to DC/DC cost, which is about 60 k$, and UC module, cost which is 5 k$, and due to using 42 UCs for each crane. As five cranes are used, the initial cost is obtained as being 1350 k$ for each crane.
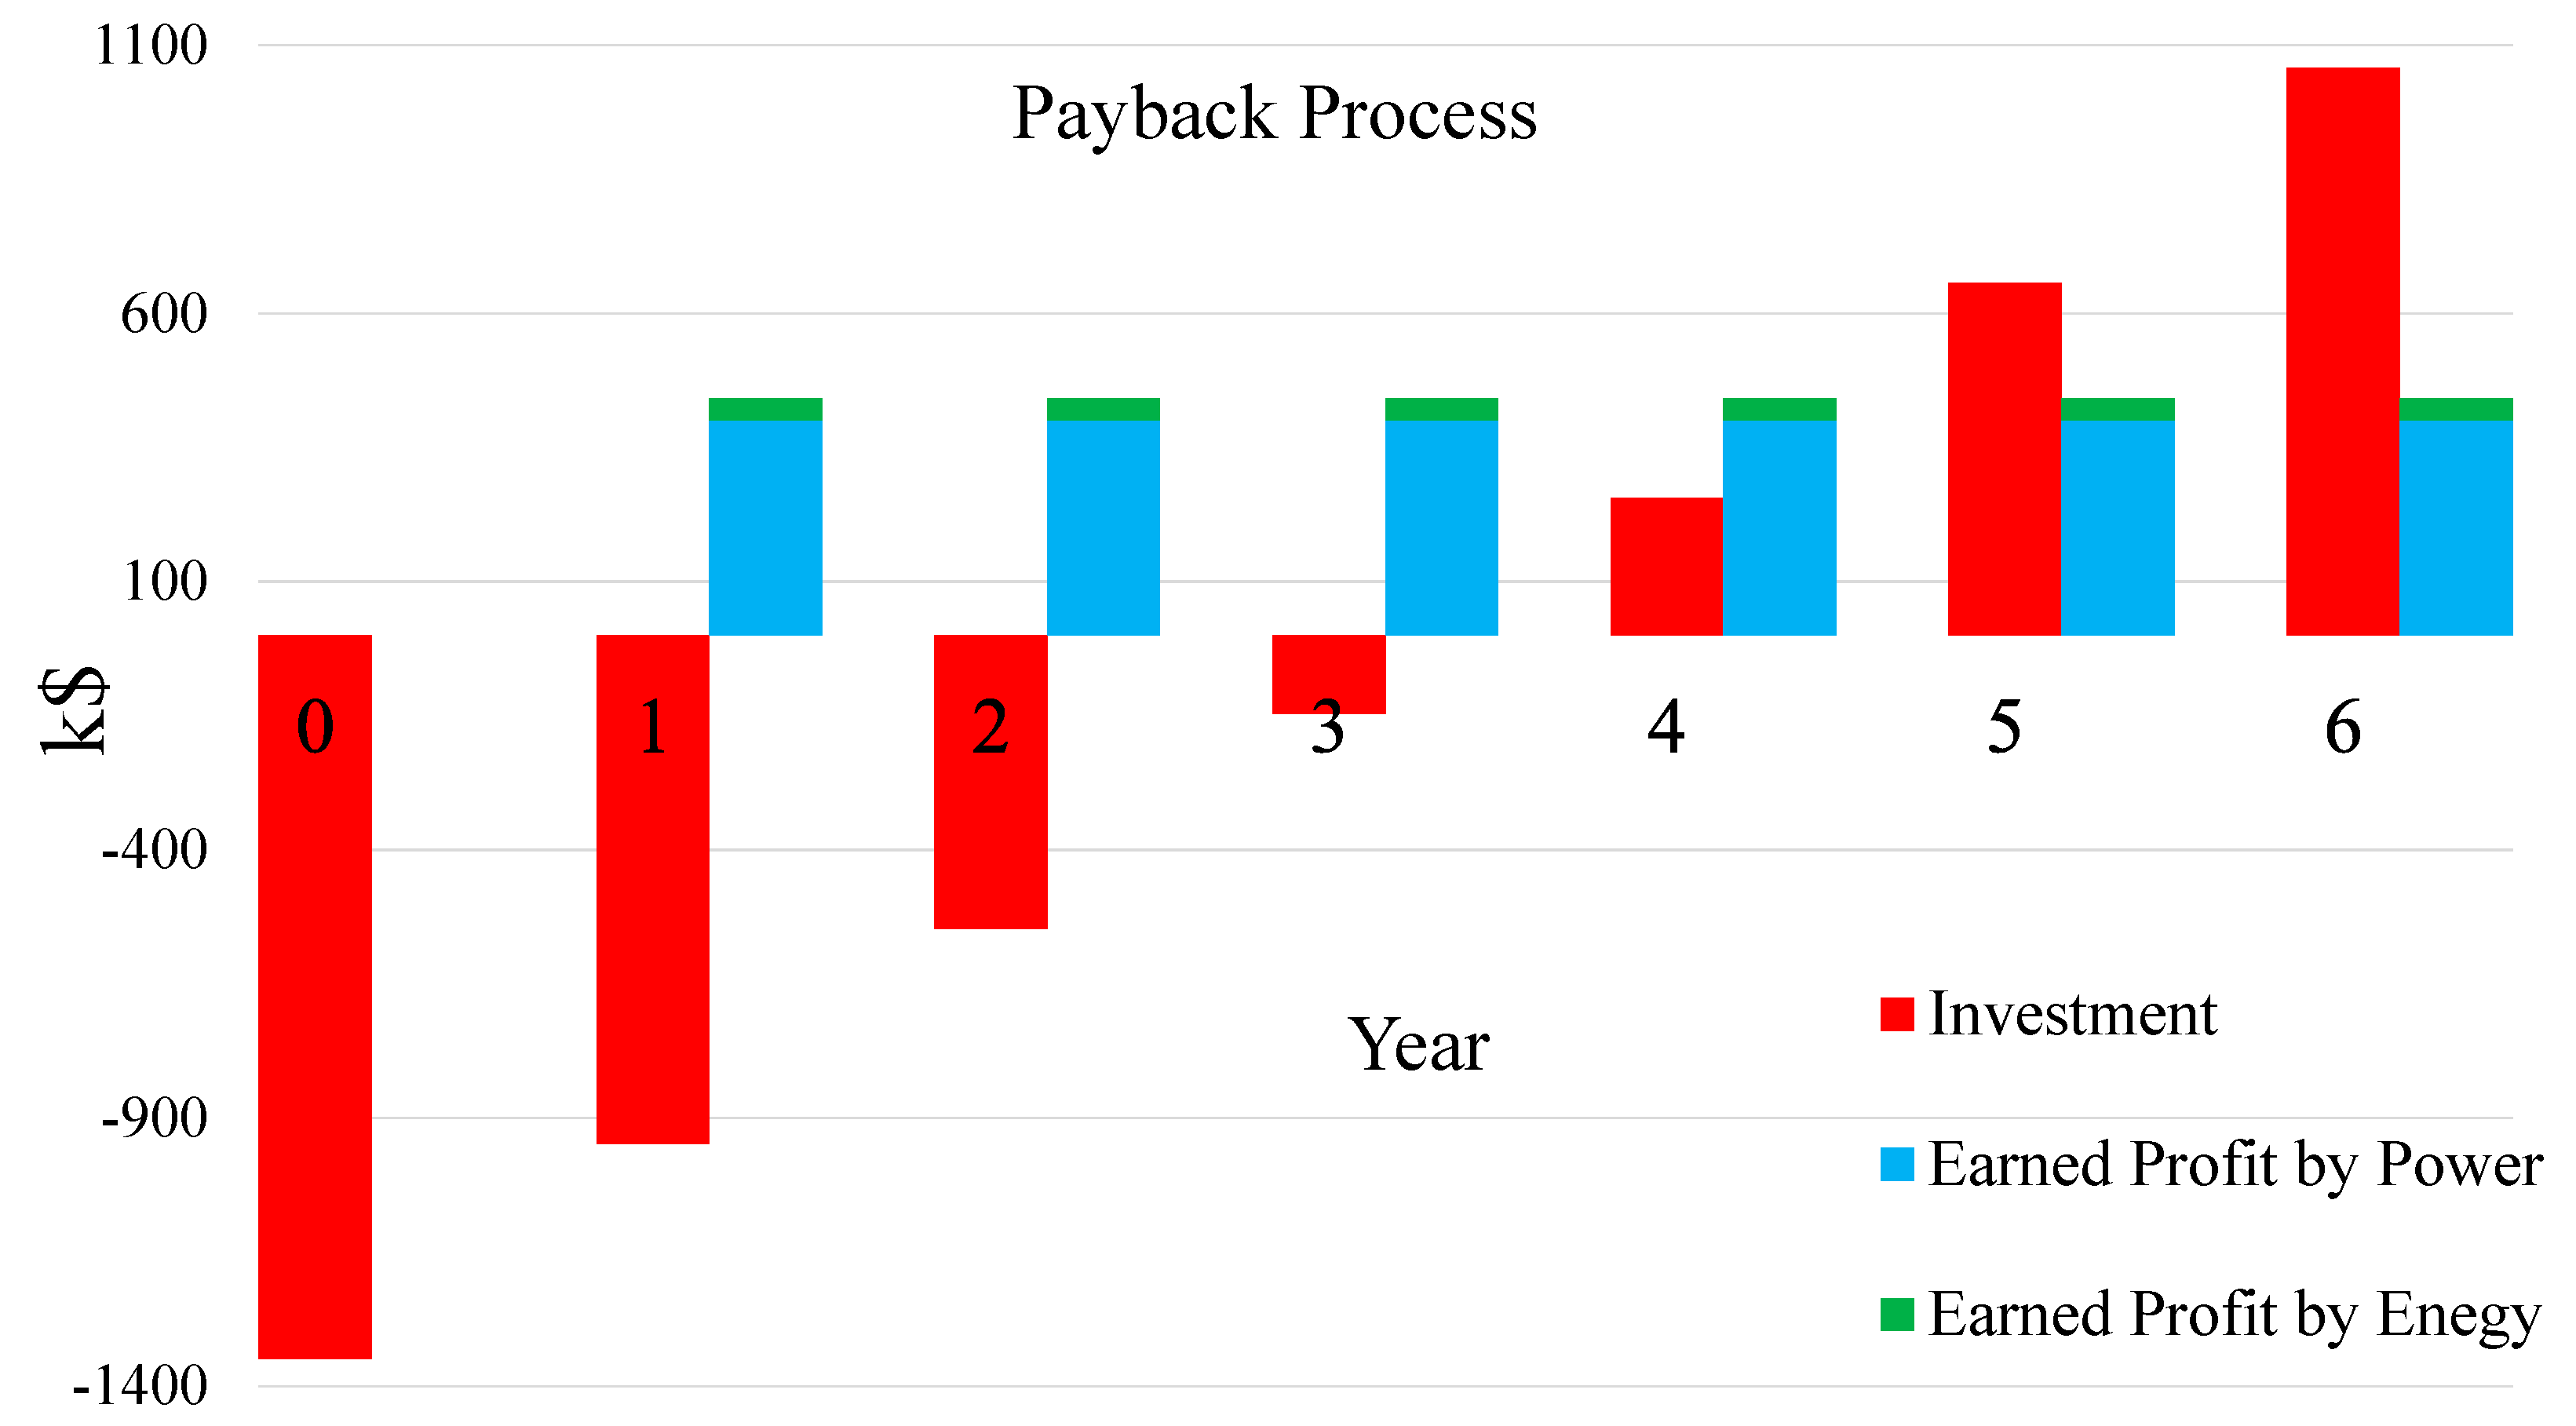
According to Table 5, the amount of peak shaving which is accomplished by five STS cranes and by using both the UC and DSM scenarios is about 6078 kW, while this amount is almost 4420 kW for using the DSM strategy alone. According to the fact that DSM scenario cost is negligible is and the earned profit must be calculated by a comparison between DSM only and UC along with DSM scenarios. Based on the tariff of imposed cost by peak power, which is 22 $/kW, the amount of earned profit is about 37 k$ for a single month by using both the UC and DSM strategies. Due to a one-month maintenance period, the total crane operating duration is considered as 11 months, and the annual earned profit is almost 401 k$ and the initial investment will be paid back after three years and half. As shown in Figure 15, Pier E will start to profit from the fourth year.
8. Conclusions
The present paper studied the techno-economic possibility of ultracapacitor (UCs) energy storage sizing in the ship to shore (STS) cranes at a container terminal (CT) port. The goal is to reduce the peak power absorbed by UC sizing. Hence, by hierarchical control, first based on a DSM strategy using the PSO algorithm along with UC sizing in the DC link for a group of STS cranes, and second by DSM strategy for each STS crane group, that goal is acheived. The proposed solution in a technical point of view has high efficiency even in temporary conditions, short term payback and suitable and efficient operation. In this regard, payback is obtained in four years. In this regard, the initial investment will be paid back before the end of the fourth year and from the fifth year onward, the investment will be profitable.
Author Contributions
Investigation, writing, review, and edit M.K.; supervision, G.P. and L.M.; project administration, B.C. All authors have read and agreed to the published version of the manuscript.
Funding
This research received no external funding.
Conflicts of Interest
The authors declare no conflict of interest.
Nomenclature
| Pave | Average Power | |
| Pmax | Maximum Power | |
| P^F | Peak Factor | |
| P^S | Peak Shaving | |
| Abbreviations | ||
| CT | Container Terminals | |
| DC | Duty Cycle | |
| DSM | Demand Side Management | |
| ED | Energy Demand | |
| ER | Energy Regeneration | |
| FESS | Flywheel Energy Storage System | |
| OF | Objective Function | |
| PSO | Particle Swarm Optimization | |
| POLB | Port of Long Beach | |
| PTS | Platform to shore sub-crane. | |
| STP | Ship to Platform sub-crane. | |
| STS | Ship to Shore | |
| TEU | Twenty-foot Equivalent Units | |
References
- Parise, G.; Honorati, A.; Parise, L.; Martirano, L. Near zero energy load systems: The special case of port cranes. In Proceedings of the 2015 IEEE/IAS 51st Industrial & Commercial Power Systems Technical Conference (I&CPS), Calgary, AB, Canada, 5–8 May 2015; pp. 1–6. [Google Scholar]
- Parise, G.; Parise, L.; Martirano, L.; Ben Chavdarian, P.; Su, C.L.; Ferrante, A. Wise port and business energy management: Port facilities, electrical power distribution. IEEE Trans. Ind. Appl. 2016, 52, 18–24. [Google Scholar] [CrossRef]
- Homepage—Port of Long Beach. Available online: https://www.polb.com/ (accessed on 27 March 2020).
- Port Statistics—Port of Long Beach. Available online: https://www.polb.com/business/port-statistics/#latest-statistics (accessed on 27 March 2020).
- Wang, W.; Peng, Y.; Li, X.; Qi, Q.; Feng, P.; Zhang, Y. A two-stage framework for the optimal design of a hybrid renewable energy system for port application. Ocean Eng. 2019, 191, 106555. [Google Scholar] [CrossRef]
- Al-Falahi, M.D.A.; Tarasiuk, T.; Jayasinghe, S.G.; Jin, Z.; Enshaei, H.; Guerrero, J.M. Ac ship microgrids: Control and power management optimization. Energies 2018, 11, 1458. [Google Scholar] [CrossRef] [Green Version]
- Fang, S.; Wang, Y.; Gou, B.; Xu, Y. Toward Future Green Maritime Transportation: An Overview of Seaport Microgrids and All-Electric Ships. IEEE Trans. Veh. Technol. 2020, 69, 207–219. [Google Scholar] [CrossRef]
- Parise, G.; Parise, L.; Malerba, A.; Pepe, F.M.; Honorati, A.; Chavdarian, P. Ben Comprehensive Peak-Shaving Solutions for Port Cranes. IEEE Trans. Ind. Appl. 2017, 53, 1799–1806. [Google Scholar] [CrossRef]
- Kermani, M.; Parise, G.; Martirano, L.; Parise, L.; Chavdarian, B. Optimization of Peak Load Shaving in STS Group Cranes Based on PSO Algorithm. In Proceedings of the 2018 IEEE International Conference on Environment and Electrical Engineering and 2018 IEEE Industrial and Commercial Power Systems Europe (EEEIC / I&CPS Europe), Palermo, Italy, 12–15 June 2018; pp. 1–5. [Google Scholar]
- Kermani, M.; Parise, G.; Martirano, L.; Parise, L.; Chavdarian, B. Power balancing in STS group cranes with flywheel energy storage based on DSM strategy. In Proceedings of the 2018 IEEE 59th International Scientific Conference on Power and Electrical Engineering of Riga Technical University (RTUCON), Riga, Latvia, 12–13 November 2018; pp. 1–5. [Google Scholar]
- Kermani, M.; Parise, G.; Martirano, L.; Parise, L.; Chavdarian, B.; Su, C.L. Optimization of Energy Consumption in STS Group Cranes by Using Hybrid Energy Storage Systems Based on PSO Algorithm. In Proceedings of the 2019 IEEE Industry Applications Society Annual Meeting, Baltimore, MD, USA, 29 September–3 October 2019; pp. 1–5. [Google Scholar]
- Chang, L.; Zhang, W.; Xu, S.; Spence, K. Review on Distributed Energy Storage Systems for Utility Applications. CPSS Trans. POWER Electron. Appl. 2017, 2, 267–276. [Google Scholar] [CrossRef]
- Guerrero, M.A.; Romero, E.; Barrero, F.; Milanes, M.; Gonzalez, E. Supercapacitors: Alternative Energy Storage Systems. Power Electron. Electr. Syst. 2009, 85, 188–195. [Google Scholar]
- Grbovi´c, P.J. Ultra-Capacitors in Power Conversion Systems; John Wiley & Sons: Hoboken, NJ, USA, 2014; ISBN 9781118356265. [Google Scholar]
- Grbović, P.J.; Delarue, P.; Le Moigne, P.; Bartholomeus, P. The ultracapacitor-based controlled electric drives with braking and ride-through capability: Overview and analysis. IEEE Trans. Ind. Electron. 2011, 58, 925–936. [Google Scholar] [CrossRef]
- Grbović, P.J.; Delarue, P.; Le Moigne, P.; Bartholomeus, P. A three-terminal ultracapacitor-based energy storage and PFC device for regenerative controlled electric drives. IEEE Trans. Ind. Electron. 2012, 59, 301–316. [Google Scholar] [CrossRef]
- Bolonne, S.R.A.; Chandima, D.P. Sizing an energy system for hybrid li-ion battery-supercapacitor RTG cranes based on state machine energy controller. IEEE Access 2019, 7, 71209–71220. [Google Scholar] [CrossRef]
- Niu, W.; Huang, X.; Yuan, F.; Schofield, N.; Xu, L.; Chu, J.; Gu, W. Sizing of Energy System of a Hybrid Lithium Battery RTG Crane. IEEE Trans. Power Electron. 2017, 32, 7837–7844. [Google Scholar] [CrossRef]
- Zhao, N.; Schofield, N.; Niu, W. Energy storage system for a port crane hybrid power-train. IEEE Trans. Transp. Electrif. 2016, 2, 480–492. [Google Scholar] [CrossRef]
- Iannuzzi, D.; Piegari, L.; Tricoli, P. Use of supercapacitors for energy saving in overhead travelling crane drives. In Proceedings of the 2009 International Conference on Clean Electrical Power, Capri, Italy, 9–11 June 2009; pp. 562–568. [Google Scholar]
- Chen, D.; Niu, W.; Gu, W.; Schofield, N. Game-based energy management method for hybrid RTG cranes. Energies 2019, 12, 3589. [Google Scholar] [CrossRef] [Green Version]
- Dotelli, G.; Ferrero, R.; Gallo Stampino, P.; Latorrata, S.; Toscani, S. Supercapacitor Sizing for Fast Power Dips in a Hybrid Supercapacitor-PEM Fuel Cell System. IEEE Trans. Instrum. Meas. 2016, 65, 2196–2203. [Google Scholar] [CrossRef] [Green Version]
- Dimitra Tragianni, S.; Oureilidis, K.O.; Demoulias, C.S. Supercapacitor sizing based on comparative study of PV power smoothing methods. In Proceedings of the 2017 52nd International Universities Power Engineering Conference (UPEC), Heraklion, Greece, 28–31 August 2017; pp. 1–6. [Google Scholar]
- Babazadeh, H.; Gao, W.; Lin, J.; Cheng, L. Sizing of battery and supercapacitor in a hybrid energy storage system for wind turbines. In Proceedings of the PES T&D 2012, Orlando, FL, USA, 7–10 May 2012; pp. 1–7. [Google Scholar]
- Di Napoli, A.; Ndokaj, A. Ultracapacitor storage for a 50t capacity gantry crane. In Proceedings of the 2012 XXth International Conference on Electrical Machines, Marseille, France, 2–5 September 2012; pp. 2014–2018. [Google Scholar]
- Ndokaj, A.; Di Napoli, A.; Pede, G.; Pasquali, M. Regulation strategy of an Ultracapacitor storage model for a gantry crane. In Proceedings of the IECON 2013—39th Annual Conference of the IEEE Industrial Electronics Society, Vienna, Austria, 10–13 November 2013; pp. 1209–1216. [Google Scholar]
- Wu, Y.; Mi, W.J.; Tang, T.H. The design of the super capacitor group used in heavy gantry portal cranes. In Proceedings of the 2011 IEEE Power Engineering and Automation Conference, Wuhan, China, 8–9 September 2011; pp. 96–99. [Google Scholar]
- Li, T.; Huang, L.; Liu, H. Energy management and economic analysis for a fuel cell supercapacitor excavator. Energy 2019, 172, 840–851. [Google Scholar] [CrossRef]
- Snoussi, J.; Ben Elghali, S.; Mimouni, M.F. Sizing and Control of Onboard Multisource Power System for Electric Vehicle. In Proceedings of the 2019 19th International Conference on Sciences and Techniques of Automatic Control and Computer Engineering (STA), Sousse, Tunisia, 24–26 March 2019; pp. 347–352. [Google Scholar]
- Sirmelis, U.; Zakis, J.; Grigans, L. Optimal supercapacitor energy storage system sizing for traction substations. In Proceedings of the 2015 IEEE 5th International Conference on Power Engineering, Energy and Electrical Drives (POWERENG), Riga, Latvia, 11–13 May 2015; pp. 592–595. [Google Scholar]
- Hijazi, A.; Bideaux, E.; Venet, P.; Clerc, G. Electro-thermal sizing of supercapacitor stack for an electrical bus: Bond graph approach. In Proceedings of the 2015 Tenth International Conference on Ecological Vehicles and Renewable Energies (EVER), Monte Carlo, Monaco, 31 March–2 April 2015; pp. 1–8. [Google Scholar]
- Araújo, R.E.; De Castro, R.; Pinto, C.; Melo, P.; Freitas, D. Combined sizing and energy management in EVs with batteries and supercapacitors. IEEE Trans. Veh. Technol. 2014, 63, 3062–3076. [Google Scholar] [CrossRef] [Green Version]
- Kalesar, B.M.; Noshahr, J.B.; Kermani, M.; Bavandsavadkoohi, H.; Ahbab, F. Effect of Angles of Harmonic Components of Back to Back Converter of Distributed Generation Resources on Current Behavior of Distribution Networks. In Proceedings of the 2018 IEEE International Conference on Environment and Electrical Engineering and 2018 IEEE Industrial and Commercial Power Systems Europe (EEEIC / I&CPS Europe), Palermo, Italy, 12–15 June 2018; pp. 1–4. [Google Scholar]
- Kim, S.M.; Sul, S.K. Control of rubber tyred gantry crane with energy storage based on supercapacitor bank. IEEE Trans. Power Electron. 2006, 21, 1420–1427. [Google Scholar] [CrossRef]
- Kermani, M.; Parise, G.; Martirano, L.; Parise, L.; Chavdarian, B. Utilization of Regenerative Energy by Ultracapacitor Sizing for Peak Shaving in STS Crane. In Proceedings of the 2019 IEEE International Conference on Environment and Electrical Engineering and 2019 IEEE Industrial and Commercial Power Systems Europe (EEEIC / I&CPS Europe), Genova, Italy, 11–14 June 2019. [Google Scholar]
- Plotnikov, I.; Braslavsky, I.Y.; Yeltsin, B.N.; Ishmatov, Z. About using the frequency-controlled electric drives with supercapacitors in the hoisting applications. In Proceedings of the 2015 International Siberian Conference on Control and Communications (SIBCON), Omsk, Russia, 21–23 May 2015; pp. 1–9. [Google Scholar]
- Maxwell Technologies. 125 V Heavy Transportation Supercapacitor Module Datasheet; Maxwell Technologies: San Diego, CA, USA, 2019. [Google Scholar]
- Grbovic, P.J.; Delarue, P.; Le Moigne, P. Selection and design of ultra-capacitor modules for power conversion applications: From theory to practice. In Proceedings of the 7th International Power Electronics and Motion Control Conference, Harbin, China, 2–5 June 2012; pp. 771–777. [Google Scholar]
- Corral-Vega, P.J.; García-Triviño, P.; Fernández-Ramírez, L.M. Design, modelling, control and techno-economic evaluation of a fuel cell/supercapacitors powered container crane. Energy 2019, 186, 115863. [Google Scholar] [CrossRef]
- Eberhart, R.; Kennedy, J. New optimizer using particle swarm theory. In Proceedings of the Sixth International Symposium on Micro Machine and Human Science, Nagoya, Japan, 4–6 October 1995; pp. 39–43. [Google Scholar]
- Cristian, D.; Barbulescu, C.; Kilyeni, S.; Popescu, V. Particle swarm optimization techniques. Power systems applications. In Proceedings of the 2013 6th International Conference on Human System Interactions (HSI), Nagoya, Japan, 4–6 October 1995; pp. 312–319. [Google Scholar]
Figure 1.
Flow diagram of a container terminal operation.

Figure 2.
Container trades in TEUs.

Figure 3.
Future plan for Energy Island at POLB.

Figure 4.
One-line diagram for STS cranes Power Supply.

Figure 5.
STS Crane scheme and reference speed.

Figure 6.
The reference load profile for the different part in an STS crane ( Dual Hoist operation).
Figure 6.
The reference load profile for the different part in an STS crane ( Dual Hoist operation).

Figure 7.
A qualitative comparison between an ultracapacitor, battery, and flywheel.

Figure 8.
Ultracapacitor (UC) bank location in the dual hoist STS crane via the bidirectional DC/DC converter [35].
Figure 8.
Ultracapacitor (UC) bank location in the dual hoist STS crane via the bidirectional DC/DC converter [35].

Figure 9.
The boundary and limitation for the DC link voltage (a) and UC bank (b) [38].
Figure 9.
The boundary and limitation for the DC link voltage (a) and UC bank (b) [38].

Figure 10.
UC bank sizing in terms of required energy.

Figure 11.
UC bank sizing based on the required power.

Figure 12.
The shaved peak by UC bank to achieve the optimal power profile for the STS crane in kW.

Figure 13.
Particle swarm optimization (PSO) flowchart for power demand optimization in the STS crane group.
Figure 13.
Particle swarm optimization (PSO) flowchart for power demand optimization in the STS crane group.

Figure 14.
Hierarchical control of for peak load shaving in STS crane group.

Figure 15.
Payback process based on annual earning for the 5-STS crane group.


Table 1.
The ship to shore (STS) crane’s speed and time.
| Considered Peration | Meter | Time (s) Load | Time (s) No Load |
|---|---|---|---|
| STP hoist | 24.38 | 20.08 | 12.38 |
| STP Trolley | 64.01 | 25.84 | 25.84 |
| STP Lowering | 18.29 | 15.50 | 10.10 |
| PTS Hoist | 9.75 | 6.63 | 6.86 |
| PTS Trolley | 29.72 | 12.99 | 12.99 |
| PTS to AGV | 18.29 | 13.94 | 10.02 |
Table 2.
Energy storage comparison [12].
Table 2.
Energy storage comparison [12].
| Storage | Specific Power (W/kg) | Specific Energy (Wh/kg) | Response Time | Efficiency |
|---|---|---|---|---|
| UC | 500–10000 | 0.05–15 | Milliseconds | >95% |
| BESS | <500 | 50–200 | Seconds | 60%–80% |
| FESS | 400–1500 | 5–100 | Seconds | 80%–95% |
Table 3.
Percentage of the peak shaving and monthly earnings based on UC bank for STS crane.
| Total ED [kWcycle] | Peak Demand | % ED | The Amount of Peak Shaving | %P∧SUC | Monthly Earned Profit ($) |
|---|---|---|---|---|---|
| 91512.93 | 3908.52 | 1 | 915.12 | 23.4 | 20,132 |
| 5 | 1721.42 | 44 | 37,871 | ||
| 10 | 2048.82 | 52.4 | 45,074 | ||
| 15 | 2262.72 | 57.9 | 49,779 | ||
| 20 | 2441.52 | 62.5 | 53,713 |
Table 4.
Percentage of the peak shaving based on UC bank for the STS crane.
| Total RE [kWcycle] | Peak Rate | % RE | The Boundary for RE Utilization | %P∧SUC |
|---|---|---|---|---|
| −49,200.3 | −3212.6 | 1.86 | 915.1 | 28.4 |
| 9.3 | 1622.1 | 51.7 | ||
| 18.6 | 1977.8 | 61.5 | ||
| 27.9 | 2175.1 | 67.7 | ||
| 37.2 | 2340.2 | 72.8 |
Table 5.
Rated Pmax in different scenarios for the group of STS cranes [kW].
| Number of STS Cranes | Duty Cycle Management Scenario | ||
|---|---|---|---|
| Normal Scenario | DSM Scenario | DSM + UC Scenario | |
| 5 | 10,300 | 5880 | 4222 |
| 10 | 14,380 | 8180 | 5476 |
Table 6.
Rated peak factor ( ) for the STS crane group in different scenarios.
| Number of STS Cranes | Duty cycle management Scenario | ||
|---|---|---|---|
| Normal Scenario | DSM Scenario | DSM + UC Scenario | |
| 5 | 5.43 | 3.1 | 2.23 |
| 10 | 3.8 | 2.16 | 1.45 |
Table 7.
Percentage of the peak shaving (%P^S) for the STS crane group in different scenarios.
| Number of STS Cranes | Duty Cycle Management Scenario | ||
|---|---|---|---|
| Normal Scenario | DSM Scenario | DSM + UC Scenario | |
| 5 | 0 | 43 | 59 |
| 10 | 0 | 44 | 62 |
Table 8.
Demand-side management (DSM) and UC pros and cons.
| Only DSM Strategy | Both UC and DSM Strategies | |
|---|---|---|
| Pros |
|
|
| Cons |
|
|
© 2020 by the authors. Licensee MDPI, Basel, Switzerland. This article is an open access article distributed under the terms and conditions of the Creative Commons Attribution (CC BY) license (http://creativecommons.org/licenses/by/4.0/).
Share and Cite
MDPI and ACS Style
Kermani, M.; Parise, G.; Chavdarian, B.; Martirano, L. Ultracapacitors for Port Crane Applications: Sizing and Techno-Economic Analysis. Energies 2020, 13, 2091. https://doi.org/10.3390/en13082091
AMA Style
Kermani M, Parise G, Chavdarian B, Martirano L. Ultracapacitors for Port Crane Applications: Sizing and Techno-Economic Analysis. Energies. 2020; 13(8):2091. https://doi.org/10.3390/en13082091
Chicago/Turabian StyleKermani, Mostafa, Giuseppe Parise, Ben Chavdarian, and Luigi Martirano. 2020. "Ultracapacitors for Port Crane Applications: Sizing and Techno-Economic Analysis" Energies 13, no. 8: 2091. https://doi.org/10.3390/en13082091
Note that from the first issue of 2016, this journal uses article numbers instead of page numbers. See further details here.