Article

Techno-Economic Assessment of Calcium Looping for Thermochemical Energy Storage with CO2 Capture

by
Guillermo Martinez Castilla
*,
Diana Carolina Guío-Pérez
,
Stavros Papadokonstantakis
,
David Pallarès
and
Filip Johnsson
Division of Energy Technology, Chalmers University of Technology, Hörsalsvägen 7b, 41296 Gothenburg, Sweden
*
Author to whom correspondence should be addressed.
Energies 2021, 14(11), 3211; https://doi.org/10.3390/en14113211
Submission received: 2 May 2021 / Revised: 27 May 2021 / Accepted: 28 May 2021 / Published: 31 May 2021
(This article belongs to the Special Issue Thermochemical Energy Storage Based on Carbonates)

Abstract

:
The cyclic carbonation-calcination of CaCO3 in fluidized bed reactors not only offers a possibility for CO2 capture but can at the same time be implemented for thermochemical energy storage (TCES), a feature which will play an important role in a future that has an increasing share of non-dispatchable variable electricity generation (e.g., from wind and solar power). This paper provides a techno-economic assessment of an industrial-scale calcium looping (CaL) process with simultaneous TCES and CO2 capture. The process is assumed to make profit by selling dispatchable electricity and by providing CO2 capture services to a certain nearby emitter (i.e., transport and storage of CO2 are not accounted). Thus, the process is connected to two other facilities located nearby: a renewable non-dispatchable energy source that charges the storage and a plant from which the CO2 in its flue gas flow is captured while discharging the storage and producing dispatchable electricity. The process, which offers the possibility of long-term storage at ambient temperature without any significant energy loss, is herein sized for a given daily energy input under certain boundary conditions, which mandate that the charging section runs steadily for one 12-h period per day and that the discharging section can provide a steady output during 24 h per day. Intercoupled mass and energy balances of the process are computed for the different process elements, followed by the sizing of the main process equipment, after which the economics of the process are computed through cost functions widely used and validated in literature. The economic viability of the process is assessed through the breakeven electricity price (BESP), payback period (PBP), and as cost per ton of CO2 captured. The cost of the renewable energy is excluded from the study, although its potential impact on the process costs if included in the system is assessed. The sensitivities of the computed costs to the main process and economic parameters are also assessed. The results show that for the most realistic economic projections, the BESP ranges from 141 to −20 $/MWh for different plant sizes and a lifetime of 20 years. When the same process is assessed as a carbon capture facility, it yields a cost that ranges from 45 to −27 $/tCO2-captured. The cost of investment in the fluidized bed reactors accounts for most of the computed capital expenses, while an increase in the degree of conversion in the carbonator is identified as a technical goal of major importance for reducing the global cost.

1. Introduction

Anthropogenic carbon dioxide (CO2) emissions are the main cause of climate change [1]. Despite ongoing efforts to deploy renewable energy generation technologies to replace fossil fuels [2], the increase in energy demand has kept constant (at around 80%) the share of fossil fuels in the primary energy demand [3]. As a consequence, global CO2 emissions have continued to grow [4] (albeit with a reduction seen during 2020 due to the decreased economic activity associated with the COVID-19 pandemic). Most future scenarios which comply with the Paris Agreement include a large shares of renewable energy such as from wind and solar power, but also a substantial role for carbon capture and storage (CCS) [5] since there are many thermal conversion processes which for the foreseeable future will have to rely on carbon-based fuels or feedstocks. Several CCS technologies have been investigated and tested over the years, and there has been a special focus on post-combustion systems. The energy penalty associated with the operation of these processes remains, however, the major barrier to the commercial deployment of CCS [6].
The expansion of renewable technologies during the past few decades relates primarily to wind and solar power, mainly driven by large reductions in the costs for implementation of these technologies. Due to the variability of wind and solar power generation, their market value decreases as their level of penetration in the system increases [7]. In addition, they may provoke instabilities in the grid [8]. Thus, to enable a higher level of penetration while maintaining the market value of wind and solar power, different forms of energy storage and flexibilization of operation need to be implemented.
Toward achieving the high penetration levels of wind and solar power generation, energy storage technologies that can handle variations in generation over several days or weeks are of particular importance. In this context, thermochemical energy storage (TCES) is attracting a lot of attention, since in contrast to other storage options, it offers the possibility for long-term storage and shipping with low losses [9], and it has larger energy densities than thermal energy storage (TES) systems [10]. Among the alternatives, some gas-solids cycles represent the most-promising TCES systems due to their high reversibility, stability, and enthalpy of reaction. Although packed beds (moving or stationary) have been typically used for investigations of TCES through solids cycling at the bench-, laboratory-, and pilot-scales [11], fluidized beds are envisioned as the reactor technology of choice for commercial-scale usage due to their superior performance in terms of mass and thermal mixing and operational flexibility.
The calcium looping (CaL) process has been investigated both as a CCS and a TCES technology, as well as an integrated system ([12,13] with references therein). This indicates that CaL potentially has dual uses in the energy transition [2]. The CaL process is based on the multicyclic calcination–carbonation of CaCO3, which can be obtained from limestone, a cheap and abundant material. The process is based on the following reactions:
CaCO 3 CaO + CO 2                 Δ H R 0 = 178   kJ / mol  
CaO + CO 2 CaCO 3                   Δ H R 0 = 178   kJ / mol  
When applied for CO2 capture, the CaL process represents a competitive capture technology in terms of both efficiency and costs [14]. If implemented as TCES, it increases the dispatchability of renewable energy facilities that are able to provide high-temperature streams, such as concentrated solar power (CSP) plants [15,16]. Integrating both applications, the CaL process studied here can turn variable renewable energy (VRE) into dispatchable electricity while at the same time mitigating atmospheric CO2 emissions from a nearby emitting plant.
A review of the technical implications of scale-up of the CaL process for both CO2 capture and TCES applications has recently been published by Ortiz et al. [17], including an analysis of different gas–solids reactor systems. Moreover, Ortiz et al. [15] have published an in-depth review of the different process schemes, conditions, and materials that are advantageous for the operation of the TCES-CSP application. Bayon et al. [18] have conducted a techno-economic comparison of the capital (excluding the reactors) and operational costs of 17 gas–solids TCES systems, arriving at a cost for CaL-TCES of 54 $/kWht (note that this cost is expressed per storage capacity), as compared to the cost of 56–59 €/MWhe estimated by Muto et al. [19] for a CaL-TCES process using a synthetic sorbent. Nevertheless, detailed studies with cost estimations for the combined CaL-TCES process are scarce, due to the early stage of development of this technology [20,21]. This means that they are based on the more-abundant studies of the cost of the more-mature CaL process used for CO2 capture (for an overview, see [22]). Among the latter studies, it is worth mentioning the work of Michalski et al. [23], in which a method for assessing the economic feasibility of CaL-CCS processes was proposed based on commercial technology appraisal tools. According to a study carried out by Mantripragada et al. [24], the reactors, together with solids handling, represent the largest cost for the CaL plant.
In summary, although the economic feasibility of the CaL process has been widely studied for CO2 capture and some studies have assessed the TCES scheme, there is a gap in the knowledge regarding the economics of systems in which the CaL process is applied integrating both purposes. Additionally, there is a lack of research about the economic scalability of the process and the implications that the foreseen electricity selling price and carbon capture cost would have on the economic performance of the process.
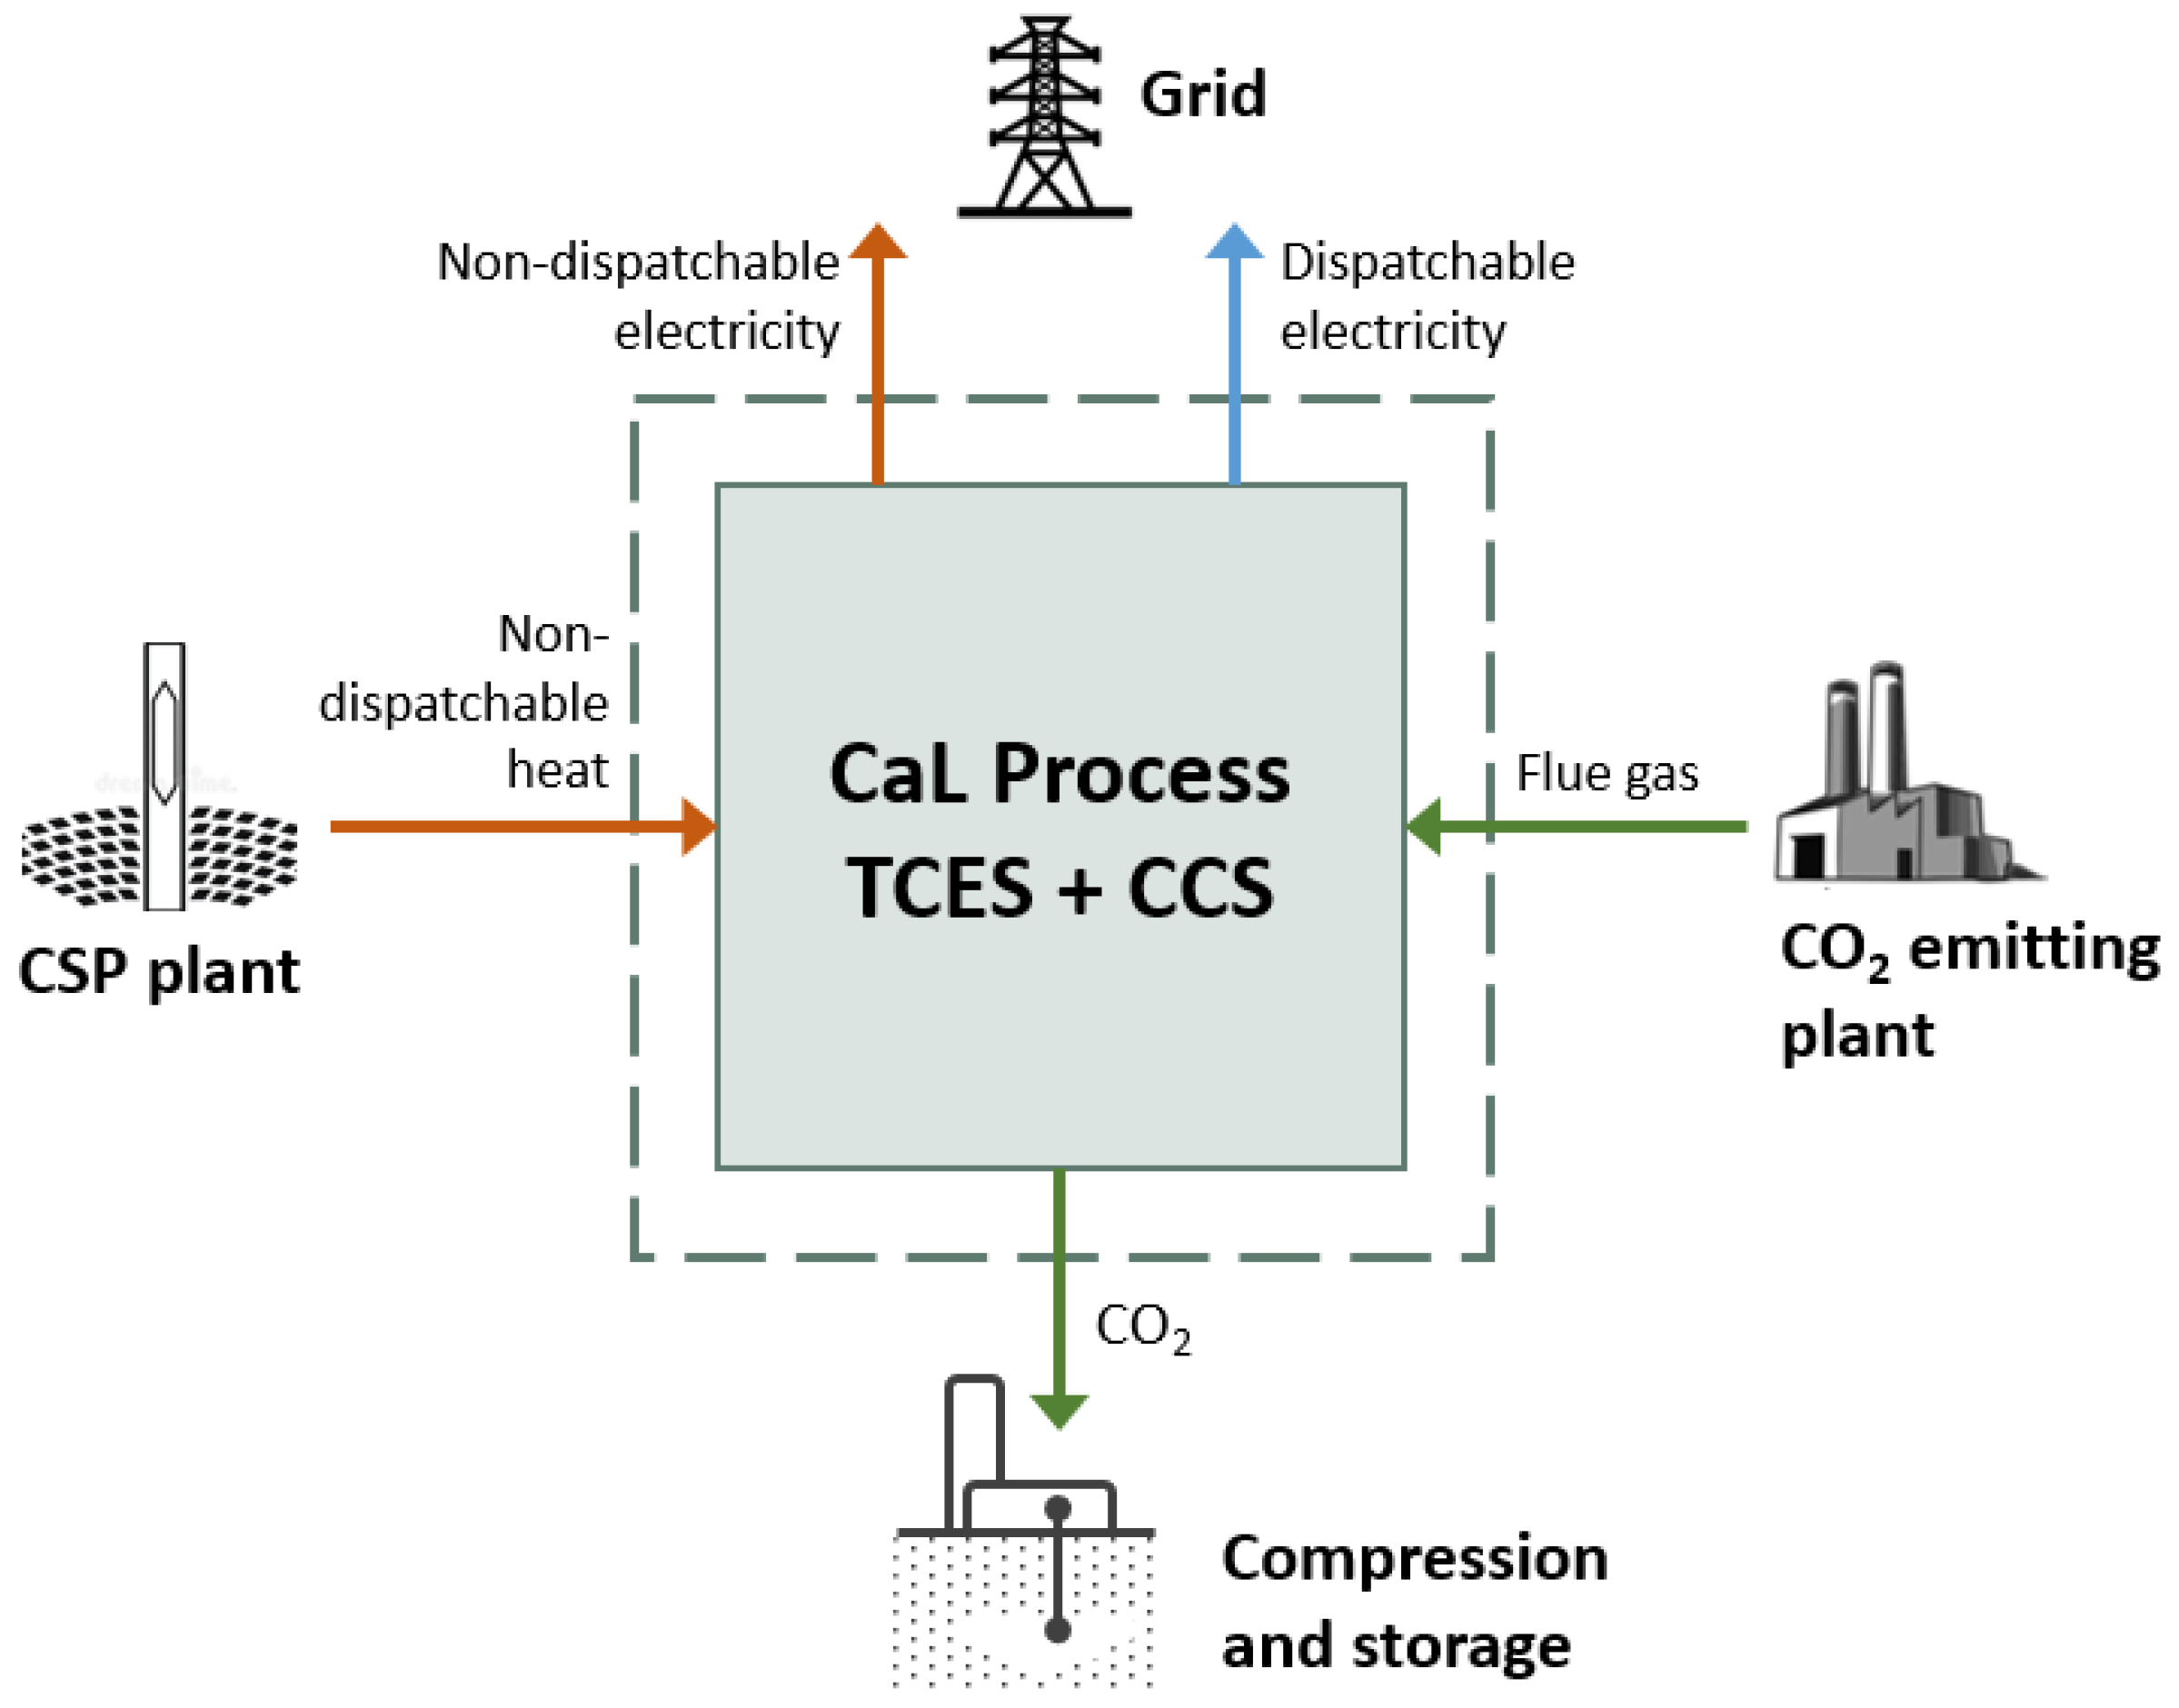
The aim of the present work is to estimate the cost of the CaL process at different scales when it is deployed for TCES in a concentrated solar plant (CSP) as the renewable non-dispatchable energy source combined with capture of the CO2 from a nearby emitter (i.e., not accounting for the transportation and storage of CO2). The CaL process here studied is assumed to make profit from the sale of dispatchable electricity and from the CO2 capture services provided to a nearby emitting plant. Such a case is motivated by: (i) The need for CO2-emitting facilities to operate until the initial investment is paid off, which under a regime of increasing costs for CO2 emissions, will require the capture of the emitted CO2; (ii) the potential of biomass-based energy generation facilities to contribute to negative emissions by capturing their CO2; and (iii) the suitability of CSP to drive heat-demanding conversion processes at high temperatures. Figure 1 shows a schematic of the relationships between the process investigated in this work, the nearby CSP plant and CO2-emitting process plant.
The process scheme presented here takes as its starting point a previous thermodynamic study of CaL for TCES [25], thereafter adapting the process for the integration of carbon capture. The cost of the process is calculated using a bottom-up approach and presented in the forms of the breakeven electricity selling price (BESP), payback period (PBP), and the net capture cost (i.e., cost per CO2 captured). Moreover, the sensitivity of the computed cost to process size, degree of conversion of solids, and income associated with the CO2 captured and electricity sales, as well as to the economic parameters used for the assessment is investigated.

2. Process Description

This section describes the CaL process scheme used in the current investigation. The general process layout proposed by Chacartegui et al. [25] has been used as the basis for the CaL scheme, while certain process conditions have been modified and additional assumptions have been made in line with the nature of the present work (i.e., combined TCES and CO2 capture). Furthermore, the process scheme considers fluidized beds for both the carbonator and calciner reactors, which adds certain requirements related to the use of fluidization agents. The energy input to the process is assumed to originate from an intermittent renewable energy source that is capable of providing high-temperature (>700 °C) heat, i.e., a CSP plant. Note that the process presented here could also be supplied by other sources of renewable, non-dispatchable energy, such as wind power. However, that would require a power-to-heat process prior to the calciner that is capable of providing heat at high temperatures. In that case, the calciner should be designed to operate at the lowest possible temperature, given that power-to-heat technologies capable of providing high-temperature heat (e.g., direct bed irradiation or inserted thermal resistances) [26] are still at early stages of development.
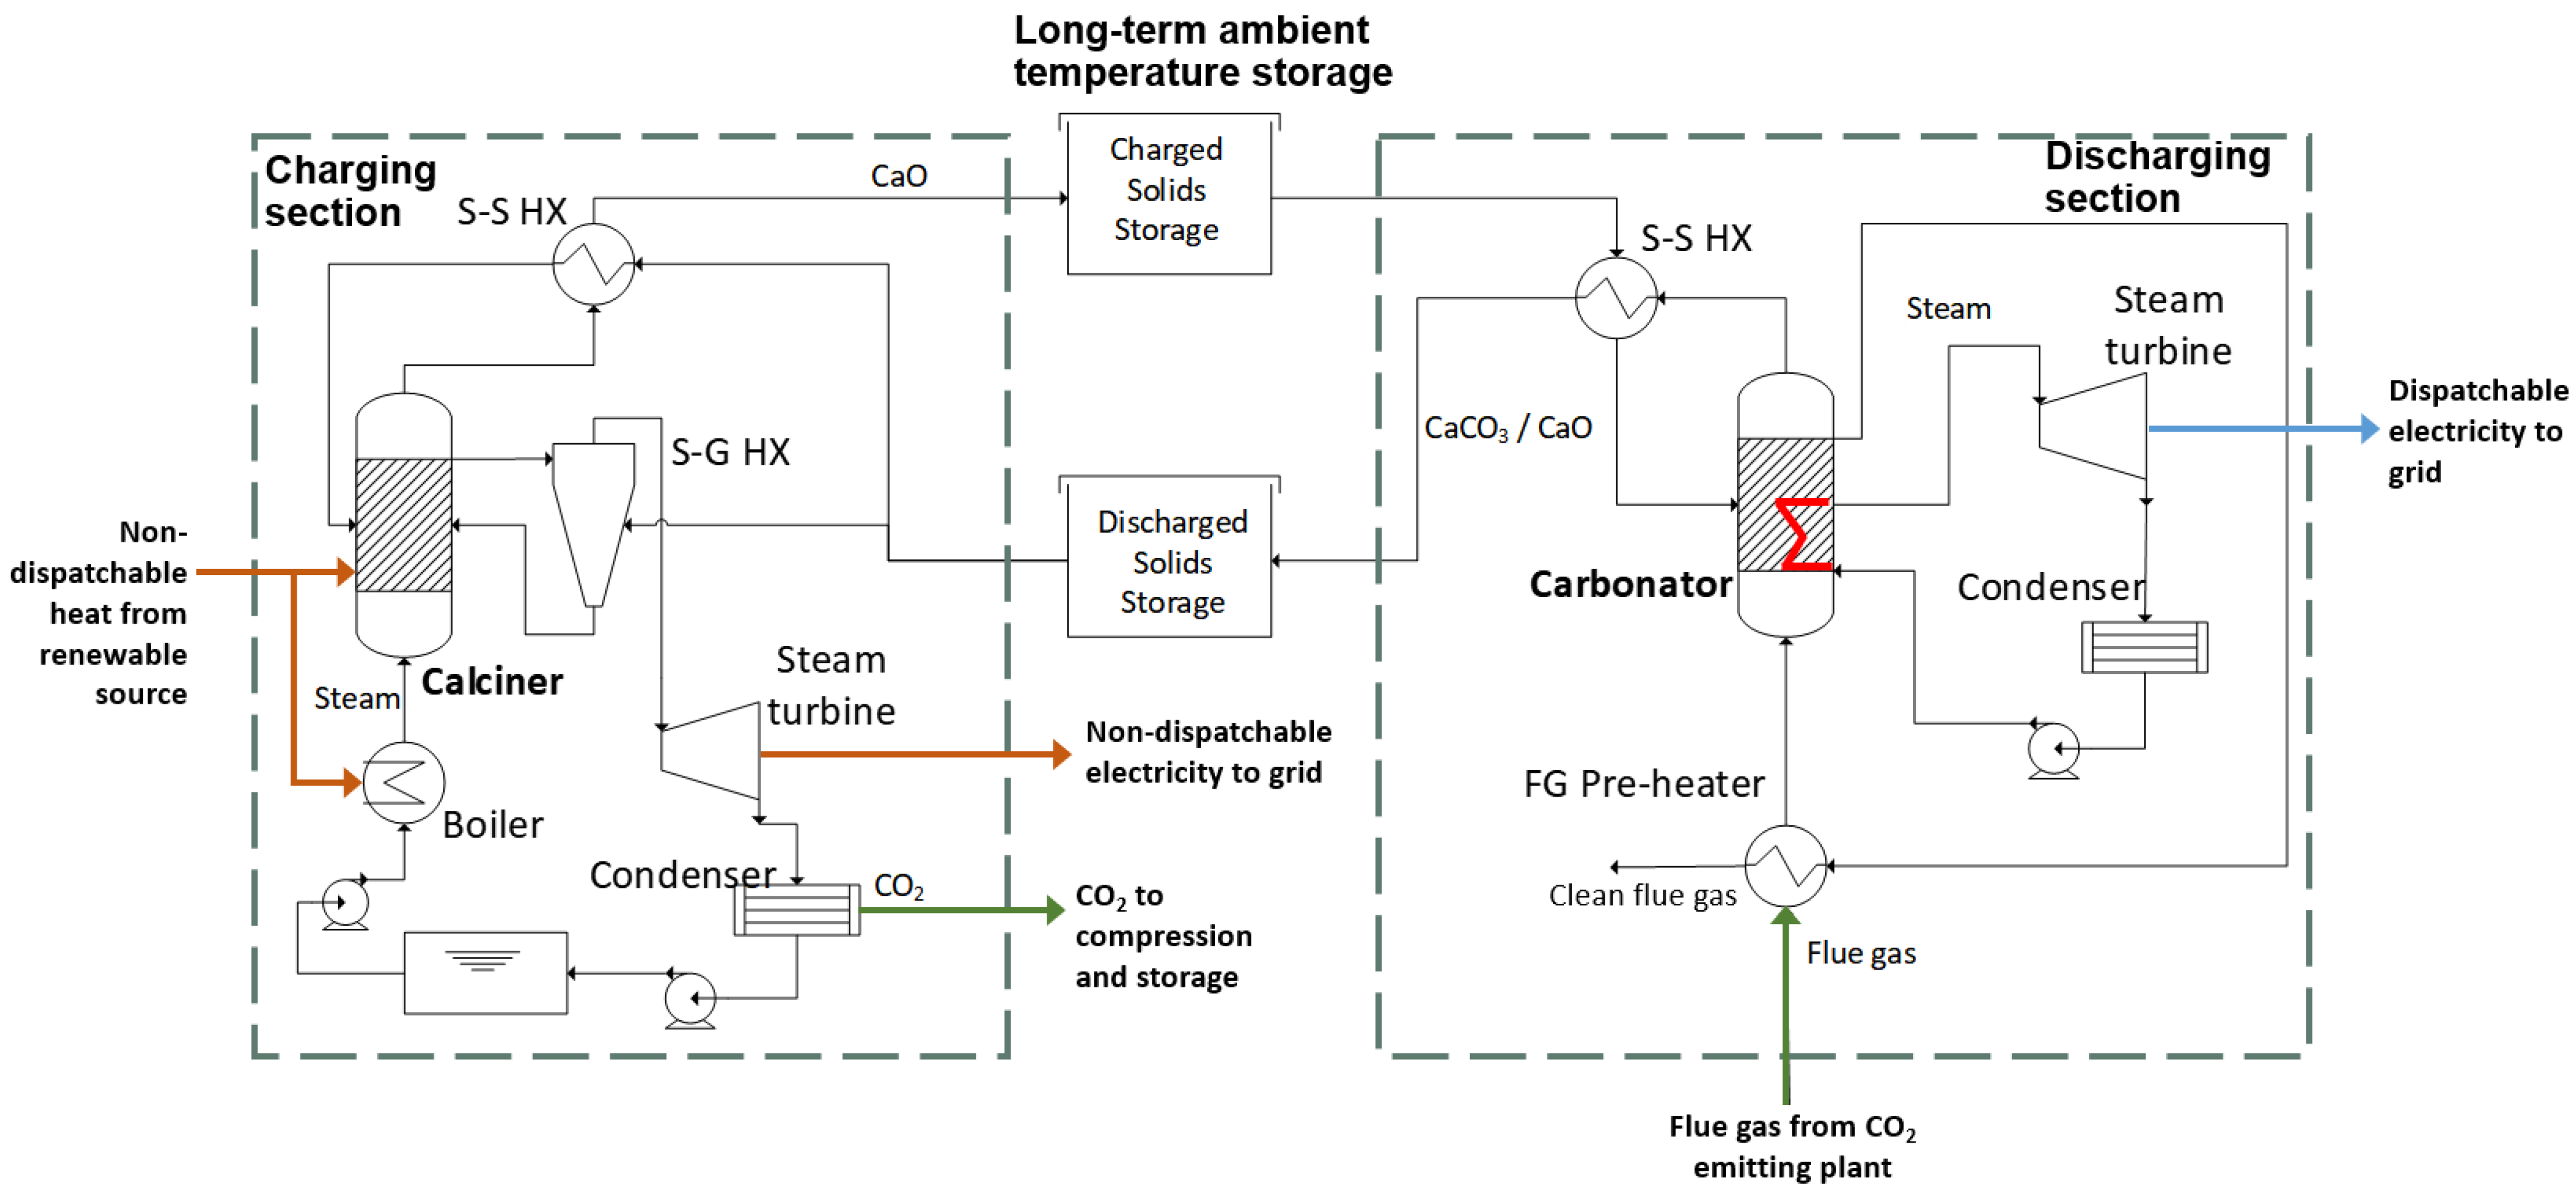
Figure 2 shows a schematic representation of the process studied in this work, consisting of charging and discharging sections that can be operated independently. Correspondingly, solids storage under ambient conditions is considered for both charged and discharged particles. Although this decreases the process efficiency, it allows for the potential introduction of shipping and make-up streams into the process, without altering the thermodynamic performance of the base case calculated here. Although the shipping of the solids would open up a wider range of markets for the process inputs and outputs, thereby enhancing the process economics, this alternative is outside the scope of the present work.
Energy in the form of heat at high temperature is used to run the charging section, which comprises the calcination reactor and a generator of superheated steam for fluidizing the reactor. As reported previously [27], calcination in the presence of superheated steam decreases the temperature required for calcination and increases the conversion rate of the solids in the carbonation side. Lower calcination temperatures also offer the possibility to use simpler and cheaper energy collectors [15]. In this work, the calciner conditions have been fixed at an intermediate temperature of 850 °C and pressure of 1 bar, following the conclusions of a previous study [15] for calcination in a steam atmosphere, which corresponds to a steam/CO2 molar ratio of 1. The gas stream leaving the calcination reactor (consisting of H2O and CO2) is used to preheat part of the total inflow of discharged solids (using the split fraction suggested previously [25]), and is subsequently expanded in a turbine down to the condensing pressure (set by the cooling water temperature), enabling also separation of the condensate and leaving the CO2 ready for compression. A water tank allows the condensate to be stored when the calciner is not in operation. The process incorporates two solids–solids heat exchangers that are used to partially preheat the input solids streams with the hot solids streams leaving the reactors, which is crucial to reduce energy losses when the storage is under ambient conditions.
Energy discharging is achieved through a Rankine cycle that runs the dispatchable steam turbine using the heat released in the carbonator reactor, which is fluidized with the flue gas from a nearby facility, setting the carbonation conditions of the investigated process to 650 °C and 1 bar. Since optimization of the process performance falls outside the scope of this work, a simplistic approach has been followed for the power cycle conditions. Steam at 550 °C and 120 bar is generated and expanded in a single step to the condensing pressure. It should be noted that the possibility of pre-heating the feed-water line is not considered in this work.

3. Methodology

3.1. Mass and Energy Balances

In order to carry out an economic assessment of the process defined in Section 2, including both the capital and operational costs of the plant, a thermodynamic analysis is performed initially. This is followed by the computation of the mass and energy balances and the corresponding equipment sizing. Table 1 presents the values for the process parameters selected in this study. Note that the impact of process size on the results has been evaluated and, thus, the net instantaneous power input is varied from 50 MW to 1000 MW. Furthermore, since it is often reported as a crucial limiting performance parameter [17,28], the effect of the degree of conversion of the solids in the carbonator is also investigated.
The charging time tcharge, which is defined as the number of hours per day that the charging side is assumed to be running (i.e., the time when the intermittent renewable energy source can be harnessed), is a design option here fixed, for the sake of the analysis, at 12 h/day. Thus, the storage is sized to provide a sufficient amount of charged solids (CaO) to run the discharging side during 24 − tcharge hours per day. The calciner is sized so it can convert the available heat input Qcalc into stored chemical energy, while the carbonator is sized to operate continuously for 24 h/day. The overall efficiency of the process [Equation (3)] is computed as the time-weighted average of the process performance during charging and discharging operation.
η T = W n e t , c h a r g e t c h a r g e + W n e t , d i s ( 24 t c h a r g e ) Q i n t c h a r g e
Both reactors are computed as stirred tank reactors, with all output streams exiting at the reactor temperature. The mass and energy balances describing the reactors are calculated through Equations (4) and (5), respectively:
F i , i n F i , o u t ξ v i = 0
i F i , i n ( h i , r e a c t o r h i , i n ) + ξ Δ H R ( T r e a c t o r ) = ϕ
where ξ is the extent of reaction per unit of time, vi is the stoichiometric coefficient of reactant i, ϕ is the external heat flow, and ΔHR is the enthalpy of reaction.
The flue gas entering the process is assumed to contain 15% CO2 and the capture rate in the carbonator is fixed at 90% in accordance with a previous report [32]. All gas flows are assumed to be ideal, and no pressure drop calculations are included in the study. Each solids–solids heat exchanger (SS–HX) is computed as a series of two bubbling fluidized bed gas–solids heat exchangers, the volumes of which are estimated based on the heat-transfer coefficient reported in [29] and with a minimum temperature difference slightly higher than that of conventional fluid–fluid heat exchangers. The gas–solids heat exchangers (SG–HX) are in turn sized as cyclones as suggested by a previous study [34] and according to the calculation method provided by [35], with an estimated minimum temperature difference similar as for conventional fluid–fluid heat exchangers. Solids storage tanks are sized using the method suggested by Bayon et al. [18]. No solids losses in the cyclones and fluidized beds are accounted for in this calculation. The remaining conventional fluid–fluid heat exchangers are sized using the heat transfer coefficients taken from Woods [30].

3.2. Economic Assessment

The assessment of the economic performance of the plant is performed using as main indicator the BESP. This is assessed by setting the calculated net present value (NPV) of the plant to zero, i.e., establishing an electricity selling price such that the revenues balance the cost of the plant over a lifetime of 20 years. Thus, the NPV is calculated in this work as the sum of the discounted annual cash flows over the lifetime of the project, according to:
N P V = i = 1 n C F i ( 1 + r ) i
A bottom-up approach is used to compute the annual cash flows, by estimating the plant costs of the basic process components and thereafter adding the installation and indirect costs. The methodology followed in this work for estimating the total plant cost is based on the work of Manzolini et al. [36]. Table 2 shows the cost functions used to estimate the erected cost of each process component, based on the cost of a reference component of size S0 and with the scaling parameter f [Equation (7)]. The functions presented in Table 2 have been updated using the Chemical Engineering Plant Cost Index (CEPCI). Note that all costs are computed in USD2021. The startup year is assumed to be 2021 and the project is assumed to take place in Southern Europe, where CSP can be utilized and the European carbon capture and storage policies apply. All economic parameters, costs, and prices are selected for non-pandemic conditions assuming the fast recovery of the world after the COVID-19 crisis.
C = C 0 ( S S 0 ) f
Several expressions can be found in literature for estimating the capital cost of calciner/carbonator FB reactors. For instance, [37] uses an equation whose validity range is up to 100 MW. In [30], the suggested equation only accounts for the reactor vessel. Lastly, the equations used in [23] refer to a retrofit of a coal-combustor plant. Hence, in the present work, the calciner cost is estimated by taking as reference an oxy-circulating fluidized bed (CFB) furnace from the economic data available in [38], assuming that the heat transfer surfaces are used to add heat to the reactor instead of removing heat. Similarly, the carbonator is assumed to resemble a conventional CFB boiler [38]. Note that for the base case of 100 MW net heat input, the cost function in [37] would yield a capital cost of the reactors of 30 M$, a cost of 13$ with [30] while the cost would be 45 M$ if using the functions in [23]. Thus, the equations used in this work yield the costliest estimation among the cited ones (105 M$ for the 100 MW case), and the importance of selecting an appropriate cost function when computing the BESP is highlighted in Section 4.
Due to a lack of available data and given the design of solids–solids heat exchangers existing in certain industries such as the iron ore processing, the cost of each of the two fluidized beds conforming the solids–solids heat exchanger is estimated as the cost of a bubbling fluidized bed dryer. The solids storage tanks are sized according to the method published in [18], whereas the only liquid-containing vessel present in the process (to store the feed-water in the charging side) is assumed to be a standard cylindrical water vessel [39] with a total specific cost of 83 $/(m3-water), as taken from [18].
The values selected for the key economic parameters assumed in this work are listed in Table 3. The income derived from capturing the CO2 produced by a nearby facility (hereinafter referred to as IncomeCC) is taken as 50 $/t in the base case, which is based on an estimation of the capture cost with a conventional technology [31], and is here used as the cost that a plant would be willing to pay for capturing the CO2. The CO2 compression and storage processes are not included in the study, as their costs would be transferred to the emitting industry and are, therefore, not relevant to the feasibility of the CaL process. The cost of the renewable energy input is omitted in the cost calculations as not being part of the investigated storage technology. Nevertheless, an assessment of its impact on the computed costs is included in the discussion. Lastly, the make-up and purge/loss of the solid material are ignored.
To compare the cost of the described process with the costs of other CO2 capture technologies, the total cost of the plant is also expressed in the typical capture cost metric of $/tCO2-captured. Note that this is done only to allow for comparisons with other studies, since the capture of CO2 is here treated as an incoming cash-flow and, therefore, is not an actual cost. For this purpose, the NPV includes as positive cash flows both the selling of the generated electricity and the revenue obtained for the CO2 capture. The electricity is assumed to be sold at a price (ESP) of 40 $/MWh in the base case [44]. Additionally, the payback period (PBP) of the process is computed according to Equation (8):
P B P = T o t a l   i n v e s t m e n t   c o s t Y e a r l y   r e v e n u e
To scrutinize the economic assessment of the process, a parametric study is carried out in which the variations of the two assumed incomes are explored: that associated with carbon capture is varied from 10 to 100 $/tCO2-captured (in line with the forecasted cost of emitting CO2), whereas the assumed electricity selling price varied from 20 to 80 $/MWh. Furthermore, the BESP of the base case is analyzed for two more pessimistic sets of economic parameters (see Table 3).

4. Results and Discussion

Figure 3 presents a simplified energy flow diagram of the process with the values corresponding to the base-case process (see Table 1). The top panel illustrates the energy distribution when the charging side is operating (VRE source is available), while the bottom panel shows the energy flows when only the discharging side is operating. It is evident that the rather low efficiency of the base process (28%) is mainly attributable to heat losses in the heat exchangers (mostly in the condensers of the power blocks), parasitic losses connected to the solids conveying, and heat losses during solids storage. All the latter losses are high due to the low conversion efficiency in the carbonator (xcarb = 0.25 for the base case), which renders a large proportion of the circulating solids inactive. Here, it must be pointed out that the process is far from optimal, with the two power blocks defined as basic Rankine cycles. Studies reported in the literature have shown that the efficiency of the optimized process (for the TCES scheme) can reach up to 45% [25,45]. Furthermore, the vast majority of the losses are in the form of low temperature heat, and this work does not consider the possibility to include heat streams in the product portfolio of the plant (in the form of district heating or industrial heating), in which case some portion of this loss would be transformed into additional revenues. It is worth pointing out that the use of superheated steam to fluidize the calciner implies an added energy loss in the steam generator that is partly recovered by the non-dispatchable turbine, which produces almost half of the energy when the charging side is in operation. Varying the percentage of steam in the calciner (50% is used in the base case) has an impact on the total energy output shares. A lower requirement for steam in the calciner increases the dispatchability of the process, i.e., the share of the output energy delivered by the dispatchable turbine, as well as the total efficiency of the process, while allowing for the capture of larger volumes of CO2.
Figure 4 maps the total plant costs for different plant sizes expressed as different net energy inputs. It is clear that the reactors represent the major fraction of the total cost, especially for larger plant sizes (i.e., >80% of the total cost for the 1000-MW case versus 75% for the 50-MW case), which is in line with a previous study [24]. Note that in the present work, the reactor costs also include the heat transfer surfaces, which function is fundamental both for transferring heat into the calciner as well as for steam generation and superheating in the carbonator. These results highlight the importance of costing of the reactors when assessing TCES processes, and this should be borne in mind when choosing a specific reactor type and design [15]. It can also be seen in Figure 4 that the cost of storage is negligible when compared to the reactors, indicating that the process could handle higher levels of flexibility at a similar cost. The fixed operational and maintenance (O&M) costs and the capital cost of the heat exchangers are the second and third largest expenses, with the relative importance of the former decreasing substantially with plant size.
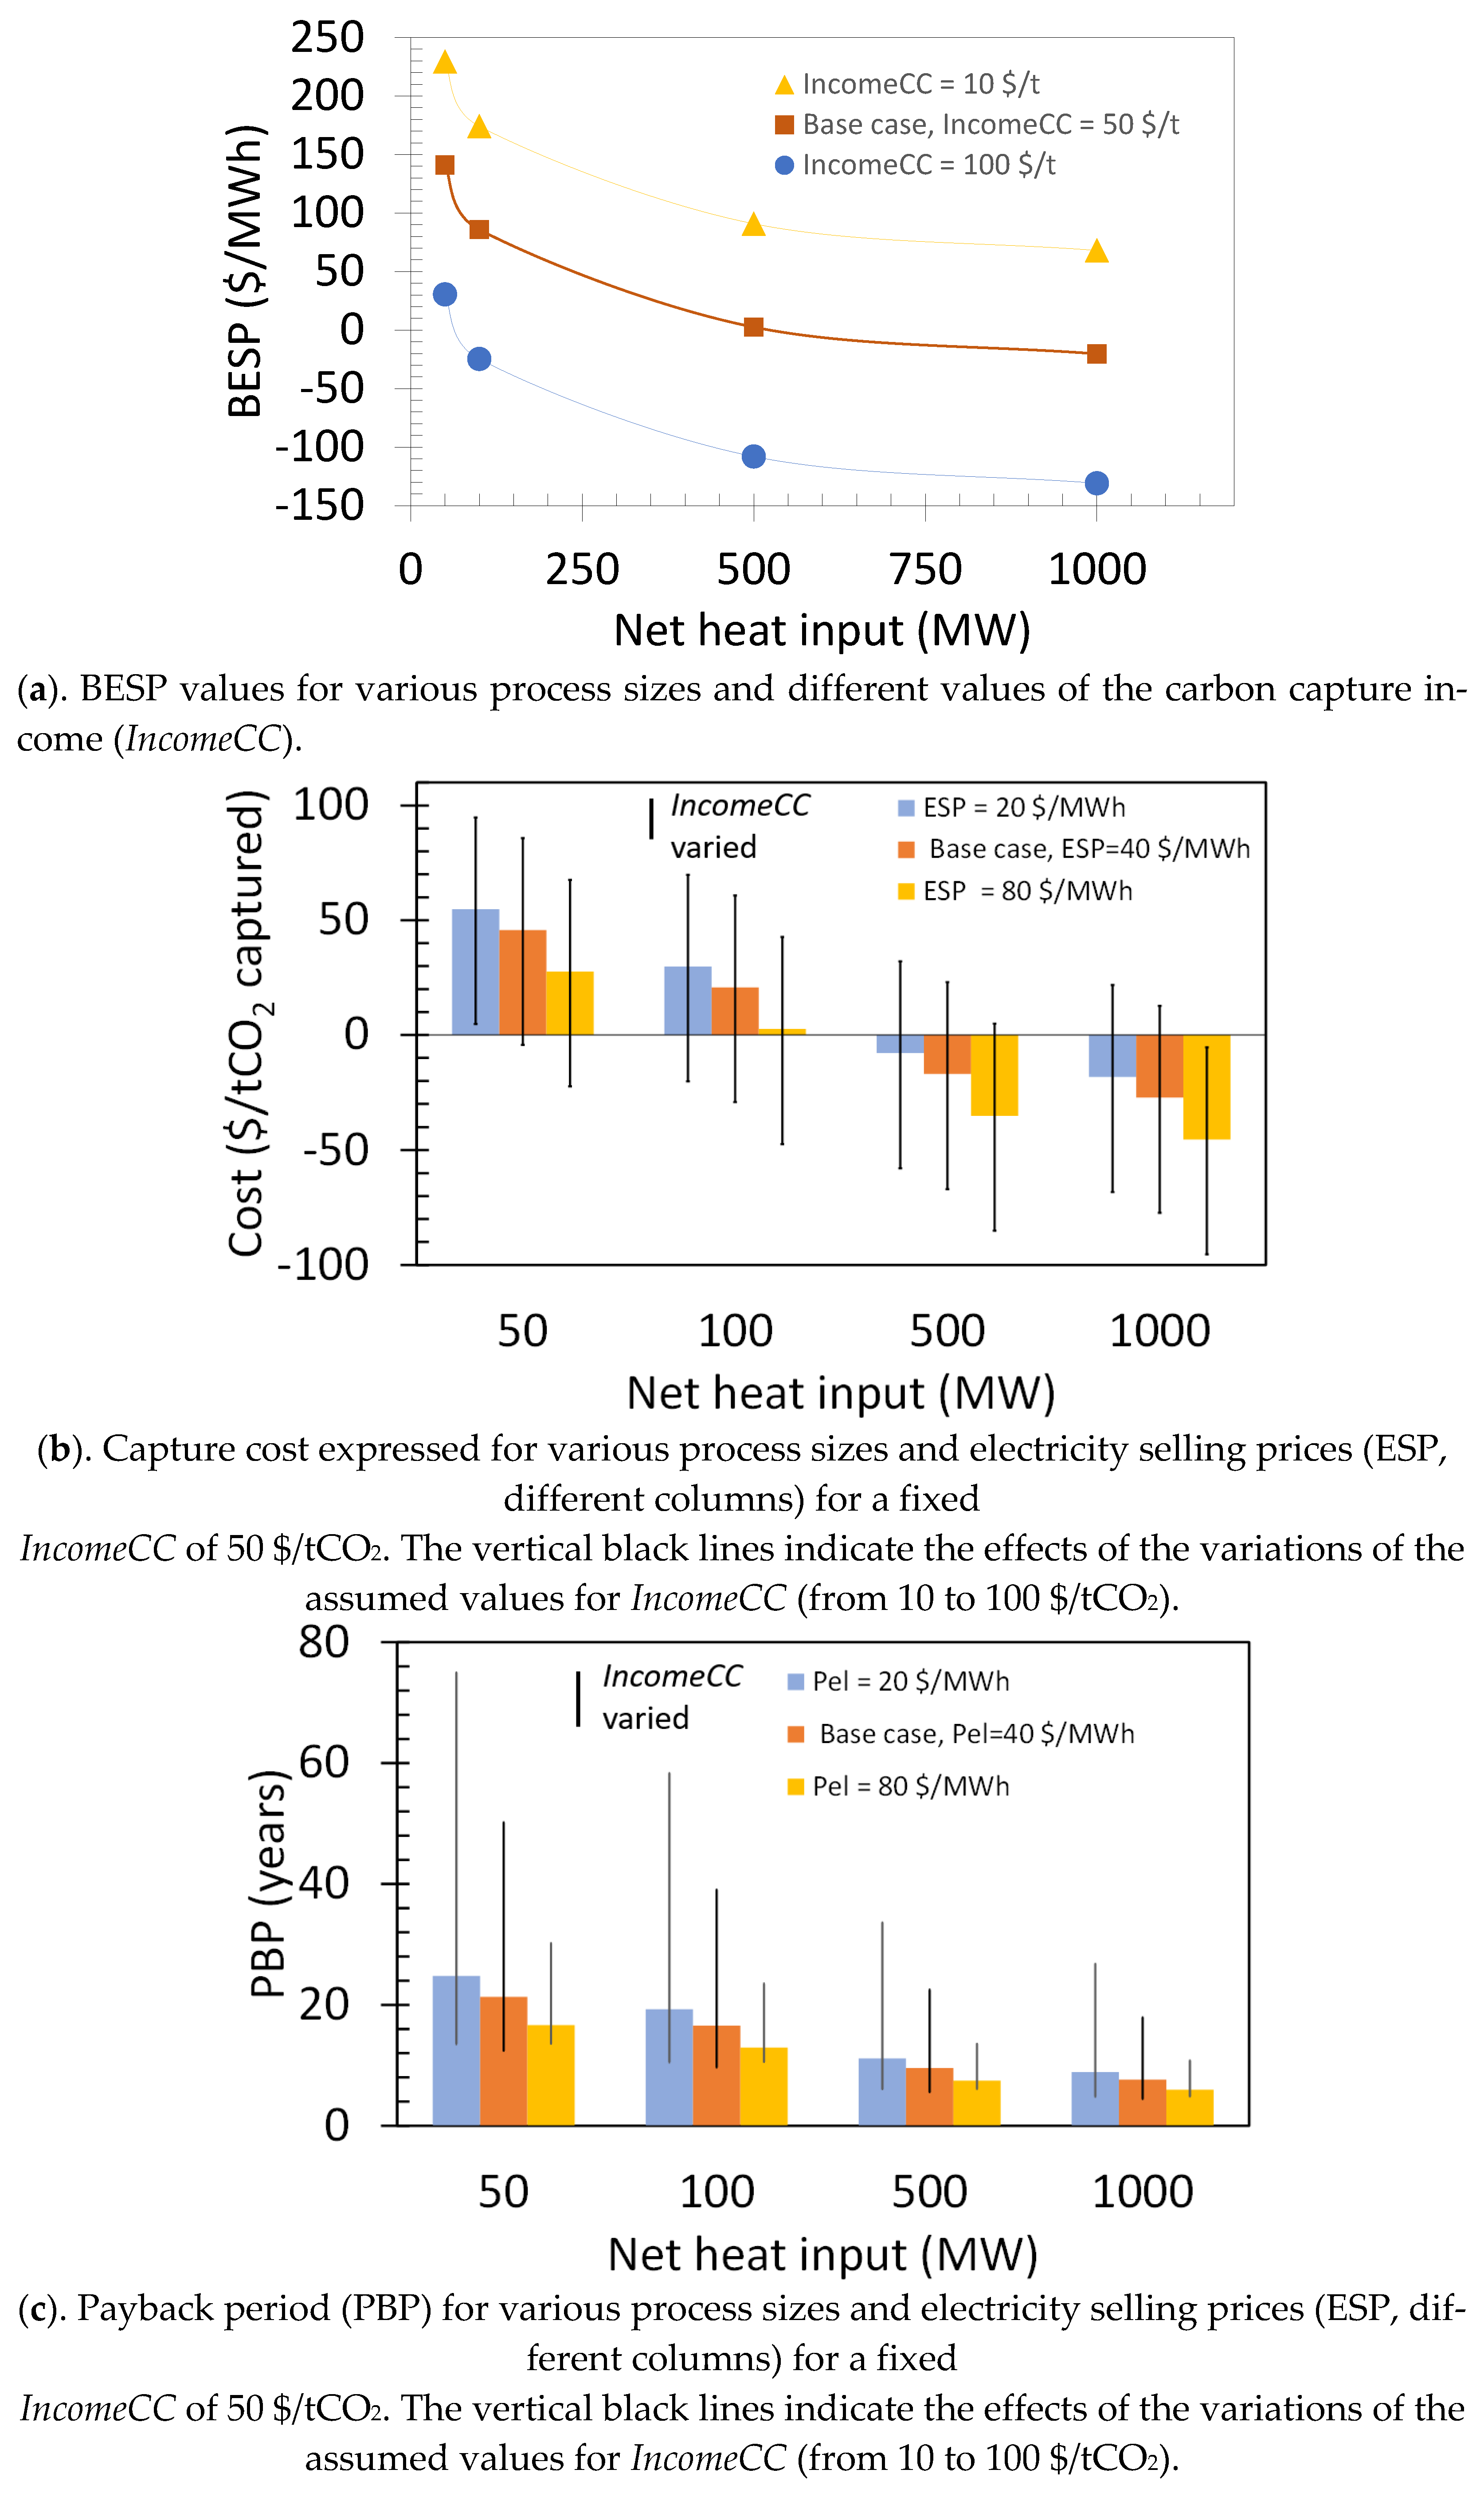
As expected, the BESP decreases with the process size (see Figure 5a), ranging from 141 $/MWh for the smaller (50-MW) reactor to −20 $/MWh for the 1-GW case (all other process parameters were fixed to the base case values). The curve for the variation of BESP with size is steeper for heat inputs in the range of 50–500 MW than between 500 and 1000 MW. Note that a negative BESP value indicates that the plant would already be profitable accounting only for the income connected to the carbon capture. The impact of the revenue stream related to CO2 capture (IncomeCC) is further explored by varying the base case assumption (50 $/tCO2-captured) (see Figure 5a). The results show that for an assumed carbon capture income of 10 $/tCO2-captured, the BESP of the plant ranges from 229 to 68 $/MWh, whereas for the most optimistic assumption of 100 $/tCO2-captured the computed BESP lies between 30 and −130 $/MWh. It can be seen that the net impact of the specific CO2 capture income on the cost is constant with process size, due to the fact that the amount of CO2 captured scales linearly with the net heat input. Consequently, the income associated with the CO2 capture exerts a stronger influence on the total plant economics at larger sizes. It should be noted the importance of choosing an appropriate cost function for the reactors when assessing the economic performance of the CaL process, as the reactors are of major importance in the cost structure and underestimating their cost can yield misleadingly optimistic results. If, for instance, the cost functions of [23] are used (see Section 3.2), the computed BESP for the 100 MW base case would be lower down to −9 $/MWh, and down to −30 $/MWh if the cost equations from [37] are used instead.
A similar trend is observed when the cost is expressed as $/tCO2-captured (Figure 5b), with values ranging from 45 to −27 $/tCO2-captured for the base case (plotted with orange bars). Here, a negative capturing cost indicates that the plant would be making a profit before the 20 years of the plant lifetime used in the analysis. The variations of the cost to the assumed electricity selling price (ESP) and carbon capture income (IncomeCC, from 10 to 100 $/tCO2) are also shown in Figure 5b. The variations of the cost when varying only the assumed value for ESP (i.e., IncomeCC is fixed at the base case value) are plotted for each net heat input, whereas the vertical black lines show the sensitivity when varying IncomeCC for each of the cases. These results can also be expressed as PBP, as shown in Figure 5c. As indicated above, only cases with a negative cost in Figure 5b are breakeven before 20 years, i.e., having a PBP < 20. The analysis shows that the PBP is most sensitive to the variations of IncomeCC, with a PBP as low as 3.8 years for the most optimistic set of IncomeCC and ESP assumptions.
The effects of varying some of the economic parameters on the computed BESP for the base case are shown in Table 4. As expected, both the capacity factor and interest rate play a big role in the economic performance of the process. Note that the capacity factor is strongly linked to plant stops required for maintenance, which in the current process could be optimally planed due to the inherent intermittency expected in the operation. Regarding the limestone cost, it is shown in Table 4 that its impact is negligible on the process performance.
Figure 6 presents the impacts on plant costs of varying the degree of conversion of the solids in the carbonator, both in terms of BESP and $/tCO2-captured. Note that the size of the process, the CO2 capture income, and the electricity price assumptions have been set at their base case values (100 MW, 50 $/tCO2, and 40 $/MWh, respectively). The relatively strong impact of xcarb on the plant cost is confirmed by a reduction of the BESP of 24 $/MWh when xcarb is increased from 0.15 to 0.25. Increased conversion in the carbonator enhances the efficiency of the process because the total amount of solids required to be cycled in order to generate a certain amount of electricity is decreased. This translates into lower heat losses during solids storage, lower parasitic losses, and smaller sizes of the reactors and heat exchangers. This impact becomes less prominent for xcarb values > 0.5.
It is important to mention that the relevance of the material conversion for process performance has previously been identified by several groups [17,46], although not for a TCES-CCS combined system and not in terms of economic performance. Although important for most TCES solids–gas systems [11], the solids conversion rate attains special relevance in the CaL process, as its value can change by a factor of 2.5 depending on the reactor conditions [15] and on whether the process is designed for TCES only or for the TCES-CCS concept presented here. The conditions of the flue gases determine to a large extent the maximum achievable conversion rate and the capacity for CO2 capture, the revenues from which have been shown to be important for the global feasibility of the process. These findings highlight once again the need for material developments for the successful deployment of the CaL process.
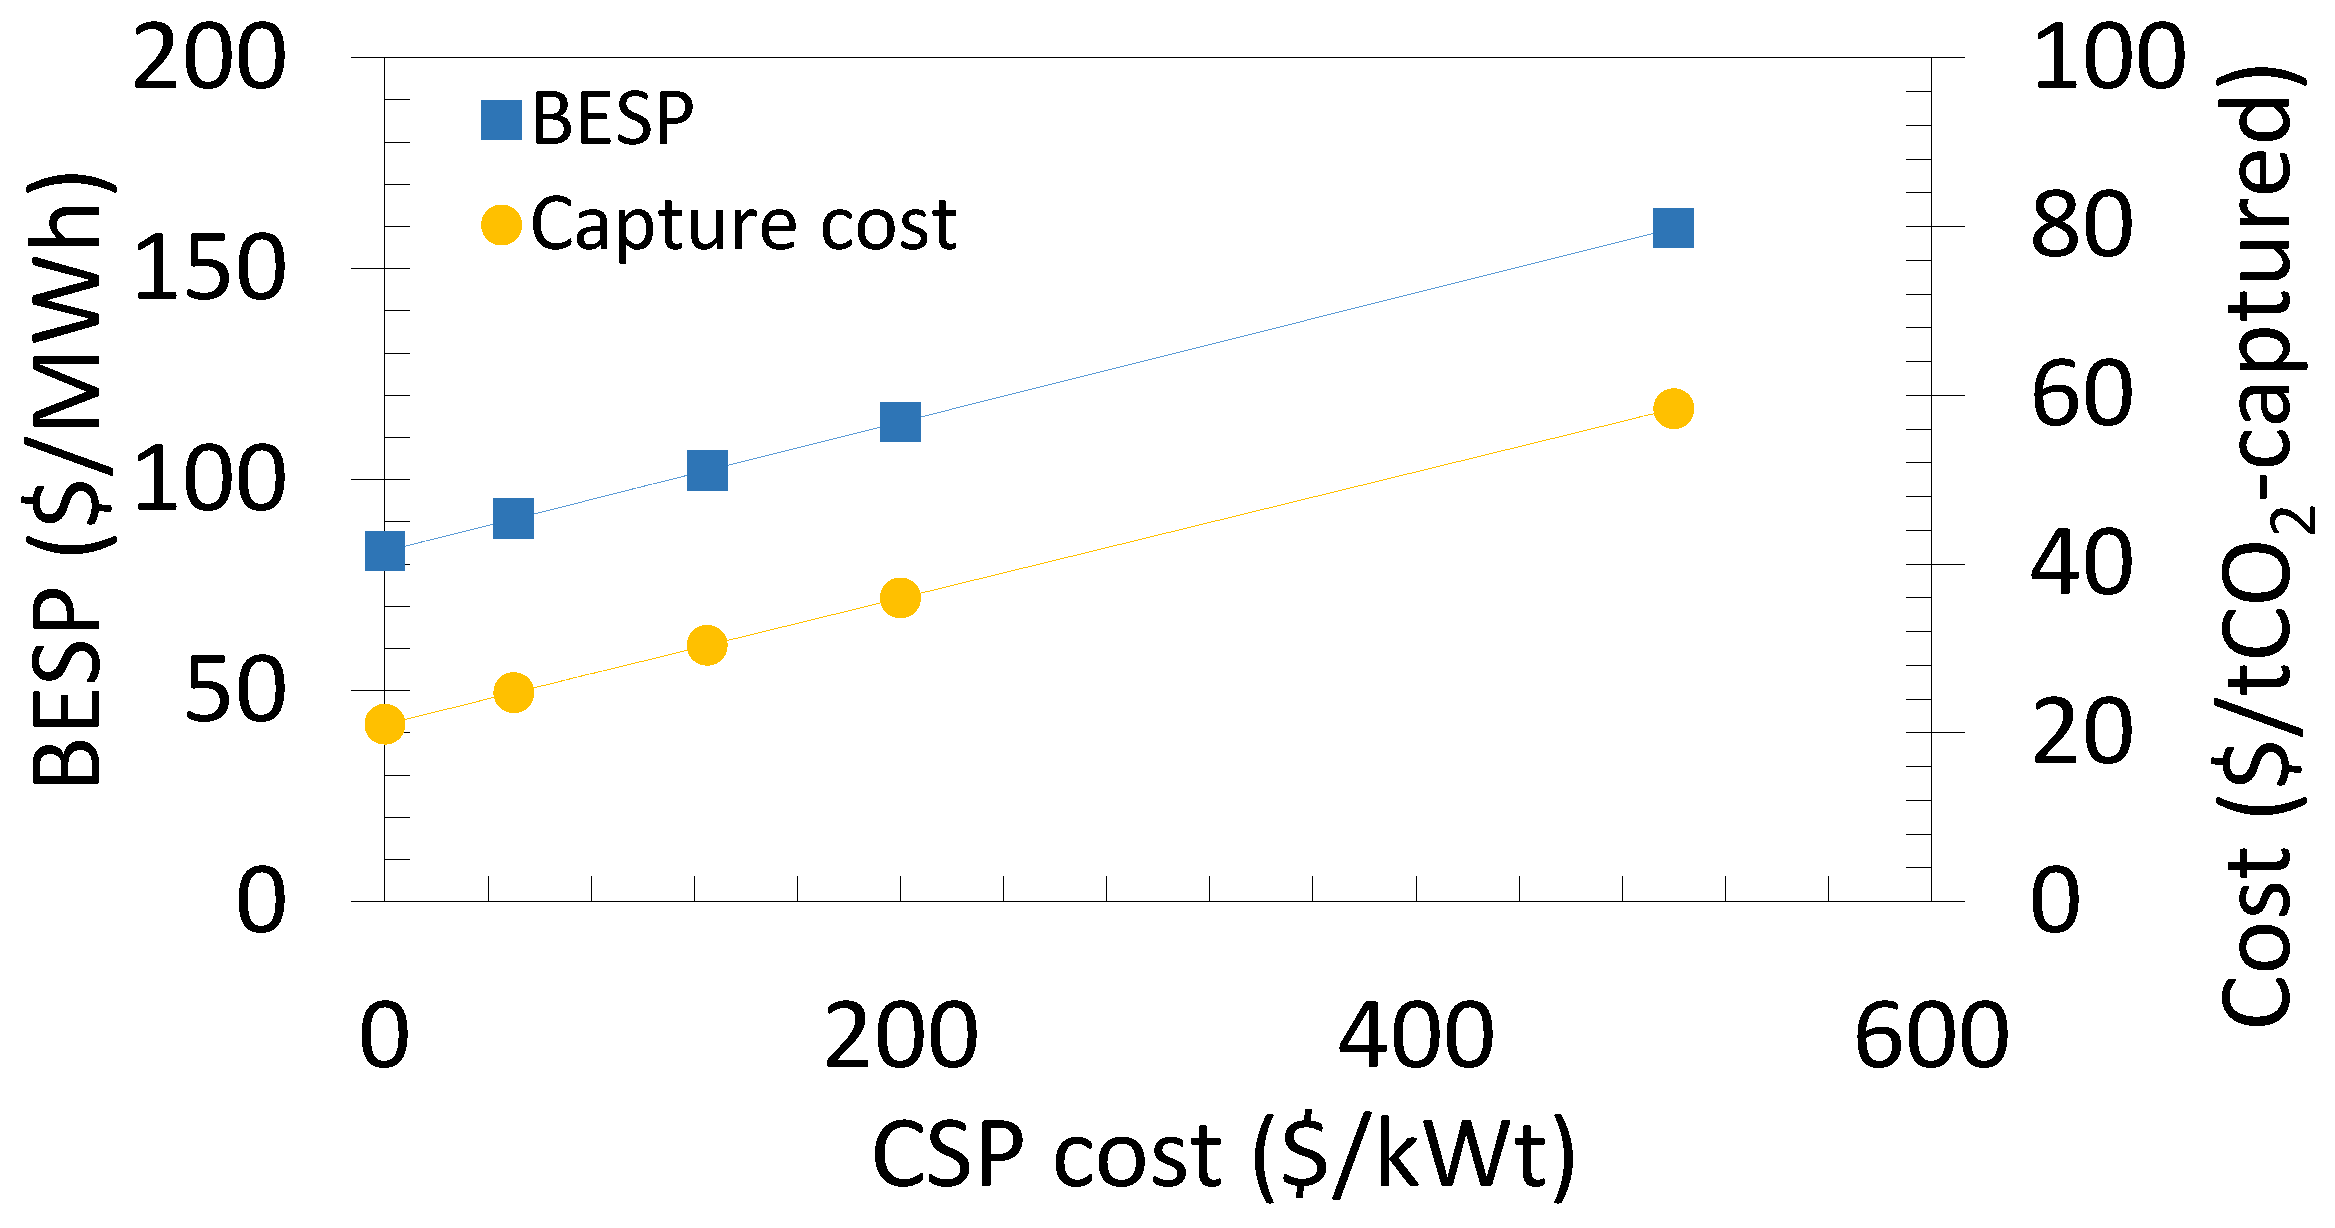
The cost of the energy supply facilities can also play a major role in the profitability of the process presented here. If the energy source is a solar receiver with the characteristics of a CSP plant as assumed in this work, its cost and design become additional aspects that need to be addressed in more detailed economic assessments. Figure 7 shows the updated cost of the base case for a range of CSP costs, based on the predictions from [47]. For instance, applying the total cost suggested by Ho [48] (125 $/kWt for a large-scale particle receiver capable of reaching 1000 °C), the BESP increases from 83 to 102 $/MWh, while the capture cost increases from 21 to 30 $/tCO2-captured. This is in line with the figures predicted by [47], in which a CSP plant as the one here applied would represent an added cost of 20–70 $/MWhth. If the conditions in the calciner are chosen so as to have lower temperatures than those used in this work (850 °C), less costly CSP equipment could be used. However, the impact of such a cost on the overall techno-economic performance is still unknown. Furthermore, if the process is intended to be coupled to a renewable energy facility other than solar CSP, an extra step would be required to convert the non-dispatchable power to heat at the required temperature, and the cost of this step would be added to the total cost.
The results of the current work can be compared on the one hand to other energy storage processes through the BESP values, and on the other hand to other CO2 capture systems through the cost of capture expressed in $/tCO2-captured. As examples of the former, Ganwal et al. [19] have reported a cost of 56–59 $/MWhe for a CaL storage process with a synthetic material of xcarb = 0.4, which is comparable to the cost obtained in this work (see Figure 6). Michalski et al. [23] have reported a levelized cost of electricity (LCOE) of 80–95 $/MWhe, although their study considered retrofitting a coal power plant. Cormos [49] also carried out a retrofitting study and concluded that the LCOE of a retrofitted CaL power plant would be in the range of 68–74 $/MWhe. As for cost for capture, some of the main publications that have addressed the cost of CaL-CCS [22] have reported a cost range of 20–40 $/tCO2-captured, which is comparable to the costs estimated in this work for carbonation reactivities higher than 0.5. Furthermore, the work of MacKenzie et al. [50] proposes that the overall cost is primarily sensitive to the material deactivation and limestone cost. Although neglected in the present work, these factors could play important roles in the long-term, given the low degree of solids conversion in CCS applications [17].

5. Conclusions

A techno-economic investigation of a fluidized-bed calcium looping process for simultaneous thermochemical energy storage and CO2 capture at different scales is presented. The process converts intermittent renewable heat produced in a CSP plant into dispatchable energy while capturing CO2 from a nearby emitter. Thus, the cost is assessed through a breakeven electricity selling price (BESP) when assuming a side revenue for the carbon capture services provided to the nearby emitting plant. For comparison with other technologies, the results are also expressed as cost per CO2 captured and payback period (PBP).
The analysis implicates the investment costs of the reactors as the major costs for the CaL process, and therefore, the overall costs of the process would not vary when handling storage times larger than the ones studied here. For the base conditions investigated, the calculated BESP ranges from 141 to −20 $/MWh for the size range of 50–1000 MW, while the capture cost ranges from 45 to −27 $/tCO2-captured. A parametric study shows that these values decrease with an increase in carbon price. For example, for a given case with a BESP of 141 $/MWh, doubling the income associated with the CO2 captured yields a BESP of 30 $/MWh. An increase of up to 0.5 in the degree of solids conversion in the carbonator yields a significant decrease in the overall cost. The study also shows the importance of further analysis and optimization when it comes to choosing the optimal conditions for the reactors and the composition of the fluidization gas. The costs calculated in the present work can be added to the cost estimations for thermal energy coming from the CSP units, so as to evaluate the importance of the renewable heat input relative to the cost of the CaL process. A sensitivity analysis shows that when the assumed cost for the CSP plant is doubled, the BESP increases by 15% and the capture cost increases by 28%, indicating that costs of the CaL reactors are more critical than those of the solar receiver equipment.

Author Contributions

G.M.C.: conceptualization, methodology, formal analysis, investigation, writing—original draft preparation, visualization. D.C.G.-P.: conceptualization, methodology, formal analysis, investigation, visualization, supervision, writing—review and editing. S.P.: conceptualization, methodology, supervision, writing—review and editing. D.P.: conceptualization, methodology, supervision, writing—review and editing. F.J.: conceptualization, methodology, supervision, writing—review and editing. All authors have read and agreed to the published version of the manuscript.

Funding

This work has partially been funded by the Chalmers Energy Area of Advance through the profile area Energy in a Circular Economy.

Acknowledgments

The authors express their gratitude to SaltX Technology for valuable discussions.

Conflicts of Interest

The authors declare no conflict of interest.

Nomenclature

AhxHeat exchanger area
CCapital cost
CsteelCost of steel
C0Cost of reference
CFiCash flow in year i
C p , i Heat capacity of compound i
DbDiameter of the bed
DcycCyclone diameter
fScaling parameter
F i , i n Mass flow of compound i entering the reactor
F i , o u t Mass flow of compound i leaving the reactor
IncomeCCCarbon capture-derived income
m ˙ s t e a m Mass flow of steam
Pel:Electrical power
PfluidFluid pressure
PgasGas pressure
QcalcAvailable heat input to the calciner
QinNet heat input into the process
QoutHeat output
rDiscount rate
SEquipment size
S0Size of reference
tchargeCharging time
TreactorTemperature in the reactor
ugGas velocity
v i Stoichiometric coefficient of reactant i
VsteelVolume of steel
Wnet,chargeNet power in charging mode
Wnet,disNet power in discharging-only mode
WturbTurbine work
xcalcDegree of solids conversion in the calciner
xcarbDegree of solids conversion in the carbonator
Δ H R Reaction enthalpy
ΦSolids porosity, External heat flow
ηisIsentropic efficiency
ηTTotal efficiency
ξ Extent of reaction

Abbreviations

BESPBreakeven electricity selling price
CaLCalcium looping
CCSCarbon capture and storage
CEPCIChemical engineering plant cost index
CFBCirculating fluidized bed
ESPElectricity selling price
G-SGas-solids
HXHeat exchanger
LCOELevelized cost of electricity
NPVNet present value
O&MOperation and maintenance
PBPPayback period
S-SSolids-solids
TCESThermochemical energy storage
USDUnited States dollar
VREVariable renewable energy

References

  1. Stocker, T.F.; Quin, D. IPCC 2013: Climate Change 2013—The Physical Science Basis; Contribution of Working Group I to the Fifth Assessment Report of the Intergovernmental Panel on Climate Change; Cambridge University Press: Cambridge, UK, 2013. [Google Scholar] [CrossRef] [Green Version]
  2. International Renewable Energy Agency, IRENA. Global Energy Transformation: A Roadmap to 2050. 2019. Available online: https://www.irena.org/publications/2019/Apr/Global-energy-transformation-A-roadmap-to-2050-2019Edition (accessed on 7 February 2021).
  3. Johnsson, F.; Kjärstad, J.; Rootzén, J. The threat to climate change mitigation posed by the abundance of fossil fuels. Clim. Policy 2019, 19, 258–274. [Google Scholar] [CrossRef] [Green Version]
  4. IEA. World Energy Outlook (2020), Paris. 2020. Available online: https://www.iea.org/reports/world-energy-outlook-2020 (accessed on 23 February 2021).
  5. IEA. CCUS in Clean Energy Transitions, Paris. 2020. Available online: https://www.iea.org/reports/ccus-in-clean-energy-transitions (accessed on 23 February 2021).
  6. Boot-Handford, M.E.; Abanades, J.C.; Anthony, E.J.; Blunt, M.; Brandani, S.; Mac Dowell, N.; Fernández, J.R.; Ferrari, M.-C.; Gross, R.; Hallett, J.P.; et al. Carbon capture and storage update. Energy Environ. Sci. 2014, 7, 130–189. [Google Scholar] [CrossRef]
  7. Hirth, L. The market value of variable renewables. Energy Econ. 2013, 38, 218–236. [Google Scholar] [CrossRef] [Green Version]
  8. Steen, D.; Goop, J.; Lisa, G.; Shemsedin, N.; Brolin, M. Challenges of Integrating Solar and Wind into the Electricity Grid. 2014. pp. 94–107. Available online: http://publications.lib.chalmers.se/publication/210515-challenges-of-integrating-solar-and-wind-into-the-electricity-grid (accessed on 1 April 2021).
  9. Prasad, J.S.; Muthukumar, P.; Desai, F.; Basu, D.N.; Rahman, M.M. A critical review of high-temperature reversible thermochemical energy storage systems. Appl. Energy 2019, 254, 113733. [Google Scholar] [CrossRef]
  10. Pardo, P.; Deydier, A.; Anxionnaz-Minvielle, Z.; Rougé, S.; Cabassud, M.; Cognet, P. A review on high temperature thermochemical heat energy storage. Renew. Sustain. Energy Rev. 2014, 32, 591–610. [Google Scholar] [CrossRef] [Green Version]
  11. Carrillo, A.J.; González-Aguilar, J.; Romero, M.; Coronado, J.M. Solar Energy on Demand: A Review on High Temperature Thermochemical Heat Storage Systems and Materials. Chem. Rev. 2019, 119, 4777–4816. [Google Scholar] [CrossRef] [PubMed]
  12. Matthews, L.; Lipiński, W. Thermodynamic analysis of solar thermochemical CO2 capture via carbonation/calcination cycle with heat recovery. Energy 2012, 45, 900–907. [Google Scholar] [CrossRef]
  13. Tregambi, C.; Salatino, P.; Solimene, R.; Montagnaro, F. An experimental characterization of Calcium Looping integrated with concentrated solar power. Chem. Eng. J. 2018, 331, 794–802. [Google Scholar] [CrossRef]
  14. Zhao, M.; Minett, A.I.; Harris, A.T. A review of techno-economic models for the retrofitting of conventional pulverised-coal power plants for post-combustion capture (PCC) of CO2. Energy Environ. Sci. 2013, 6, 25–40. [Google Scholar] [CrossRef]
  15. Ortiz, C.; Valverde, J.; Chacartegui, R.; Perez-Maqueda, L.; Giménez, P. The Calcium-Looping (CaCO3/CaO) process for thermochemical energy storage in Concentrating Solar Power plants. Renew. Sustain. Energy Rev. 2019, 113, 109252. [Google Scholar] [CrossRef]
  16. Khosa, A.A.; Xu, T.; Xia, B.; Yan, J.; Zhao, C. Technological challenges and industrial applications of CaCO3/CaO based thermal energy storage system—A review. Sol. Energy 2019, 193, 618–636. [Google Scholar] [CrossRef]
  17. Ortiz, C.; Valverde, J.M.; Chacartegui, R.; Pérez-Maqueda, L.A.; Gimenez-Gavarrell, P. Scaling-up the Calcium-Looping Process for CO2 Capture and Energy Storage. KONA Powder Part. J. 2021, 38, 189–208. [Google Scholar] [CrossRef] [Green Version]
  18. Bayon, A.; Bader, R.; Jafarian, M.; Fedunik-Hofman, L.; Sun, Y.; Hinkley, J.; Miller, S.; Lipiński, W. Techno-economic assessment of solid–gas thermochemical energy storage systems for solar thermal power applications. Energy 2018, 149, 473–484. [Google Scholar] [CrossRef]
  19. Muto, A.; Hansen, T. Demonstration of High-Temperature Calcium-Based Thermochemical Energy Storage System for Use with Concentrating Solar Power Facilities. 2018. Available online: https://www.osti.gov/servlets/purl/1523643 (accessed on 5 March 2021).
  20. Socratces Project. 2021. Available online: https://socratces.eu/ (accessed on 5 March 2021).
  21. Flamant, G.; Benoit, H.; Jenke, M.; Santos, A.F.; Tescari, S.; Moumin, G.; Rodriguez, A.; Azapagic, A.; Stamford, L.; Baeyens, J.; et al. Solar processing of reactive particles up to 900 °C, the SOLPART project. AIP Conf. Proc. 2018, 2033. [Google Scholar] [CrossRef]
  22. Fenell, P.; Anthony, B. Calcium and Chemical Looping Technology for Power Generation and Carbon Dioxide (CO2) Capture, 1st ed.; Woodhead Publishing Series: Cambridge, UK, 2015; ISBN 9780857092434. [Google Scholar]
  23. Michalski, S.; Hanak, D.P.; Manovic, V. Techno-economic feasibility assessment of calcium looping combustion using commercial technology appraisal tools. J. Clean. Prod. 2019, 219, 540–551. [Google Scholar] [CrossRef]
  24. Mantripragada, H.C.; Rubin, E.S. Calcium Looping Cycle for CO2 Capture: Performance, Cost and Feasibility Analysis. Energy Procedia 2014, 63, 2199–2206. [Google Scholar] [CrossRef] [Green Version]
  25. Chacartegui, R.; Alovisio, A.; Ortiz, C.; Valverde, J.; Verda, V.; Becerra, J. Thermochemical energy storage of concentrated solar power by integration of the calcium looping process and a CO2 power cycle. Appl. Energy 2016, 173, 589–605. [Google Scholar] [CrossRef]
  26. Padula, S.; Tregambi, C.; Solimene, R.; Chirone, R.; Troiano, M.; Salatino, P. A novel fluidized bed “thermochemical battery” for energy storage in concentrated solar thermal technologies. Energy Convers. Manag. 2021, 236, 113994. [Google Scholar] [CrossRef]
  27. Champagne, S.; Lu, D.Y.; Macchi, A.; Symonds, R.T.; Anthony, E.J. Influence of Steam Injection during Calcination on the Reactivity of CaO-Based Sorbent for Carbon Capture. Ind. Eng. Chem. Res. 2013, 52, 2241–2246. [Google Scholar] [CrossRef]
  28. Yan, Y.; Wang, K.; Clough, P.T.; Anthony, E.J. Developments in calcium/chemical looping and metal oxide redox cycles for high-temperature thermochemical energy storage: A review. Fuel Process. Technol. 2020, 199, 106280. [Google Scholar] [CrossRef]
  29. Scala, F. Fluidized Bed Technologies for Near-Zero Emission Combustion and Gasification; Elsevier: Amsterdam, The Netherlands, 2013. [Google Scholar]
  30. Woods, R.D. Rules of Thumb in Engineering Practice; Wiley-VCH: Weinheim, Germany, 2007. [Google Scholar]
  31. Psarras, P.C.; Comello, S.; Bains, P.; Charoensawadpong, P.; Reichelstein, S.; Wilcox, J. Carbon Capture and Utilization in the Industrial Sector. Environ. Sci. Technol. 2017, 51, 11440–11449. [Google Scholar] [CrossRef]
  32. Criado, Y.A.; Arias, B.; Abanades, J.C. Calcium looping CO2 capture system for back-up power plants. Energy Environ. Sci. 2017, 10, 1994–2004. [Google Scholar] [CrossRef] [Green Version]
  33. Dixon, S.; Hall, C. Fluid Mechanics and Thermodynamics of Turbomachinery; Elsevier: Amsterdam, The Netherlands, 2014; ISBN 978-0-12-415954-9. [Google Scholar]
  34. De Lena, E.; Spinelli, M.; Gatti, M.; Scaccabarozzi, R.; Campanari, S.; Consonni, S.; Cinti, G.; Romano, M.C. Techno-economic analysis of calcium looping processes for low CO2 emission cement plants. Int. J. Greenh. Gas Control. 2019, 82, 244–260. [Google Scholar] [CrossRef]
  35. Muschelknatuz, U.; Muschelknatuz, E. Abscheideleistung von Rückführzyklonen in Wirbelschichtfeuerungen. VGB Kraftwerkstechnik 1999, 79, 58–63. [Google Scholar]
  36. Manzolini, G.; Macchi, E.; Gazzani, M. CO2 capture in Integrated Gasification Combined Cycle with SEWGS—Part B: Economic assessment. Fuel 2013, 105, 220–227. [Google Scholar] [CrossRef]
  37. Cinti, G.; Anantharaman, R.; De Lena, E.; Fu, C.; Gardarsdottir, S.; Hoppe, H.; Jamali, A.; Romano, M.; Roussanaly, S.; Spinelli, M.; et al. Cost of Critical Components in CO2 Capture Processes. 2018. Available online: https://www.sintef.no/globalassets/project/cemcap/2018-11-14-deliverables/d4.4-cost-of-critical-components-in-co2-capture-processes.pdf (accessed on 1 May 2021).
  38. DOE/NETL. Cost and Performance for Low-Rank Pulverized Coal Oxycombustion Energy Plants. Technical Report. 2010. Available online: https://www.globalccsinstitute.com/archive/hub/publications/119786/cost-performance-low-rank-pulverized-coal-oxycombustion-energy-plants.pdf (accessed on 1 April 2021).
  39. Walas, S. Chemical Process Equipment; Elsevier: Amsterdam, The Netherlands, 1988. [Google Scholar] [CrossRef]
  40. Pizzolato, A.; Donato, F.; Verda, V.; Santarelli, M.; Sciacovelli, A. CSP plants with thermocline thermal energy storage and integrated steam generator—Techno-economic modeling and design optimization. Energy 2017, 139, 231–246. [Google Scholar] [CrossRef]
  41. European Commission. Guide to Cost-benefit Analysis of Investment Projects: Economic Appraisal Tool for Cohesion Policy 2014–2020; European Commission: Brussels, Belgium, 2014. [Google Scholar] [CrossRef]
  42. Hanak, D.P.; Manovic, V. Economic feasibility of calcium looping under uncertainty. Appl. Energy 2017, 208, 691–702. [Google Scholar] [CrossRef] [Green Version]
  43. US Geological Survey. 2021. Available online: https://www.usgs.gov/centers/nmic/iron-and-steel-statistics-and-information?qt-science_support_page_related_con=0# (accessed on 2 April 2021).
  44. EU. Eurostat Electricity Price Statistics. Available online: https://ec.europa.eu/eurostat/statistics-explained/index.php?title=Electricity_price_statistics#Electricity_prices_for_non-household_consumers (accessed on 1 May 2021).
  45. Ortiz, C.; Romano, M.; Valverde, J.; Binotti, M.; Chacartegui, R. Process integration of Calcium-Looping thermochemical energy storage system in concentrating solar power plants. Energy 2018, 155, 535–551. [Google Scholar] [CrossRef]
  46. Rodriguez, N.; Alonso, M.; Grasa, G.; Abanades, J.C. Heat requirements in a calciner of CaCO3 integrated in a CO2 capture system using CaO. Chem. Eng. J. 2008, 138, 148–154. [Google Scholar] [CrossRef] [Green Version]
  47. Santos, J.J.; Palacio, J.C.; Reyes, A.M.; Carvalho, M.; Freire, A.J.; Barone, M. Concentrating Solar Power. Adv. Renew. Energies Power Technol. 2018, 373–402. [Google Scholar] [CrossRef] [Green Version]
  48. Ho, C.K. A review of high-temperature particle receivers for concentrating solar power. Appl. Therm. Eng. 2016, 109, 958–969. [Google Scholar] [CrossRef] [Green Version]
  49. Cormos, C.-C. Techno-economic implications of flexible operation for super-critical power plants equipped with calcium looping cycle as a thermo-chemical energy storage system. Fuel 2020, 280, 118293. [Google Scholar] [CrossRef]
  50. MacKenzie, A.; Granatstein, D.L.; Anthony, E.J.; Abanades, J.C. Economics of CO2 Capture Using the Calcium Cycle with a Pressurized Fluidized Bed Combustor. Energy Fuels 2007, 21, 920–926. [Google Scholar] [CrossRef]
Figure 1. Schematic of the relationships between the CaL process investigated in this work and the two nearby facilities. The dashed line demarcates the scope of the present work. Note that the CO2-depletted flue gas stream leaving the CaL process has not been included for simplicity.
Energies 14 03211 g001
Figure 2. Schematic of the investigated processes, shown in the form of a charging section and a discharging section with intermediate storage. The charging section is supplied by non-dispatchable high-temperature heat (e.g., from a concentrated solar collector) and the discharging section generates dispatchable electricity with a steam turbine. If included, the input and output of shipped solids would not alter the process layout; however, these parameters are not considered in the present study.
Energies 14 03211 g002
Figure 3. (a) Simplified energy flow of the process for the base case when both the charging and discharging sides are operating. (b) Details of the discharging side when the calciner is not operating. Note that the scheme has been simplified, such that recycling streams are not presented here and some of the losses have been merged.
Energies 14 03211 g003
Figure 4. Disclosure of the total costs (in %) of the base case process for different process sizes in terms of net heat inputs. The dots on top of the bars show the total cost (in M$) plotted on the secondary y-axis.
Energies 14 03211 g004
Figure 5. Computed plant cost and PBP of the process for different process sizes, ESP and IncomeCC.
Energies 14 03211 g005
Figure 6. Sensitivity of the plant cost to different degrees of conversion (xcarb) in the carbonator when expressed as BESP ($/MWh) or as capture cost ($/tCO2-captured). All other process parameters are set according to the base case.
Energies 14 03211 g006
Figure 7. BESP values and CO2 capture costs of the base case when the total cost of the CSP facility is considered (varied from 0 to 500 $/kWt).
Energies 14 03211 g007
Table 1. Main process assumptions, design options, and selected operation parameters. Parameters marked with an asterisk (*) are considered as the base case and are varied in the sensitivity analysis (Section 4). GS–HX, gas–solids heat exchanger; S–G, solids–gas; SS–HX, solids–solids heat exchanger.
ParameterValueUnit
Plant size as net heat input to the process, Qin50, 100 (*), 500, 1000MW
Charging time, tcharge12h/day
Percentage of steam in the calciner (mol basis)50 [15,27]%
Storage temperature20°C
Cooling water temperature20°C
Minimum temperature difference SS–HX20°C
Minimum temperature difference GS–HX15°C
Minimum temperature difference condensers15°C
S–G heat transfer coefficient480 [29]W/m2K
Fluid–fluid heat transfer coefficient1500 [30]W/m2K
Flue gas CO2 content15 [31,32]%v
CO2 capture rate90 [31,32]%
Available cooling water discharge temperature 70°C
Cooling water pumping distance1000m
Solids porosity, Φ0.5 [18]-
Turbomachinery isentropic efficiency, ηis0.89 [33]-
Fraction of discharged solids preheated in the SS–HX0.85 [25]-
Degree of conversion in the calciner, xcalc1 [25]-
Degree of conversion in the carbonator, xcarb0.15, 0.25 (*), 0.5, 0.7 [17]-
Solids conveying energy requirement10 [25]MJ/t/100 m
Equivalent solids conveying length100 [25]m
Table 2. Capital cost functions (in M$) of the equipment used in the study. Heat flows are given in [MWth], diameters in [m], velocities in [m/s], areas in [m2], pressures in [bar], volumes in [m3], mass flows in [kg/s], electrical powers in [kW], and mechanical works in [MW].
EquipmentCost FunctionReference
Calciner C = 5.87 · 10 2 · ( Q c a l c 2514 ) 0.67 [38]
Carbonator C = 5.60 · 10 2 · ( Q o u t 1521 ) 0.67 [38]
Gas–solids heat exchanger C = 3.98 · 10 9 · D c y c 2 + 2.73 · 10 6 · D c y c + 0.016 [34]
Solids–solids heat exchanger C = 2 · 3.5 · 10 1 · ( D b · u g 2 ) 0.73 [30]
Gas–gas heat exchanger C = ( 2546.9 · A H X 0.67 · P g a s 0.28   ) · 10 6 [23]
Cooler C = ( 2546.9 · A H X 0.67 · P f l u i d 0.28   ) · 10 6 [23]
Solids Storage C = V s t e e l · C s t e e l [18]
Steam turbine C = 473 · 10 6 · ( W t u r b 25 ) 0.67 [40]
Electric generator C = 84.5 · 10 6 · ( P e l · 10 3 ) 0.95 [23]
Steam generator C = 2.85 · ( m ˙ s t e a m 14 ) 0.35 [30]
Pump C = ( P e l 197 ) 0.60 [23]
Table 3. Main assumptions and input data for the economic analysis. Values indicated with an asterisk (*) are considered the base case and are varied in the parametric study (Section 4).
Parameter (Unit)Value
Plant lifetime (years)20 [41]
Capacity factor (%)100 (*), 70, 80 [42]
Discount rate (%)4.75 (*), 6.75, 8.75 [41]
Limestone cost ($/t)10 (*), 20, 50 [42]
Steel cost (Csteel) ($/m3)5000 [43]
Carbon capture-derived income (IncomeCC) ($/t)10, 50 (*), 100 [31]
Electricity selling price (ESP) ($/MWh)20, 40 (*), 80 [44]
Table 4. BESP (in $/MWh) of the 100 MW base case when independently varying the capacity factor, discount rate and limestone cost according to Table 3.
Parameter NominalVariation 1Variation 2
Capacity factor (100, 70, 80) [%]83129162
Discount rate (4.75, 6.75, 8.75) [%]83116152
Limestone cost (10, 50, 100) [$/t]838384
Publisher’s Note: MDPI stays neutral with regard to jurisdictional claims in published maps and institutional affiliations.

