1. Introduction
Proton exchange membrane fuel cell (PEMFC) is a kind of device that converts chemical energy in hydrogen directly into electrical energy. Its working principle can be concluded as the oxidation–reduction reaction of hydrogen and oxygen to generate electrons, and the transmission of electrons to form current [
1,
2]. The rate and degree of this process determine the performance of PEMFC, while the process is controlled by the coupling of multiple parameters [
3,
4,
5].
The research on the influencing factors of PEMFC performance has always been a hot spot [
6,
7,
8]. Abdallah et al. [
9] obtained the optimal design parameters of PEMFC, which enables the best performance by comparing the power density curves of 30 kinds of cross-sectional flow channels under the same conditions. Zhao et al. [
10,
11] focused on the structural parameters of pore structures in PEMFCs and how to impact the mass transport and performance of PEMFCs. In addition to the inherent design parameters of PEMFC, the effect of the working conditions such as temperature and pressure on the performance of PEMFC also cannot be ignored [
12,
13]. In the research of [
14,
15,
16], the influence of dozens of environmental parameters on the performance of PEMFC was analyzed. However, the above research did not fully study all the parameters that affect the performance of PEMFC. These parameters interact to jointly control the internal reaction of PEMFC, which makes the optimization of PEMFC performance very complicated and cumbersome.
It can be noted that there are orders of magnitude difference in the degree of influence of different parameters on the performance of PEMFC [
17,
18,
19]. Ghasabehi et al. [
20] compared the effects of different operating parameters on the output power of fuel cells, then found the most effective cathode stoichiometric factor. According to the explanation in [
21], the study is called sensitivity analysis of parameters, which describes the impact of parameter deviations on performance fluctuations’ amplitude. It is necessary to analyze the sensitivity of the control parameters before starting performance optimization, because not only can the insensitive parameters be excluded according to the order of sensitivity, but also the parameter setting range that can improve the performance can be found according to the changing trends of polarization curves, which ultimately reduce the optimization workload [
22]. Sensitivity analysis includes local sensitivity analysis (LSA) and global sensitivity analysis (GSA). GSA examines the overall impact of changes in multiple parameters on the results of the model operation and analyzes the impact of each parameter and its interaction on the model results [
23], while with LSA, the basic principle is the controlled variable method, that is, one of the parameters is considered as the object of analysis, whereas the others are considered as constants. Vetter et al. [
24] used the GSA and LSA simultaneously to list the comprehensive ranking of model parameters, which can predict the behavior of the fuel cell under unknown conditions. When the parameters of sensitivity analysis are few, similar results can be obtained by these two analyzed methods. Compared with GSA, LSA requires less simulation. Therefore, LSA was employed in this study to analyze the sensitivity analysis of PEMFC parameters.
Before analyzing the sensitivities of parameters, it is necessary to combine and rank the analyzed parameters to choose the adequate fluctuated ranges of parameters. Jin et al. [
25] used the Box–Behneken design (BBD) method to select the optimal combination conditions of parameters; however, it requires multiple simulations before sensitivity analysis. To save computational resources, the fluctuated ranges of working parameters are calibrated by experience. Local sensitivity analysis based on control variable method has been mentioned in many studies about sensitivity analysis [
26,
27,
28]. Min et al. [
29] considered 11 parameters, including porosity and diffusion coefficient, and classified these parameters according to the sensitivity indexes obtained by their corresponding polarization curves. Moreover, it can be found that parameters of the cathode side have a more sensitive effect on performance than the anode side. However, there is no specific analysis process in the literature, and these conclusions are only obtained by observing the changes of these polarization curves. This judgment method will cause errors, that is, the uncertainty mentioned in [
30]. Therefore, sensitivity analysis and uncertainty analysis of parameters must usually be carried out synchronously. Sobol et al. [
31] introduced the application of Monte Carlo method in sensitivity analysis of nonlinear mathematical model in detail. On the basics of the analysis method proposed by Zhao et al. [
32], Monte Carlo method and the concept of sensitivity index [
29] were introduced into the study, and then the sensitivity analysis of five design parameters and five performance parameters of PEMFC was carried out, so that the obtained conclusions could be supported by data. Nevertheless, it can be found in the study of Chen et al. [
33] that when the current density increases from 200 A/cm
2 to 1200 A/cm
2, the output voltage, the average oxygen concentration, and the deviation of the oxygen concentration distribution are used as evaluation indicators to obtain completely different sensitivity rankings of parameters. Therefore, huge errors will be caused if the sensitivity of parameters is roughly divided according to only one current load mode. Focused on the shortcomings in previous workings, a three-dimensional, non-isothermal fuel cell model and some innovations are employed in this paper.
To make the obtained sensitivity indexes comparable, this paper combined with the actual operating conditions to uniformly delineate the calibration parameters and their fluctuation ranges before starting the sensitivity analysis. Moreover, a reliable parameter sensitivity assessment method was designed.
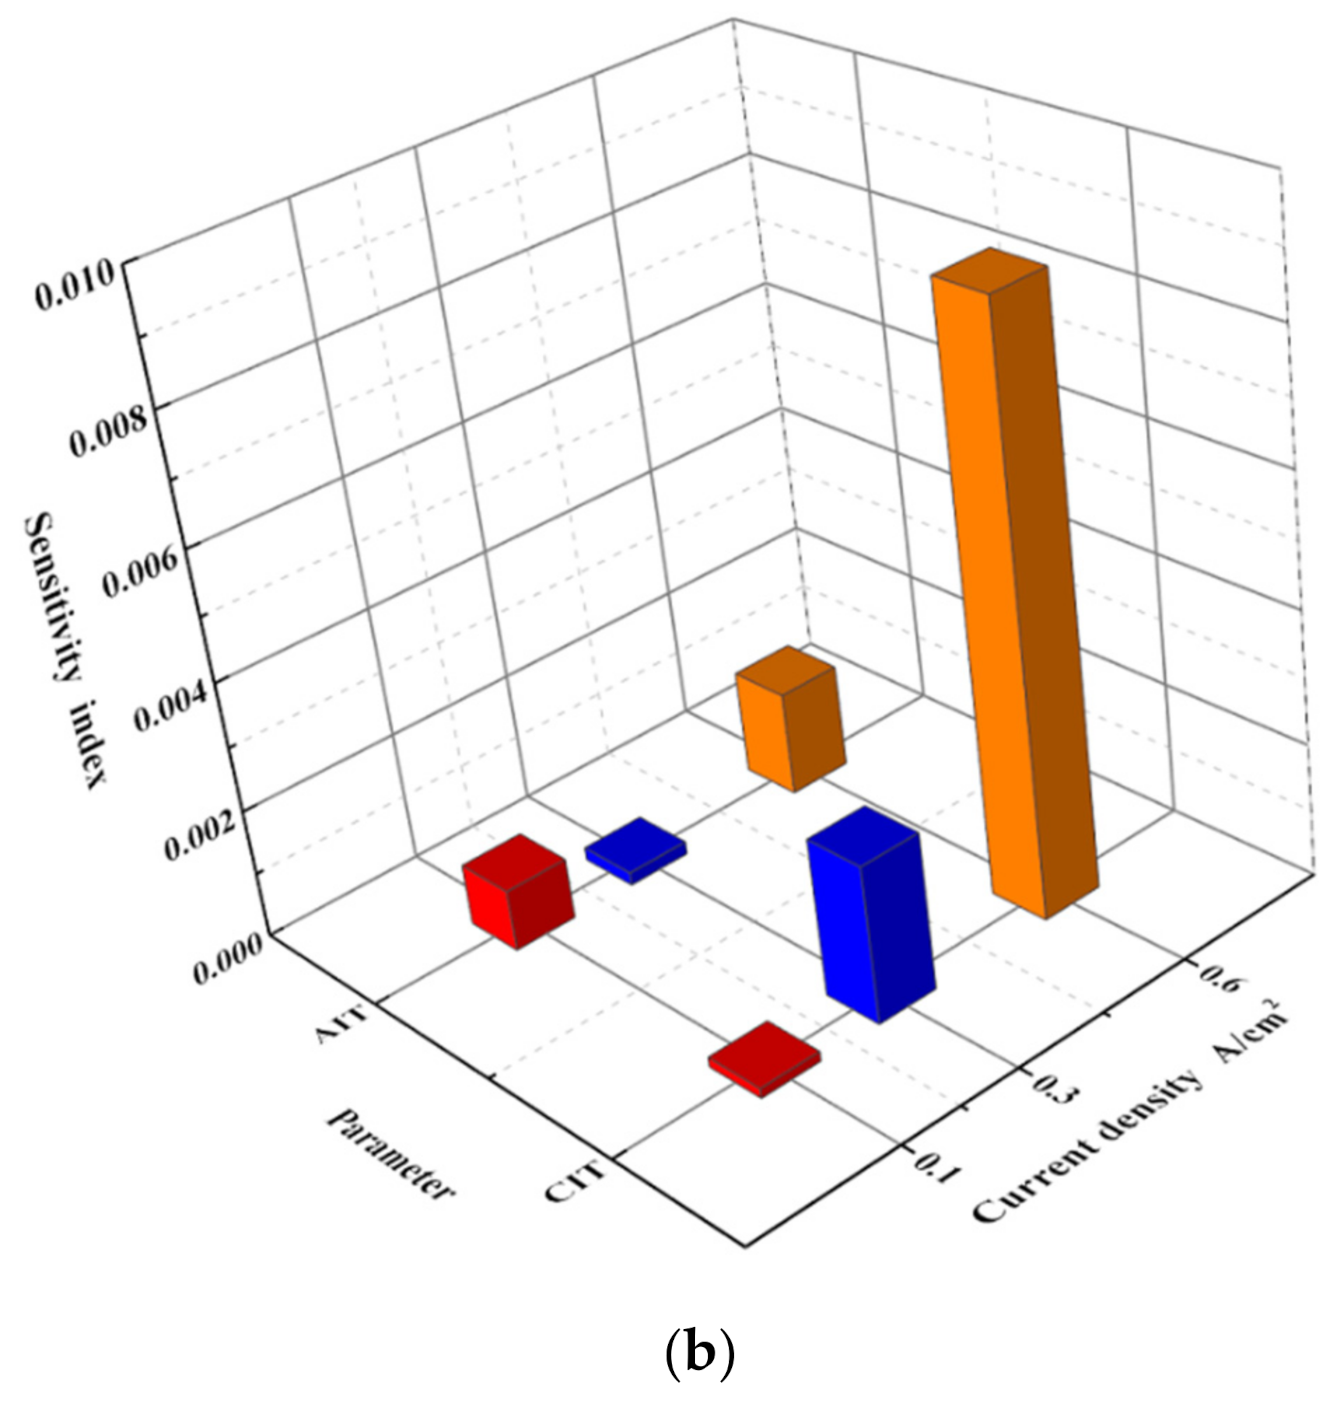
The Monte Carlo method was adopted to quantitatively analyze the parameters, which have little effect on the output performance (failed to judge by the deviation percentages) under calibration conditions. The parameter sensitivity rankings under specific current density were obtained.
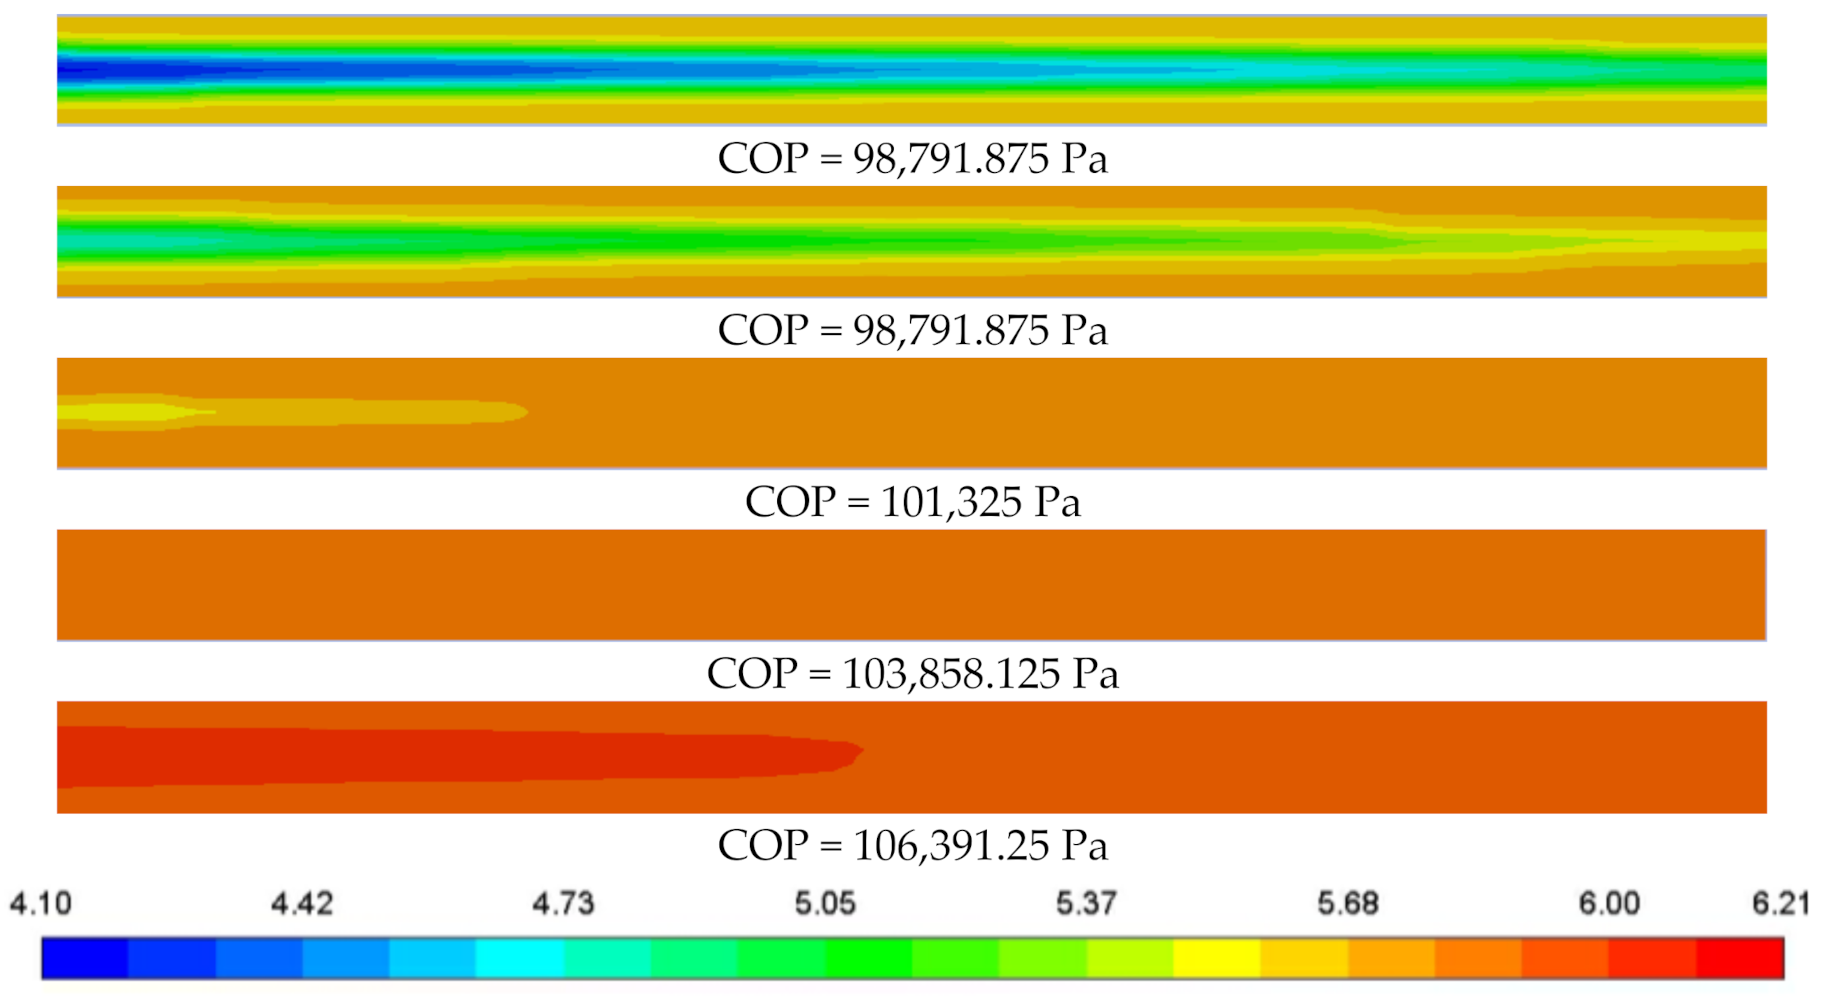
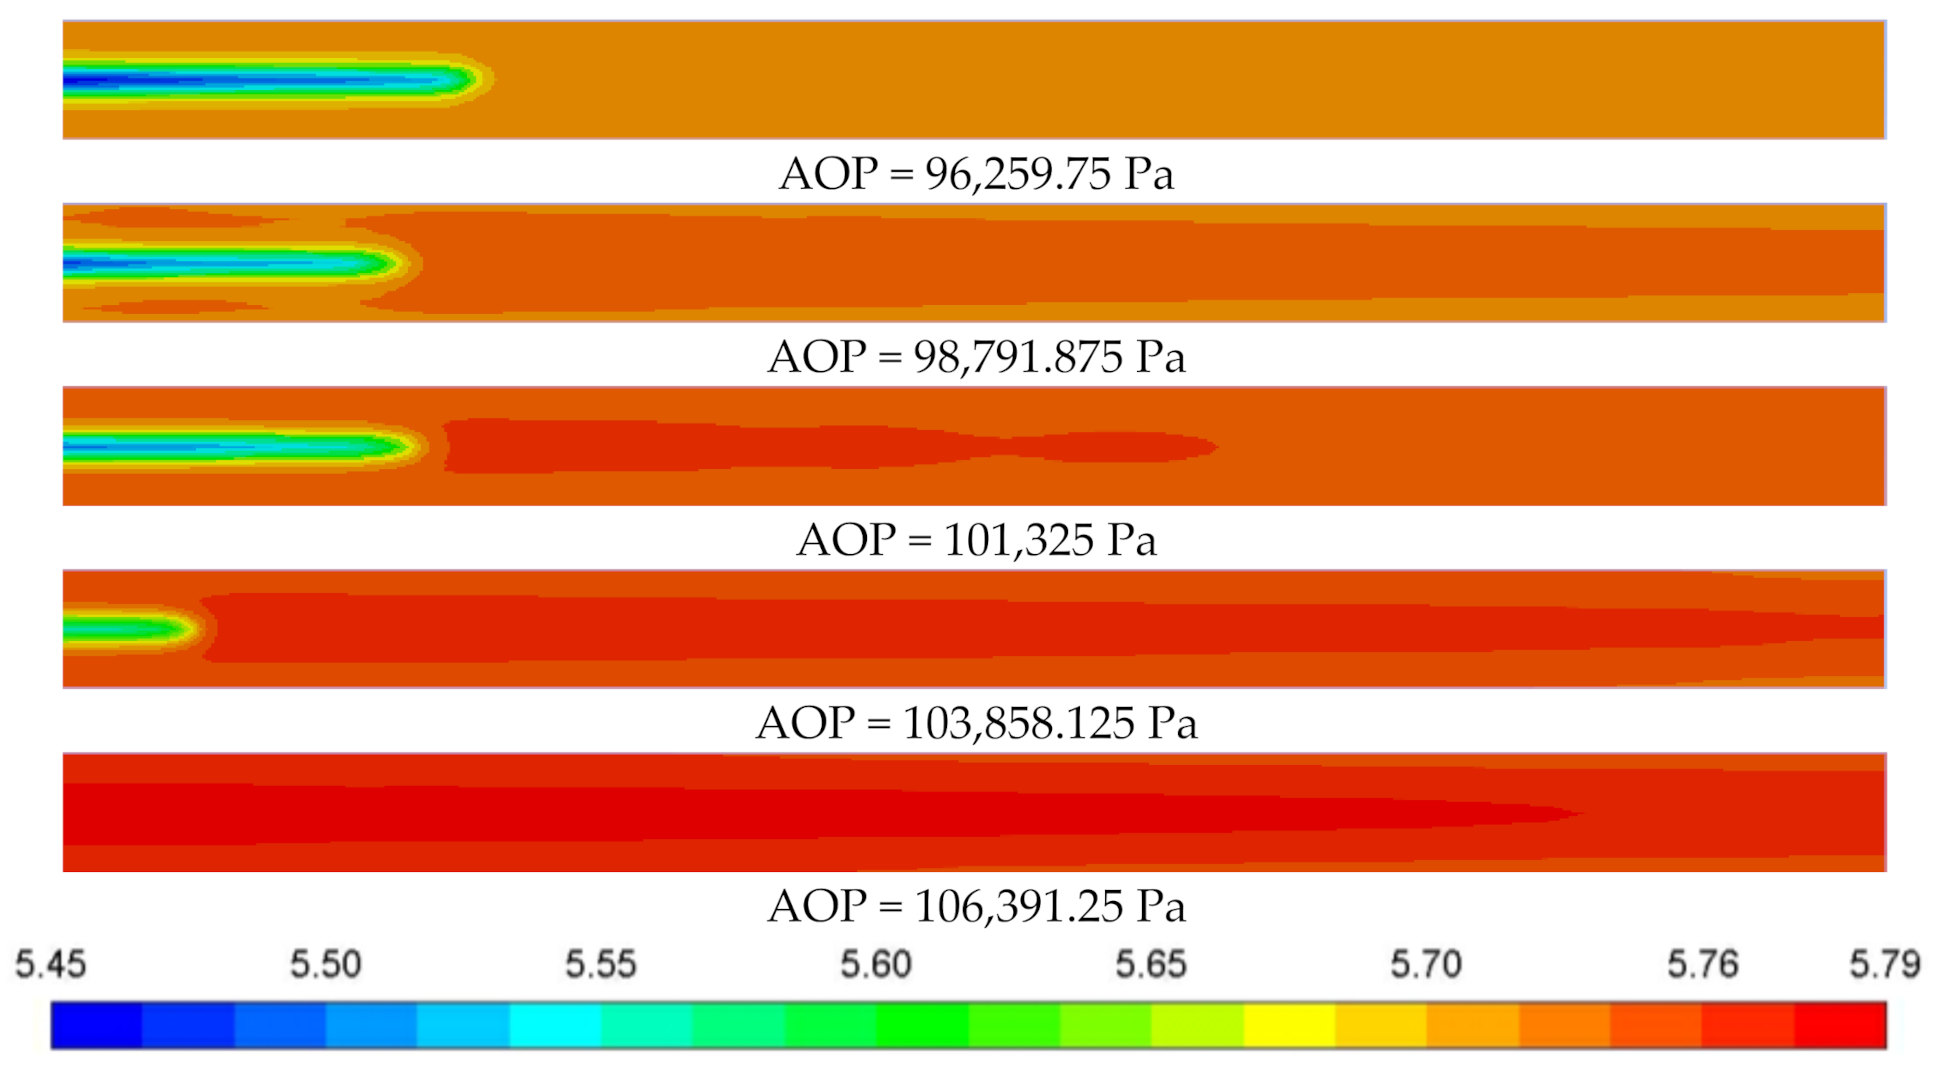
In addition to determining the impact of single parameter fluctuations on the output voltage, the water content distribution cloud maps of the contact surface between anode side catalyst layer (CL) and membrane are used to prove the improvement/deterioration of PEMFC performance, which can intuitively explain the phenomena.
Finally, according to the sensitivity indexes, the parameters were classified as insensitive, sensitive, and highly sensitive. The results provide a reference for the optimization of PEMFC and the controls of operating parameters.
2. Description of Model
2.1. Governing Equation
In [
34], the equations of conservation of mass, momentum, energy, species, and charges were summarized into a general convection–diffusion equation, as follows:
However, this equation is applicable in the steady state. In this study, an unsteady state model was constructed. Thus, a new general governing equation may be formulated, as follows:
where
and
refer to nominal density and pressure, respectively,
is a general variable and the velocity vector is represented by
. The symbols
,
,
, and
for various equations are listed in
Table 1.
2.2. Electrochemical Reaction Model
After describing the phenomena of mass transfer, heat transfer, and electricity transfer in PEMFC using the governing conservation equation, the electrochemical reaction model of the cathode catalyst layer was constructed. According to Dickinson et al. [
35], most PEMFC models use the Butler–Volmer equation to describe the electrode kinetics:
where
and
represent the transfer coefficients of the reduction and oxidation reactions, respectively. F,
T and R represent the Faraday, temperature, and gas constants, respectively.
E denotes the electrode potential and
Er refers to the equilibrium potential; the difference between them is referred to as the overpotential, which is usually represented by
, see Equations (4) and (5).
The overpotential of the anode is positive, which refers to electrons moving away from the electrode. Similarly, the value obtained from Equation (5) is negative. For the anode and cathode reactions to occur in the fuel cell, the Butler–Volmer equation is also effective:
where
is the reference exchange current density per effective surface area (A/m
2),
is the activation area ratio (1/m),
and
represent the ratio of the local component concentration to the reference value in the anode and cathode, respectively,
refers to the concentration index,
and
are the anode and cathode charge transfer coefficients of the reduction reaction, respectively,
and
express the anode and cathode charge transfer coefficients of the oxidation reaction.
2.3. Membrane Electrode Water Transport Model
The following transport equation describes the membrane electrode liquid water saturation:
where
is the liquid water saturation, which characterizes the ratio of the volume occupied by the liquid water to the volume of the void in the porous medium of the membrane electrode.
, and
, refer to the relative mobility of liquid water, the molar mass of liquid water, electrolyte phase current density, liquid water density, and gaseous water density, respectively.
is the capillary diffusion coefficient of liquid water and is defined by the following Equation:
In this equation,
, and
represent the liquid water permeability, capillary pressure, dynamic viscosity of liquid water, and source term of water phase transition, respectively;
is defined as
where
represents the mass fraction of water vapor on the proton membrane surface and
and
are the condensation of water and evaporation rate coefficients, respectively. The latent heat of phase transition in water is expressed as
where
hc is the latent heat of phase transition in water.
The water content in the membrane is maintained in a dynamic equilibrium state, which is essential for managing the water content in the fuel cell under working conditions. When the cell is working, the water content in the membrane is determined using water transport by the membrane. Water can be transported in four ways in a proton membrane: through ionic conduction, electroosmotic drag, back-diffusion, and hydraulic permeability.
As one of the most significant parameters within the PEM, the proton conductivity is always represented by the symbol
(S/cm), which is used to evaluate the transport capacity of the protons. The proton conductivity of the PEM materials with resistance can be expressed as
where
RS refers to the overall impedance of the membrane samples,
is the distance between the reference electrodes, and
S is the cross-sectional area of the membrane samples.
Electroosmotic drag is caused by the anode side of the polar water molecules and proton hydration, and (
) is formed. The water molecules migrate from the anode to the cathode side with protons, and the corresponding water migration flux caused by the electroosmotic dragging of the proton membrane can be expressed as
where
and
are the current density and water content of the membrane, respectively.
is the electroosmotic drag coefficient, which represents the number of water molecules carried by each proton (dragged) transported.
is a function of the proton membrane water content (
) and can be expressed by the following widely used empirical expression:
The reverse diffusion water transfer flux is related to the water concentration gradient on both sides of the proton membrane [
36,
37]:
where
represents the diffusion coefficient of water molecules in the membrane and
is the water concentration gradient, which is distributed on both sides of the proton membrane.
As one of the water transport methods within the membrane, hydraulic permeability is caused by the pressure difference between the anode and cathode. Compared to other transport mechanisms, the amount of water transferred through hydraulic permeability is at least one order of magnitude lower [
38]. Therefore, the impact of this parameter is ignored in this paper. The source terms of various governing equations are listed in
Table 2.
2.4. Boundary Conditions and Material Properties
The Dirichlet boundary condition was applied in this simulation.
- (1)
Anode/cathode adopted mass flow inlet (AMFR/CMFR): was used to define the mass fraction of each component of the reaction gas at the inlet.
- (2)
Channel outlet employed pressure outlet: was used to define the anode and cathode pressures, respectively. Moreover, anode operating pressure (AOP) and cathode operating pressure (COP) are usually controlled by back pressure of PEMFC.
- (3)
The voltage or current density of the fuel cell model was set at the bipolar plate surface; the potential on the surface of the end plate of the anode and cathode bipolar plates can be expressed as .
- (4)
The no-slip wall boundary was applied to the wall interface between the fluid and solid computing domains.
- (5)
The operating temperature (COT) is expressed by the wall temperature of PEMFC [
9,
39], which can be independent of the anode inlet temperature (AIT) and cathode inlet temperature (CIT).
Properties of reactants:
- (1)
Stoichiometric ratio of hydrogen to air (excess coefficient):
In a fuel cell that uses high-purity hydrogen (99.999%) as fuel and air as oxidant, the excess coefficient of the anode can be expressed as
where
is the actual flow supplied by the anode hydrogen and
represents the theoretical demand flow when the target refers to the current density.
Similarly, the cathode excess coefficient can be expressed as
- (2)
Relative humidity:
To decrease the ohmic resistance, humidifying the reactant gas is necessary. The relative humidity (
RH) is usually used to characterize the degree of inlet humidity and can be defined as
where
refers to the saturated vapor pressure corresponding to the humidification temperature of the gas inlet and
is the saturated vapor pressure corresponding to the operating temperature of cell.
2.5. Geometric Model and Meshing
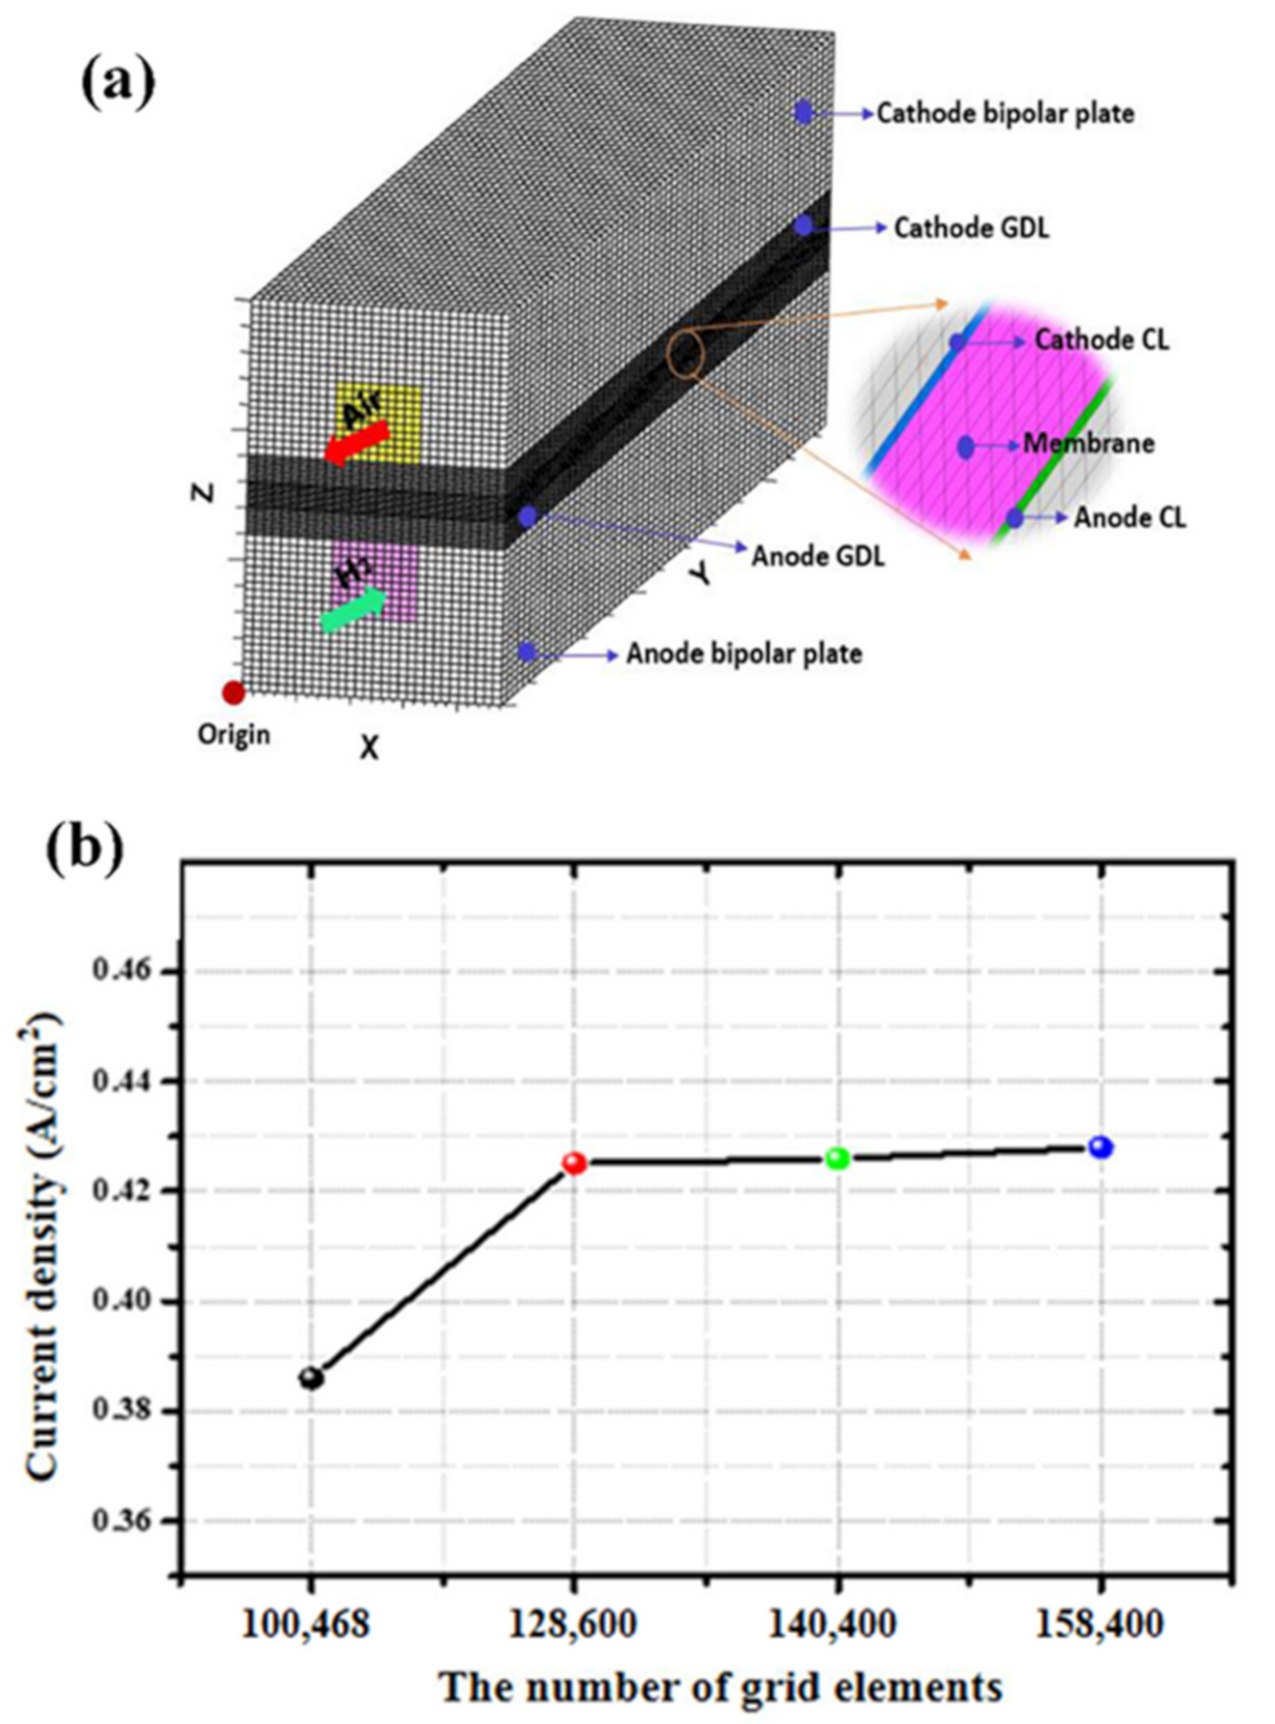
At least nine computational fields exist in a three-dimensional model of a complete PEMFC—bipolar plates sites in the cathode and anode, respectively, cathode/anode flow channels, cathode/anode gas diffusive layers (GDL), cathode/anode catalyst layers (CL), and the proton exchange membrane (PEM). Owing to the feature of parallel channel symmetry, to reduce the amount of calculation, half of a complete PEMFC model with a single straight flow channel was truncated along the symmetric plane. A 3D model design software known as UG (Unigraphics NX, developed by Siemens) was used in this study, and the computational domain model covered all directions. In this study, the grid division strategy of a regular hexahedral structure was adopted; compared to unstructured grids such as tetrahedral prisms, it calculates quickly, converges easily, and controls the grid nodes conveniently.
Meshing in ICEM is depicted in
Figure 1a. Four sets of regular hexahedral structural grids were prepared with the number of grid elements 100,468, 128,600, 140,400, 158,400 to validate the grid independence. The current density under the given working voltage can comprehensively reflect the degree of electrochemical reaction inside the cell, the multicomponent transportation of the reaction gas, and the performance of charge travel. Thus, this study validated the grid independence with the current density corresponding to the operating voltage of 0.7 V under certain working conditions, which set the intake and exhaust pressures of the cathode/anode as 2 atm, operating temperature as 80 °C, and humidity as 100%, as depicted in
Figure 1b. The current density corresponding to the number of grid elements, 100,468, was approximately 0.386 A/cm
2; the number of grid elements should be avoided because of its larger deviation compared to other grids. Comprehensively considering the computational stability and efficiency, the number of grid elements of 140,400 was eventually elected as the calculated number of grid elements. The details of the configuration are presented in
Table 3.
4. Conclusions
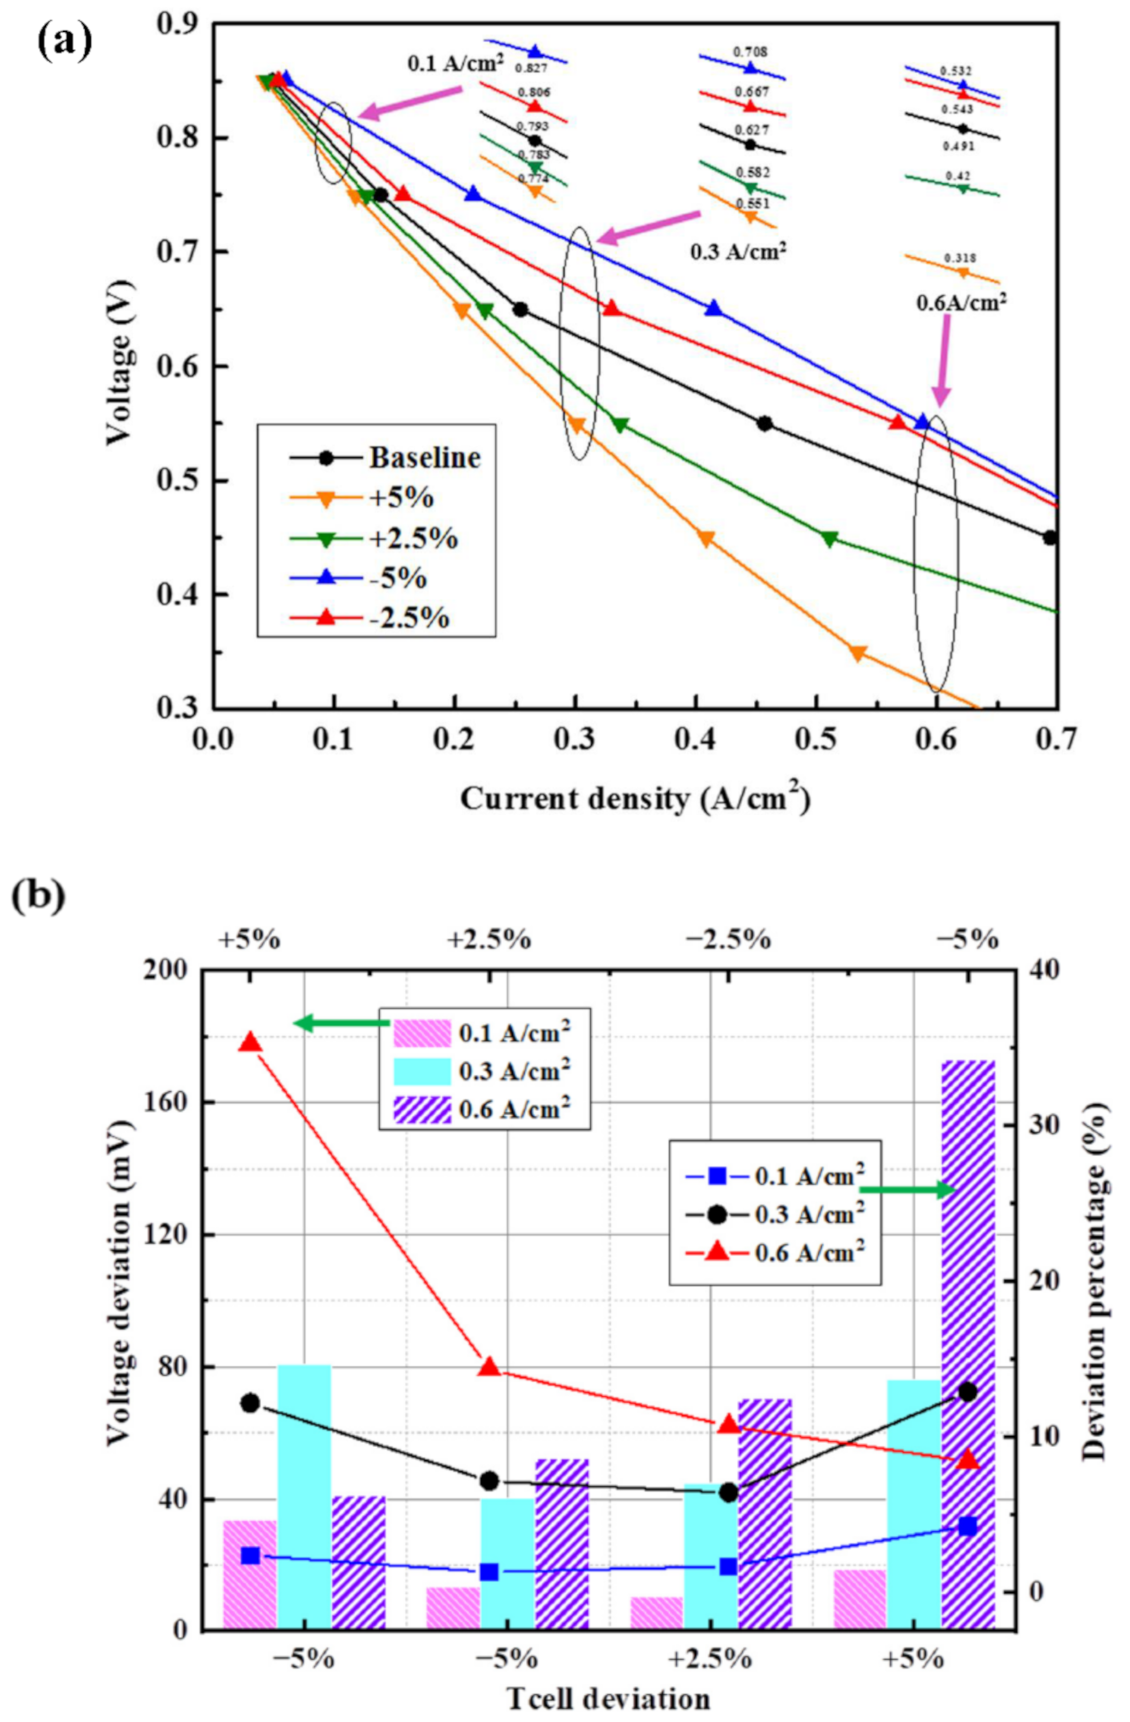
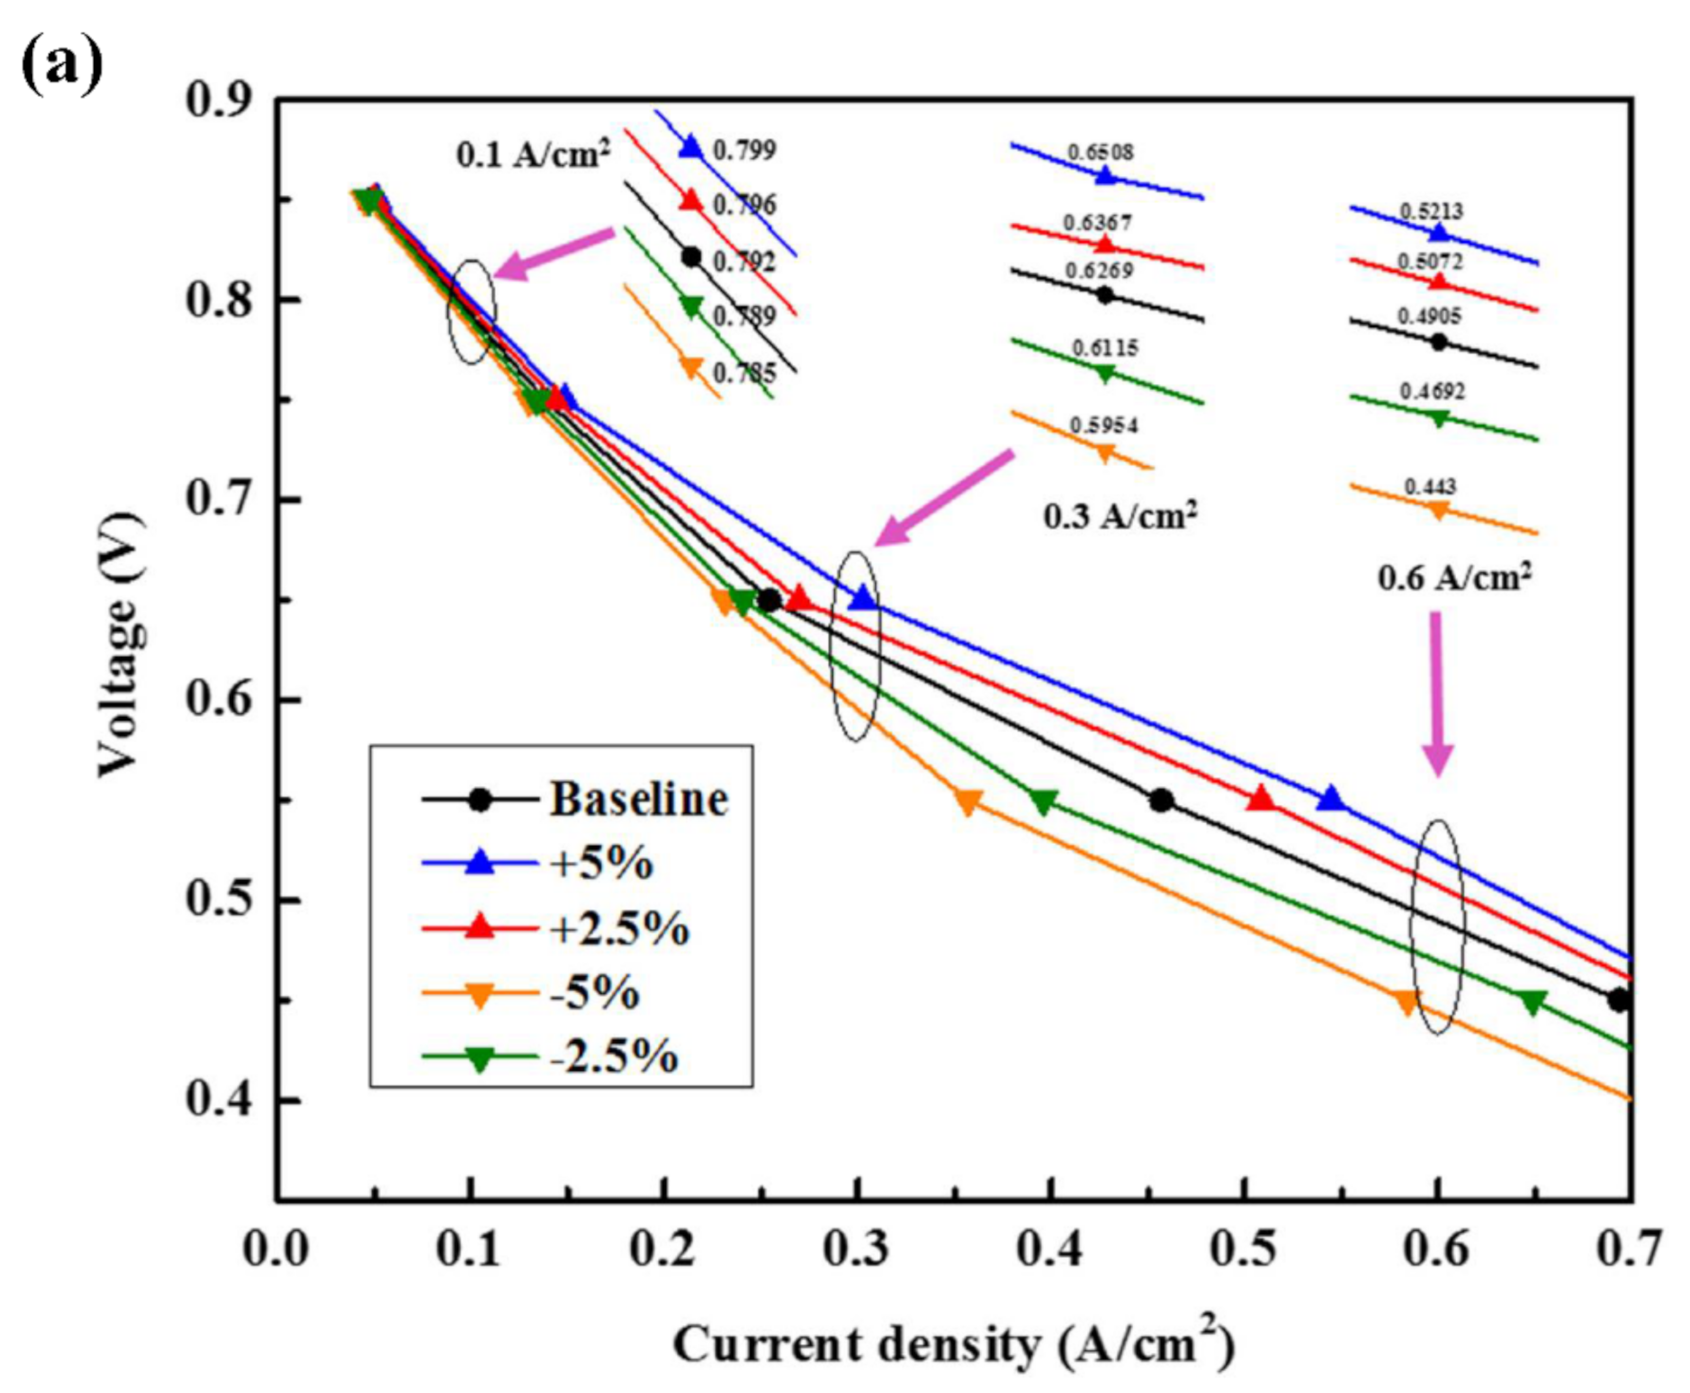
A set of unified parameter fluctuation ranges and evaluation methods, which were combined with the actual operating conditions of PEMFC, has been constructed in this study to avoid the evaluation errors caused by inconsistent standards and to make the results meaningful. The simulation was conducted in a 3D, non-isothemal PEMFC model. Furthermore, a multiparameter sensitivity analysis method combined with the Monte Carlo method was used to evaluate the sensitivity of the working parameter fluctuations (±5%) to the output performance. Among these parameters, the temperature of the cell is the most sensitive under all working conditions and the sensitivity far exceeds other parameters. However, within the range of deviation, the inlet temperature in both the anode and the cathode has a minimal impact on the output voltage. Moreover, with the increase in current density, the sensitivity indexes of the working pressures in both the anode and the cathode increase, whereas those of the mass flow rate of the anode/cathode change disorderly. Generally, the cathode parameters are more sensitive than the anode parameters, especially under high current density. These results provide a reference for the performance optimization of the PEMFC and a control strategy for the operational parameters.
In future studies, the interaction between the parameters will be considered in order to analyze a more complete working process of the PEMFC.


