A Novel Arc Detection Method for DC Railway Systems


1
Department of Electronic and Electrical Engineering, University of Strathclyde, Glasgow G1 1XQ, UK
2
Synaptec Ltd., Glasgow G1 1XW, UK
3
Federal Institute of Metrology METAS, Lindenweg 50, 3003 Bern-Wabern, Switzerland
*
Author to whom correspondence should be addressed.
Energies 2021, 14(2), 444; https://doi.org/10.3390/en14020444
Submission received: 7 December 2020
/
Revised: 5 January 2021
/
Accepted: 12 January 2021
/
Published: 15 January 2021
(This article belongs to the Special Issue Power Quality in Electrified Transportation Systems)
Abstract
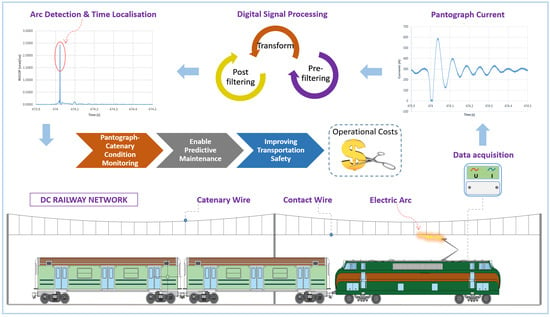
:Electric arcing due to contact interruption between the pantograph and the overhead contact line in electrified railway networks is an important and unwanted phenomenon. Arcing events are short-term power quality disturbances that produce significant electromagnetic disturbances both conducted and radiated as well as increased degradation on contact wire and contact strip of the pantograph. Early-stage detection can prevent further deterioration of the current collection quality, reduce excessive wear in the pantograph-catenary system, and mitigate failure of the pantograph contact strip. This paper presents a novel arc detection method for DC railway networks. The method quantifies the rate-of-change of the instantaneous phase of the oscillating pantograph current signal during an arc occurrence through the Hilbert transform. Application of the method to practical pantograph current data measurements, demonstrates that phase derivative is a useful parameter for detecting and localizing significant power quality disturbances due to electric arcs during both coasting and regenerative braking phases of a running locomotive. The detected number of arcs may be used to calculate the distribution of the arcs per kilometre as an alternative estimation of the current collection quality index and consequently used to assess the pantograph-catenary system performance. The detected arc number may also contribute to lowering predictive maintenance costs of pantograph-catenary inspections works as these can be performed only at determined sections of the line extracted by using arcing time locations and speed profiles of the locomotive.
1. Introduction
Smooth dynamic interaction between the contact strip of the pantograph and the overhead contact line (OCL) is important for the safe and efficient performance of electrical train transportation services. A reliable contact contributes to minimising short-term power quality events and establishing good quality current collection to power the train [1,2]. Indeed, a continuous mechanical sliding contact distinguishes high and poor quality current collection performance [3,4,5,6]. However, it is unlikely that continuous contact can be maintained for an entire train journey due to mechanical oscillations of the train [7], horizontal zigzag movement of the pantograph [8], and faults or incorrect adjustment in the pantograph operating system [9]. Therefore, contact interruption between pantograph and OCL will occur leading to arcing phenomena which in turn causes a number of unwanted issues such as: conducted short-term power-quality events; current flow disturbances; undesirable radiated electromagnetic emissions [7,8,10,11,12]; increased temperature at contact points [13]; increased wear on contact wire and contact strip of the pantograph [3,8,12], and electric micro-welding phenomena [6]. It is worth mentioning that continuous and steady development of wear on the contact wire and contact strip of a pantograph can damage the pantograph frame and the contact strip, deteriorate the quality of current collection, and result in serious consequences leading to service interruption [8].
Standard EN 50367 [2] considers either the measured vertical contact force exercised by the pantograph to OCL or the percentage of arcing (ratio between the total duration of all arcs to the total run time) as an assessor of pantograph current collection quality. Therefore, arc detection in railway electrical networks, including their geographical localisation and characterization in terms of time duration, are fundamental for the assessment of the contact wire lifetime, pantograph lifetime and consequently for the entire safety and performance of the train transportation service. Furthermore, arc detection and characterization has a direct impact on lowering the cost of periodical maintenance which can often be expensive [14,15]. Due to the relevance of arcs and the impact on general power quality in electrified transportation services, much effort has been devoted to arc identification techniques by the research community.
In general, arc detection techniques can be grouped into three main categories: those based on image processing of recorded videos; those based on emission evaluation of physical quantities such as light, temperature and radiated electromagnetic field; and those based on the processing of electrical quantities such as voltage and current signals. In this context, [14] proposed the usage of image processing algorithms to detect arcs occurring in a pantograph-catenary system. This method requires a video camera to be installed close to the pantograph. Video frame images are processed by an algorithm in order to detect pantograph movement with changes in the surrounding background of the processed images attributed to arc occurrence. Reference [16] proposed the application of threshold values to binary converted frame images, where the evaluated ratio of white pixels to black pixels is considered as an index of arc occurrence.
Barmada et al. [15], initially proposed the use of a Support Vector Machine (SVM) based classification algorithm to detect the presence of arcs. Extracted features of pantograph recorded voltage, pantograph current, and signals from phototube sensors were used to support the proposed algorithm. The method has been shown to achieve an arc detection accuracy of 80%. Later on, Bermada et al. [17], proposed the use of clustering techniques to detect arcs by considering only the current signals, this avoiding the deployment of phototube sensors. Current signals were processed and grouped in 4 classes which indicate both the presence and magnitudes of the detected arcs.
In reference [18], the authors developed a new arc detection technique by analysing the recorded locomotive current. It was observed that arc occurrence causes significant injection of a DC component into the AC current signal, due to increased disturbances in the transformer magnetizing circuit. This proposed method requires accurate knowledge of the network infrastructure and the speed of the running train in order correlate and distinguish DC components caused by other factors, for example by the presence of phase separation sections. As a consequence, the method cannot be successfully applied for arc detection in cases when trains cross multiple power separation sections [19], and for example, when crossing borders from one country to another within Europe [20,21].
Light emission (ultraviolet emission) produced by arcs and measured by phototube sensors has been proposed in [4] as an appropriate measurement system for arc detection. Similarly, in Standard EN 50317 [1], a light detector for measuring predefined light wavelengths emitted by copper material under arcing is proposed. Despite the fact that an additional measurement sensor is needed, the proposed technique requires different sensors or sensors with appropriate wavelength tuning due to different material-to-material emission characteristics. For example when trains need to travel from one particular section characterised by copper contact wire material, to another section characterised by aluminium alloys or aluminium conductor steel reinforced contact wires [3], or for example when trains enter tunnels, and an aluminium overhead conductor rail substitutes a traditional copper contact wire [18].
Significant temperature changes developed at the contact point between pantograph strip and OCL occur during arc occurrence has been exploited by the proposed method in [13] for monitoring the current collection quality of a pantograph-catenary system. Images from a thermal camera installed close to the pantograph continuously recorded and fed a number of arc detection image processing algorithms. The temperature of the contact point was identified by using an edge detection algorithm (Canny algorithm), and the Hough transform for continuous detection of OCL movement. The main issue with this particular method appears to be the high computational burden.
Reference [22] proposes a new method for arc detection by analyzing the spectral content of the electromagnetic field radiation caused by the arc occurrence. The radiated signals were captured by an antenna and processed for the determination of possible characteristic radiated frequencies. A wide range of measured frequencies were observed in relation to arc occurrence with the main peak located around 18 MHz. A possible limitation of method is related to the fact that all analyzed arcs were created in a laboratory environment. Arcs occurring in practical rail systems may have different radiated characteristic frequencies, and be influenced by factors such as the length of OCL, number of trains, respective train positions, and network topology of the employed converters, etc.
The quality of the current collection has also been evaluated by the use of wavelet multi-resolution analyses [5]. Recorded current signals were decomposed to a 4th level, and then a comparative analysis by considering the energy of the signal quantified through Parseval’s theorem employed to discriminate arc occurrences from electric welding phenomena [6]. Although the comparative analysis shows good results, it limits itself only to detecting the electric welding phenomenon. Hence, the effectiveness of the method to discriminate against other possible common phenomena in electric railway systems, for example, the presence of current spikes is still an open question.
Another interesting approach for arc detection has been proposed by measuring the vertical displacement and lateral accelerations of the OCL when the pantograph passes [9]. The proposed method clearly does not directly detect an arc event, but its consequences are evaluated. Large deviations of the displacement and acceleration have been associated to pantographs with contact strip degradation or defects, and hence the method supports maintenance activities.
Clearly, early-stage defect detection in contact wire and pantograph strip can prevent excessive wear in the entire pantograph-catenary system, and help maintenance service improve scheduling of inspection work. To this end, this paper proposes a new method for arc detection in DC railway systems. The proposed technique does not require any external equipment to be installed on the train (such as sensors, cameras, or antennas), because it is based on signal processing of measured pantograph current only. Furthermore, it does not employ extensive processing techniques, which results in a low processing overhead, and therefore it can be implemented relatively easy in real-time. The method exploits the low-frequency oscillation characteristic triggered by an arc occurrence in DC railway systems. Through application of the Hilbert transform (HT) the instantaneous phase of the generated signal associated with an arc event is quantified. It is shown that the instantaneous phase derivative can be employed to detect and localize in time the presence of arcs. The number of arcs per kilometre can be also calculated to allow a reliable estimation of the current collection quality index, and consequently form a valuable assessment of the entire pantograph-catenary system. HT is useful to analyse non-stationary time series [23], and to detect short-time disturbances. In contrast Fourier transform and the short-time version assumes signal periodicity and are optimised for stationary signals analysis [24,25,26].
The rest of the paper is structured as follows: Section 2 presents an overview of the arc occurrence mechanism and its impact on the railway network. In Section 3, the characteristics of the recorded current and voltage signals, containing real arcs are presented. The proposed detection method is described in Section 4, whereas the simulation results are presented in Section 5. Section 6 provides a comprehensive sensitivity analysis of the proposed method. Conclusions are summarised in Section 7.
2. Definition Mechanism of Occurrence and Impact of Electric Arcs in Railway Network
Electric arcs in railway transportation networks are physically defined as electric discharges occurring in the conductive ionizing gas, known as plasma, between the pantograph contact strip and the OCL [27]. This air gap forms during pantograph detachment and consists of three regions. The anode region and the cathode region, which are characterized by a nonlinear voltage drop, and the plasma column region characterized by a linear voltage drop. The latter is a function of physical distance between the two electrodes and the physical properties of the plasma [27].
Arcs occur because of the inability of the pantograph to continually stay attached to the contact wire. One of the main reasons causing this contact interruption is the mechanical oscillation of the train caused by the irregularity of the track geometry [7], and abrupt variation of the height of the contact wire mainly when trains enter tunnels [4].
In order to avoid rapid consumption of the pantograph contact strip, the contact wire is distributed in a zigzag manner throughout the track. Consequently, the pantograph follows this zigzag movement, and when the contact wire approaches the extreme ends of strip an increased air gap is developed between the pantograph and OCL, which causes an arc. The latter has been simulated and confirmed experimentally in a laboratory environment [8,28].
Another relevant cause of electric arcs is a fault in the pantograph mechanism or an incorrect adjustment of its operating system [9]. These cause either a low contact force to be exercised by the pantograph to the OCL, which in turn has a negative effect because it weakens the contact point and so the air gap increases, or it produces a high contact force that progresses the wear of the contact wire [29]. This wear deteriorates the contact quality and as a consequence electric micro-welding phenomena occur [6], which makes the occurrence of arcing more frequent. The arc occurrence mechanism is also negatively affected by factors such as increased train speed, the collected traction level current, as well as poor weather conditions including strong winds, snow, and ice [2,8,9,28].
Electric arcs are notorious for producing electromagnetic phenomena which propagate to the entire railway network. A wide range of injected electromagnetic frequencies have been observed during arc occurrence where some of them can excite resonant frequencies of the employed network components (such as filters and contact lines) [10,30], together with DC components induced in AC signals as a result of current interruption due to arcing [18]. Other conducted electromagnetic disturbances resulting from arcs are voltage transients and oscillations [8,30,31]. Low and high frequency oscillations spanning up to hundreds of MHz due to arcing phenomenon [7,22] have been electromagnetically radiated to nearby circuits, and potentially interfering with signaling and radio communications systems [7,8,10,11,12,32].
3. Characteristics of Voltage and Current Recorded Signals
This section presents the time domain characteristics of voltage and current signals measured at the pantograph of a locomotive operating on a 3 kV DC railway network in Italy. The signals used for this analysis are part of 16ENG04 MyRailS project [33,34] and can be accessed online [35]. The signals are recorded using a data acquisition system (DAQ) sampling at 50 kS/s installed on-board the train.
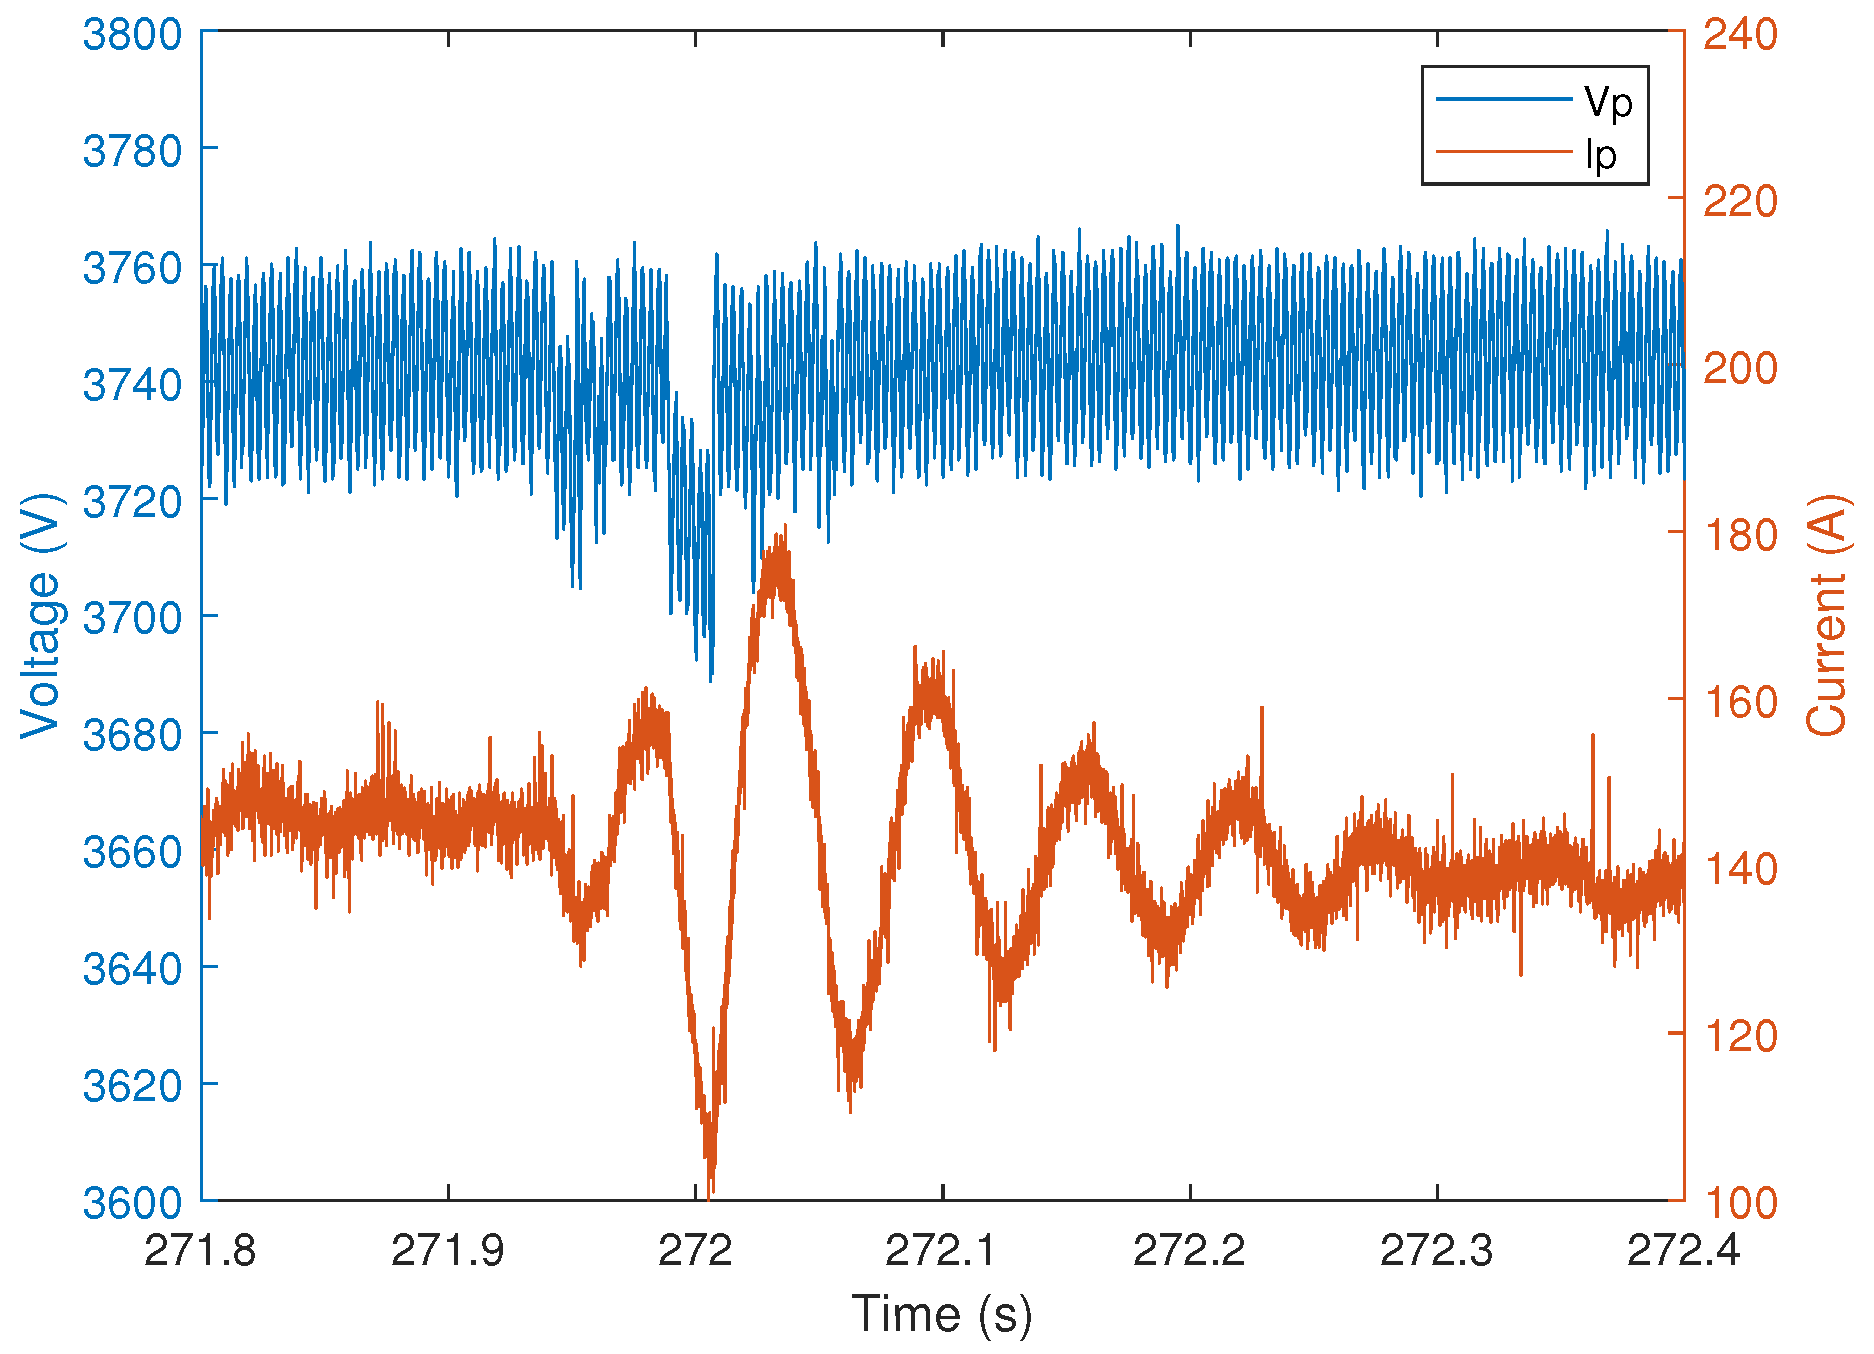
Figure 1 presents two examples of the measured pantograph voltages and currents of two different arc occurrences during the coasting phase of a running train. It can be observed that initially the pantograph voltage and current signals are relatively steady, indicating good and continuous sliding mechanical contact between the pantograph and OCL. When an arc occurs there is an immediate pantograph voltage drop (V.drop 1) consistent with the research outcomes presented in [27]. Due to contact interruption, pantograph current decreases because of the inability of the arc channel to conduct the level of current required by the traction drive of the locomotive. This current decrease in turn causes the stored energy in the magnetic field of the system inductance to be released instantly [8,10], and consequently causing the voltage spike (V.spike) shown in Figure 1a,b.
After the first voltage spike, continues to decrease almost linearly up to the point denoted as V.drop 2. This further decrease can be explained due to the increased gap between pantograph contact strip and the OCL, and this is again consistent with previous research studies [27,28]. After this voltage drop (V.drop 2), the pantograph restores its contact with the OCL, producing a voltage transient followed by oscillations (see the blue line—). This behavior is also confirmed by previous work [7,8] and simulation [10] studies, and is a typical system response due to an applied transient/impulse. The oscillatory behavior of is reflected in the current signal, causing to oscillate.
Figure 2 shows recorded signals of two arc occurrences during two separate regenerative braking phases of the train. It is noted that the pantograph currents have negative values indicating current leaving the train. In Figure 2a, the arc is associated with a pantograph current magnitude decrease (from −280 A to −200 A approximately), causing a voltage spike (V.spike) due to the immediate release of stored energy in the magnetic field of the locomotive inductances. As soon as the contact restores, an immediate pantograph voltage drop (V.drop) occurs most likely caused by the loading effect of the locomotive filter, and then followed by a low-frequency oscillation observed both in and . A more peculiar behavior of and due to an arc is presented in Figure 2b, where the first pantograph detachment (characterized by an magnitude decrease (I.drop 1) and increase (V.spike 1) is followed by a second detachment (characterized by I.drop 2 and V.spike 2) before the final restoration of the mechanical sliding contact.
Many other recorded arcs are considered for the analysis in this paper. These arc events trigger similar oscillatory patterns experienced by the recorded quantities. Based on these types of wave forms, the low-frequency oscillation characteristics have been exploited by the proposed arc detection method presented in the following section.
4. Proposed Arc Detection Method
The proposed detection method is based on the instantaneous phase evaluation of the low-frequency oscillations triggered by the arc occurrence. As the raw data recorded at the pantograph level are real valued numbers, a mathematical operation is required to create an analytic complex valued signal, having both real and imaginary terms, thus enabling extraction of suitable phase information. In this analysis, the HT [36,37,38] is employed to quantify the instantaneous magnitude and phase of the considered time series signals. The HT is widely used in digital communication systems [39], mechanical vibration analysis [40], and recently proposed for Power Quality (PQ) disturbance monitoring [26,41] and Phasor Measurement Unit (PMU) parameter estimation [42]. Equation (1) depicts the general form of an analytic signal:
where is the continuous time real signal, and is the imaginary terms of the analytic signal that is formed by the application of HT on [36,37,38,39]. In the time domain the is formed by the convolution operation of with the function [36], as shown in Equation (2),
whereas, in the frequency domain the HT operation introduces a constant phase shift of −90 degrees for every positive frequency component, and a 90 degrees for the negative frequency components present in the signal. This is achieved by using either a digital Finite Impulse Response (FIR) filter [37,39] or by using the Fourier transform approach [36]. In this paper the Fourier transform technique is employed to obtain the HT. This is normally implemented by the following steps:
- Perform the Fourier transform on the real input sequence;
- Set the DC and the Nyquist component to zero;
- Multiply the positive frequency components of the spectrum by , and the negative frequency components of the spectrum by ;
- Perform the inverse Fourier transform on the modified sequence to obtain the imaginary terms of the analytic signal;
Once the analytic signal is created, the instantaneous amplitude (also known as envelope function of the signal), instantaneous phase , and the rate of change of the instantaneous phase (ROCOP) are computed by Equations (3)–(5), respectively.
Considering the discrete sampled form of the real time continuous signal , and its respectively calculated analytic signal = + , Equation (5) takes the form of Equation (6)
where n is the number of samples acquired in ; for a time sampled signal is the sampling time which is 20 us, and is the difference in phase between successive.
A flow chart of the proposed algorithm is presented in Figure 3, where pre-filtering and post-filtering stages are used to attenuate the external noise of signal and the ROCOP noise, respectively. These stages are explained in detail in Section 6 of the paper.
From the calculated parameters, ROCOP was found to be a good indicator for the arc detection in DC railway system as it is presented in following section.
5. Results of the Proposed Method
Signals (pantograph voltages and pantograph currents) have been recorded on-board the Trenitalia locomotive E464, and are categorized in two main groups [35]: arc signals detected during the traction/coasting phase that for convenience in the following analysis are identified as arc events 1 to 6, and arc signals detected during the regenerative braking phase identified as arc events 7 to 13.
Due to larger magnitudes and a longer time durations experienced by the arc triggered oscillations the following analysis considers the pantograph current as the quantity processed. Furthermore, by considering the current quantity, the method will be more immune to voltage disturbances such as voltage transients that may potentially compromise the accuracy of the method if is considered.
Figure 4 and Figure 5 present the instantaneous pantograph currents, together with instantaneous phase angles and instantaneous ROCOP values for all of the coasting and regenerative braking stage arc signals detected, respectively. To filter the incoming signals from the external noise, a digital FIR filter of order 200 with cutoff frequency set at 100 Hz has been employed. In the next section an explanation for choosing the said order and cutoff frequency of the filter is provided. All the required calculations were performed in Matlab and LabVIEW programming using the HT toolsets provided in these programming environments.
The instantaneous phase angle calculations for each presented arc events in Figure 4 and Figure 5 reflect the phase angle behavior during low-frequency oscillations triggered by the arc events. To avoid ROCOP spikes due to phase angle jumps (passing from to - and vice-versa), the phase angle is unwrapped. On the other hand, the ROCOP calculations provide clear evidence of the presence of an arcing event in all the considered signals, despite the apparent noise levels seen in the signal of Figure 4f. Noise may affect any arc detection triggering mechanism, but noise removal may be dealt with through appropriate filtering techniques. Arcs captured during the regenerative braking stage of the locomotive also are identified using ROCOP calculations as presented in Figure 5. Further to the arc detection, the method also can precisely localise in time the occurrence of the arc. This additional information can be useful to support, for example, future geographic arc localization algorithms.
To appreciate the ROCOP noise level observed in Figure 4f, magnified versions of and are presented in Figure 6. Two possible factors that influence the ROCOP noise level can be: the increased noise level on top of the pantograph current signal, and the small variations in the pantograph voltage level (approximately 30 to 40 volt observed in Figure 6), that is of course reflected on the current oscillation having low magnitude variation (approximately 40 A to 45 A) during arcing events. Furthermore, indeed all the severe arcing events, characterised by increased air gap between the contact strip of the pantograph and OCL which either force the measured pantograph current to zero (observe Figure 4a,c–e and Figure 5b–d,f,g, or produce significant variations of the current magnitude as in Figure 4b and Figure 5a,e are not surrounded by significant noise level.
A possible reason for having such small variations in the magnitude of (see Figure 4f) produced by non-significant arcs, can be explained with the locomotive position along the track and the level of current collected. By looking at Figure 4f, it can be observed that for the first 3 s (265 to 268 s) the train has been stationary (probably waiting on a station), characterized by low traction current with significant distortion. A high level of distortion when trains are near stations has previously been observed in [43]. After the stationary phase, the train has started and accelerated for approximately 2 to 3 s (268 s to 270 s), leaving the station (confirmed by the very low train speed of 27 km/h reported in [35]). While leaving stations, trains at low speed often change track position which forces the pantograph to change the OCL and the train wheels to experience mechanical oscillations causing some minor arcs to occur.
The preliminary results of the proposed method indicate the need for a fine-tuning of the algorithm to eliminate for example the noise level of calculated ROCOP (in Figure 4f) and to understand possible factors that may influence the effectiveness of the algorithm. These issues are considered in the next section of this paper.
6. Sensitivity Analysis
The effect of signal magnitude, noise and the length of the considered signal on the calculated ROCOP parameter are evaluated in this section. Pre- and post-filtering techniques are employed and presented for noise and harmonic attenuation of , and smoothing of the phase derivative, respectively.
6.1. Pre-Filter Selection
To appreciate the harmonic presence and other frequency components of a DC rail network signal, a typical frequency spectrum of signal during and after the arc event 1 is presented in Figure 7. The spectrum produced by the discrete Fourier transform (DFT) algorithm, has a frequency resolution of 1 Hz and is limited to 1000 Hz to clearly show the band of frequencies (5 Hz to approximately 250 Hz) excited by the arcing phenomenon. Within the frequency band, a particular frequency component (14 Hz) corresponding to the natural resonance frequency of the locomotive input filter [30,44] is also excited, causing as a consequence a significant rise in its respective magnitude.
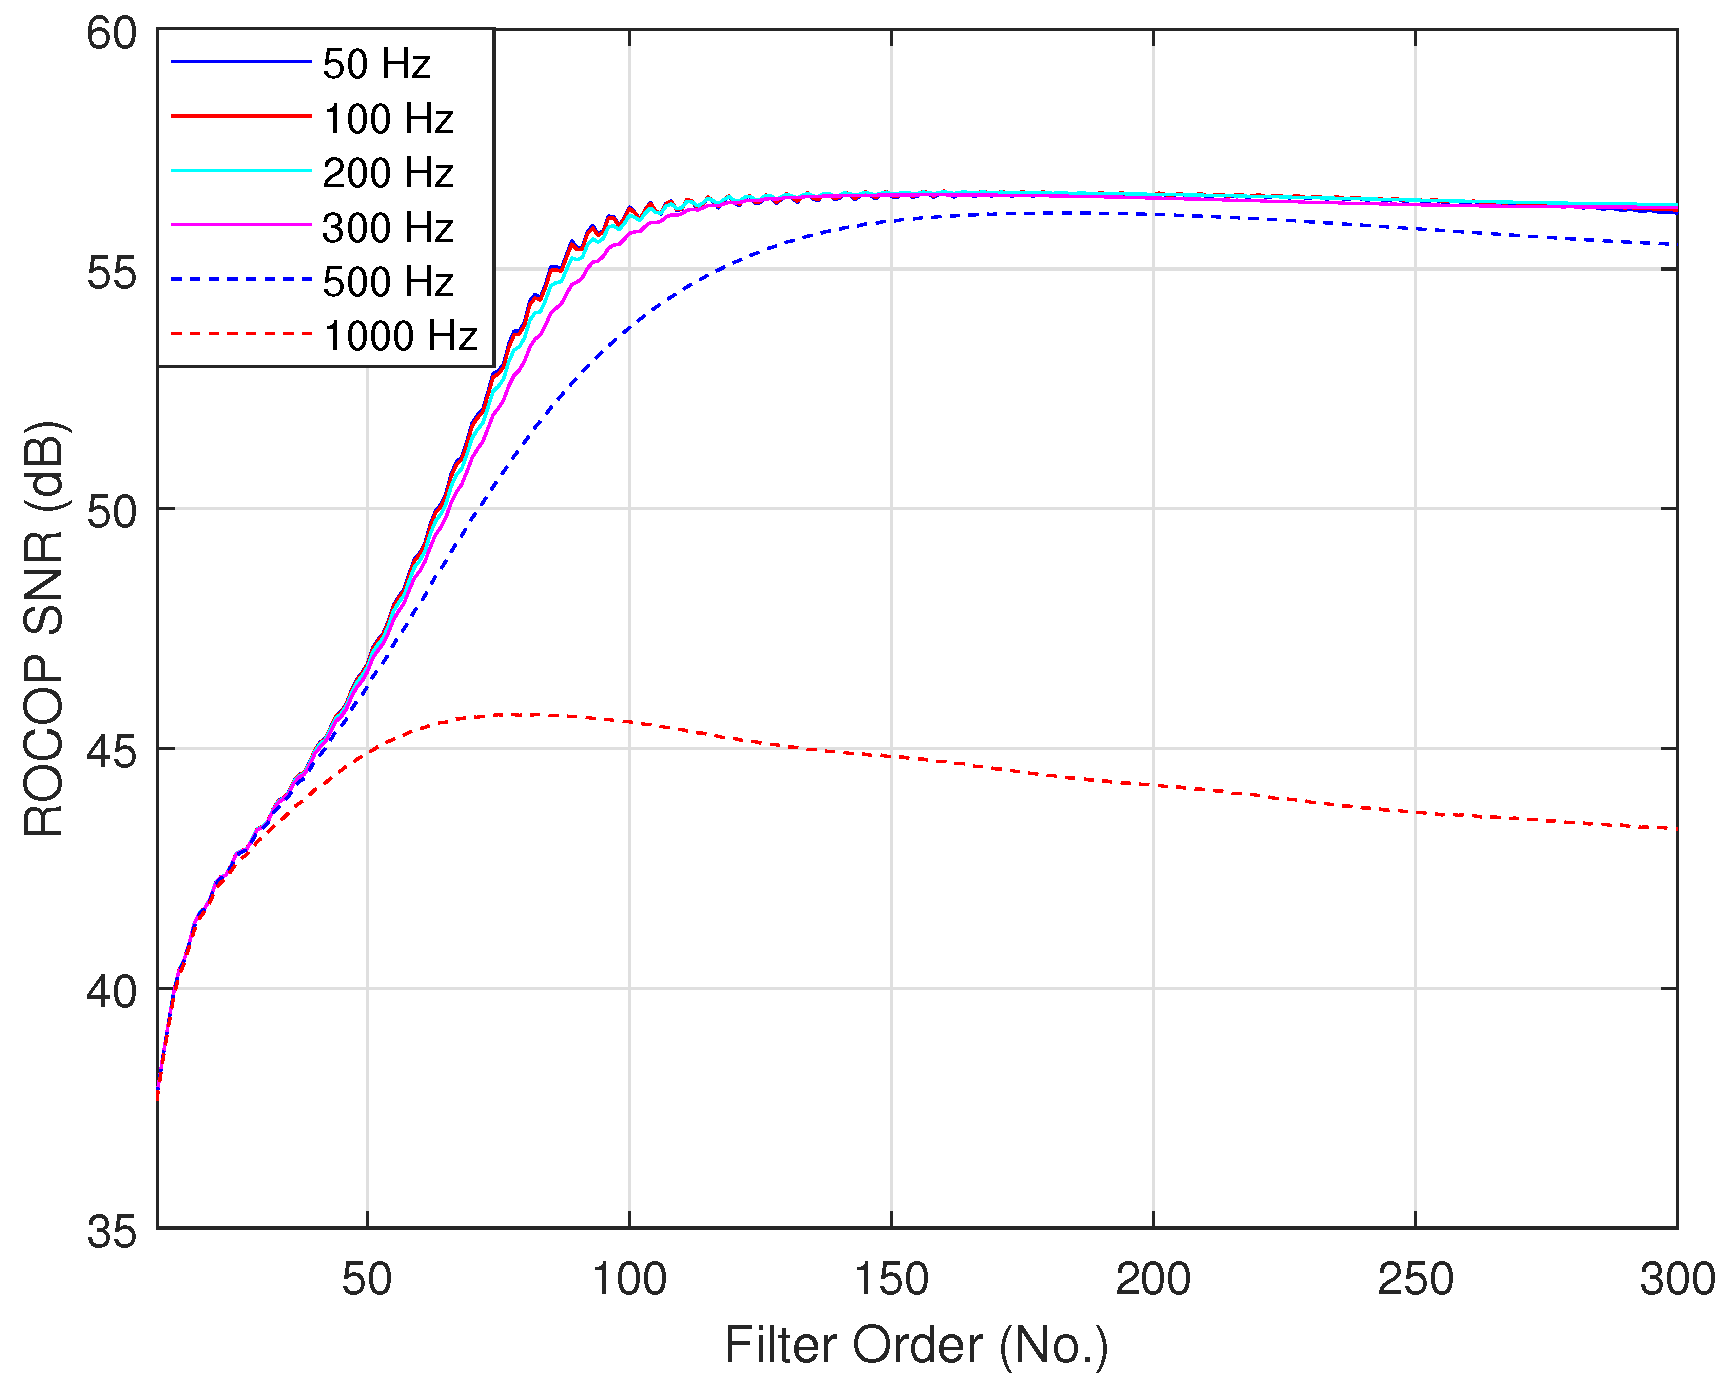
To filter the incoming signal from high frequency components and external noise, a digital Finite Impulse Response (FIR) filter is considered. ROCOP signal to noise ratio (SNR) parameter was calculated for one of the arc events (arc event 1), by considering different filter orders (ranging from 10 to 300) to filter the incoming signal. The latter allows ROCOP SNR to filter order response curves to be constructed for several considered cutoff frequencies (50 Hz, 100 Hz, 200 Hz, 300 Hz, 500 Hz and 1000 Hz) as presented in Figure 8.
The analysis shows that low cutoff frequencies are needed to avoid frequency components and the noise infiltration into the ROCOP parameter. Cutoff frequency curves of 50 Hz to 300 Hz follow the same pattern and have negligible differences among them. This indicates that potentially any cutoff frequency (ranging from 50 Hz to 300 Hz) can be employed, which provide similar reproduced results. Differences begin to appear when considering the cutoff frequency of 500 Hz and are more obvious for the 1000 Hz curve, reaching differences of more than 10 dB. This large difference is caused by the presence of a band of frequencies ranging from 850 Hz to 950 Hz approximately, as shown in Figure 7. The analysis also shows that higher filter orders provide larger ROCOP SNR, and the behaviour of the curve response is less fluctuating beyond the 150 filter order.
In this study, the filter order was selected to be 200, whereas the cutoff frequency 100 Hz. This cutoff frequency can also contribute to attenuate the 300 Hz component (as a result of the six-pulse rectifier installed in the electric substation) which is more distinctive when trains are near stations. The 300 Hz frequency component and other relevant components in signal of arc event 6, are calculated as a function of time by the short-time Fourier transform (STFT) algorithm and are presented in Figure 9 by the spectrogram plot. The plot estimates and localizes in time the frequency content of the considered signal. It clearly indicates a 300 Hz frequency component, and a band of frequencies of 750 Hz to 850 Hz that are present continuously throughout the recording interval, and a temporary 14 Hz frequency component, excited by the arcing event. It is clear that the 300 Hz frequency component and the band of frequencies ranging from 750 Hz to 850 Hz approximately are not affected by the arc occurrence (visible after second 6).
The selected filter parameters also have shown to remove more surrounding noise level in the ROCOP of Figure 4f.
6.2. Noise Sensitivity Analysis
To understand how noise affects the calculated ROCOP, a noise sensitivity analysis has been performed on signal of arc event 1. This analysis considers the white Gaussian noise because it is the most common type of signal noise found in electric system signals [37]. Furthermore, after pre-filtering of it is considered that all that remains within the passband can be reasonably approximated by additive white Gaussian noise.
While different levels of noise have been added to the recorded , the maximum absolute value of the calculated ROCOP has been recorded to allow the SNR-ROCOP response curve to be constructed. Figure 10, presents the SNR-ROCOP response evaluated for different noise variances corresponding to a SNR ranging from 100 to 35 dB. An almost constant ROCOP behavior can be observed in the interval of 100 to 70 dB. Below 70 dB, the ROCOP measured parameter experiences an increased variability leading to increased uncertainty of the measured parameter.
Although the analysis presented in Figure 10 is a good representation of the behavior of ROCOP magnitude at different noise levels, it does not represent the strength of the ROCOP magnitude itself to the surrounding ROCOP noise level. Therefore, further analysis is required to represent the impact of the noise floor level (developed in relation to the noise level contained in the analyzed current signal) on the measured parameter. Different levels of noise have been added to the and the ROCOP SNR has been evaluated and presented in Figure 11 versus SNR corresponding to .
As can be seen, the strength of the ROCOP magnitude to the ROCOP noise level is influenced by the increasing noise level in the signal. However, this influence is almost negligible in the interval of 100 dB to 70 dB, and small (approximately only ±1 dB) from 70 dB down to 40 dB. This is because of the efficient attenuation effect the FIR filter has on the input signal. Similarly, as observed in Figure 10, ROCOP SNR experiences an increased variability due to increased noise level starting below 70 dB SNR.
6.3. Post Filtering-ROCOP Noise Attenuation and Smoothing
The noise sensitivity analysis indicated an increase in the ROCOP noise floor level when externally applied noise magnitude increases. Because these noise levels can compromise any arc detection triggering mechanism, it is necessary to attenuate it as much as possible. Therefore, this subsection presents the use of a mitigation technique to further attenuate and smooth the noise level and fluctuations of the ROCOP calculated parameter observed in Figure 4f and Figure 5a, allowing the algorithm to better interpret the processed data.
A moving average (MA) filter was considered to filter the ROCOP noise and spikes. As any type of filter, a MA filter offers various output responses for different filter order selection. To identify the behavior of the filter under different noise levels present on the arc event 1 signal, and to provide assistance on the selection of the filter order for the required application, Figure 12 presents the relationship between the ROCOP SNR and the MA filter order for several filter response curves.
As can be seen, all the responses (corresponding to different noise levels present on ) follow the same decay and provide good attenuation (approximately 6 dB) when considering the 50th filter order. Increasing the filter order from 50 to 100 provides an additional 4.9 dB attenuation respectively for signals having SNR noise levels of 80 dB to 40 dB. Several numerical simulations have been performed for the identification of the best MA filter order for all ROCOP curves presented in Figure 4 and Figure 5. It was found that the 50th filter order provides good attenuation of the ROCOP noise.
The absolute ROCOP calculated results filtered by the MA filter, for all the arcing captured events are presented respectively in Figure 13 and Figure 14. These Figures clearly indicate the attenuation effect the MA filter has on the ROCOP noise. For example, the ROCOP noise level of Figure 4f has been considerably eliminated, and as a consequence the ROCOP parameter during arcing is more clearly differentiated from the noisy environment.
Another important feature of the MA filter is the smoothing effect it has on the ROCOP fluctuations. For example, the ROCOP spikes resulting from current spikes in Figure 5a,d,f,g, are all smoothed by both FIR and the MA filter. Consequently, ROCOP spikes will not be counted as arcing events with a proper triggering level in place. These features of the MA filter provide significant advantages to an arc detection triggering mechanism allowing the rest of the proposed method to accurately identify the input data.
6.4. Magnitude Sensitivity Analysis
The following subsection presents the influence of pantograph current oscillation magnitude on the arc detection capability of the proposed method. In this analysis, of arc event 11 (recorded during the regenerative braking phase) has been considered because the current was not forced to zero during the arcing event, allowing a proper scaling of the oscillation magnitude.
In such a context, the current oscillation instant during the arcing event was extracted, linearly scaled by a factor ranging between 0.9 to 0.1 in 0.1 steps, and then synthesized within the real data recordings to be used for testing the proposed method. The extracted portion of the current oscillation is presented in Figure 15, along with all the scaled versions denoted as to , corresponding to scaling factors 0.9 to 0.1, respectively.
The method was tested with all the 10 pantograph current versions, and the relationship between the calculated ROCOP SNR and the scaling factors is presented in Figure 16. ROCOP SNR values (for each scale factor) indicate the level of differentiation of the arc from the environment noise level. It is normally expected a decrease in ROCOP SNR with decreasing scale factors because the magnitude of the arc oscillation reduces significantly, for example to 36 A and 18 A (absolute values), respectively for scale factors 0.2 and 0.1 (corresponding to and of Figure 15.
This magnitude sensitivity analysis has shown that the proposed method is capable of identifying all arcing events having reduced oscillation magnitudes down to 18A. However, arcing events of such a small oscillation magnitude can be considered non-significant when compared to oscillation magnitudes of the real captured arcing events (arc events 1 to 13).
6.5. Signal Window Length Impact
The effect of considered signal length on the ROCOP parameter is studied in this subsection. Pantograph current of arc event 1 has been considered for this analysis. Initially, the maximum ROCOP parameter observed within the time window processed signal is evaluated for the total length of the recorded signal (150,000 samples equals to 3 s). The signal was divided into equal lengths through different consecutive time windows and processed by the proposed method.
The maximum ROCOP values for different fixed window signal lengths are presented in Figure 17 (blue curve), where text annotations indicate the number of samples within each time window.
A small difference in ROCOP magnitude exists between a long considered signal of 3 s and shorter signals of 1 s, 0.6 s, 0.2 s and 0.1 s corresponding to (50,000, 30,000, 10,000 and 5000) samples as presented by the blue curve in Figure 17. Decreasing further the length of the time window to 3000 samples, 1500 samples or 1000 samples produces a decrease in ROCOP magnitude. This behaviour is caused by short windows that fail to accommodate a compete arcing event. This is demonstrated when sliding windows of 50% overlap are used (see the red curve in Figure 17), which better accommodate the arcing event for processing, and consequently produce ROCOP magnitudes of small differences for short windows.
The analysis presented in this section has indicated that the proposed arc detection method is capable of detecting arcs of different magnitude at different noise levels in the DC rail network.
In addition, standard EN 50317 [1] requires the current collection quality of the pantograph-catenary system to be evaluated. For this purpose the percentage of arcing is proposed in [1], to be calculated as the ratio of total duration of all arcs to the total run time for pantograph current values above the 30% of the nominal current per pantograph. The proposed arc detection method clearly cannot evaluate the time duration of the arcs, but the detected arcs can be used to compute the number of arcs per kilometre, as an alternative criterion (also acceptable by standard EN 50317 [1]) for evaluating the current collection quality.
As presented, the method does not employ an extensive processing technique, and therefore it can be implemented in real-time. One option to accomplish this could be to embed the algorithm within the actual train computational and monitoring units. Alternatively, the on-board instrumentation of the train can be considered for the possibility of sharing the measured pantograph current with external acquisition and computational units, such as microcontrollers having real-time computational capabilities.
7. Conclusions
This paper has presented a novel arc detection technique for DC Railway Systems. The method quantifies the instantaneous ROCOP of the pantograph current oscillating signal during the arc occurrence with the help of the Hilbert transform. Real current signals measured at a 3 kV DC pantograph level of a running locomotive have been applied to test the performance of the algorithm, and it was demonstrated that the phase derivative can detect and localize in time all the electric arcs occurring at both the coasting and regenerative braking phase.
The sensitivity of the algorithm to external applied white Gaussian noise, various synthesized oscillating magnitudes representing different arcing events, and the length of the considered signal is also evaluated. It was demonstrated that the noise level in the pantograph current has little influence in ROCOP parameter due to efficient noise attenuation provided by the FIR filter. ROCOP parameter measured for signals having SNR between 100 dB to 70 dB was high repeatable, whereas, below the 70 dB of SNR, ROCOP becomes variable, leading to increased uncertainty.
A moving average filter was employed to attenuate and smooth the ROCOP noise level and spikes, and it was demonstrated that the ROCOP parameters after the filtering stage were clearly differentiated from the rest of the noisy environment.
The magnitude sensitivity analysis has demonstrated that the proposed method is also capable to identify minor arcing events having oscillation magnitudes down to 18 A. These arcs are typical in very low train speeds and are probably caused when trains change the track position.
A small difference in ROCOP magnitude for different considered signal lengths (3 s and 1 s, 0.6 s, 0.2 s and 0.1 s lengths) has also been demonstrated. For very short considered time windows (1000 to 3000) samples, it was shown that sliding windows outperforms fixed length windows because complete arcing events are better accommodated, providing so consistently results.
The DC arc detection method in this paper provides a new tool for accurate, real-time condition monitoring of critical electrified rail infrastructure. This has the potential to enable predictive maintenance, thereby reducing operational costs and improving safety.
Author Contributions
Y.S. undertook the literature review and main writing of the paper; Y.S. and B.G.S. developed the arcing algorithms, analysed the signals and processed the results; C.M. and S.M.B. reviewed, commented and edited the whole document including the figures; B.G.S. edited the manuscript and guided the research work. All authors read and agreed to the published version of the manuscript.
Funding
The University of Strathclyde and METAS received funding under 16ENG04 MyRailS project, which has received funding from the EMPIR programme co-financed by the Participating States and from the European Union’s Horizon 2020 research and innovation programme. This work also received funding from the European Union’s Horizon 2020 research and innovation programme MEAN4SG under Marie Skłodowska-Curie Grant Agreement 676042.
Acknowledgments
The authors would like to thank the partners of MyRailS project for making available the data for the analysis presented in this paper.
Conflicts of Interest
The authors declare no conflict of interest.
References
- CENELEC EN 50317:2012 Railway Applications–Current Collection Systems—Requirements for and Validation of Measurements of the Dynamic Interaction between Pantograph and Overhead Contact Line; CENELEC: Brussels, Belgium, 2012.
- CENELEC EN 50367:2012 Railway Applications–Current Collection Systems—Technical Criteria for the Interaction between Pantograph and Overhead Line ( to Achieve Free Access ); CENELEC: Brussels, Belgium, 2012.
- CENELEC EN 50119:2020 Railway Applications–Fixed Installations—Electric Traction Overhead Contact Lines; CENELEC: Brussels, Belgium, 2020.
- Bruno, O.; Landi, A.; Papi, M.; Sani, L. Phototube sensor for monitoring the quality of current collection on overhead electrified railways. Proc. Inst. Mech. Eng. Part F J. Rail Rapid Transit 2001, 215, 231–241. [Google Scholar] [CrossRef]
- Barmada, S.; Landi, A.; Papi, M.; Sani, L. Wavelet multiresolution analysis for monitoring the occurrence of arcing on overhead electrified railways. Proc. Inst. Mech. Eng. Part F J. Rail Rapid Transit 2003, 217, 177–187. [Google Scholar] [CrossRef]
- Balestrino, A.; Bruno, O.; Giorgi, P.; Landi, A.; PAPI, M.; Sani, L.; Giuseppe, A.; Elettriche, S.P. Electric welding effect: Detection via phototube sensor and maintenance activities. In Proceedings of the CDROM of the World Congress on Railway Research, Cologne, Germany, 25–29 November 2001; pp. 19–23. [Google Scholar]
- Tellini, B.; Macucci, M.; Giannetti, R.; Antonacci, G.A. Conducted and radiated interference measurements in the line-pantograph system. IEEE Trans. Instrum. Meas. 2001, 50, 1661–1664. [Google Scholar] [CrossRef]
- Midya, S.; Bormann, D.; Schutte, T.; Thottappillil, R. Pantograph arcing in electrified railways—Mechanism and influence of various parameters—Part I: With DC traction power supply. IEEE Trans. Power Deliv. 2009, 24, 1931–1939. [Google Scholar] [CrossRef]
- Betts, A.; Hall, J.; Keen, P. Condition monitoring of pantographs. In Proceedings of the International Conference on Main Line Railway Electrification 1989, York, UK, 25–28 September 1989; pp. 129–133. [Google Scholar]
- Crotti, G.; Giordano, D.; Roccato, P.; Delle Femine, A.; Gallo, D.; Landi, C.; Luiso, M.; Mariscotti, A. Pantograph-to-OHL Arc: Conducted Effects in DC Railway Supply System. In Proceedings of the 2018 IEEE 9th International Workshop on Applied Measurements for Power Systems (AMPS), Bologna, Italy, 26–28 September 2018; pp. 1–6. [Google Scholar]
- Crotti, G.; Delle Femine, A.; Gallo, D.; Giordano, D.; Landi, C.; Luiso, M.; Mariscotti, A.; Roccato, P.E. Pantograph-to-OHL arc: Conducted effects in DC railway supply system. IEEE Trans. Instrum. Meas. 2019, 68, 3861–3870. [Google Scholar] [CrossRef] [Green Version]
- Bormann, D.; Midya, S.; Thottappillil, R. DC components in pantograph arcing: Mechanisms and influence of various parameters. In Proceedings of the 2007 18th International Zurich Symposium on Electromagnetic Compatibility, Munich, Germany, 24–28 September 2007; pp. 369–372. [Google Scholar]
- Landi, A.; Menconi, L.; Sani, L. Hough transform and thermo-vision for monitoring pantograph-catenary system. Proc. Inst. Mech. Eng. Part F J. Rail Rapid Transit 2006, 220, 435–447. [Google Scholar] [CrossRef]
- Aydin, I. A new approach based on firefly algorithm for vision-based railway overhead inspection system. Measurement 2015, 74, 43–55. [Google Scholar] [CrossRef]
- Barmada, S.; Raugi, M.; Tucci, M.; Romano, F. Arc detection in pantograph-catenary systems by the use of support vector machines-based classification. IET Electr. Syst. Transp. 2013, 4, 45–52. [Google Scholar] [CrossRef] [Green Version]
- Aydın, İ.; Yaman, O.; Karaköse, M.; Çelebi, S.B. Particle swarm based arc detection on time series in pantograph-catenary system. In Proceedings of the 2014 IEEE International Symposium on Innovations in Intelligent Systems and Applications (INISTA) Proceedings, Alberobello, Italy, 23–25 June 2014; pp. 344–349. [Google Scholar]
- Barmada, S.; Tucci, M.; Menci, M.; Romano, F. Clustering techniques applied to a high-speed train pantograph–catenary subsystem for electric arc detection and classification. Proc. Inst. Mech. Eng. Part F J. Rail Rapid Transit 2016, 230, 85–96. [Google Scholar] [CrossRef] [Green Version]
- Huang, H.H.; Chen, T.H. Development of method for assessing the current collection performance of the overhead conductor rail systems used in electric railways. Proc. Inst. Mech. Eng. Part F J. Rail Rapid Transit 2008, 222, 159–168. [Google Scholar] [CrossRef]
- Seferi, Y.; Clarkson, P.; Blair, S.M.; Mariscotti, A.; Stewart, B.G. Power Quality Event Analysis in 25 kV 50 Hz AC Railway System Networks. In Proceedings of the 2019 IEEE 10th International Workshop on Applied Measurements for Power Systems (AMPS), Aachen, Germany, 25–27 September 2019; pp. 1–6. [Google Scholar] [CrossRef] [Green Version]
- Mariscotti, A. Results on the power quality of French and Italian 2× 25 kV 50 Hz railways. In Proceedings of the 2012 IEEE International Instrumentation and Measurement Technology Conference Proceedings, Graz, Austria, 13–16 May 2012; pp. 1400–1405. [Google Scholar]
- Seferi, Y.; Blair, S.M.; Mester, C.; Stewart, B.G. Power Quality Measurement and Active Harmonic Power in 25 kV 50 Hz AC Railway Systems. Energies 2020, 13, 5698. [Google Scholar] [CrossRef]
- Gao, G.; Yan, X.; Yang, Z.; Wei, W.; Hu, Y.; Wu, G. Pantograph–Catenary arcing detection based on electromagnetic radiation. IEEE Trans. Electromagn. Compat. 2018, 61, 983–989. [Google Scholar] [CrossRef]
- Huang, N.E.; Shen, Z.; Long, S.R.; Wu, M.C.; Shih, H.H.; Zheng, Q.; Yen, N.C.; Tung, C.C.; Liu, H.H. The empirical mode decomposition and the Hilbert spectrum for nonlinear and non-stationary time series analysis. Proc. R. Soc. Lond. Ser. A Math. Phys. Eng. Sci. 1998, 454, 903–995. [Google Scholar] [CrossRef]
- Mahela, O.P.; Shaik, A.G.; Gupta, N. A critical review of detection and classification of power quality events. Renew. Sustain. Energy Rev. 2015, 41, 495–505. [Google Scholar] [CrossRef]
- Ozgonenel, O.; Yalcin, T.; Guney, I.; Kurt, U. A new classification for power quality events in distribution systems. Electr. Power Syst. Res. 2013, 95, 192–199. [Google Scholar] [CrossRef]
- Jayasree, T.; Devaraj, D.; Sukanesh, R. Power quality disturbance classification using Hilbert transform and RBF networks. Neurocomputing 2010, 73, 1451–1456. [Google Scholar] [CrossRef]
- Ammerman, R.F.; Sen, P. Modeling high-current electrical arcs: A volt-ampere characteristic perspective for AC and DC systems. In Proceedings of the 2007 39th North American Power Symposium, Las Cruces, NM, USA, 30 September–2 October 2007; pp. 58–62. [Google Scholar]
- Midya, S.; Bormann, D.; Larsson, A.; Schutte, T.; Thottappillil, R. Understanding pantograph arcing in electrified railways-influence of various parameters. In Proceedings of the 2008 IEEE International Symposium on Electromagnetic Compatibility, Detroit, MI, USA, 18–22 August 2008; pp. 1–6. [Google Scholar]
- Usuda, T.; Ikeda, M.; Yamashita, Y. Prediction of contact wire wear in high speed railways. In Proceedings of the 9th World Congress on Railway Research, Paris, France, 21 September 2011; pp. 1–10. [Google Scholar]
- Mariscotti, A.; Giordano, D. Experimental characterization of pantograph arcs and transient conducted phenomena in DC railways. Acta Imeko 2020, 9, 10–17. [Google Scholar] [CrossRef]
- Li, T.; Wu, G.; Zhou, L.; Gao, G.; Wang, W.; Wang, B.; Liu, D.; Li, D. Pantograph arcing’s impact on locomotive equipments. In Proceedings of the 2011 IEEE 57th Holm Conference on Electrical Contacts (Holm), Minneapolis, MN, USA, 11–14 September 2011; pp. 1–5. [Google Scholar]
- Mariscotti, A.; Marrese, A.; Pasquino, N.; Moriello, R.S.L. Time and frequency characterization of radiated disturbance in telecommunication bands due to pantograph arcing. Measurement 2013, 46, 4342–4352. [Google Scholar] [CrossRef]
- MyRailS Website. Available online: https://myrails.it/ (accessed on 14 January 2021).
- Giordano, D.; Clarkson, P.; Gamacho, F.; van den Brom, H.E.; Donadio, L.; Fernandez-Cardador, A.; Spalvieri, C.; Gallo, D.; Istrate, D.; De Santiago Laporte, A.; et al. Accurate Measurements of Energy, Efficiency and Power Quality in the Electric Railway System. In Proceedings of the 2018 Conference on Precision Electromagnetic Measurements (CPEM 2018), Paris, France, 8–13 July 2018; pp. 1–2. [Google Scholar]
- Giordano, D.; Signorino, D.; Mariscotti, A.; Cipolletta, G.; Delle Femine, A.; Gallo, D.; Biancucci, A.; Donadio, L.; Balic, F.; Quintana, J. Pantograph Arcing in DC Railway Systems: Transient Behavior of Voltage and Current Recorded at Pantograph. Mendeley Data 2020, V1. [Google Scholar] [CrossRef]
- Marple, L. Computing the discrete-time “analytic” signal via FFT. IEEE Trans. Signal Process. 1999, 47, 2600–2603. [Google Scholar] [CrossRef]
- Hussain, Z.M.; Sadik, A.Z.; O’Shea, P. Digital Signal Processing: An Introduction with MATLAB and Applications; Springer Science & Business Media: Berlin, Germany, 2009. [Google Scholar]
- Van Drongelen, W. Signal Processing for Neuroscientists; Academic Press: Cambridge, MA, USA, 2018. [Google Scholar]
- Romero, D.T.; Jovanovic, G. Digital FIR Hilbert transformers: Fundamentals and efficient design methods. MATLAB-A Fundam. Tool Sci. Comput. Eng. Appl. 2012, 1, 445–482. [Google Scholar]
- Feldman, M. Hilbert transform in vibration analysis. Mech. Syst. Signal Process. 2011, 25, 735–802. [Google Scholar] [CrossRef]
- Santos-Hernandez, J.A.; Valtierra-Rodriguez, M.; Amezquita-Sanchez, J.P.; Romero-Troncoso, R.D.J.; Camarena-Martinez, D. Hilbert filter based FPGA architecture for power quality monitoring. Measurement 2019, 147, 106819. [Google Scholar] [CrossRef]
- Razo-Hernandez, J.R.; Valtierra-Rodriguez, M.; Granados-Lieberman, D.; Tapia-Tinoco, G.; Rodriguez-Rodriguez, J.R. A phasor estimation algorithm based on Hilbert transform for P-class PMUs. Adv. Electr. Comput. Eng. 2018, 18, 97–105. [Google Scholar] [CrossRef]
- Crotti, G.; Giordano, D.; Signorino, D.; Delle Femine, A.; Gallo, D.; Landi, C.; Luiso, M.; Biancucci, A.; Donadio, L. Monitoring Energy and Power Quality On Board Train. In Proceedings of the 2019 IEEE 10th International Workshop on Applied Measurements for Power Systems (AMPS), Aachen, Germany, 25–27 September 2019; pp. 1–6. [Google Scholar]
- Hill, R.J.; Fracchia, M.; Pozzobon, P.; Sciutto, G. A frequency domain model for 3 kV DC traction DC-side resonance identification. IEEE Trans. Power Syst. 1995, 10, 1369–1375. [Google Scholar] [CrossRef]
Figure 1.
Time domain representation of pantograph voltage and pantograph current during arc event 3 and 5 occurred in a coasting phase.
Figure 1.
Time domain representation of pantograph voltage and pantograph current during arc event 3 and 5 occurred in a coasting phase.

Figure 2.
Time domain representation of pantograph voltage and pantograph current during arc event 7 and 9 occurred in a regenerative braking phase.
Figure 2.
Time domain representation of pantograph voltage and pantograph current during arc event 7 and 9 occurred in a regenerative braking phase.

Figure 3.
Flow chart of the proposed algorithm.

Figure 4.
Instantaneous recorded , instantaneous calculated phase angle, and instantaneous ROCOP for all of the arcs detected during the coasting phase.
Figure 4.
Instantaneous recorded , instantaneous calculated phase angle, and instantaneous ROCOP for all of the arcs detected during the coasting phase.

Figure 5.
Instantaneous recorded , instantaneous calculated phase angle, and instantaneous ROCOP for all of the arcs detected during the regenerative braking phase.
Figure 5.
Instantaneous recorded , instantaneous calculated phase angle, and instantaneous ROCOP for all of the arcs detected during the regenerative braking phase.


Figure 6.
Time domain representation of and during arc event 6.

Figure 7.
Frequency spectrum of during and after arc occurrence.

Figure 8.
ROCOP SNR to filter order response curves constructed for filter cutoff frequencies of 50 Hz, 100 Hz, 200 Hz, 300 Hz, 500 Hz and 1000 Hz.
Figure 8.
ROCOP SNR to filter order response curves constructed for filter cutoff frequencies of 50 Hz, 100 Hz, 200 Hz, 300 Hz, 500 Hz and 1000 Hz.

Figure 9.
Spectrogram plot of for arc event 6.

Figure 10.
SNR-ROCOP response of for arc event 1.

Figure 11.
ROCOP SNR versus SNR of for arc event 1.

Figure 12.
ROCOP SNR versus MA filter order for different SNR levels.

Figure 13.
Absolute instantaneous ROCOP after being filtered by the MA filter for the arc events 1 to 6.
Figure 13.
Absolute instantaneous ROCOP after being filtered by the MA filter for the arc events 1 to 6.

Figure 14.
Absolute instantaneous ROCOP after being filtered by the MA filter for the arc events 7 to 13.
Figure 14.
Absolute instantaneous ROCOP after being filtered by the MA filter for the arc events 7 to 13.


Figure 15.
Pantograph current of arc event 11, along with scaled current versions to , respectively, for scaling factors 0.9 to 0.1.
Figure 15.
Pantograph current of arc event 11, along with scaled current versions to , respectively, for scaling factors 0.9 to 0.1.

Figure 16.
ROCOP SNR values versus the scaling factors for the considered arc event 11.

Figure 17.
Maximum ROCOP values for different signal lengths.

Publisher’s Note: MDPI stays neutral with regard to jurisdictional claims in published maps and institutional affiliations. |
© 2021 by the authors. Licensee MDPI, Basel, Switzerland. This article is an open access article distributed under the terms and conditions of the Creative Commons Attribution (CC BY) license (http://creativecommons.org/licenses/by/4.0/).
Share and Cite
MDPI and ACS Style
Seferi, Y.; Blair, S.M.; Mester, C.; Stewart, B.G. A Novel Arc Detection Method for DC Railway Systems. Energies 2021, 14, 444. https://doi.org/10.3390/en14020444
AMA Style
Seferi Y, Blair SM, Mester C, Stewart BG. A Novel Arc Detection Method for DC Railway Systems. Energies. 2021; 14(2):444. https://doi.org/10.3390/en14020444
Chicago/Turabian StyleSeferi, Yljon, Steven M. Blair, Christian Mester, and Brian G. Stewart. 2021. "A Novel Arc Detection Method for DC Railway Systems" Energies 14, no. 2: 444. https://doi.org/10.3390/en14020444
Note that from the first issue of 2016, this journal uses article numbers instead of page numbers. See further details here.