Finite Element Analysis on Shear Behavior of High-Strength Bolted Connectors under Inverse Push-Off Loading


1
School of Transportation, Wuhan University of Technology, Wuhan 430063, China
2
School of Civil Engineering, Central South University, Changsha 410075, China
3
Engineering Technology Research Center for Prefabricated Construction Industrialization of Hunan Province, Changsha 410075, China
4
CCCC Second Highway Consultants Co., LTD., Wuhan 430056, China
*
Authors to whom correspondence should be addressed.
Energies 2021, 14(2), 479; https://doi.org/10.3390/en14020479
Submission received: 23 December 2020
/
Revised: 12 January 2021
/
Accepted: 14 January 2021
/
Published: 18 January 2021
Abstract
:High-strength bolted shear connectors (HSBSCs), which can be demounted easily and efficiently during deconstruction, are recommended to replace the conventional steel studs in steel–concrete composite beams (SCCBs) to meet the requirements of sustainable development. The existing investigations on the behavior of HSBSCs mainly focus on the positive moment area of composite beams, in which the concrete slab is in compress condition. In this paper, a three-dimensional finite element model (FEM) was developed to investigate the performance of HSBSCs subjected to inverse push-off loading. Material nonlinearities and the interactions among all components were included in the FEM. The accuracy and reliability of the proposed FEM were initially validated against the available push-off test results. Load-carrying capacity and load–slip response of the HSBSCs under inverse push-off loading were further studied by the verified FEM. A parametric study was carried out to determine the influence of the concrete strength, the diameter and tensile strength of bolt and the clearance between the concrete slab and the bolt as well as the bolt pretension on the shear performance of HSBSCs. Based on the extensive parametric analyses, design recommendations for estimating the shear load at the first slip and load-bearing resistance of HSBSCs were proposed and verified.
1. Introduction
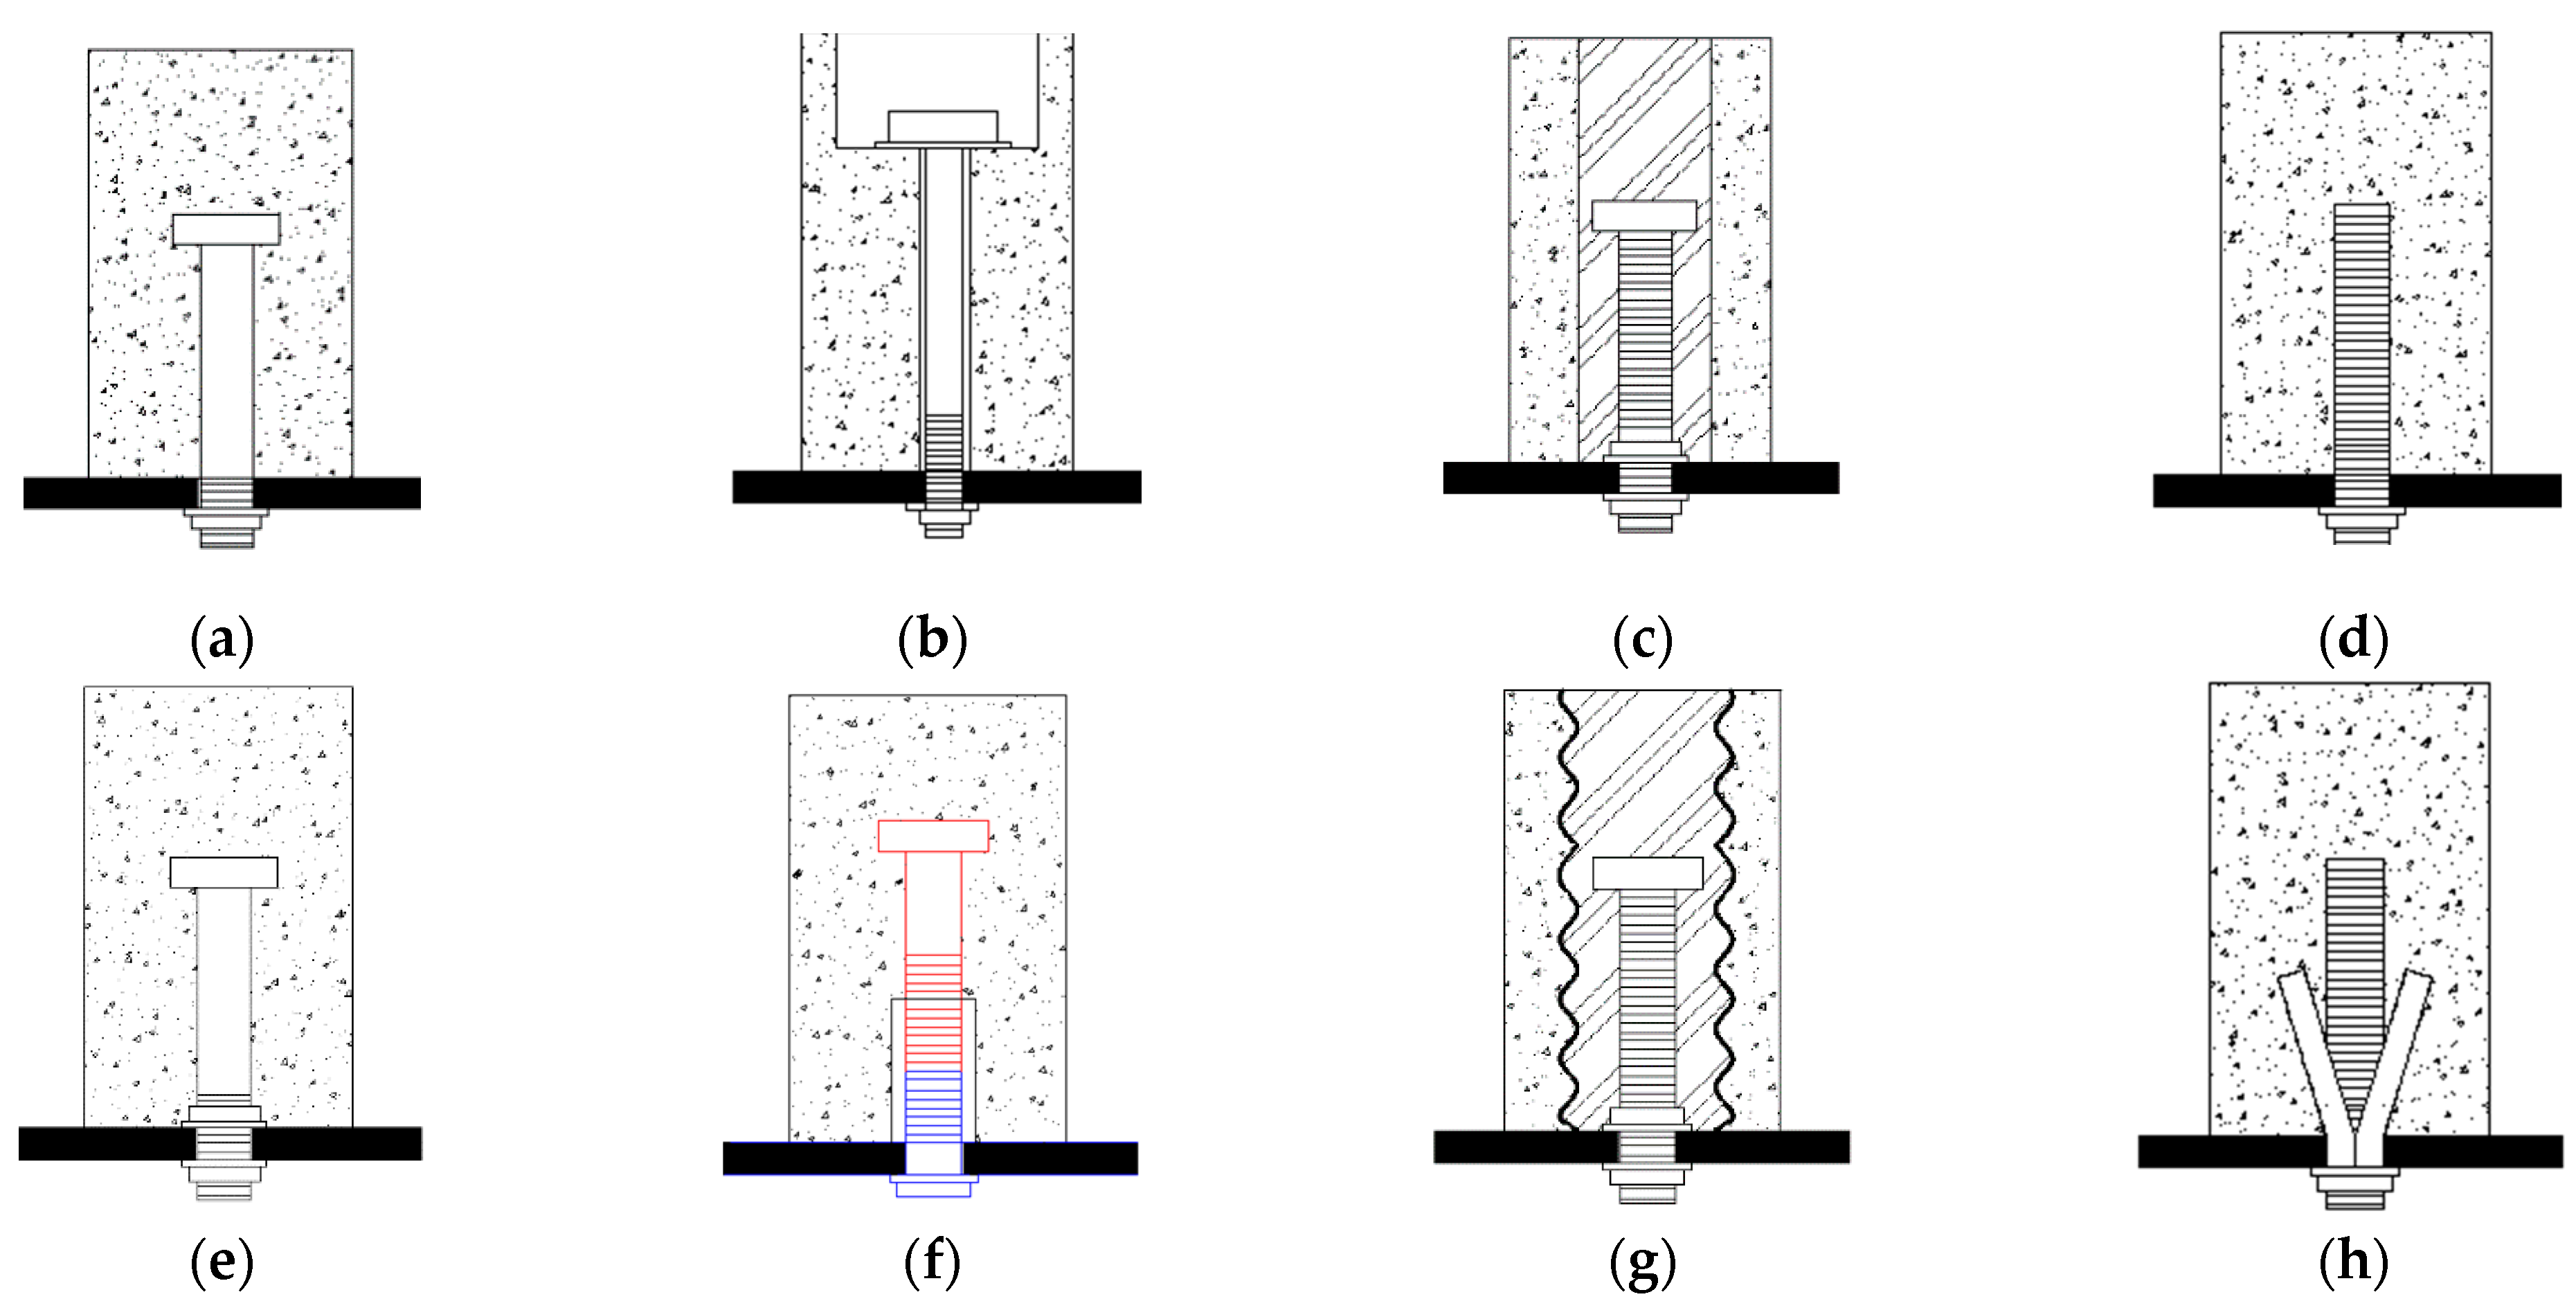
Steel–concrete composite structures such as steel–concrete composite beams (SCCBs) have been widely used in civil engineering construction as they take full advantage of both materials. Mechanical shear connectors are the key element to ensure the bond composite action between the surfaces of the steel–concrete, which are applied to transfer the longitudinal shear forces across the interface of the steel girders and concrete plates. Among the various kinds of mechanical shear connectors, welded headed studs are the most common one because of their convenient construction, favorable mechanical properties and comprehensive research achievements [1,2,3,4,5,6,7]. However, from the perspective of sustainable development, conventional SCCBs, of which the steel studs are welded on the top of the steel beams and cast into concrete slabs, are complicated and inefficient to disassemble and reuse in the process of building replacement, rehabilitation or strengthening. High-strength bolts with outstanding characteristics (i.e., fatigue performance, tight connection and convenience for dismantling) are usually employed in steel structures because the connection fasteners can be utilized as the demountable mechanical shear connectors to substitute the headed studs in SCCBs. Several studies have reported SCCBs by applying high-strength bolted shear connectors (HSBSCs). Figure 1 presents different types of bolted shear connectors utilized in SCCBs.
Previously, Dallam [8] and Marshall et al. [9] undertook a set of static push-off experiments to study the structural performance of high-strength pretensioned bolts (Figure 1a,b) as shear connectors applied in SCCBs. The results showed that the shear capacity of bolted shear connections is more excellent than that of steel studs. Following this, two methods of installing high-strength bolts (Figure 1b,c) as shear connectors in rehabilitation work were evaluated by Dedic and Klaiber [10], showing that the high-strength bolts can function as shear connectors with comparable strength to headed studs. In addition, a series of experimental studies have been performed by Kwon et al. [11,12] to explore the mechanical behavior of three types of post-installation bolted shear connectors (Figure 1b–d) subjected to static and fatigue loading. However, those studies have mainly concentrated on strengthening existing non-composite bridges rather than sustainable construction.
Additionally, to accelerate the construction of SCCBs and conform to sustainability, different types of novel demountable bolted shear connectors (Figure 1e–g) manufactured from headed studs or conventional bolts were developed [13,14,15,16,17], and a range of experimental tests were performed to explore the shear performance and the feasibility of bolted connections in composite structures. Pavlović et al. [18] revealed that employing high-strength bolts (Figure 1e) as shear connectors in prefabricated SCCBs could improve the construction efficiency, with a similar shear capacity to steel studs. Zhang et al. [19] explored the shear behavior and the failure modes of HSBSCs (Figure 1b) in prefabricated SCCBs and proposed design recommendations for evaluating the ultimate shear load of HSBSCs. Moreover, Liu et al. [20,21,22] and Ataei et al. [23,24] studied the structural behavior of high-strength friction-grip bolted shear connectors (Figure 1b) in steel-precast geopolymer concrete composite beams by performing comprehensive experiments and finite element analysis (FEA), and the practical design equations were also presented for estimating the shear bearing capacity and the load-displacement response of bolted connectors. Besides, Tan et al. [25] conducted a list of push-off tests to estimate the performance of three types of demountable bolted shear connectors (Figure 1a,e,h) under combined shear and tensile loading. It was found that the ultimate bolted shear connection resistances would be reduced when tensile force was applied. Meanwhile, Ding et al. [26,27] carried out a series of push-off tests and numerical analyses to investigate the behavior of headed shear studs in conventional forward push-off loading, inverse push-off loading and cyclic loading conditions. The results demonstrated that the shear capacity of stud shear connectors subjected to inverse push-off loading was lower than that in forward push-off loading conditions, and the shear resistance and the load-displacement response of the headed studs under different loading conditions were put forward.
Previous studies mainly focused on the positive moment area of composite beams, in which the shear connectors were in static forward push-off loading condition (see Figure 2). The shear property of HSBSCs subjected to inverse push-off loading is also an essential factor in assessing structural seismic behavior. Nevertheless, few investigations have been conducted on the static behavior of HSBSCs in inverse push-off loading conditions. This study will focus on this aspect. Because of the higher computational efficiency and lower economic cost of numerical techniques than experiments, an accurate and efficient 3D nonlinear finite element model (FEM) of the push-off tests was developed and verified initially. The geometric and material nonlinearities of all components such as concrete, high-strength bolt and steel beam were considered in the modeling. Then, the validated model was further used to predict the load–slip response and failure modes of HSBSCs under inverse push-off loading. Furthermore, parametric studies were performed to inspect the effects of concrete strength, the diameter and tensile strength of the bolt and the clearance between a concrete slab and a bolt as well as bolt pretension on the shear capacity and the load–slip response of the HSBSCs. Finally, a practical prediction formula of per bolted connection resistance was proposed.
2. Finite Element Model
A nonlinear 3D FEM was developed using the software ABAQUS/Standard 6.14 [28] to study the structural performance of the HSBSCs in push-off tests. To capture accurate and reasonable results from the FEA, all components such as the concrete plate, high-strength bolt and steel girder as well as steel bars were suitably modeled to match the real condition. Both geometric and material nonlinearities of all structural components were taken into account in the FE analysis.
2.1. Model Geometry
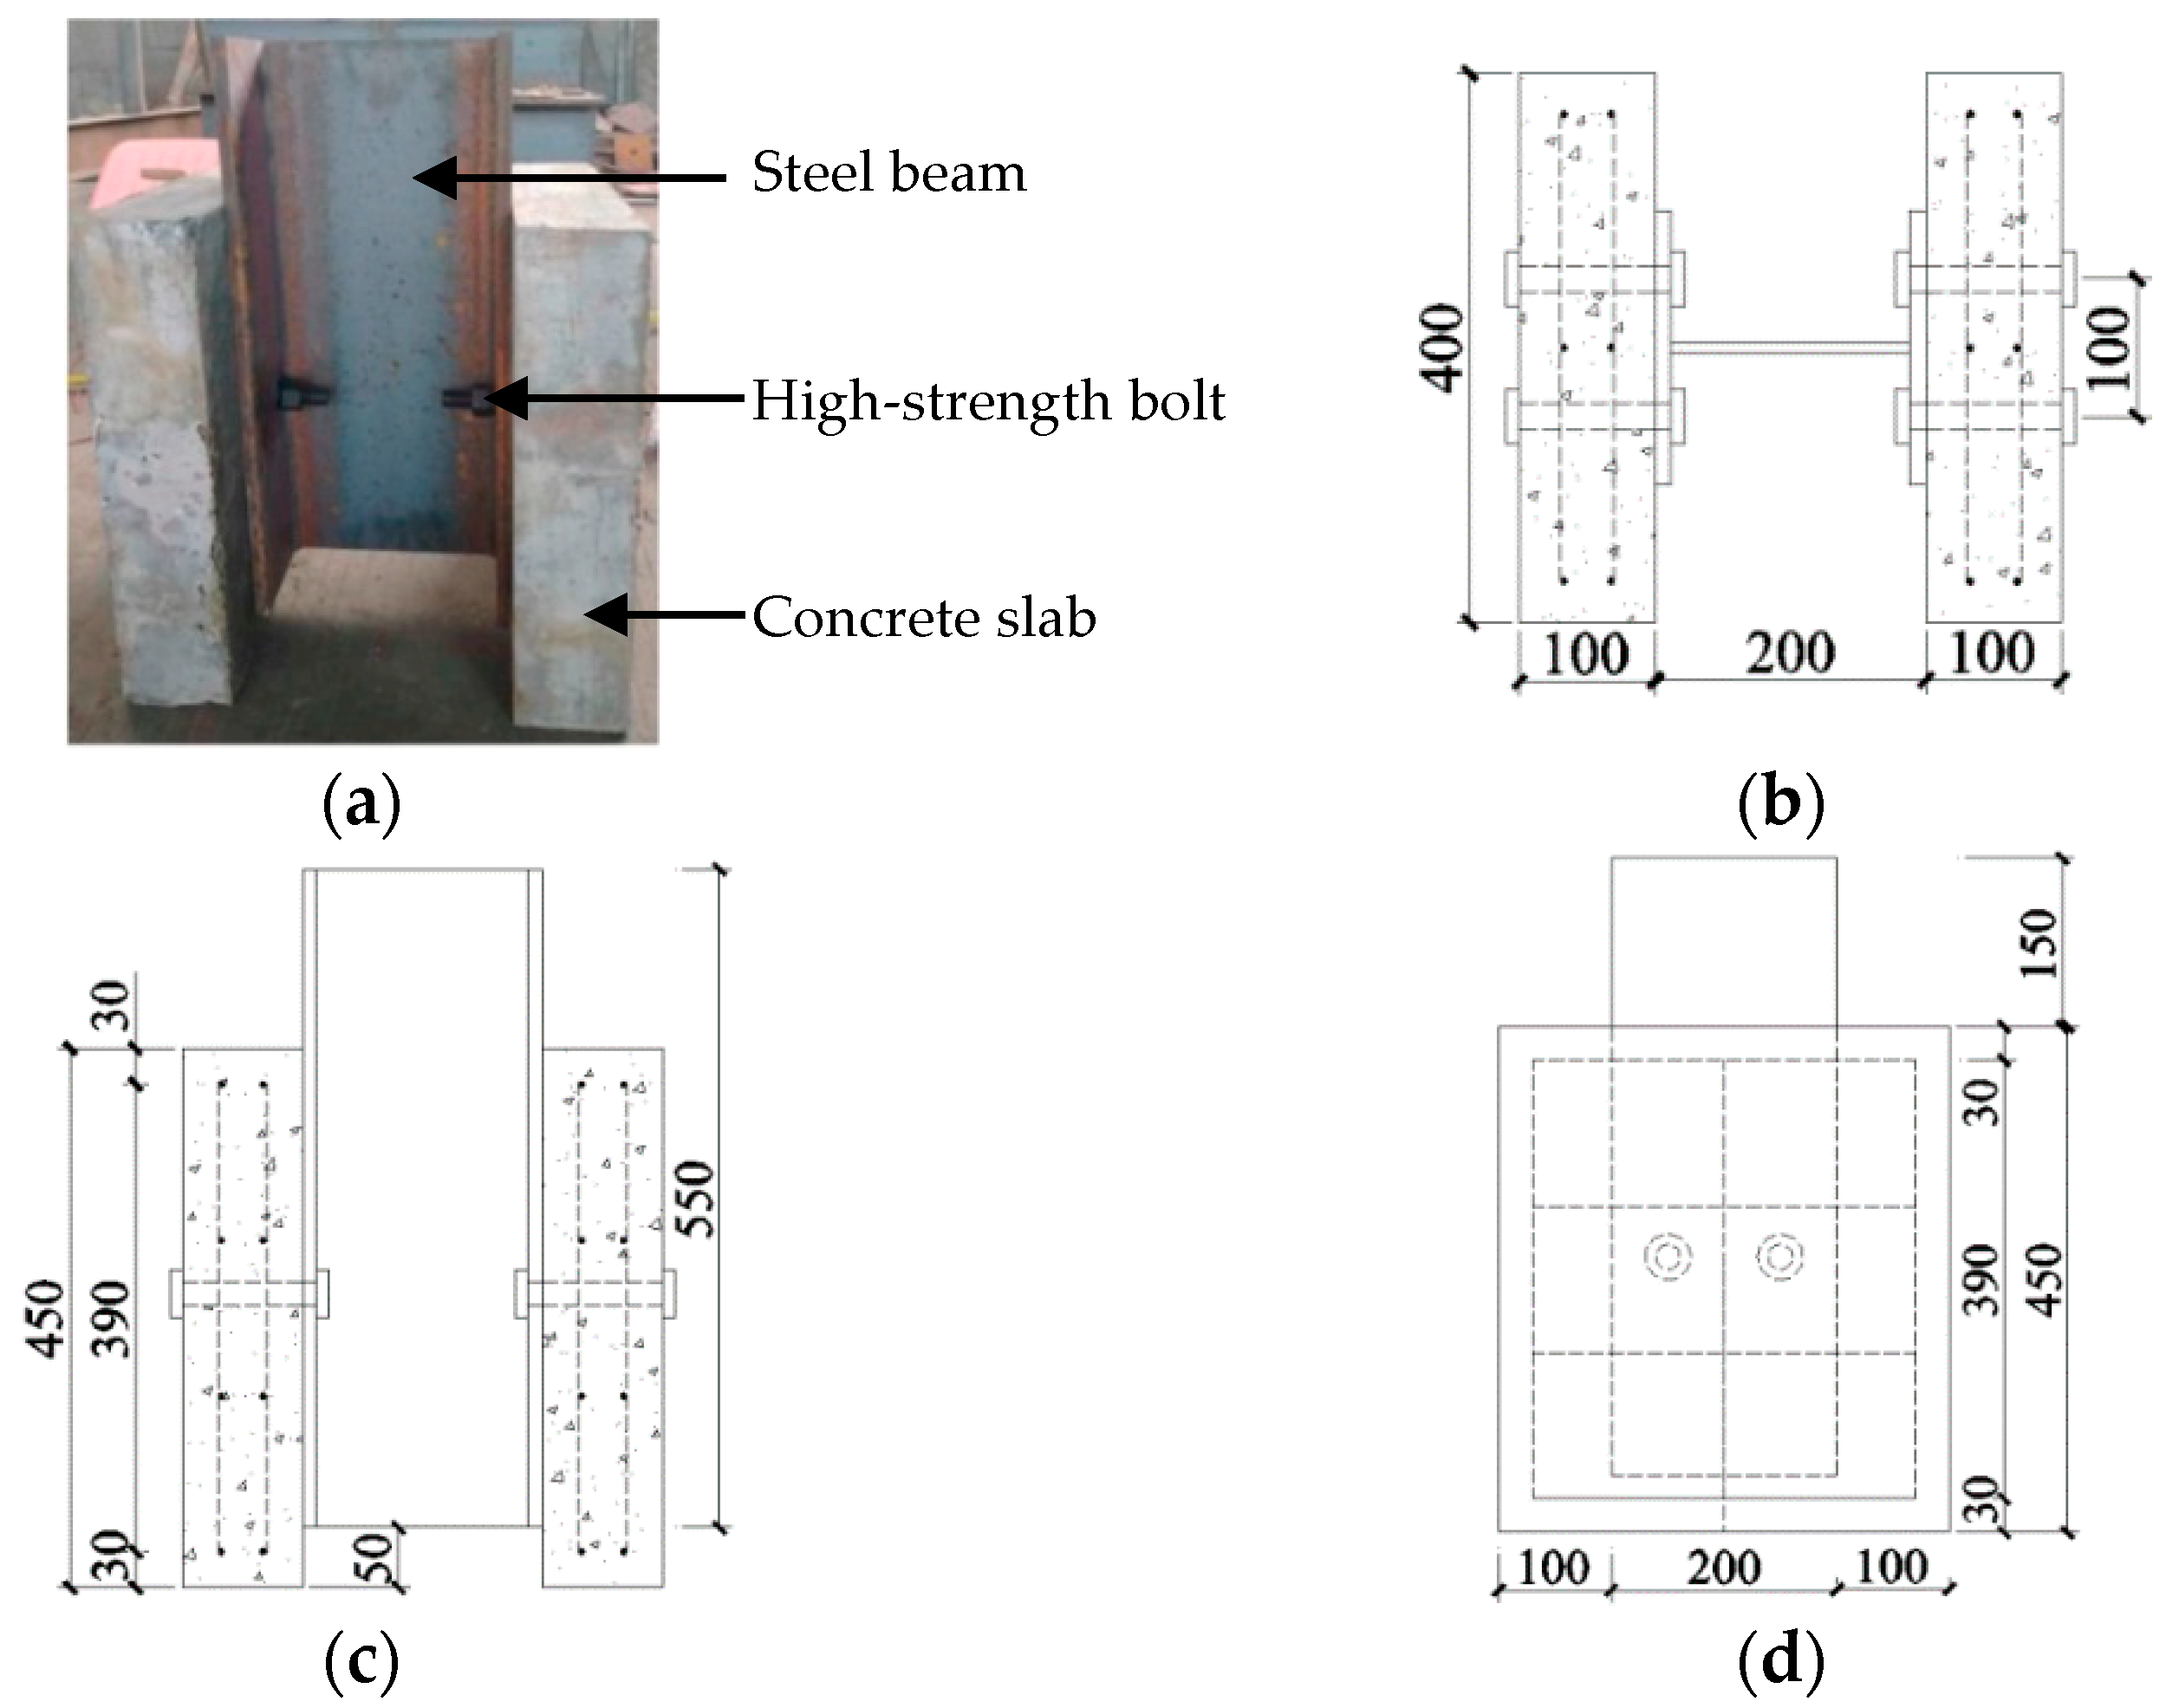
Figure 3 depicts the details of the push-off test specimens conducted by Zhang et al. [19]. The specimens consisted of a Chinese steel beam (HW 200 × 200 × 14/14) attached to two prefabricated concrete plates (450 mm long, 400 mm wide and 100 mm thick). Four 10.9-grade high-strength bolts were mounted on each specimen to achieve the bond composition between the concrete slab and steel beam. All structural components of experimental specimens such as concrete plate, steel girder, high-strength bolt and reinforcement were modeled in this study.
2.2. Finite Element Mesh
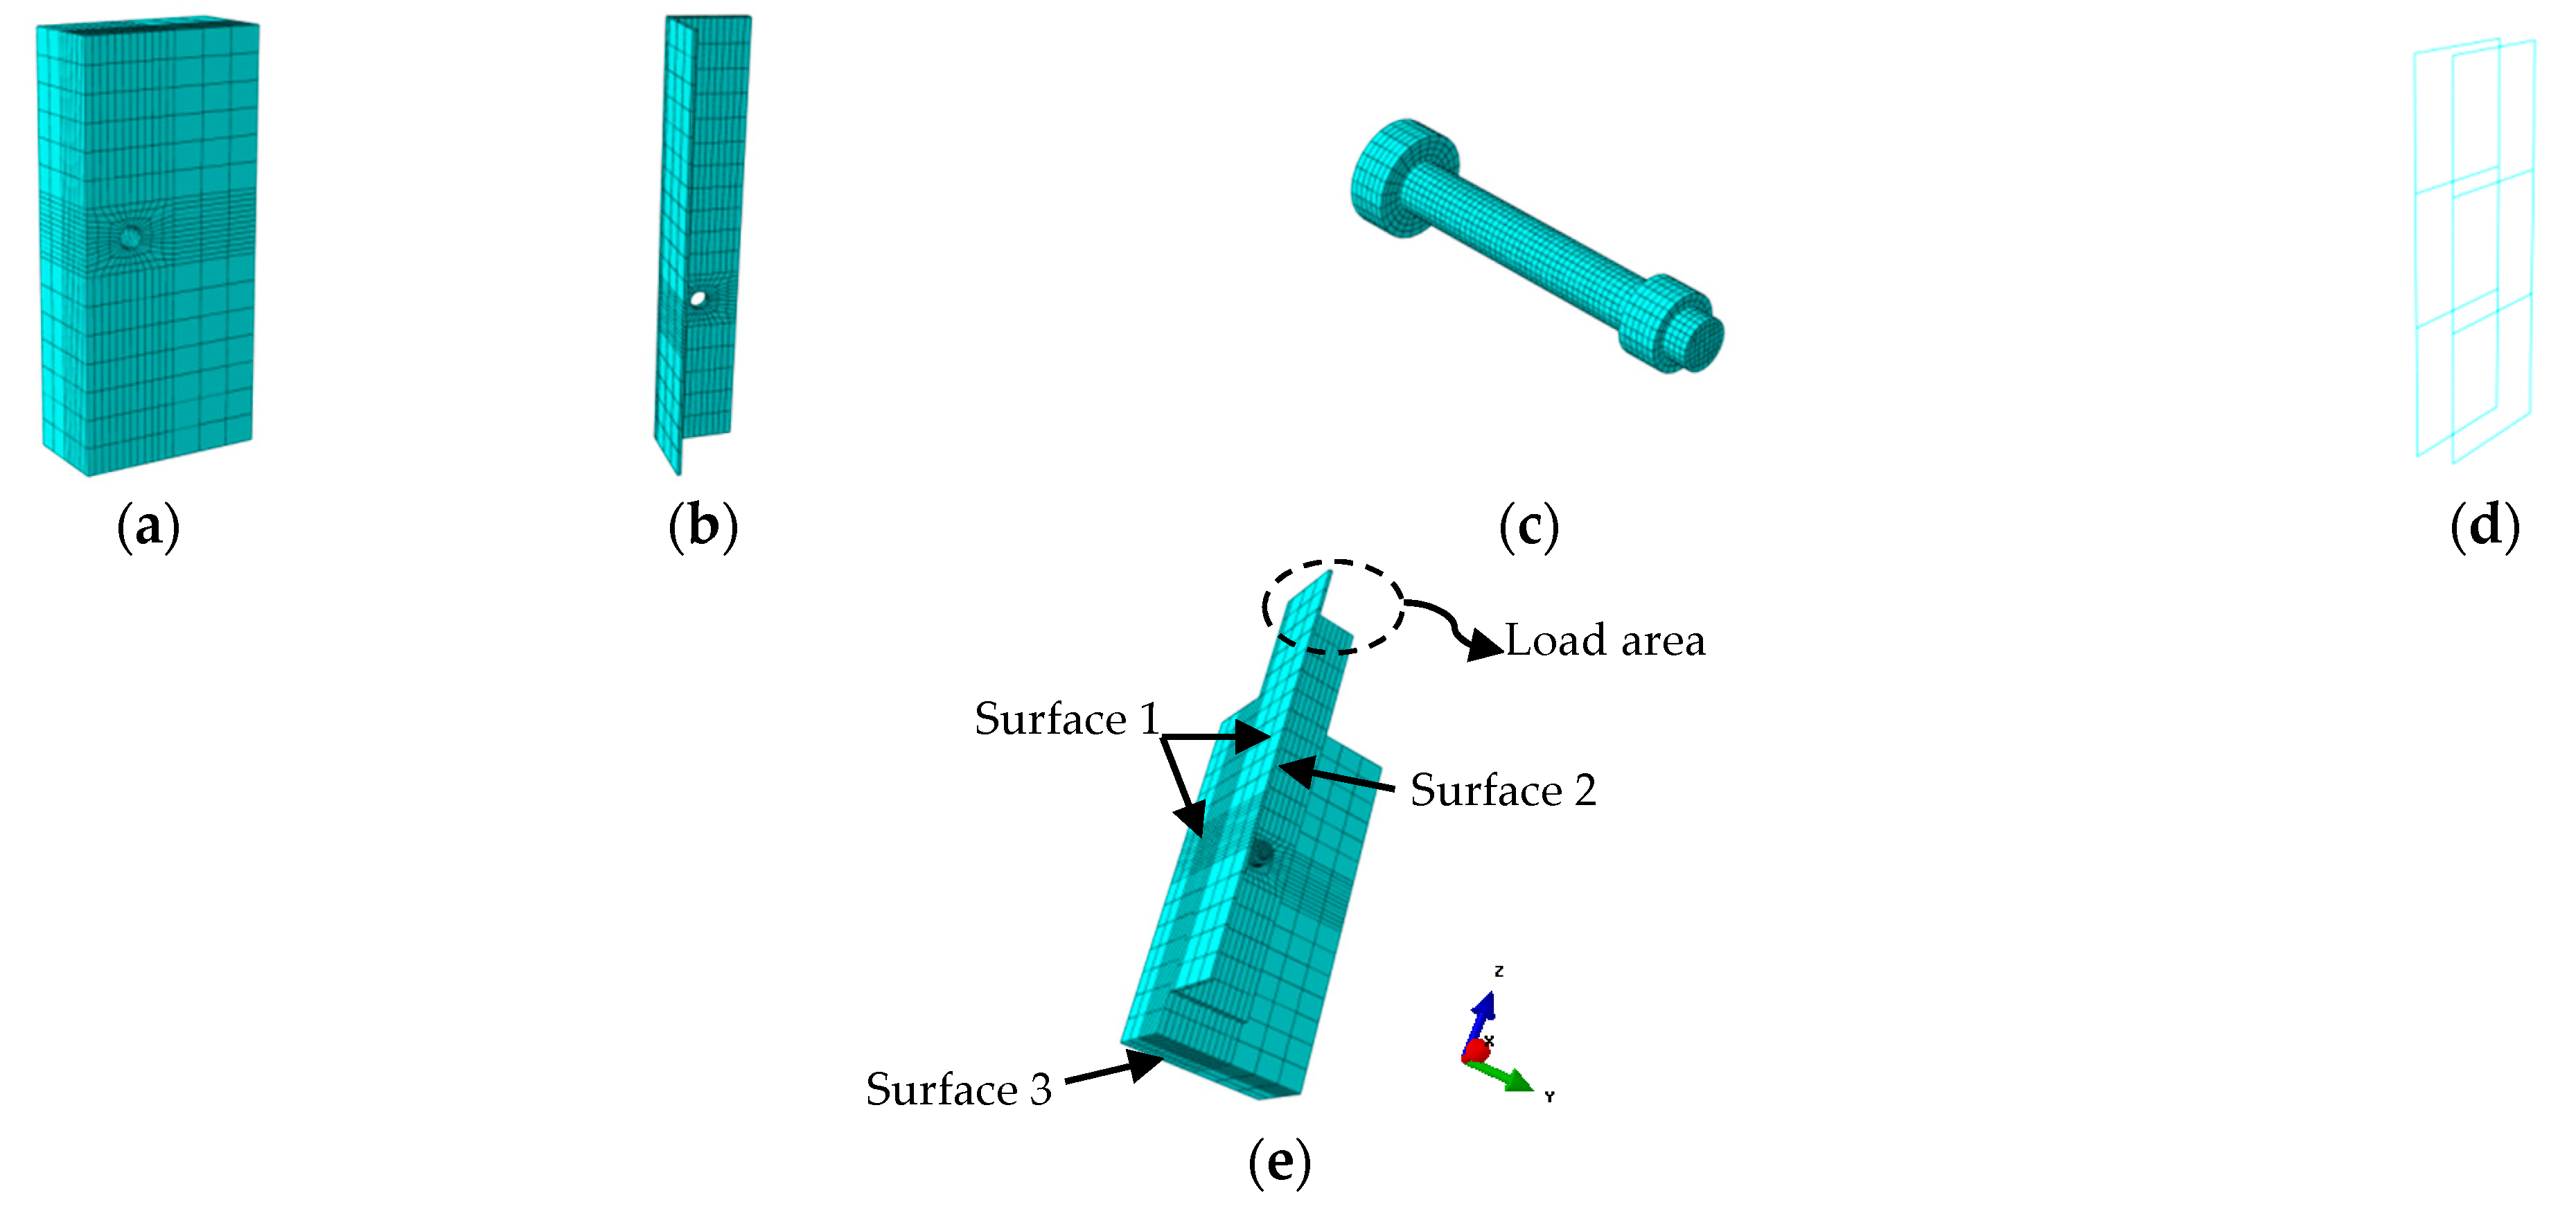
C3D8R solid elements with reduced integration were introduced to mesh and model the concrete plate, steel girder and high-strength bolt. T3D2 solid elements with the linear approximation of displacement were used to model the steel reinforcements embedded in the concrete slab. Figure 4 presents the meshing details of the FEM developed in this paper. Only a quarter of the push-off test specimen was established because of the material and geometry of symmetry of the tested specimens and the loading condition. The thread part with the hexagon head of the high-strength bolt was simplified to round bars with equivalent section diameters. To ensure the simulation accuracy and reduce the computational time, a fine mesh scale with the size of 2.0 mm was used for the bolted shear connectors, the regions around the concrete holes as well as the steel holes, while a coarse mesh scale of about 30 mm was adopted for concrete slabs and steel beams.
2.3. Material Modeling
The material constitutive models of concrete proposed by Ding et al. [29] were validated by experiments in compression and tension with strengths ranging from 20 to 140 MPa. They were applied for the concrete slab in this study. The stress–strain relationship of concrete can be expressed by Equation (1).
where y = σ/fc and x = ε/εc are the stress and strain of the core concrete to uniaxial compressive concrete, respectively; σ and ε are the stress and strain of the core concrete, respectively; fc (=0.4fcu7/6) denotes the uniaxial compressive strength of the concrete, εc (=383fcu7/18 × 10−6) denotes the strain corresponding to fc and fcu represents the compressive cubic strength of the concrete. A (=9.1fcu−4/9) is the ratio of the initial tangent modulus to the secant modulus at peak stress, and B is equal to 1.6(A − 1)2, which controls the decrease in the elastic modulus along the ascending branch of the axial stress versus strain relationship. α1 is the parameter that controls the descending section. In this study, a concrete damaged plasticity (CDP) model with the key plastic parameters [30], as shown in Table 1, was utilized to represent the concrete behavior.
An elastic-plastic model with Von Mises yield criteria, Prandtl–Reuss flow rule and isotropic strain hardening was applied to depict the material behavior of the steel girder and bars. The stress–strain relationship of steel is given as follows [29]:
where σi and εi are the equivalent stress and strain of the steel, respectively; fy and fu (=1.5fy) are the yield strength and the ultimate strength of the steel, respectively; εy, εst (=12εy) and εu (=120εy) are the yield strain, hardening strain and ultimate strain of the steel, respectively; Es is the elastic modulus.
The tri-linear model presented by Loh et al. [31] was applied to model the material behavior of the high-strength bolt, and the stress–strain relationship is represented as follows, which was also utilized by Liu et al. [21,22].
where σbt, εbt and εbty are the equivalent stress, equivalent strain and yield strain of the high-strength bolt, respectively; fbtu and Ebs are the ultimate strength and elastic modulus.
2.4. Boundary Conditions
Figure 4e shows the symmetric boundary conditions used in the FEM in this study. All nodes lying in the X-Z plane of Surface 1 (the steel girder flange and concrete plate) were restricted with the direction translation of the Y axis and the X and Z axes rotation (UY = URX = URZ = 0). All nodes at the Y-Z plane of Surface 2 (the middle plane of the steel girder web) were prevented at the X-direction translation as well as the Y and Z axes rotation (UX = URY = URZ = 0). In addition, the translational and rotational movements were fixed at the X-Y plane of Surface 3.
2.5. Interaction and Constraint Conditions
All of the interfaces in the FEM, including steel–concrete, steel–bolt and bolt–concrete, were simulated by utilizing the surface-to-surface method available in ABAQUS. The normal behavior and tangential response were simulated by the HARD contact and the penalty method, respectively. Since the friction property between the steel beam and concrete slab was not mentioned in the work of Zhang et al. [19], the friction coefficient was assumed as 0.3 for the contact between the steel–concrete components and as 0.25 for all of the other interactions [21] in this paper. The embedded constraint was chosen to simulate the constraint between the concrete plate and the reinforcements. The influences of the relative slip and debonding of the bars regarding concrete plate were not considered.
2.6. Load Application and Analysis Steps
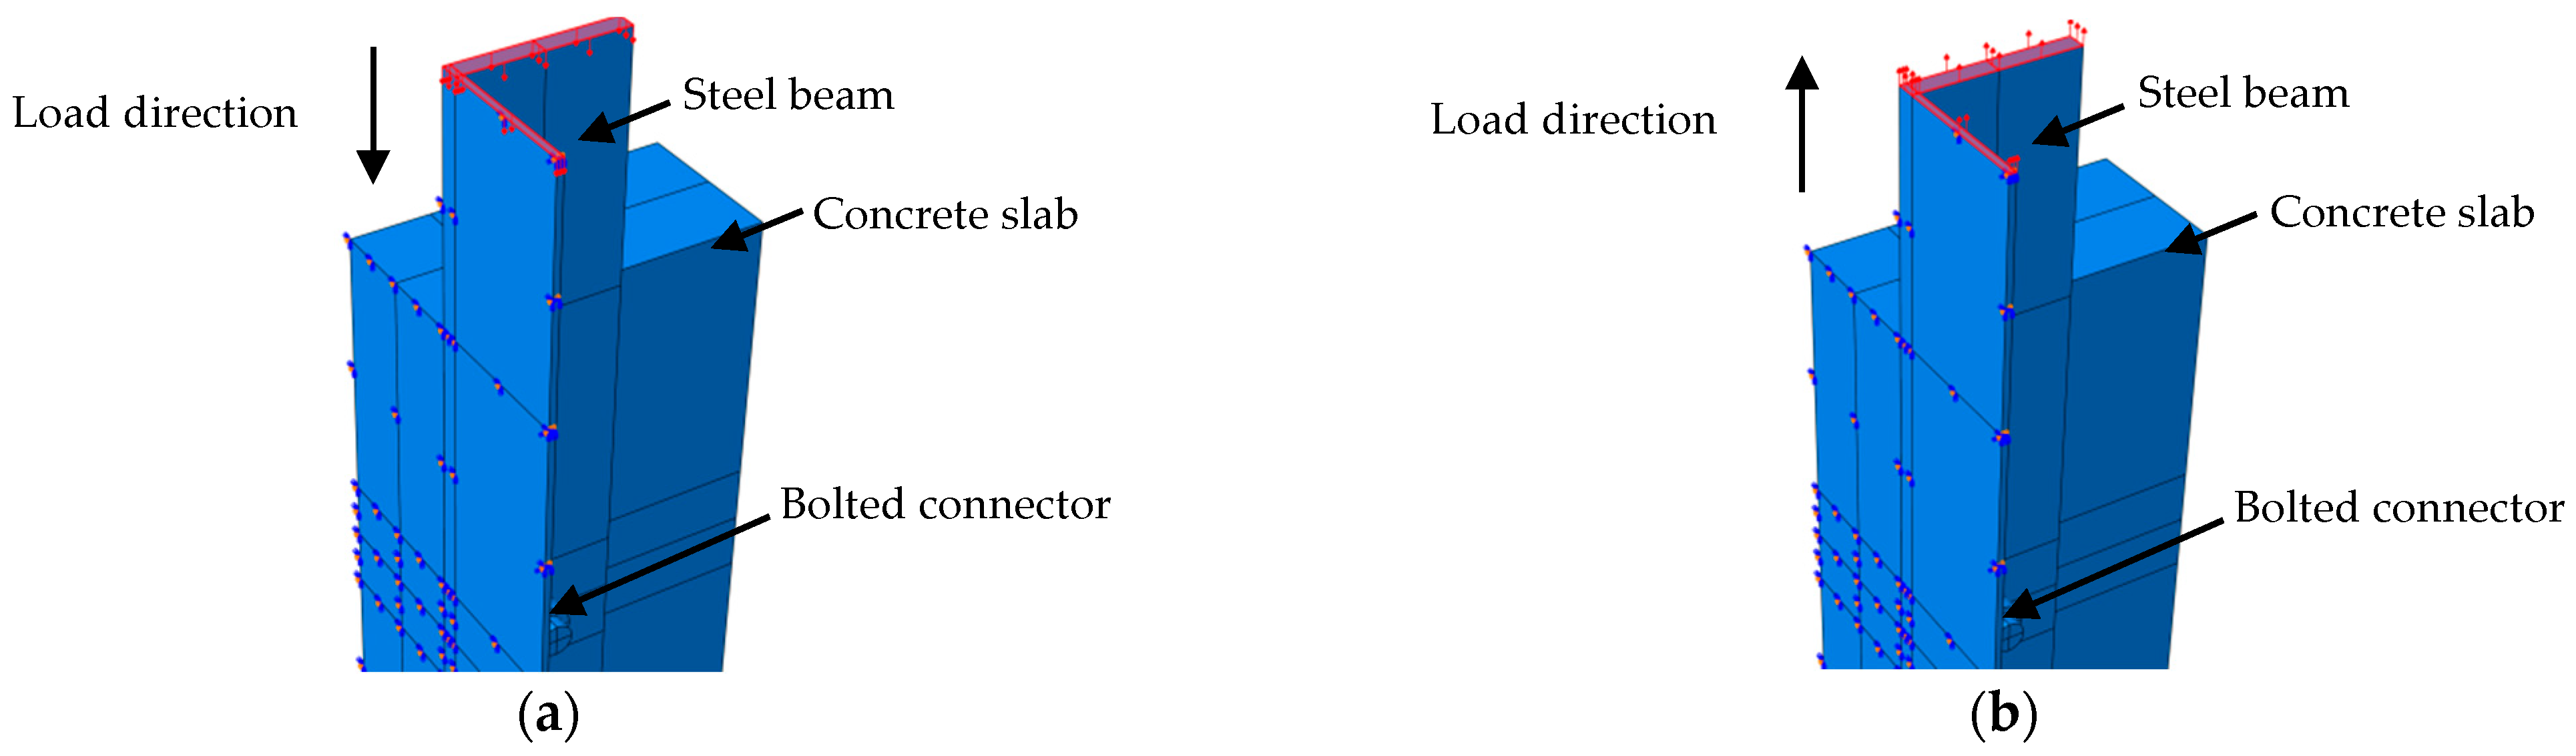
In this study, the FE calculation mainly proceeded in two analysis steps. Firstly, the pretension force of bolt connectors was employed by utilizing the BOLT LOAD function available in ABAQUS. Secondly, push-down loads in the push-off tests were applied on the top surface of the steel girder (see Figure 4e). Figure 5 displays the load diagram of the model.
2.7. Validation of FEMs
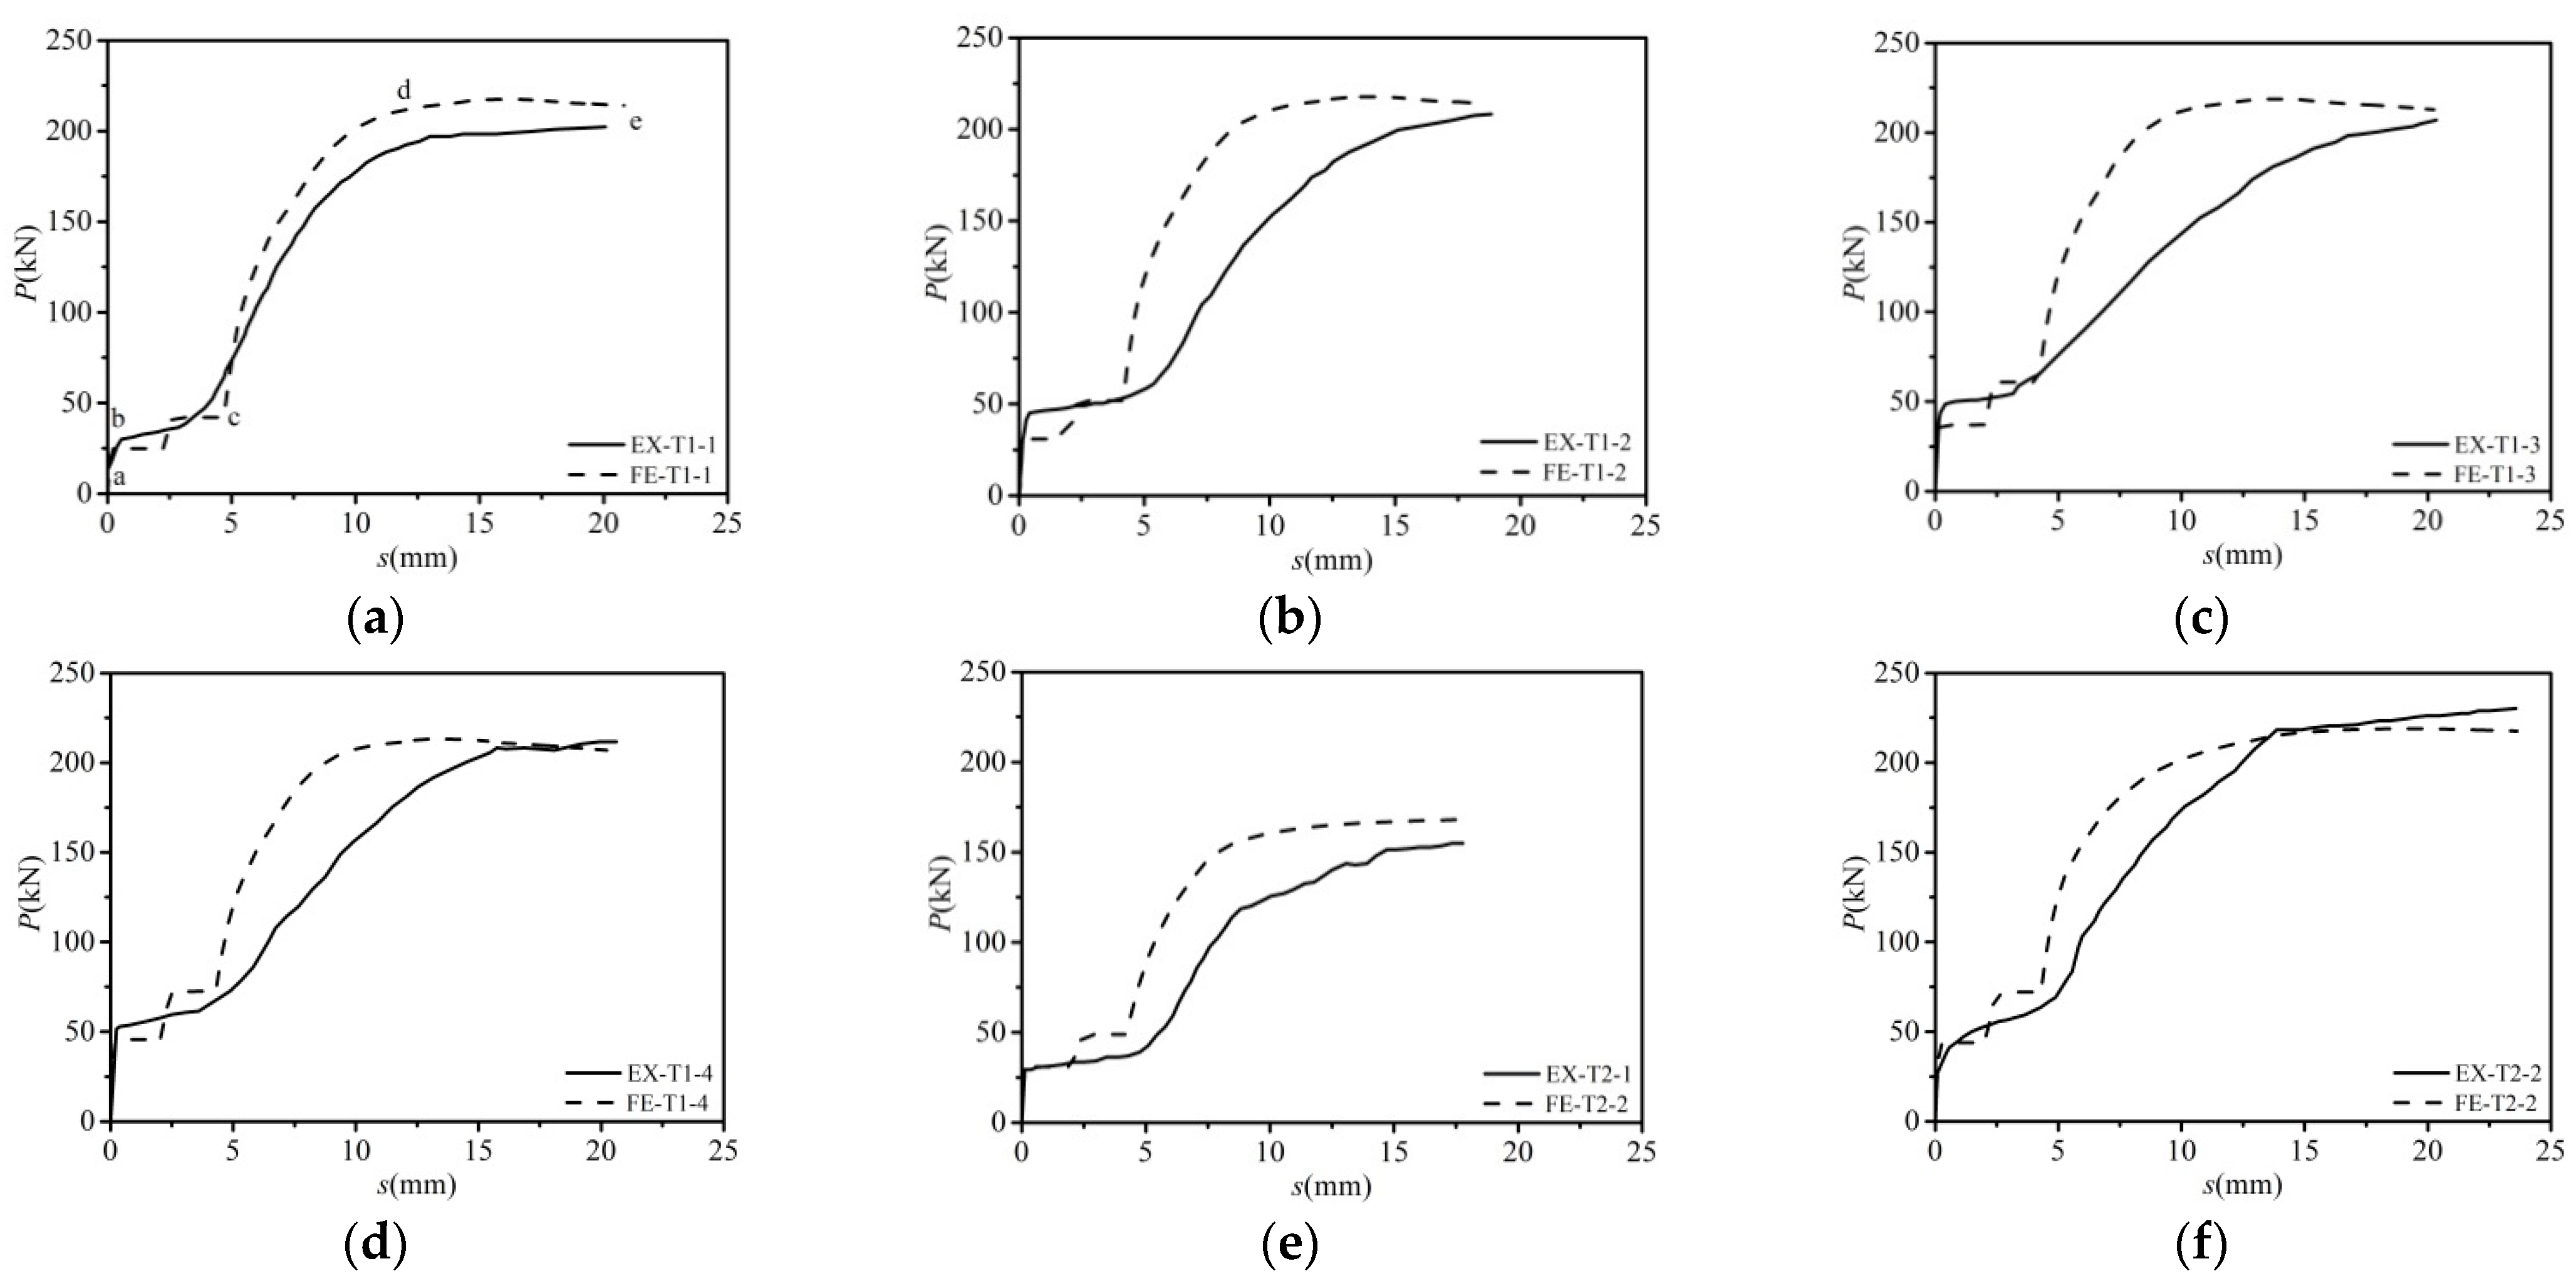
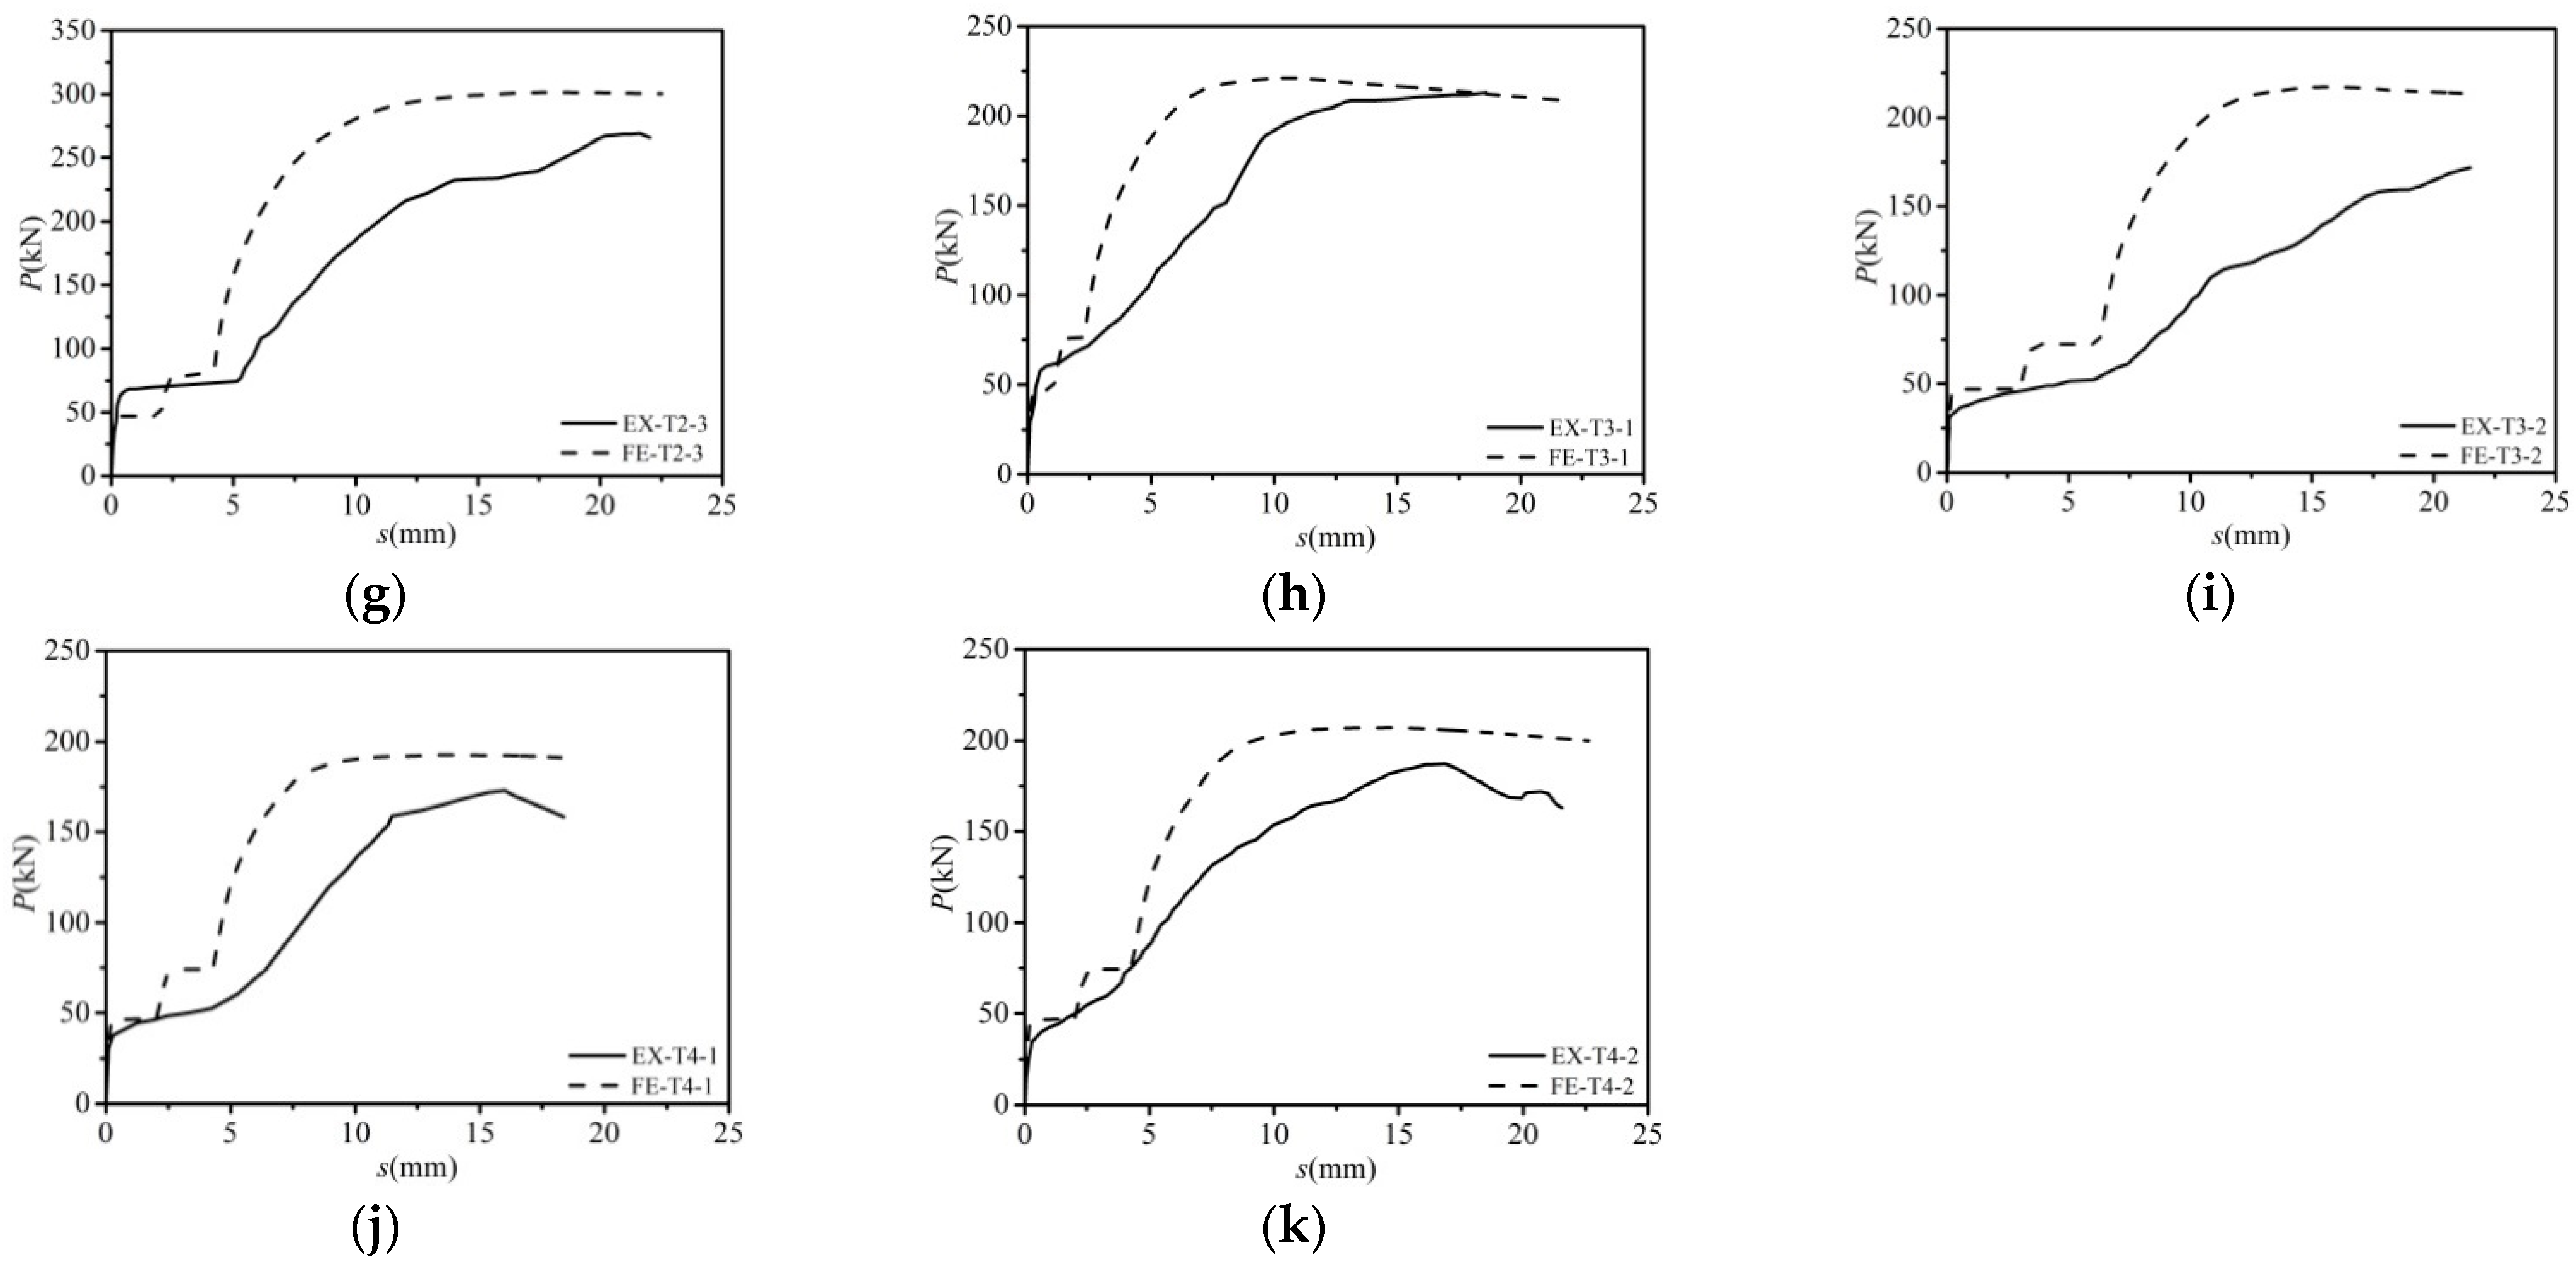
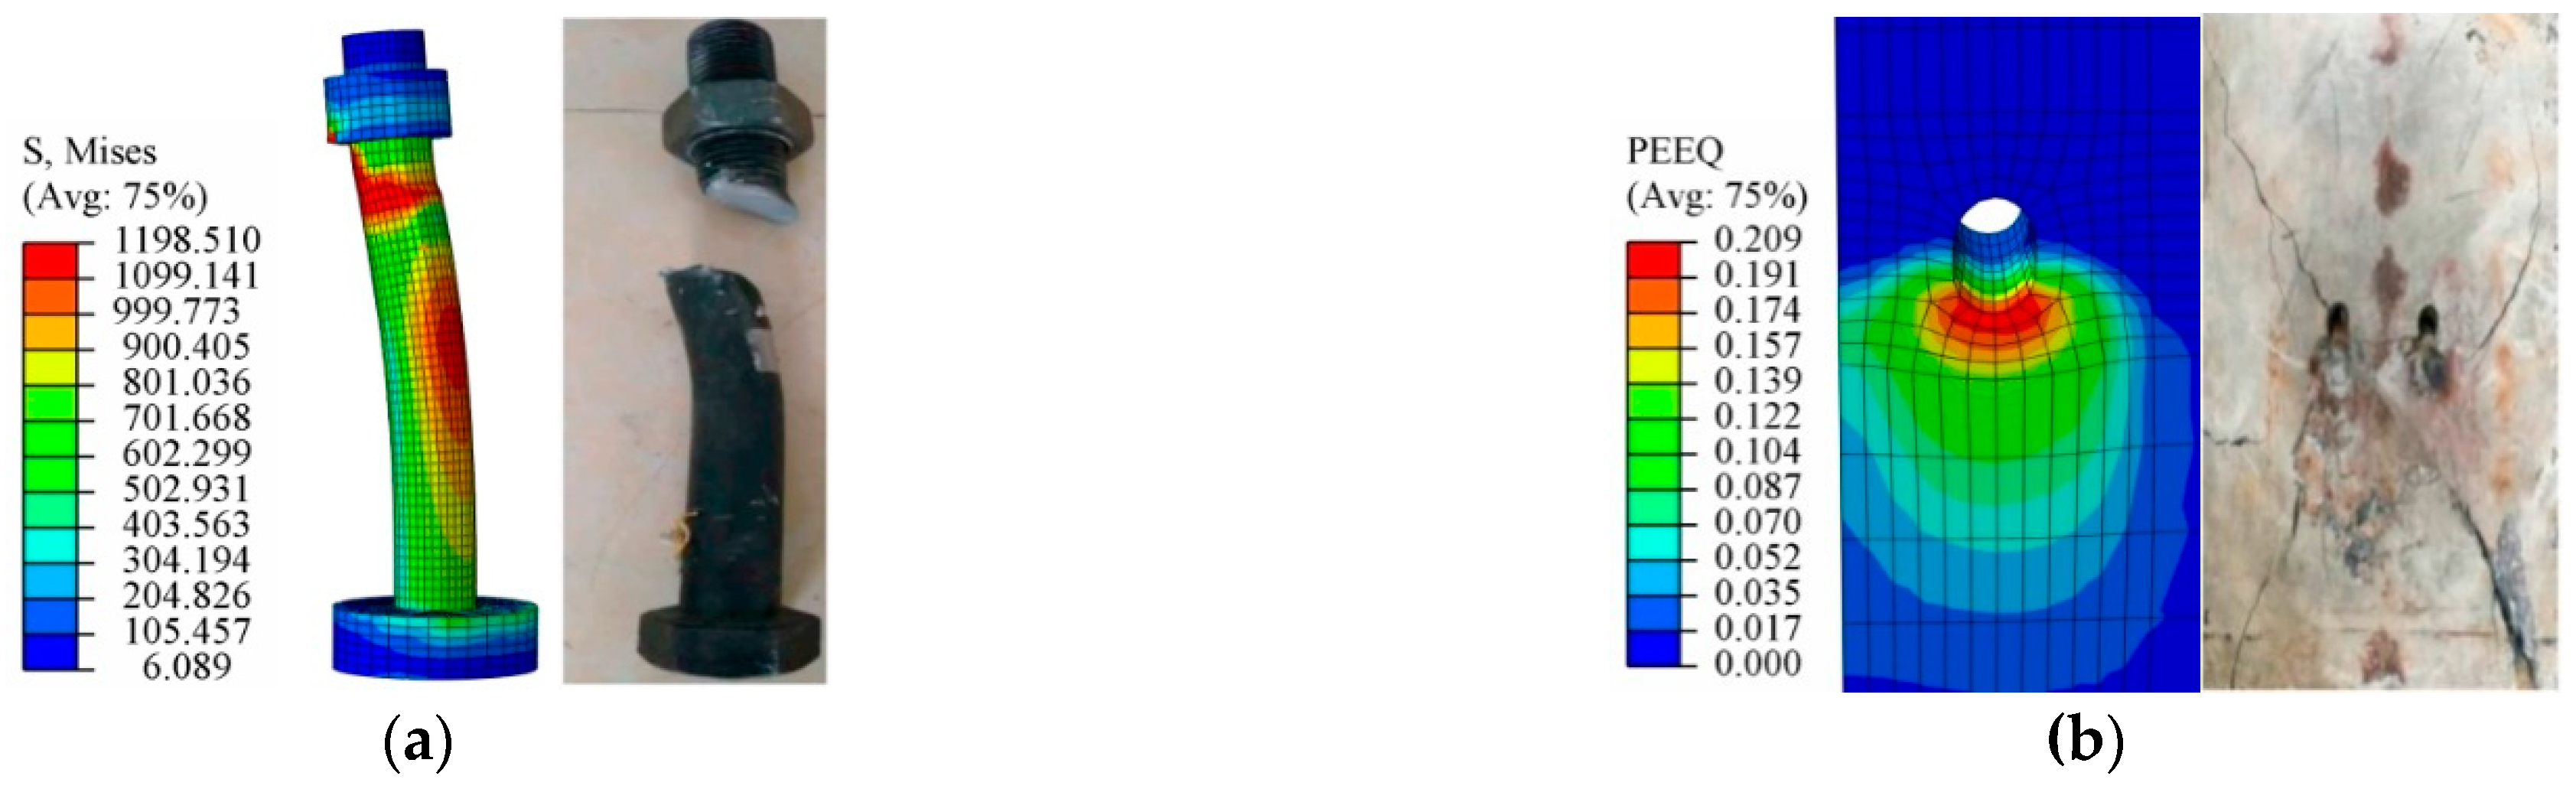
In this research, the validation of the FEM was conducted based on the push-off test results available in the report by Zhang et al. [19], in which eleven push-off tests were performed to investigate the shear behavior of the HSBSCs in prefabricated SCCBs. The ultimate shear capacity per bolt obtained from the tests and FEMs are compared in Table 2, in which P0f and Puf are defined as the load at the first slip and the ultimate load captured by the FEMs, respectively. The mean value of P0/P0f was 0.975, while the corresponding coefficient of variation (COV) was 0.194. The deviation may be because the assumed value of the friction coefficient between the steel girder and slab was not exactly equal to the actual friction coefficient. However, the ultimate load analyzed by the FEMs is in good agreement with the test results (mean value of Pu0/Puf = 0.925; COV = 0.082). The load–slip response calculated by the FEMs was also compared with the tested results in Figure 6. It was observed that the load–slip curves captured by the FEMs had the same trend as the tested ones, which can be divided into four stages (see Figure 6a), namely friction transferring force stage (a,b), slipping stage (b,c), bolt shank transferring stage (c,d) and failure stage (d,e). In these comparisons, the load–slip relationships obtained from FE modeling correlated well with the tested counterparts in the initial loading stage. The stiffness of the HSBSCs in the bolt shank transferring stage (c–d) obtained by the FEMs was slightly higher than that of the tested ones as the external load increased. This could be attributed to the fact that the screw threads in the simplified modeling were not considered. Additionally, the differences between the theoretical and experimental curvatures were caused by the slip at the steel–concrete interface [19]. The typical failure models captured by FE modeling were also compared with the tested ones in Figure 7, and a good correlation was observable between the FE and experimental results. The FE analyses and the tested results agreed with each other reasonably well in brief, with just a slight discrepancy, implying that the developed FEM could be utilized to predict the fundamental behavior of SCCBs with HSBSCs.
3. Prediction of Shear Behavior under Inverse Push-Off Loading
3.1. FEM
This study, based on the previous investigation by Ding et al. [26], predicted the mechanical behavior of the HSBSCs under inverse push-off loading. The sample in the FEM had the same geometry details and material properties as those of the tests by Zhang et al. [19], except that the loading direction was changed to match the inverse push-off tests performed by Ding et al. [26]. The load diagram of the inverse push-off modeling is depicted in Figure 5b.
3.2. Results and Discussion
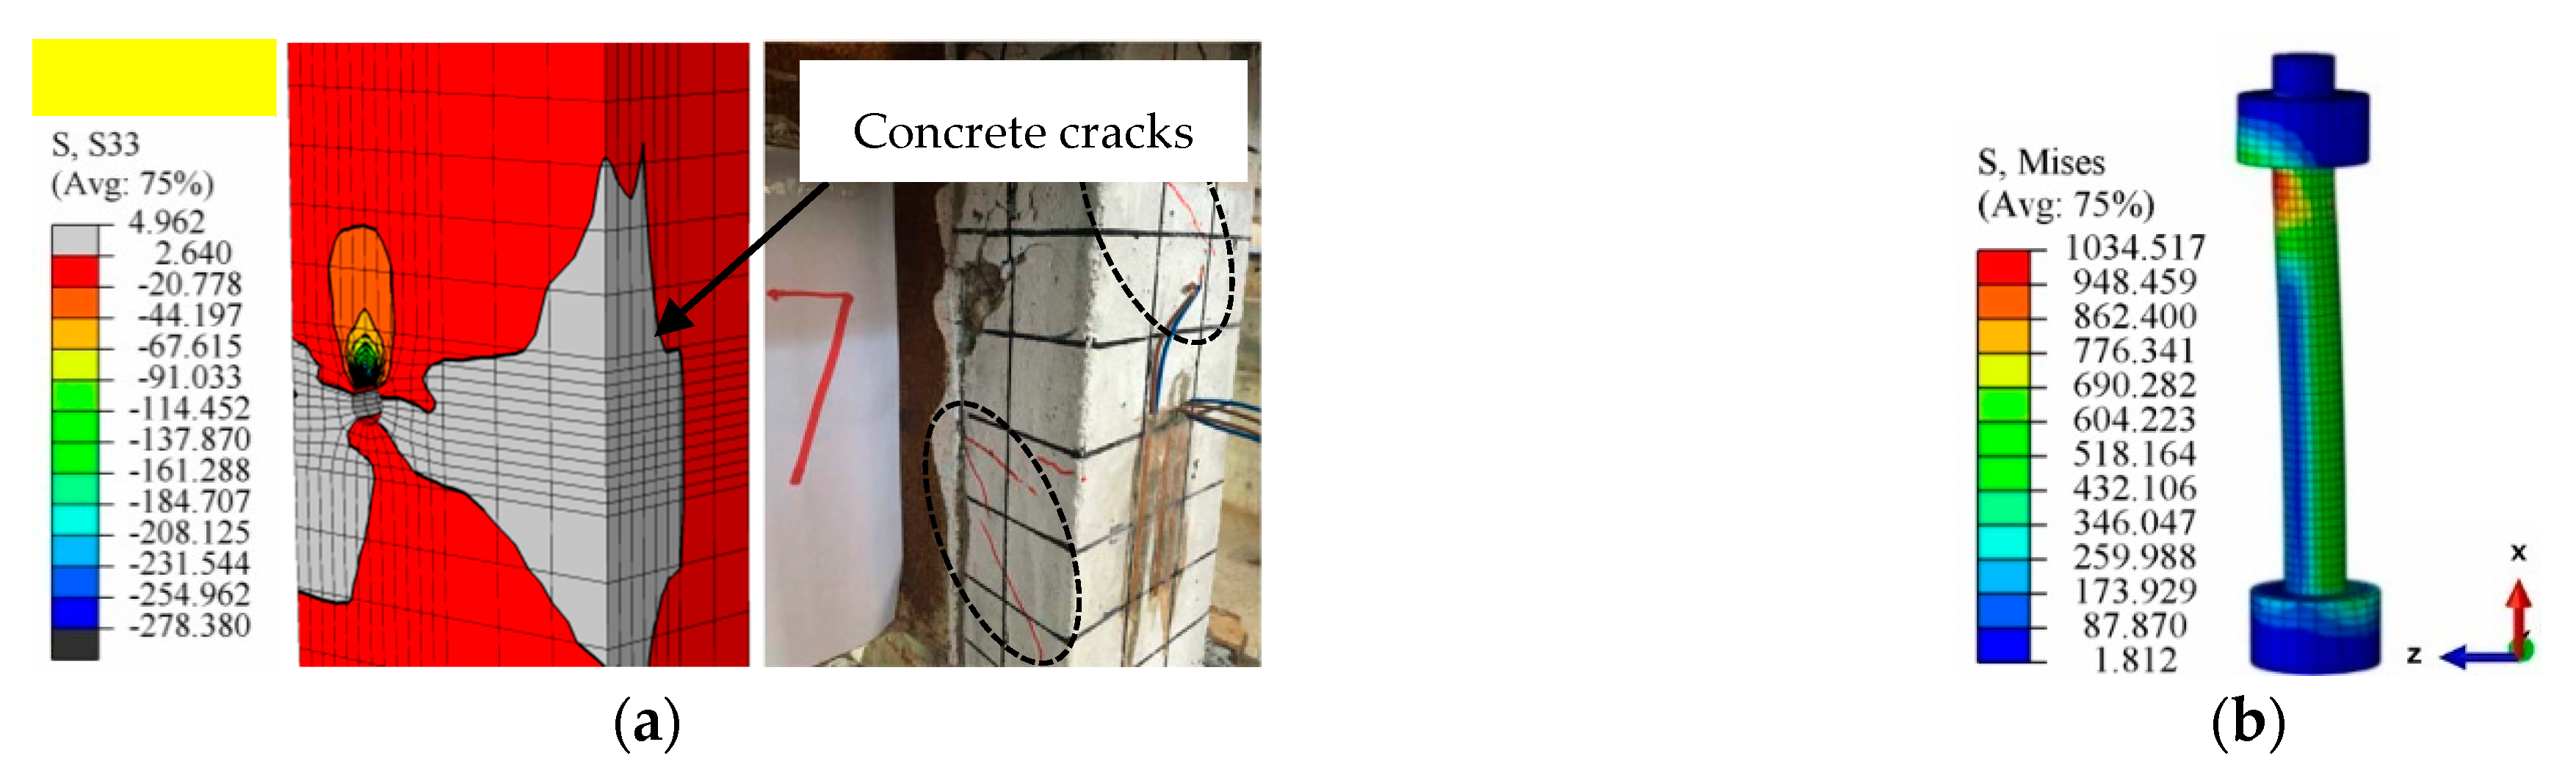
The inverse push-off FE analysis showed that concrete failure was the primary failure mode for all specimens conducted by Zhang et al. [19], which is different from that for the push-off FE analysis. Figure 8 shows the failure model of the T2-1 specimen (d = 16 mm, fcu = 50 MPa) subjected to inverse push-off loading. The results predicted by the failure model agreed well with the experimental observation. It demonstrated that the maximum stress of the concrete reached its tensile strength, causing concrete failure, while the maximum stress of the bolt (1035 MPa) was smaller than the ultimate strength (1150 MPa).
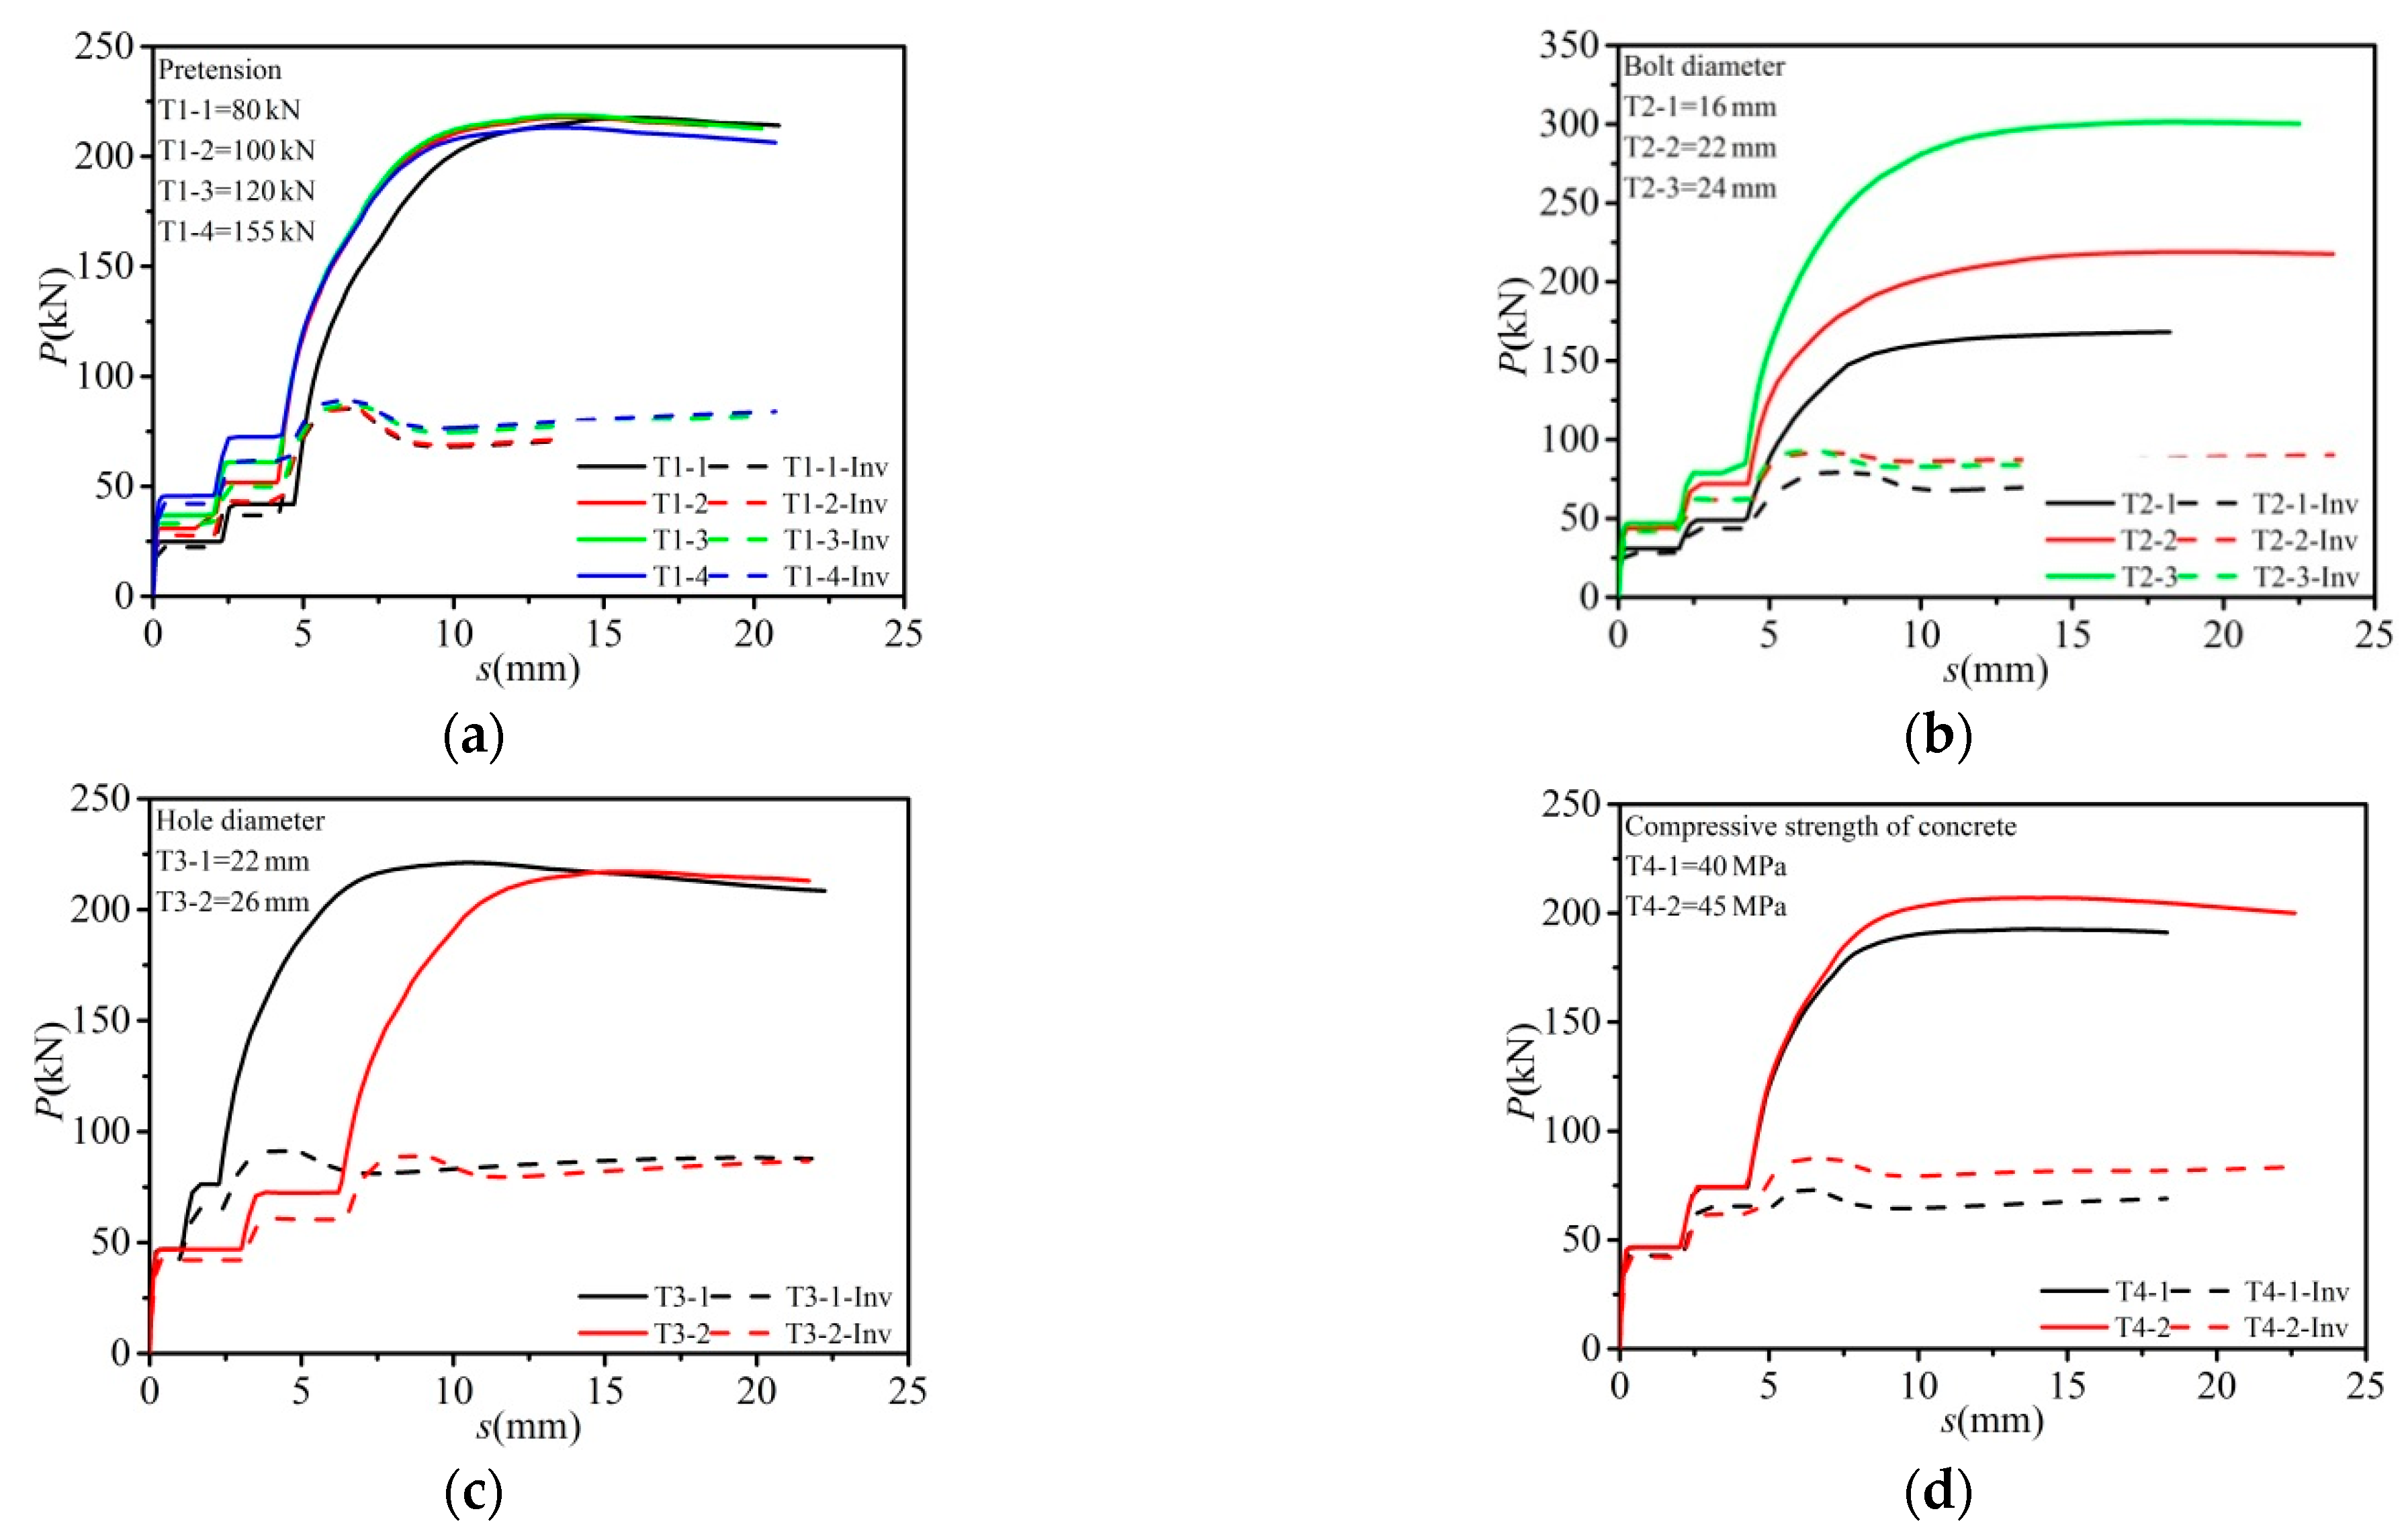
The load-slip calculated by inverse push-off FEMs and their comparison with the push-off FEMs are shown in Figure 9. It was found that the load versus slip relationship of the inverse push-off FEMs was similar to that of the push-off FEMs, which can also be divided into four periods. However, the shear bearing capacity of the inverse models was lower that of the inverse push-off FEMs. This is mainly because of the material property (low tensile strength) of concrete.
3.3. Parametric Study
To further investigate the structural behavior of the HSBSCs in SCCBs under inverse push-off loading, parametric studies were conducted by considering the influential variables (see Table 3). Pt denotes the prestressing force recommended in the GB 50017-2017 [32] design code for steel structures.
3.3.1. Effect of Concrete Strength
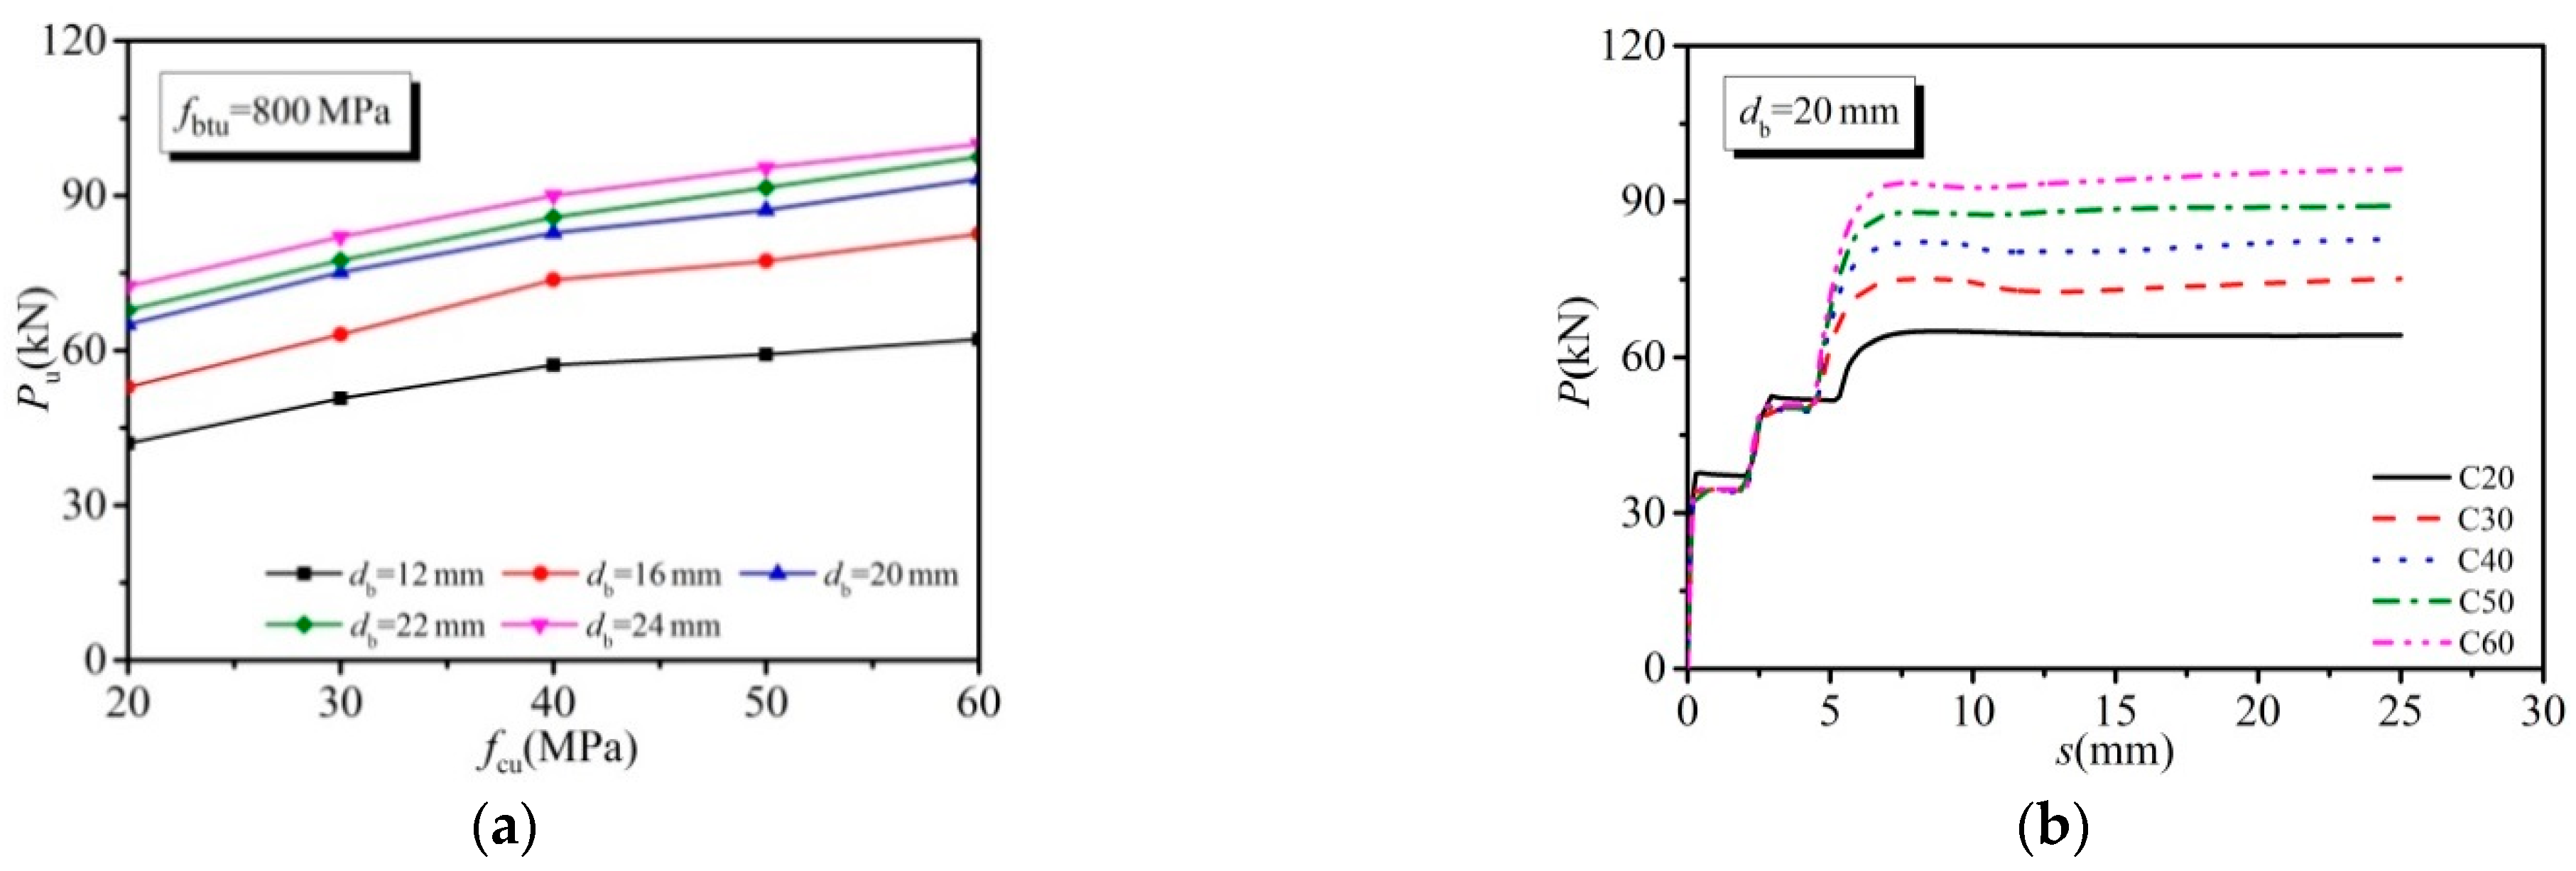
The tensile strength of the bolt was specified as 800 MPa. Figure 10 shows the effects of shear bearing capacity and load–slip response for a single bolted connector concerning the change in concrete strength (fcu), ranging from 20 to 60 MPa. The FE calculated results indicated that both the ultimate shear connection resistance and the load–slip relationship were influenced by concrete strength, and the peak load shearing capacity was increased with the increase in concrete strength. The ultimate load capacity was increased by 47.8%, 56.0%, 43.3%, 43.7% and 38.1% for bolt diameters of 12, 16, 20, 22 and 24 mm, respectively, and the concrete strength was increased from 20 to 60 MPa.
3.3.2. Effect of Bolt Diameter
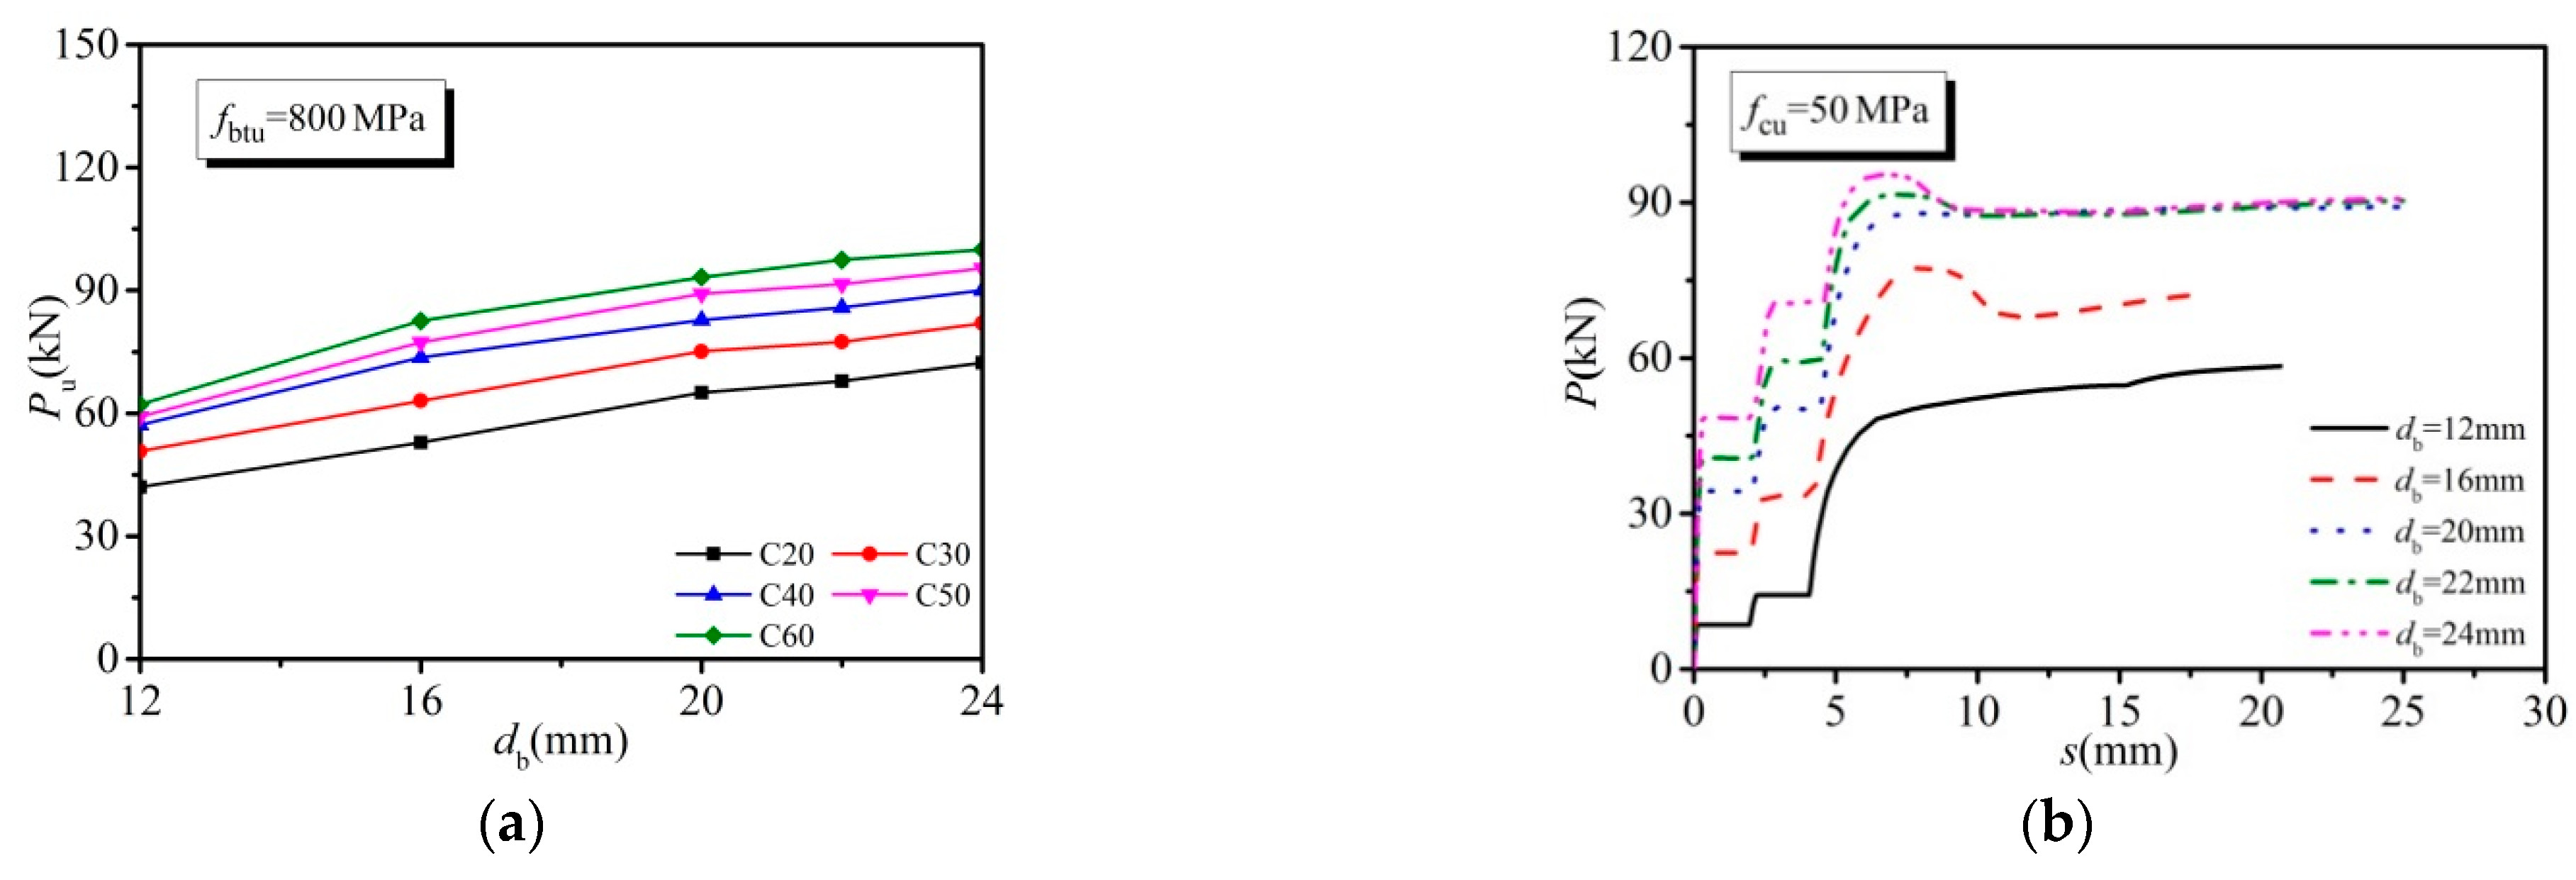
Five different bolt diameters, i.e., 12, 16, 20, 22 and 24 mm, were chosen to study the influence of this parameter on both the shear bearing capacity and the load–slip response with bolt tensile strength set as 800 MPa. The calculated results are listed in Figure 11. The peak load-carrying capacity was improved as the diameter was increased. For instance, at the concrete strength of 50 MPa, the ultimate shear capacity of a single bolted connector was increased by 61.2% when the bolt diameter was raised from 12 to 24 mm.
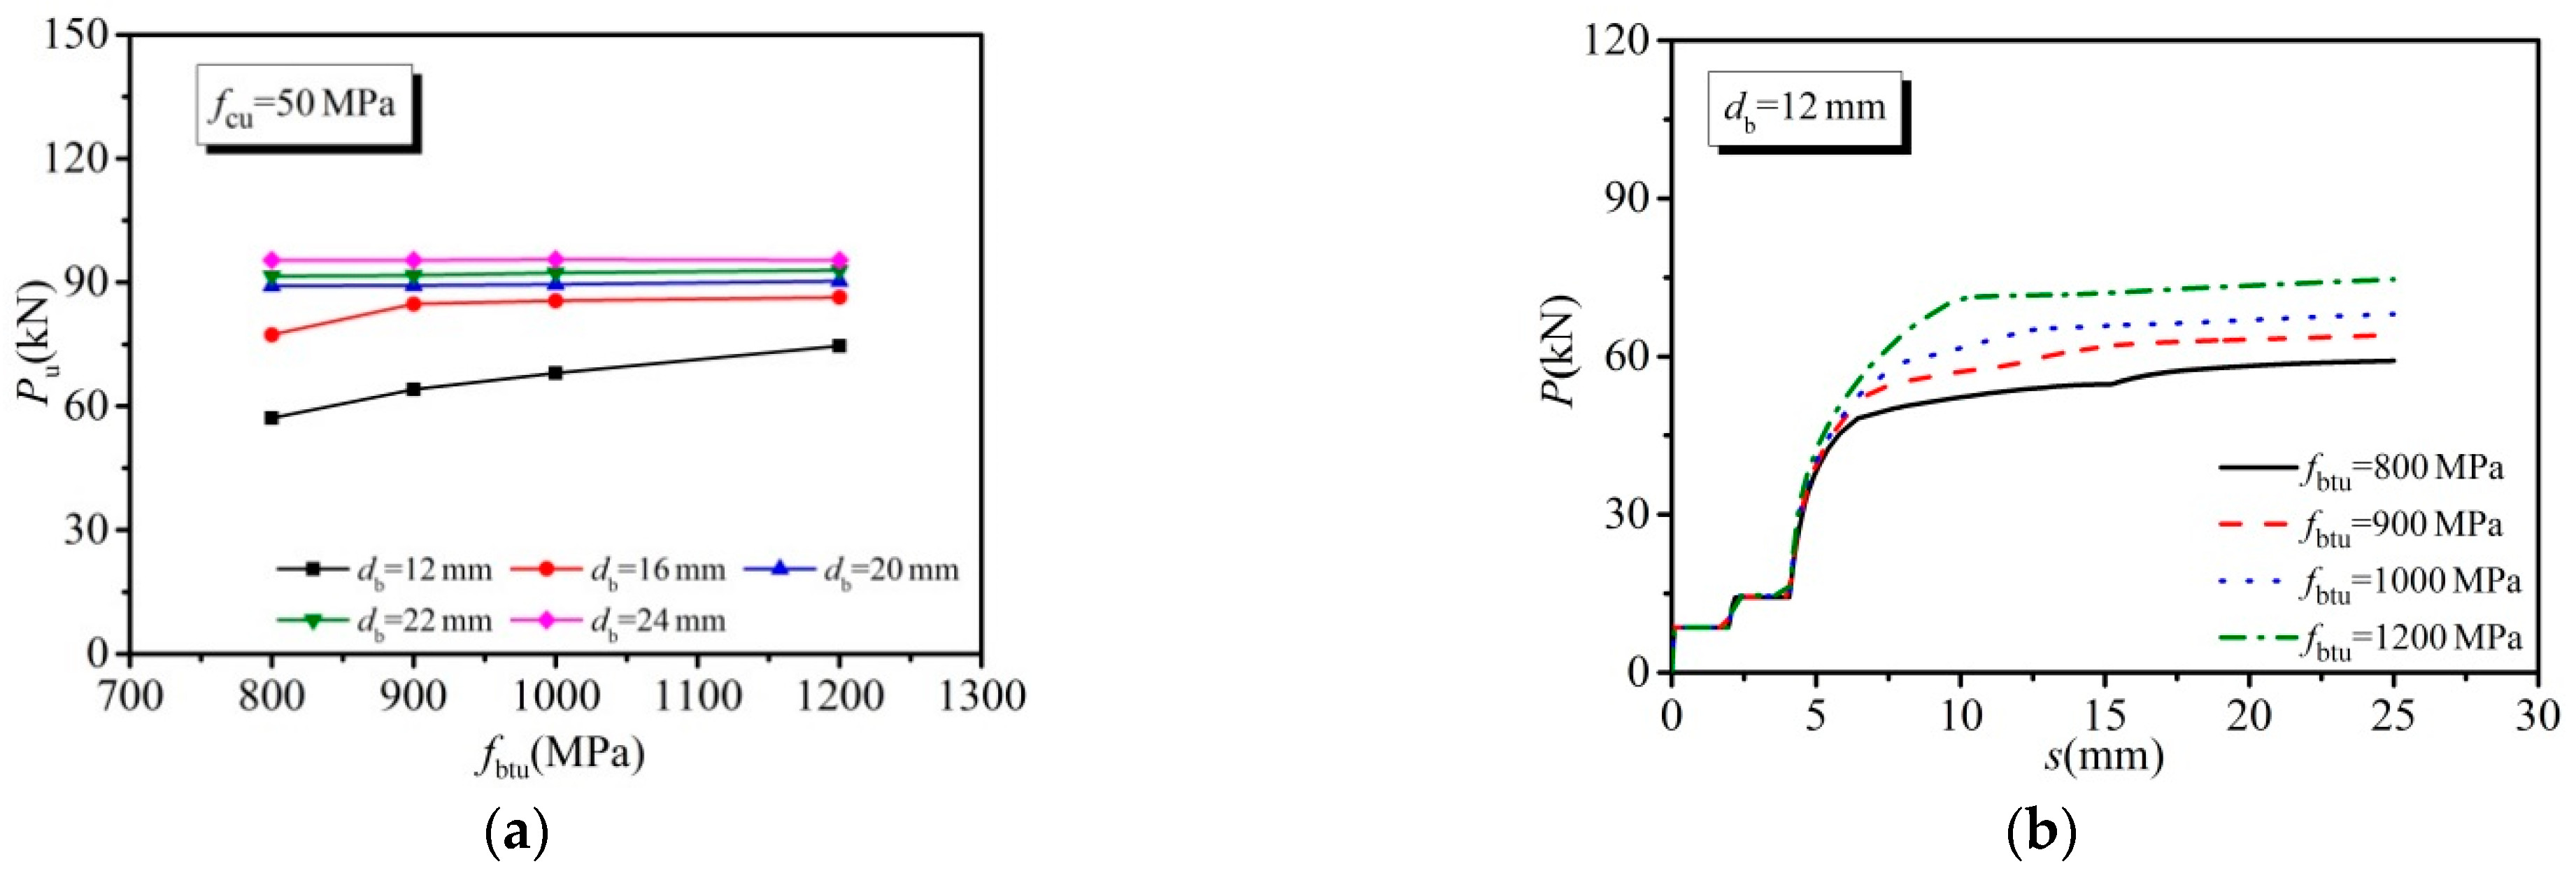
3.3.3. Effect of Bolt Tensile Strength
Four different tensile strengths of bolt (fu = 800, 900, 1000 and 1200 MPa) were taken into account in this part of the parametric study, with the concrete strength assumed as a constant. The influence of this parameter on the shear bearing capacity and the load–slip relationship of bolted connectors is displayed in Figure 12. When the diameter of the bolts was less than 20 mm, the shear bearing capacity of bolted connectors was enhanced and the bolt tensile strength increased. Bolt shear fracture dominated the failure mode at this moment. However, when the bolt diameter exceeded 20 mm, the increase in the shear bearing capacity for the bolted connectors was not evident with the increase in bolt tensile strength. The main reason for this phenomenon was that the failure mode of the inverse push-off FE modeling was mainly concrete failure, implying that the concrete strength controlled the failure mode at this time, and the tensile strength of the bolts was underutilized. Additionally, an enhancement of 26.1%, 11.7% and 1.3% was reported for the bolted shear connectors with diameters of 12, 16 and 20 mm, respectively, when the bolt tensile strength was increased from 800 to 1200 MPa.
3.3.4. Effect of Concrete Slab Hole Diameter
The concrete strength and bolt tensile strength were kept constant at 50 MPa and 800 MPa, respectively. Figure 13 illustrates the effect of concrete slab hole diameter on shear bearing capacity and the load–slip response of the bolted shear connectors. The clearances between the concrete slab hole and the bolt considered in this analysis were 2, 4 and 8 mm. As expected, the concrete slab hole diameter only slightly affected the value of the slip in the slipping stage (b–c stage, Figure 6a) and had no apparent influence on the peak load capacity of the bolted shear connectors.
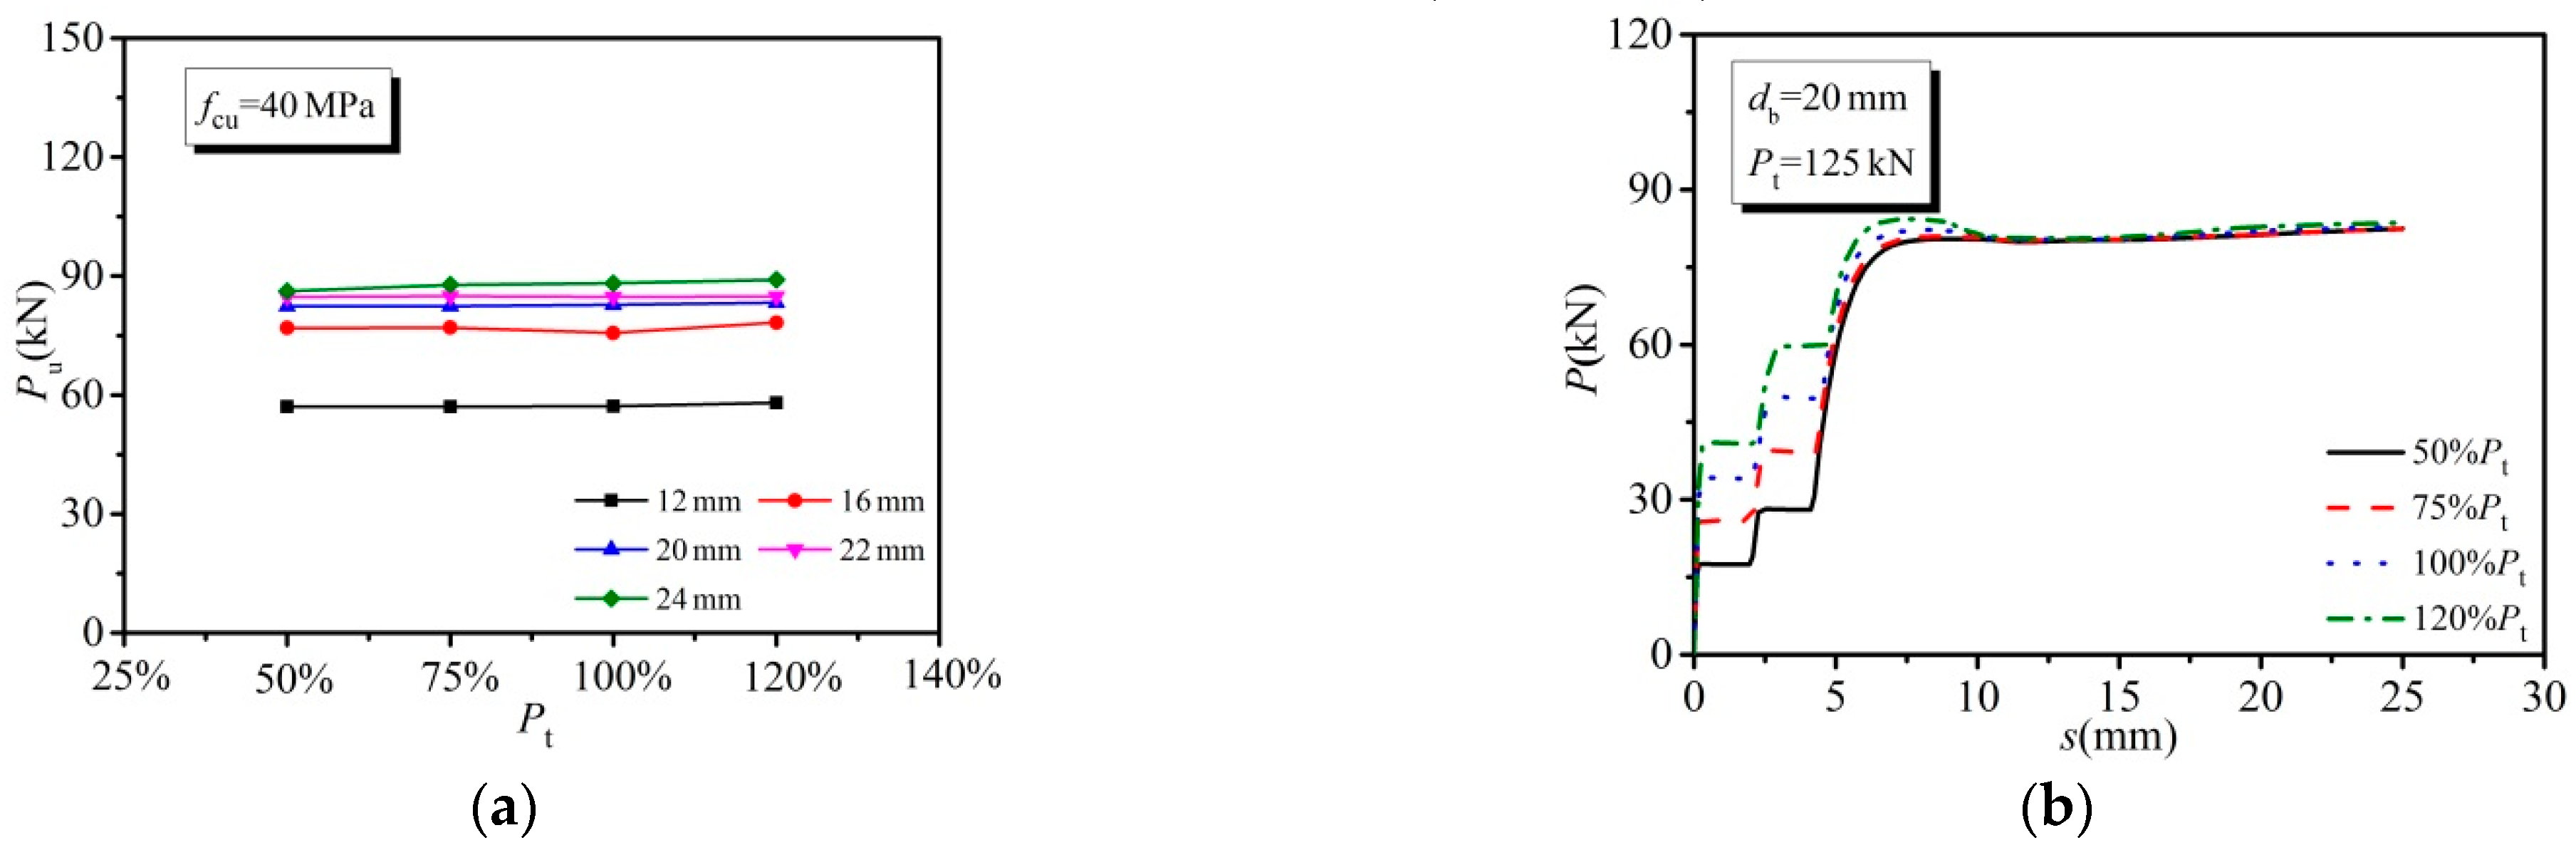
3.3.5. Effect of Bolt Pretension
The concrete strength and bolt tensile strength were specified as 40 MPa and 800 MPa, respectively. Figure 14 presents the influence of bolt pretension on the shear bearing capacity and load–slip relationship. Four different proportions of 50%, 75%, 100% and 120% Pt were selected in the study. It was observed that bolt pretension exhibited a slight effect on the ultimate shear capacity of the bolted shear connectors but directly increased the friction force that needed to be overcome at the interface between the steel beam and concrete slab in the friction transferring force stage.
4. Design Recommendations
Liu et al. [20] proposed a design formula for calculating the shear force (Q0) at the first significant slip, which is mainly determined by the friction coefficient (uf) between the concrete slab and the steel beam as well as the bolt pretension (Nt). The formula is expressed as:
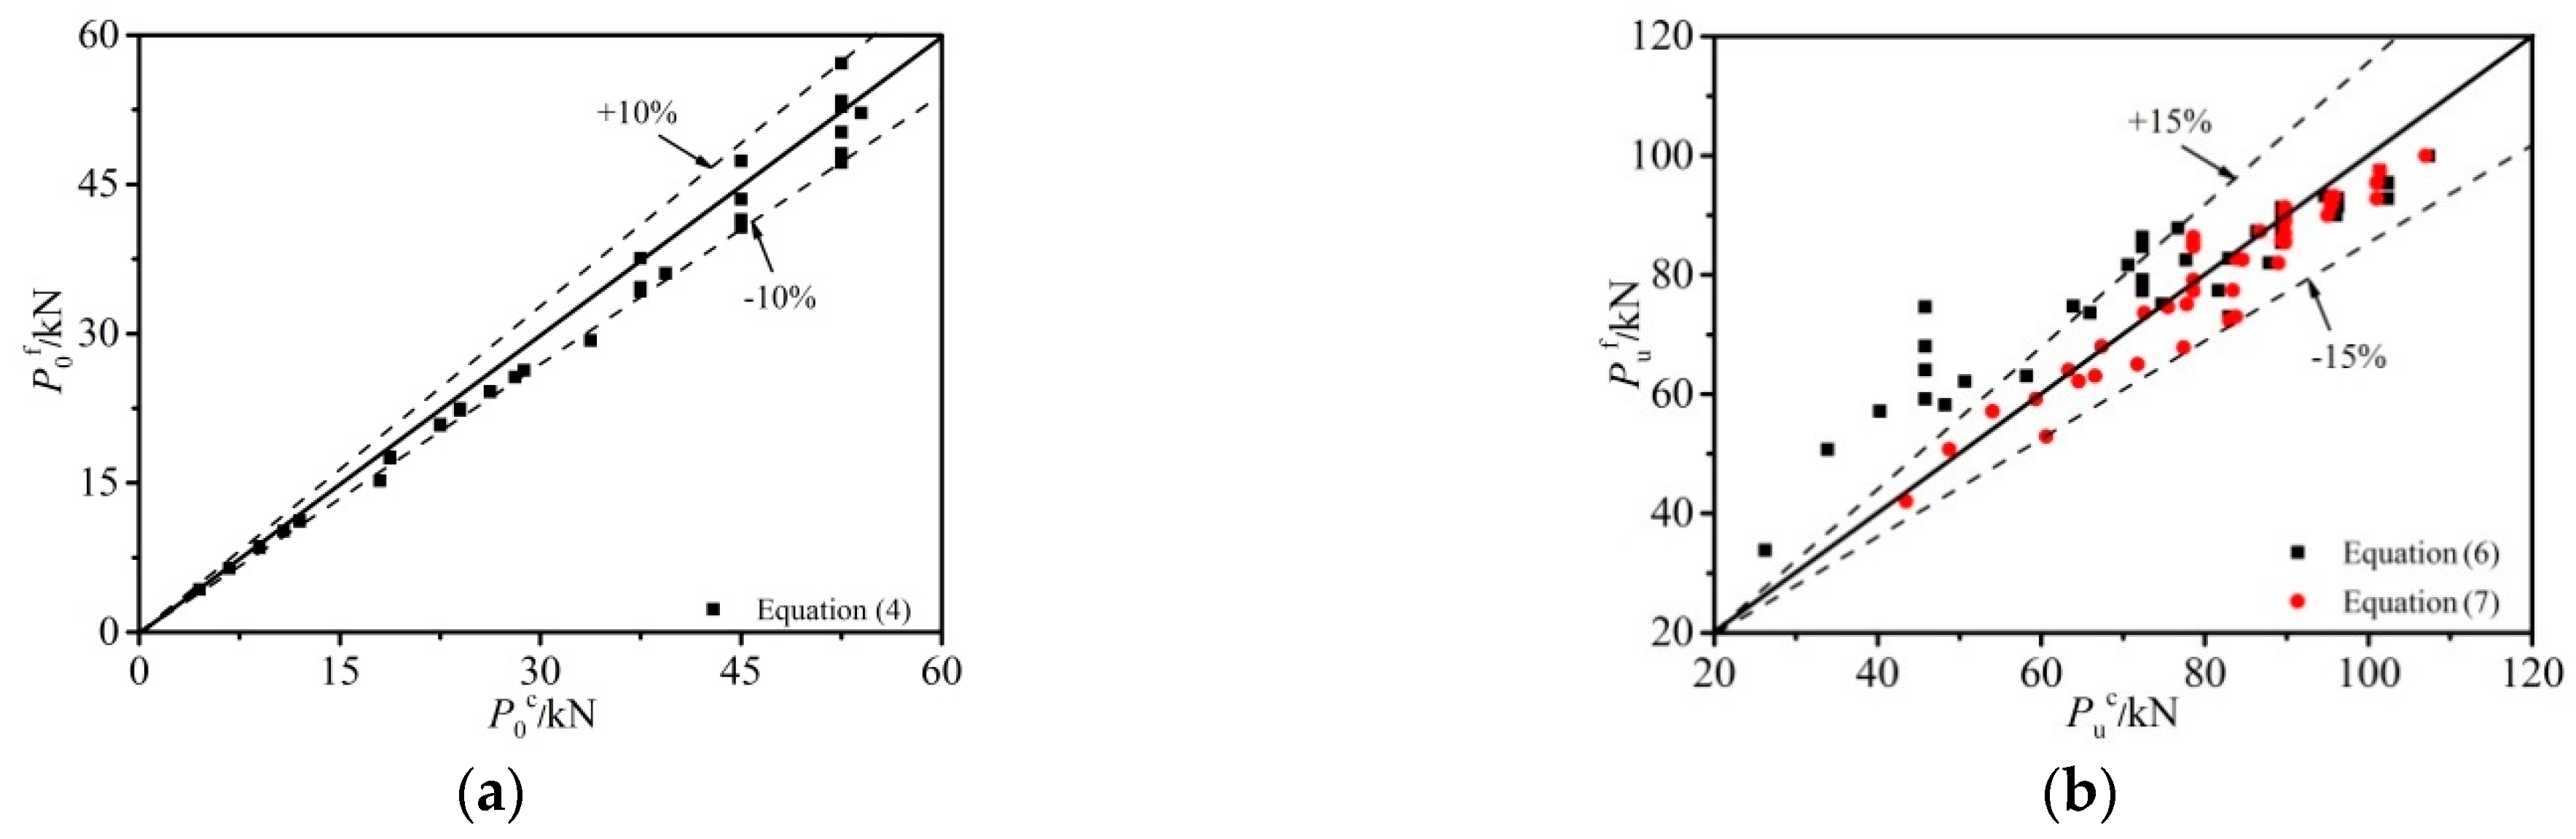
As expected, the shear load at the friction transferring force stage in the inverse push-off loading condition was also mainly related to the contact surface friction coefficient and the bolt pretension. Hence, Equation (4) can be used to predict the shear load at the first slip under inverse push-off loading. The comparison between the shear loads captured from the parametric studies and those calculated by Equation (4) is presented in Table 4 and Figure 15a. The mean value and the COV of P0f/P0(4) were 0.934 and 0.039, respectively, showing that Equation (4) gives a reasonable prediction of the shear load at the first slip.
Design recommendations for estimating the ultimate shear capacity of HSBSCs in SCCBs have been proposed by several researchers [11,17,19,20]. It should be noted that those suggested formulas were developed in forward push-off loading condition, but there have been few reports about relevant equations for predicting the shear load of HSBSCs in inverse push-off loading conditions. Ding et al. [26] developed design formulas to evaluate the ultimate shear capacity of each steel stud under static bi-direction push-off loading.
where Pu and PuL are the ultimate shear bearing capacities in forward push-off tests and inverse push-off tests, respectively; fcu, fs and d are the cubic compressive strength of concrete, the stud yield strength and the stud shank diameter, respectively.
According to the parametric studies, the shear bearing resistance of HSBSCs under inverse push-off loading is mainly influenced by the bolt diameter and the concrete strength. Moreover, if the concrete is strong enough, the failure is controlled by the bolt, and otherwise, by concrete. Based on the aforementioned parametric studies, a new equation for predicting the ultimate shear bearing resistance of HSBSCs subjected to inverse push-off loading was suggested. The proposed design formula can be calculated as:
where PubL is the ultimate shear bearing capacity of an HSBSC in inverse push-off loading condition; db is the diameter of bolt shank; α is a ratio; when db < 16 mm, α = 0.4 + 0.0006fbtu; when db ≥ 16 mm, α = 1.0; fbtu is the bolt tensile strength.
The shear capacities captured by the parametric studies were compared with the ultimate shear strength of bolted connectors estimated by Equation (6) and the proposed design rules in this study. The comparisons are shown in Table 4 and Figure 15b, where Puc is the shear resistance predicted by different equations. The mean values of Puf/Pu(6) and Puf/Pu(7) were 1.065 and 0.973 with the COV of 0.169 and 0.049, respectively. Therefore, the formula (Equation (7)) proposed in this paper for the prediction of the shear bearing capacity of each HSBSC in inverse push-off loading condition was feasible.
5. Conclusions
The static behavior of HSBSCs in SCCBs under inverse push-off loading was investigated by using FE modeling. A 3D FEM of the push-off tests was developed, and the accuracy of numerical analysis was validated against the available test results. Based on the verified model, the behavior of HSBSCs in an inverse push-off loading condition was then studied by using the same FE method conducted by Ding. A series of parametric studies were further carried out to study the influence of concrete strength, bolt diameter, bolt tensile strength, the clearance between a concrete slab hole and a bolt and bolt pretension on the shear resistance and load–slip relationship. Based on these investigations, the following conclusions were summarized:
- The 3D nonlinear numerical model was capable of accurately and reasonably predicting the fundamental behavior of the HSBSCs in push-off tests on the shear capacity and the load–slip response.
- The tendency of the load–slip curves of HSBSCs under inverse push-off loading was similar to that of push-off tests and could be divided into four stages. The shear bearing resistance of HSBSCs of the inverse models was lower that of those in the inverse push-off FEMs, and concrete failure was the main failure mode.
- The shear capacity of HSBSCs subjected to inverse push-off loading was primarily dependent upon the concrete strength and the bolt diameter, and when the bolt diameter was smaller than 20 mm, the bolt tensile strength exhibited some influence. The clearances between concrete slab holes and bolts as well as the bolt pretension had a slight effect on the shear capacity of the HSBSCs.
- Based on the comprehensive parametric studies, the shear load of HSBSCs at the friction-transferring force stage can be estimated by the formula proposed by Liu et al. A practical design formula for predicting the shear capacity of HSBSCs under inverse push-off loading was proposed, and the predicted results agreed reasonably well with the FE analysis.
Author Contributions
Conceptualization, W.W. and F.-x.D.; investigation, W.W. and X.-l.Z.; software, W.W.; writing—original draft, W.W.; writing—review and editing, X.-d.Z. and F.-x.D. All authors have read and agreed to the published version of the manuscript.
Funding
This research was financially supported by the National Natural Science Foundation of China (Grant No. 51578548) and the Science Fund for Distinguished Young Scholars in Hunan Province (Grant No. 2019JJ20029). The financial support is highly appreciated.
Institutional Review Board Statement
Not applicable.
Informed Consent Statement
Not applicable.
Data Availability Statement
The data presented in this study are available on request from the corresponding author. The data are not publicly available due to the data also forms part of an ongoing study.
Conflicts of Interest
The authors declare no conflict of interest.
Nomenclature
| D | Concrete slab hole diameter | Es | Elastic modules of steel |
| db | High-strength bolt diameter | Ebs | Elastic modules of high-strength bolt |
| Pb | Bolt pretension | P0 | Shear load at the first slip |
| fcu | Compressive cube strength of concrete | P0f | Shear load at the first slip of FE result |
| fc | Compressive strength of concrete | Pu | Ultimate load |
| fc’ | Compressive cylinder strength of concrete | Puf | Ultimate load of FE result |
| fy | Yield strength of steel | PuL | Ultimate load in inverse push-off test |
| fu | Ultimate strength of steel | Puc | Ultimate shear strength of calculate result |
| fbtu | Ultimate strength of high-strength bolt | Pu(6) | Ultimate shear strength of the bolt according to Equation (6) |
References
- Ollgaard, J.; Slutter, R.; Fisher, J. Shear strength of stud connectors in lightweight and normal-weight concrete. AISC Eng. J. 1971, 8, 55–64. [Google Scholar]
- Shim, C.; Lee, P.; Yoon, T. Static behavior of large stud shear connectors. Eng. Struct. 2004, 26, 1853–1860. [Google Scholar] [CrossRef]
- Lam, D.; Ellobody, E. Behavior of headed stud shear connectors in composite beam. J. Struct. Eng. 2005, 1, 96–107. [Google Scholar] [CrossRef]
- Lam, D. Capacities of headed stud shear connectors in composite steel beams with precast hollowcore slabs. J. Constr. Steel Res. 2007, 63, 1160–1174. [Google Scholar] [CrossRef]
- Nguyen, H.; Kim, S. Finite element modelling of push-out tests for large stud shear connectors. J. Constr. Steel Res. 2009, 65, 1909–1920. [Google Scholar] [CrossRef]
- Manik, M.; Bhowmick, A. A finite element based approach for fatigue life prediction of headed shear studs. Structures 2019, 19, 161–172. [Google Scholar]
- Vigneri, V.; Odenbreit, C.; Braun, M. Numerical evaluation of the plastic hinges developed in headed stud shear connectors in composite beams with profiled steel sheeting. Structures 2019, 21, 103–110. [Google Scholar] [CrossRef] [Green Version]
- Dallam, L. High strength bolt shear connectors-push out tests. J. Proc. 1968, 65, 767–769. [Google Scholar]
- Marshall, W.; Nelson, H.; Banerjee, H. An experimental study of the use of high-strength friction-grip bolts as shear connectors in composite beams. Struct. Eng. 1971, 49, 171–178. [Google Scholar]
- Dedic, D.; Klaiber, W. High-strength bolts as shear connectors in rehabilitation work. Concr. Int. 1984, 6, 41–46. [Google Scholar]
- Kwon, G.; Engelhardt, M.; Klingner, R. Behavior of post-installed shear connectors under static and fatigue loading. J. Constr. Steel Res. 2010, 66, 532–541. [Google Scholar]
- Kwon, G.; Engelhardt, M.; Klingner, R. Experimental behavior of bridge beams retrofitted with postinstalled shear connectors. J. Bridge Eng. 2011, 16, 536–545. [Google Scholar]
- Dai, X.; Lam, D.; Saveri, E. Effect of concrete strength and stud collar size to shear capacity of demountable shear connectors. J. Struct. Eng. 2015, 141, 04015025–1-10. [Google Scholar]
- Rehman, N.; Lam, D.; Dai, X.; Ashour, A. Experimental study on demountable shear connectors in composite slabs with profiled decking. J. Struct. Eng. 2016, 122, 178–189. [Google Scholar]
- Yang, F.; Liu, Y.; Jiang, Z.; Xin, H. Shear performance of a novel demountable steel-concrete bolted connector under static push-out tests. Eng. Struct. 2018, 160, 133–146. [Google Scholar]
- Moynihan, M.; Allwood, J. Viability and performance of demountable composite connectors. J. Constr. Steel Res. 2014, 99, 47–56. [Google Scholar]
- Chen, J.; Wang, W.; Ding, F.; Xiang, P.; Yu, Y.; Liu, X.; Xu, F.; Yang, C.; Long, S. Behavior of an advanced bolted shear connector in prefabricated steel-concrete composite beams. Materials 2019, 12, 2958. [Google Scholar]
- Pavlović, M.; Marković, Z.; Veljković, M.; Budevac, D. Bolted shear connectors vs. headed studs behaviour in push-out tests. J. Struct. Eng. 2013, 88, 134–149. [Google Scholar]
- Zhang, Y.; Chen, B.; Liu, A.; Pi, Y.; Zhang, J.; Wang, Y.; Zhong, L. Experimental study on shear behavior of high strength bolt connection in prefabricated steel-concrete composite beam. Compos. Part B 2019, 159, 481–489. [Google Scholar]
- Liu, X.; Bradford, M.; Michael, S. Behavior of high-strength friction-grip bolted shear connectors in sustainable composite beams. J. Struct. Eng. 2015, 141, 1–12. [Google Scholar]
- Liu, X.; Bradford, M.; Chen, Q.; Ban, H. Finite element modelling of steel-concrete composite beams with high-strength friction-grip bolt shear connectors. Finite Elem. Anal. Des. 2016, 108, 54–65. [Google Scholar] [CrossRef]
- Liu, X.; Bradford, M.; Ataei, A. Flexural performance of innovative sustainable composite steel-concrete beams. Eng. Struct. 2017, 130, 282–296. [Google Scholar] [CrossRef]
- Ataei, A.; Bradford, M.; Liu, X. Experimental study of composite beams having a precast geopolymer concrete slab and deconstructable bolted shear connectors. Eng. Struct. 2016, 114, 1–13. [Google Scholar] [CrossRef]
- Ataei, A.; Zeynalian, M.; Yazdi, Y. Cyclic behaviour of bolted shear connectors in steel-concrete composite beams. Eng. Struct. 2019, 198, 109455. [Google Scholar] [CrossRef]
- Tan, E.; Varsani, H.; Liao, F. Experimental study on demountable steel-concrete connectors subjected to combined shear and tension. Eng. Struct. 2019, 183, 110–123. [Google Scholar] [CrossRef]
- Ding, F.; Yin, G.; Wang, H.; Wang, L.; Guo, Q. Static behavior of stud connectors in bi-direction push-off tests. Thin-Walled Struct. 2017, 120, 307–318. [Google Scholar] [CrossRef]
- Yin, G.; Ding, F.; Wang, H.; Wang, L.; Guo, Q. Behavior of headed shear stud connectors subjected to cyclic loading. Steel Compos. Struct. 2017, 25, 705–716. [Google Scholar]
- Abaqus. Computer Software, Version 6.14; SIMULIA: Providence, RI, USA, 2014.
- Ding, F.; Ying, X.; Zhou, L.; Yu, Z. Unified calculation method and its application in determining the uniaxial mechanical properties of concrete. Front. Archit. Civ. Eng. China 2011, 5, 381–393. [Google Scholar] [CrossRef]
- Ding, F.; Yu, Z. Strength criterion for plain concrete under multiaxial stress based on damage Poisson’s ratio. Acta Mech. Solida Sin. 2006, 19, 307–316. [Google Scholar] [CrossRef]
- Loh, H.; Uy, B.; Bradford, M. The effects of partial shear connection in composite flush end plate joints Part II-Analytical study and design appraisal. J. Constr. Steel Res. 2006, 62, 391–412. [Google Scholar] [CrossRef]
- GB 50017-2017. Standard for Design of Steel Structures; China Architecture and Building Press: Beijing, China, 2017. [Google Scholar]
Figure 1.
Different types of bolted shear connectors: (a) type 1; (b) type 2; (c) type 3; (d) type 4; (e) type 5; (f) type 6; (g) type 7; (h) type 8.
Figure 1.
Different types of bolted shear connectors: (a) type 1; (b) type 2; (c) type 3; (d) type 4; (e) type 5; (f) type 6; (g) type 7; (h) type 8.
Figure 2.
Push-off test.

Figure 3.
Details of push-off test specimens (Reprint with permission [19]; Copyright Year 2021, Publisher: Elsevier): (a) experimental specimens; (b) plan view; (c) front view; (d) side view.
Figure 3.
Details of push-off test specimens (Reprint with permission [19]; Copyright Year 2021, Publisher: Elsevier): (a) experimental specimens; (b) plan view; (c) front view; (d) side view.
Figure 4.
Mesh generation of the finite element model (FEM): (a) concrete plate; (b) steel beam; (c) bolted connector; (d) steel cage; (e) model.
Figure 4.
Mesh generation of the finite element model (FEM): (a) concrete plate; (b) steel beam; (c) bolted connector; (d) steel cage; (e) model.
Figure 5.
Load diagram of model: (a) push-off model; (b) inverse push-off model.
Figure 6.
Comparison of load–slip curves between tests (Reprint with permission [19]; Copyright Year 2021, Publisher: Elsevier) and FE results: (a) T1-1; (b) T1-2; (c) T1-3; (d) T1-4; (e) T2-1; (f) T2-2; (g) T2-3; (h) T3-1; (i) T3-2; (j) T4-1; (k) T4-2.
Figure 6.
Comparison of load–slip curves between tests (Reprint with permission [19]; Copyright Year 2021, Publisher: Elsevier) and FE results: (a) T1-1; (b) T1-2; (c) T1-3; (d) T1-4; (e) T2-1; (f) T2-2; (g) T2-3; (h) T3-1; (i) T3-2; (j) T4-1; (k) T4-2.

Figure 7.
Comparison of typical failure modes between tests (Reprint with permission [19]; Copyright Year 2021, Publisher: Elsevier) [19] and FE results: (a) bolt shear failure; (b) concrete failure.
Figure 8.
Failure model of the T2-1 specimen under inverse push-off loading: (a) concrete; (b) bolt.
Figure 8.
Failure model of the T2-1 specimen under inverse push-off loading: (a) concrete; (b) bolt.
Figure 9.
Comparison of load–slip curves between push-off and inverse push-off models: (a) T1 group; (b) T2 group; (c) T3 group; (d) T4 group.
Figure 9.
Comparison of load–slip curves between push-off and inverse push-off models: (a) T1 group; (b) T2 group; (c) T3 group; (d) T4 group.
Figure 10.
Effect of concrete strength: (a) shear bearing capacity; (b) load–slip relationship.
Figure 11.
Effect of bolt diameter: (a) shear bearing capacity; (b) load–slip relationship.

Figure 12.
Effect of bolt tensile strength: (a) shear bearing capacity; (b) load–slip relationship.
Figure 13.
Effect of clearance between the slab hole and the bolt: (a) shear bearing capacity; (b) load-slip relationship.
Figure 13.
Effect of clearance between the slab hole and the bolt: (a) shear bearing capacity; (b) load-slip relationship.
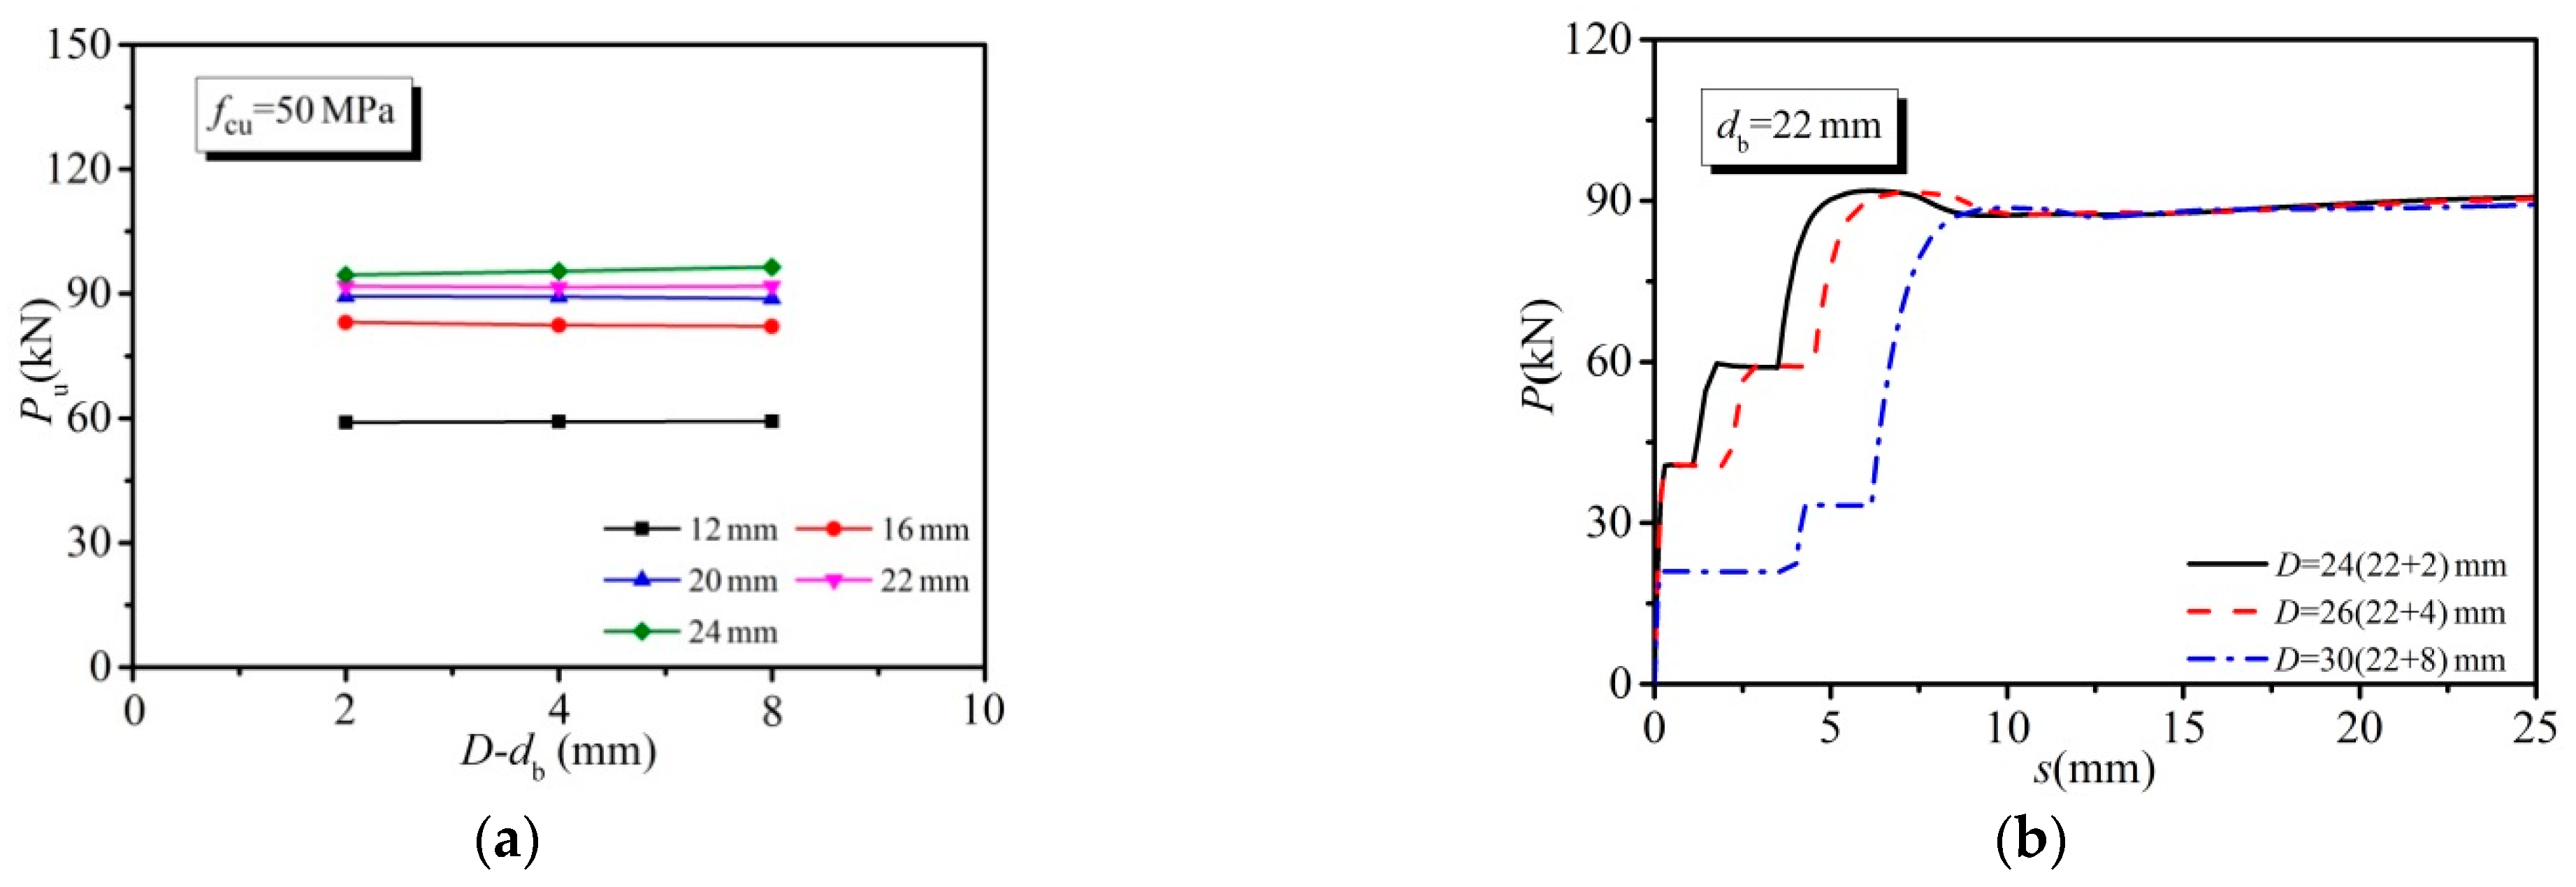
Figure 14.
Effect of bolt pretension: (a) shear bearing capacity; (b) load–slip relationship.
Figure 15.
Comparison between predicted and FE results: (a) shear load at the first slip; (b) ultimate shear capacity.
Figure 15.
Comparison between predicted and FE results: (a) shear load at the first slip; (b) ultimate shear capacity.

Table 1.
Plastic parameters of the concrete damaged plasticity (CDP) model.
| Dilation Angle (ψ) | Flow Potential Eccentricity (e) | Biaxial/Uniaxial Compressive Strength Ratio (fb0/fc0) | Ratio (K) |
|---|---|---|---|
| 40° | 0.1 | 1.225 | 2/3 |
Table 2.
Comparison of the ultimate shear capacity obtained from test [19] and finite element (FE) results (per bolt).
Table 2.
Comparison of the ultimate shear capacity obtained from test [19] and finite element (FE) results (per bolt).
| Specimen | Pretension (kN) | Hole Diameter (mm) | Bolt Diameter (mm) | Concrete Strength (MPa) | P0 (kN) | Pu (kN) | P0f (kN) | Puf (kN) | P0/P0f | P/Puf |
|---|---|---|---|---|---|---|---|---|---|---|
| T1-1 | 80 | 24 | 20 | 50 | 22.5 | 207.0 | 24.7 | 217.5 | 0.911 | 0.95 |
| T1-2 | 100 | 24 | 20 | 50 | 30.0 | 207.5 | 30.5 | 217.8 | 0.984 | 0.95 |
| T1-3 | 120 | 24 | 20 | 50 | 37.5 | 207.5 | 36.2 | 218.6 | 1.036 | 0.95 |
| T1-4 | 155 | 24 | 20 | 50 | 53.5 | 212.5 | 45.4 | 213.2 | 1.178 | 1.00 |
| T2-1 | 155 | 20 | 16 | 50 | 23.5 | 156.3 | 30.6 | 168.2 | 0.768 | 0.93 |
| T2-2 | 155 | 26 | 22 | 50 | 53.0 | 231.3 | 43.5 | 218.9 | 1.218 | 1.06 |
| T2-3 | 155 | 28 | 24 | 50 | 54.5 | 266.8 | 44.1 | 301.4 | 1.236 | 0.89 |
| T3-1 | 155 | 22 | 20 | 50 | 53.0 | 209.2 | 47.1 | 221.1 | 1.125 | 0.95 |
| T3-2 | 155 | 26 | 20 | 50 | 32.5 | 172.5 | 46.6 | 217.1 | 0.697 | 0.79 |
| T4-1 | 155 | 24 | 20 | 40 | 37.5 | 169.8 | 46.4 | 192.7 | 0.808 | 0.88 |
| T4-2 | 155 | 24 | 20 | 45 | 35.5 | 172.8 | 46.6 | 207.0 | 0.762 | 0.83 |
| Mean | 0.975 | 0.925 | ||||||||
| Coefficient of variation | 0.194 | 0.082 | ||||||||
Table 3.
Variables selected for parametric studies.
| Variable | Range of Variable |
|---|---|
| Concrete strength | fcu = 20, 30, 40, 50, 60 MPa |
| Bolt diameter | db = 12, 16, 20, 22, 24 mm |
| Bolt tensile strength | fbtu = 800, 900, 1000, 1200 MPa |
| Clearance between the concrete slab hole and the bolt | (D–db) = 2, 4, 8 mm |
| Bolt pretension | Pb = 0.2Pt, 0.5Pt, 1.0Pt, 1.2Pt |
Table 4.
Comparison of the shear load and ultimate shear capacities captured by the FE analysis with design recommendations.
Table 4.
Comparison of the shear load and ultimate shear capacities captured by the FE analysis with design recommendations.
| P0f/Pu(4) | Puf/Pu(6) | Puf/Pu(7) | |
|---|---|---|---|
| Mean (µ) | 0.934 | 1.065 | 0.973 |
| Coefficient of variation (η) | 0.039 | 0.169 | 0.049 |
Publisher’s Note: MDPI stays neutral with regard to jurisdictional claims in published maps and institutional affiliations. |
© 2021 by the authors. Licensee MDPI, Basel, Switzerland. This article is an open access article distributed under the terms and conditions of the Creative Commons Attribution (CC BY) license (http://creativecommons.org/licenses/by/4.0/).
Share and Cite
MDPI and ACS Style
Wang, W.; Zhang, X.-d.; Ding, F.-x.; Zhou, X.-l. Finite Element Analysis on Shear Behavior of High-Strength Bolted Connectors under Inverse Push-Off Loading. Energies 2021, 14, 479. https://doi.org/10.3390/en14020479
AMA Style
Wang W, Zhang X-d, Ding F-x, Zhou X-l. Finite Element Analysis on Shear Behavior of High-Strength Bolted Connectors under Inverse Push-Off Loading. Energies. 2021; 14(2):479. https://doi.org/10.3390/en14020479
Chicago/Turabian StyleWang, Wei, Xie-dong Zhang, Fa-xing Ding, and Xi-long Zhou. 2021. "Finite Element Analysis on Shear Behavior of High-Strength Bolted Connectors under Inverse Push-Off Loading" Energies 14, no. 2: 479. https://doi.org/10.3390/en14020479
Note that from the first issue of 2016, this journal uses article numbers instead of page numbers. See further details here.