Design Parameters of a Double-Slope Solar Still: Modelling, Sensitivity Analysis, and Optimization


1
Department of Renewable Energies and Environment, Faculty of New Sciences and Technologies, University of Tehran, Tehran 1439957131, Iran
2
Mechanical & Automotive Engineering, School of Engineering, RMIT University, Bundoora, VIC 3083, Australia
*
Author to whom correspondence should be addressed.
Energies 2021, 14(2), 480; https://doi.org/10.3390/en14020480
Submission received: 23 November 2020
/
Revised: 3 January 2021
/
Accepted: 13 January 2021
/
Published: 18 January 2021
(This article belongs to the Section B: Energy and Environment)
Abstract
:This study presents a novel, highly detailed, and accurate modelling method for calculation of the total annual solar thermal energy received by a double-slope solar still. The model is further utilized for sensitivity analysis and optimization with the help of Genetic Algorithm and TOPSIS methods. The model reveals that the main parameters that can independently affect solar energy input are the basin length, width, tilt angle, surface azimuth angle, and the glass covers’ inclination angle. The sensitivity of the annual solar energy input to all these parameters is analyzed. Moreover, all the parameters are chosen to be involved in the optimization problem. Sensitivity analysis results show that except for basin azimuth angle all other parameters significantly affect the amount of energy input to the solar still. Genetic Algorithm identified 60 optimum sets of parameters, one of which was selected by the TOPSIS method. The optimum values for the basin width, length, tilt and azimuth angles, and the inclination angles of the two glass covers are 2 m, 2 m, 8°, 180°, 80° and 67°, respectively. This design of a double-slope solar still will receive an annual total of 97.67 GJ solar energy input.
1. Introduction
With the growing global need for freshwater, water desalination technologies are receiving a significant attention [1,2]. Current commercial technologies are extremely energy intensive [3] and in the meantime, the need for energy, as a crucial factor for the development of countries [4], is rapidly increasing throughout the world [5,6]. As a sustainable solution for this enormous and increasing demand, the need for employing renewables in a wide variety of applications is more pronounced than before [7,8]. Among renewable energy systems, because of the worldwide availability of the solar radiation, solar energy technologies have been highly developed and are available in many types and applications [9,10]. Solar desalination is a promising technology towards sustainable production of freshwater and is currently available in a variety of types and designs [11,12]. Among them solar stills have received considerable attention from scientists and lots of studies have been conducted on this technology since it was introduced [13,14].
Although there have been many advances in the design and performance of solar stills, they need further improvements to compete with the current commercial technologies [15]. To improve the performance of solar stills, previous studies have mostly suggested the addition of different boosting components such as mirrors [16], phase change materials [17,18], nanofluids [19,20], both phase change materials (PCM) and nanofluid [21], and a variety of active and passive accompanying systems [22,23]. As another solution, developing accurate modelling methods can be very helpful in designing a high-performance solar still in the first place. For double-slope solar stills specifically, most of the presented modelling methods in the literature have focused on their specific solar still design either with or without boosting components [24,25,26]. That said, in most of the presented models, the input solar energy to the system is calculated by multiplying the solar irradiance data to the cover glass surface area [24,26,27]. Hence, the effects of solar still geometry on the amount of solar energy input has not received enough attention. As solar energy is the energy source of solar stills, increasing the energy input can significantly improve the overall performance. Among the studies on the modelling and optimization of double-slope solar stills, only the research by El-Maghlany [28] has focused on the effects of solar still geometry on its solar energy input.
On the optimization of solar stills, there are not many works presented in the literature, though popular optimization function has been the maximum freshwater output of the solar still. For a single-slope solar still integrated with a photo-voltaic thermal (PV/T) collector, and with a theoretical approach, Guar and Tiwari [29] looked for the optimum number of required PV/T collectors. Rashidi et al. [30] have theoretically found the optimum length and height of the steps for a stepped single-slope solar still. For a single-slope solar still, Ahmed et al. [31] theoretically used fuzzy logic to find the optimum water input temperature, water and gas pressure, and glass temperature. Peter and Kanyarusoke [32] have suggested installation of a sun tracking system on a single-slope solar still as an optimization method. Altarawneh et al. [33] have modelled three different types of single-slope, double-slope, and pyramidal solar stills. They considered the same slope angle for all the inclined glass covers in each type and found the optimum values for a location in Jordan. Another optimization approach in the literature has been the maximization of the total solar energy input to the solar still. In this regard, Rehman [34] looked for the optimum values of the glass cover slope and the ratio of basin area to the cover angle for a single-slope solar still equipped with a sun tracking system. With the same goal, El-Maghlany [28] theoretically optimized the geometry of a double-slope solar still for different latitudes of Egypt. The optimization parameters were the inclination angles of both glasses’ covers, and the objective function was the maximization of the solar energy entrance to the still. The optimum design was presented for three different still surface azimuth angles of 0°, 45°, and 90°.
All the above-mentioned studies had one objective in their optimization problem. There have been very limited studies on solar still optimization with multiple objective functions. Khanmohammadi and Khanmohammadi [35] and Malik et al. [36] have theoretically investigated the same stepped single-slope solar still enhanced with phase change materials (PCMs). Khanmohammadi and Khanmohammadi [35] considered PCM mass, brine water flow rate, the distance between the absorber plate and the cover, and the insulation thickness as the optimization parameters. Their three objective functions were total annual costs, exergy efficiency, and exergy-based CO2 mitigation. By studying the same optimization parameters, Malik et al. [36] considered only the two objective functions of total annual costs and exergy efficiency.
For a clearer identification of the novelty of the present study, Table 1 provides a summary comparing the modelling method presented here with those published in the literature.
As can be seen in Table 1, the present study is unique in proposing a novel modelling method for total solar energy input of a double-slope solar still based on all the geometrical parameters that can individually affect the device structure and consequently the overall solar energy input to the solar still. To the best of the authors’ knowledge, the only study similar to what is presented in this paper is the one by El-Maghlany [28]. However, the model derived [28] for a double slope solar still was based on the inclination angles of the two glasses covers.
This article has identified six main geometric parameters that determine the whole structure geometry of double-slope solar stills and their overall solar energy input. These parameters are the length and width of the solar still, the tilt angle and surface azimuth angle of the solar still, and the glass covers’ inclination angle. Furthermore, a highly detailed modelling method based on the six main geometrical parameters to calculate solar energy input to a double-slope solar still is presented for the first time. Based on the novel modelling method, a sensitivity analysis and a multi-objective optimization method are also presented for the first time. Except for eliminating physically impossible conditions such as negative lengths, there are no restrictions defined for any of these parameters. A year-around period has been considered as the operation duration. The main contribution of this work is the novel modelling method, which makes geometrical optimization possible. Just with the irradiance data and location coordinates, the presented modelling and optimization method can be employed for any desired location to predict the solar energy input for any arbitrary geometrical design. To the best of the authors’ knowledge there are no other studies reported in the literature presenting such inclusive modelling and consequently optimization methods for solar stills of the double-slope type.
2. Mathematical Modelling of a Double-Slope Solar Still
2.1. Overview of the Model and Assumptions
The modelling method presented in this paper is based on the amount of incident solar energy to a double-slope solar still. Hence, in this section first the formulation for calculating the amount of solar input is presented. Then the required definitions are explained and, furthermore, the model is discussed. In the next step, according to the developed model, all the geometrical parameters that independently affect the amount of solar energy input are identified, and finally the optimization approach is discussed. The genetic algorithm method coupled with TOPSIS (Technique of Order Preference Similarity to the Ideal Solution) has been chosen for the optimization problem, and all modelling and optimization calculations are conducted in MATLAB. In the presented model, solar irradiance on the surfaces is calculated by the already validated relations widely employed in the literature for the same purpose. The main goal here is to develop a model that can calculate the amount of solar radiation incident on a double-slope solar still with any arbitrary design, just by identifying its main design parameters. Furthermore, this model is used to find the designs with the greatest amount of solar energy input.
Two assumptions have been made whilst developing the modelling method presented in this article. First, the internal reflections inside the solar still are not considered in the model. Inclusion of internal reflections would create a large number of possible conditions and determining all these cases can be very complicated. Not only the main parameters studied in this paper, but also additional parameters such as the basin height, the materials, and the water depth inside the basin can considerably affect the reflection status. Consideration of the mentioned parameters and especially water depth, which can be variable during the operation time, requires development of its own modelling method. Nevertheless, the reflections can be minor in practice as solar stills are normally equipped with absorber plates or absorber-coated surfaces [38,39] that maximize absorption of solar energy and minimize reflections. Based on the above explanations, it has been decided to neglect the reflections in calculating the amount of solar energy input to the solar still.
The second assumption is a set of value limitations considered for the optimization problem. All these limitations are defined to avoid practically unacceptable results such as negative lengths or very small dimensions. The details of these limitations are given in Section 3.
2.2. The General Model for the Input Energy to a Double-Slope Solar Still
As shown in Figure 1 a typical double-slope solar still has four glass covers from which the solar thermal energy enters the device.
The total amount of solar radiation (thermal energy) entering a solar still is equal to the summation of incident direct and diffuse radiations [40]:
where , , and are the total, direct, and diffuse solar radiation (W) that have entered the solar still. The indices of 1 and 4 in Equation (1) indicate that the summation must be done over all the four glass covers. For any of the covers the direct and diffuse solar radiation can be calculated by Equations (2) and (3) [41]:
where is the glass surface area (m). and are the glass transmittivity for the direct and diffuse radiation, and are the direct and diffuse irradiance on a horizontal surface (W/m2), respectively. is the solar incident angle on the glass (degree) and is the glass tilt angle (degree). Solar irradiance on a horizontal surface () is the same for all the surfaces and its value can be obtained from the existing data. For each of the glasses, the value of can be obtained using its dimensions, and there are formulations for calculation of , [28]:
The value of solar incident angle on the glass surfaces can also be found by Equation (6) [42]:
where is the solar declination angle, is the location latitude, is the glass surface azimuth angle, and is the hour angle. Aramesh et al. [43] have thoroughly discussed the relations for calculation of and angles. To avoid complexity, these relations are not given here. The total amount of incident solar thermal energy in the solar still can be calculated using Equations (1)–(6). The methodology for calculation of the geometrical parameters including glass surface dimensions and azimuth and tilt angles will be discussed in detail in the next sections.
2.3. Geometrical Parameters for Designing a Double-Slope Solar Still
2.3.1. Definition of Surface Tilt and Azimuth Angles
For a better understanding of the problem and the discussion of the relations, first the azimuth and tilt angles for a surface are defined. These definitions will then be utilized to calculate all the required geometrical parameters for modelling every possible configuration of double-slope solar stills.
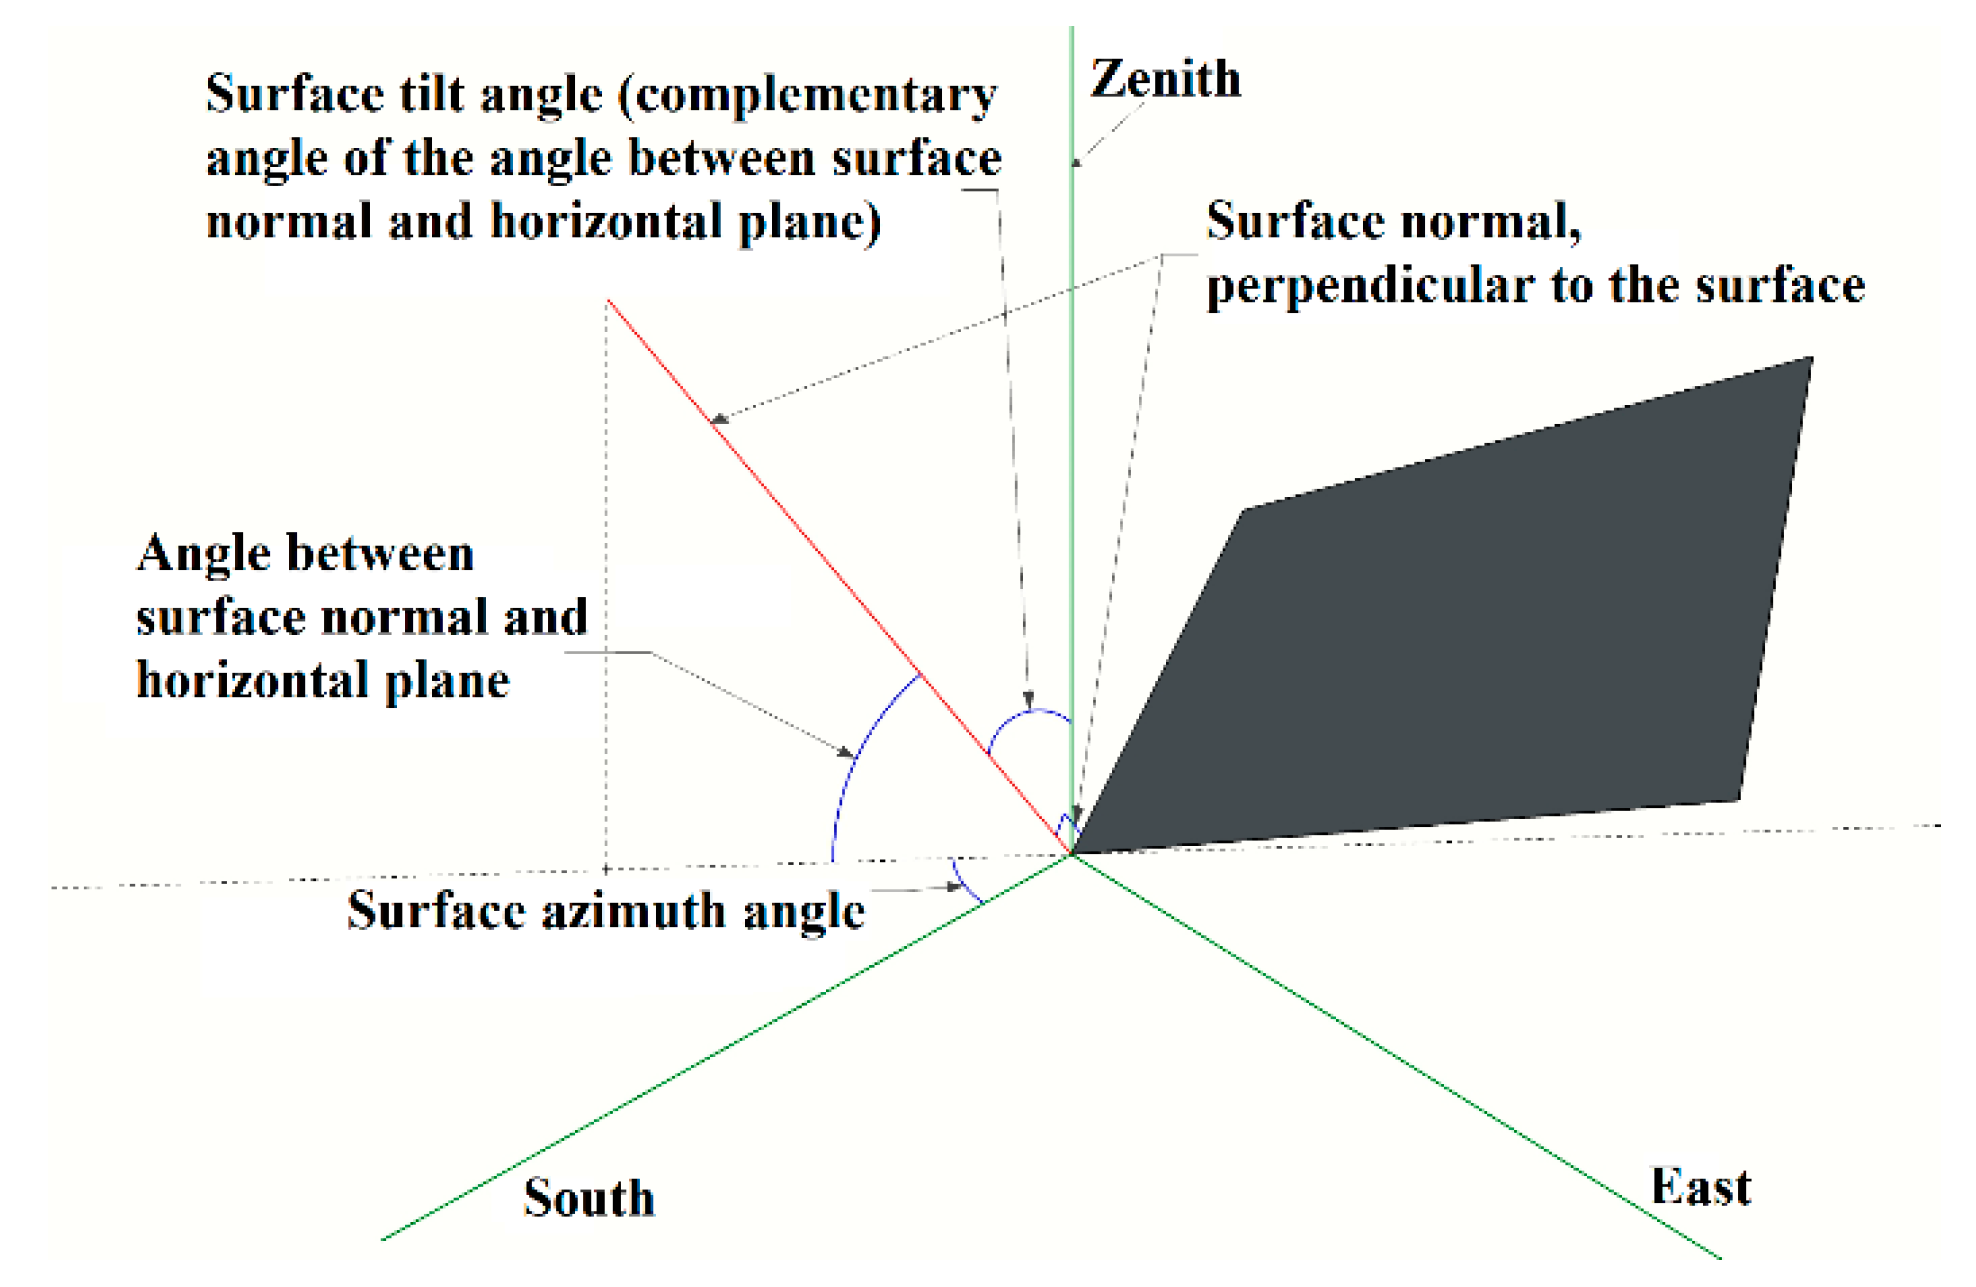
Surface tilt angle is defined as the angle between the surface and a horizontal plane [42]. Considering that the surface normal is perpendicular to the surface, the surface tilt angle would be equal to the complementary angle of the angle between the surface normal and its projection on a horizontal plane. In other words, the surface tilt angle is the angle between the surface normal and the Zenith direction. The surface azimuth angle is the angle between the projection of surface normal on a horizontal plane and the South direction. This angle has a value between −180° and 180°, with the angles toward East as negative and toward West as positive values [42]. Figure 2 shows schematics of the surface and illustrates the definitions of the surface tilt and azimuth angles.
Figure 3a shows the definition of surface azimuth and tilt angles for a solar still. In this figure the glass covers are also numbered, and further discussions will be based on these. Figure 3b shows some parameters defined to identify the dimensions of the solar still.
In Figure 3b, , , are the solar still basin depth, length, and width, and , , , and are the glass covers’ lengths and inclination angles, respectively. Other parameters are defined to ease the discussion of the model presented in this paper.
The sunlight passes through the glasses, thus in practice the tilt and azimuth angles of the glasses affect the amount of input sunlight. However, as can be concluded by Figure 3a, finding these angles can be very complicated. On the other hand, the tilt and azimuth angles of the still basin can be easily found. Hence, in the model presented here the angles for the basin are considered as the main effective parameters and proper relations are derived to calculate the values for each of the glasses by the values of basin angles.
More explanation of the above-mentioned parameters is given in Section 2.3.2 and Section 2.3.3.
2.3.2. Calculation of the Glasses’ Dimensions
The values of the solar still basin depth (), length (), and width () and also the inclination angles of the glass covers ( and ) are determined whilst designing the device. The glass covers’ length must also be known for calculating the incident solar thermal energy on each of the glasses. According to trigonometry rules:
On the other hand:
By replacing in Equation (8) with its equivalent relation given in Equation (7):
and by replacing in Equation (8) with its equivalent relation given in Equation (7) and with a similar procedure:
Therefore, when the main design parameters are determined, the unknown dimensions of the glass covers can be calculated using Equations (9) and (10). Furthermore, the surface area for the four faces shown in Figure 3 can be obtained by the following equations:
Using Equations (11)–(14), the total glass surface area can be calculated from the main design parameters.
2.3.3. Calculation of the Glasses’ Tilt and Azimuth Angles
The values of the glasses’ azimuth and tilt angles must be determined to find the total amount of incident radiation. There are more auxiliary parameters required for calculation of these angles by employing the main design parameters. In this regard, the side and front views of the solar still and the defined parameters are illustrated in Figure 4.
The parameters defined in Figure 4a are not dependent on the solar still tilt angle, hence this figure shows the side view of a not-inclined device. The red lines in Figure 4a are the normal vectors of the inclined glasses of the device. Therefore, , , , and are right angles and:
Considering the basin has a cuboid shape, the values of and are equal to 90° and:
By combining Equations (15) and (16):
Using triangular relations:
The length is also achievable using triangular relations:
By applying the same procedure for the other side:
And:
In this case, the tilt angle of the device affects the values of the defined parameters. As can be seen in Figure 4b:
By employing triangular relations:
By replacing Equation (22) into Equations (23) and (24):
Because the solar still tilt angle () and its basin height () are constant, the lengths and would be the same for the opposite side too.
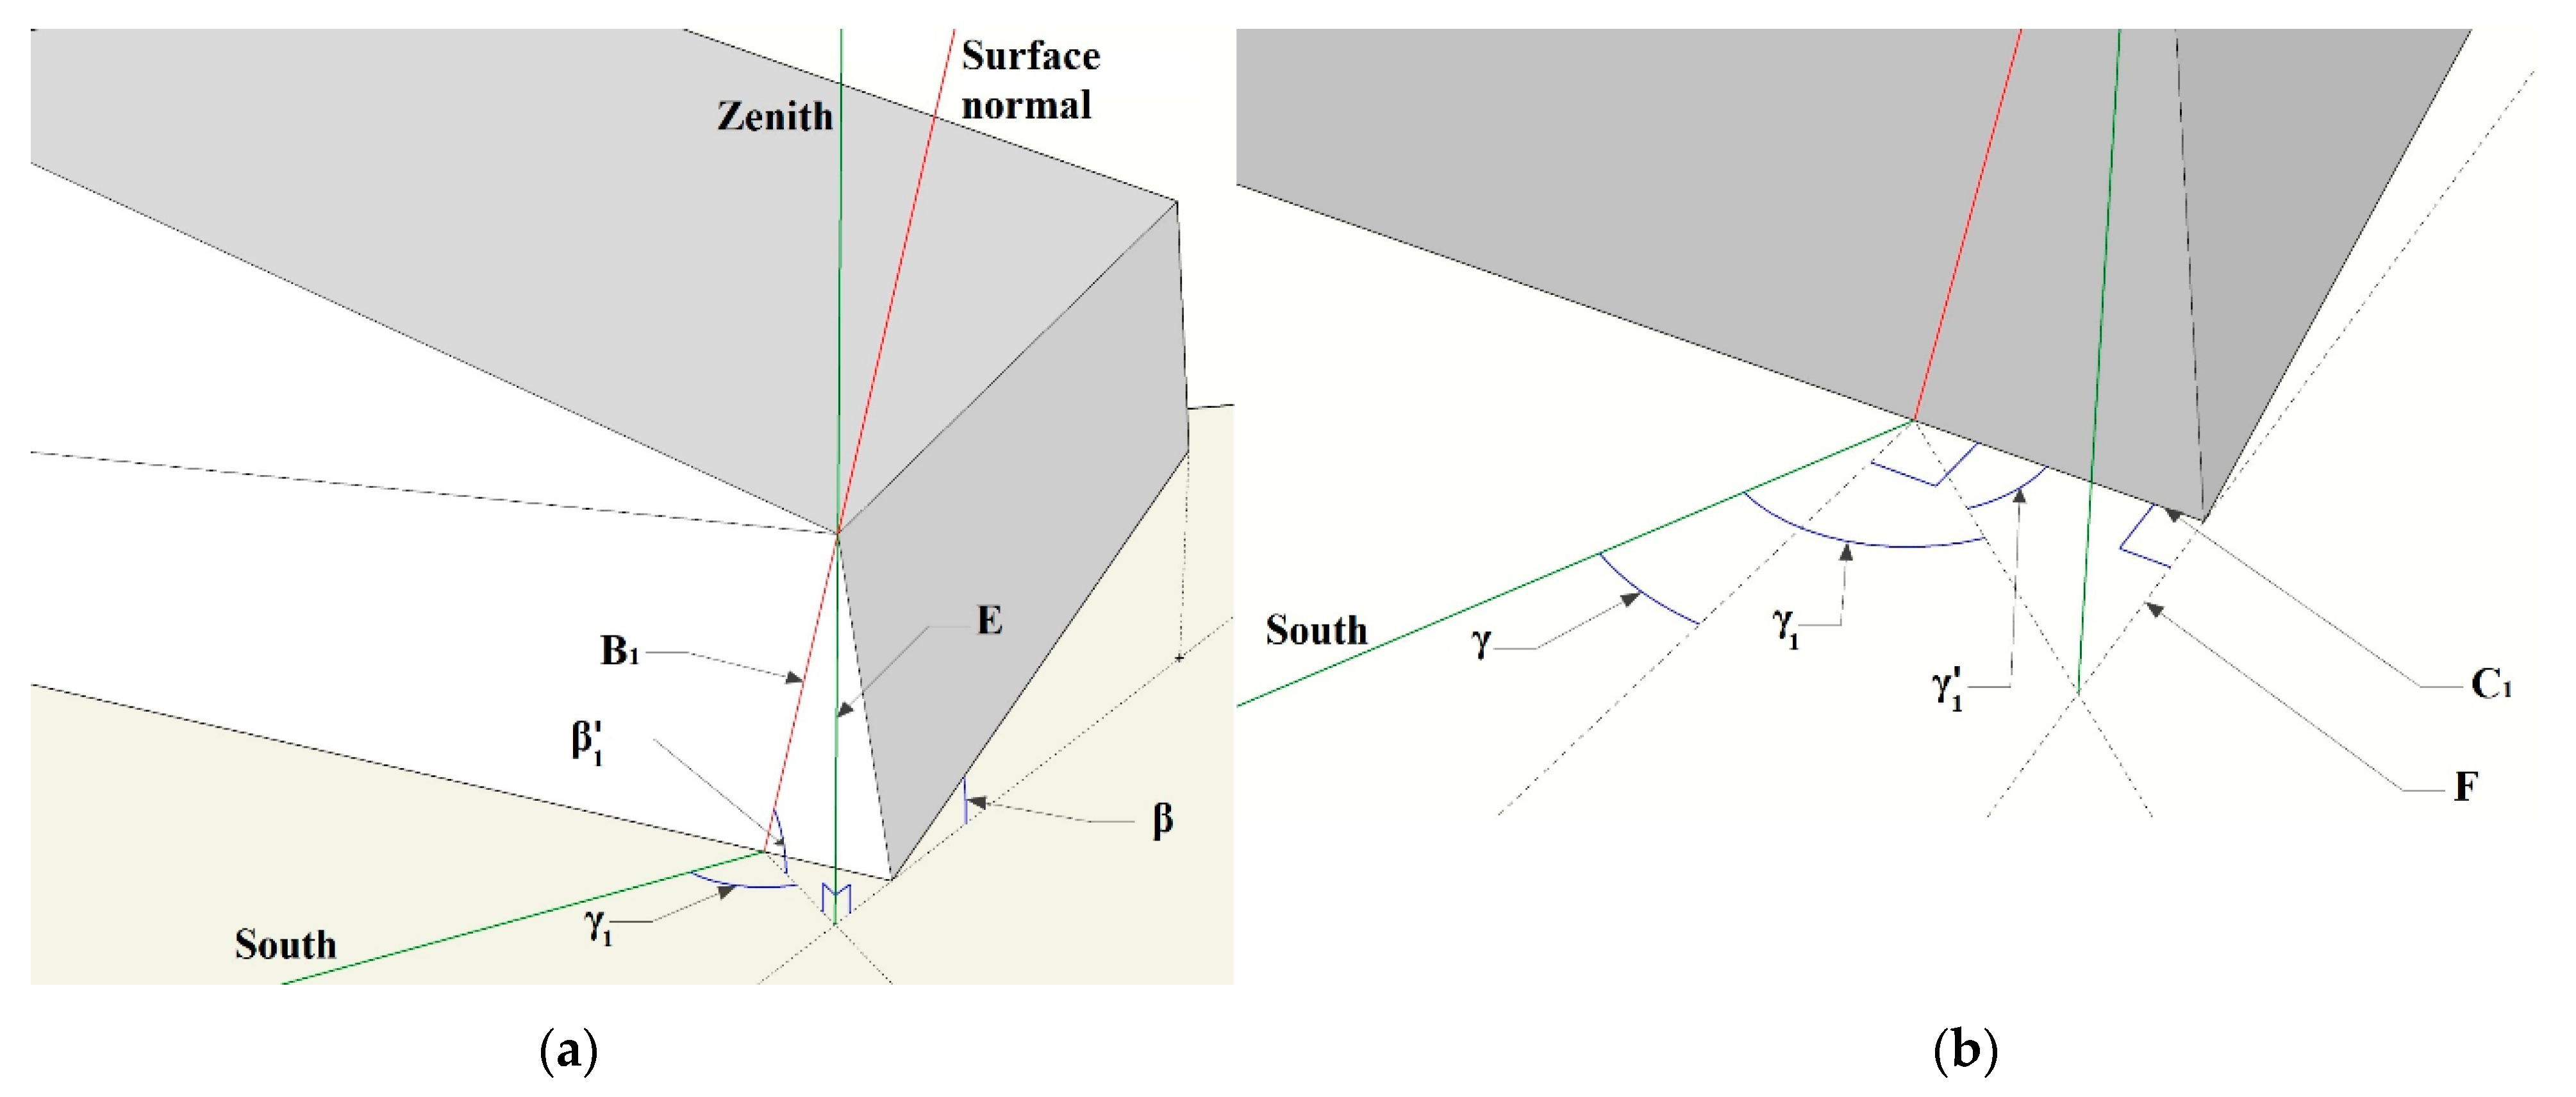
In Figure 5a, is the angle between the normal of the glass cover and a horizontal surface which, according to Figure 2, is the complementary angle to the glass tilt angle. Therefore, the glass cover tilt angle is achievable:
By applying triangular relations:
By replacing and with their relations given in Equations (18) and (25):
By combining Equations (27) and (29) the glass cover tilt angle will be obtained:
With the same procedure, the tilt angle of the opposite cover will be achieved as:
To find the glass cover azimuth angle, further calculations are required. According to Figure 5b:
The solar still azimuth angle is known from the basin arrangement. The angle can be found using triangular relations:
Therefore, the glass cover azimuth angle will be:
Likewise:
Therefore, by determining the main design parameters, for the glass covers 1 and 2 in Figure 3, the tilt angles can be found using Equations (30) and (31), and azimuth angles can be calculated by Equations (34) and (35), respectively. The other two glass covers are perpendicular to the solar still basin, hence their azimuth angle is the same as that of the solar still, but their tilt angle would be equal to the complementary angle of the basin tilt angle. However, there are some rules based on the direction of the face that must be considered in determination of the tilt and azimuth angles. If the surface normal is towards the east direction, the value of the surface azimuth angle would have a negative sign. By definition, surface tilt angle has a value between 0° and 180° with values more than 90° for the surfaces facing toward the ground [42]. Therefore, in the northern hemisphere, where the sun is due south, for the configuration shown in Figure 3a:
2.4. Model Summary
The overall model developed in this section through Equations (1)–(36) shows that only six main design parameters are required to calculate the total solar energy input to a double-slope solar still. Those six parameters are the solar still width, length, tilt angle, and azimuth angle, and the two glass covers’ inclination angles. According to Equations (1)–(6), except for the location and time, the total energy input is dependent on each of the glass covers’ surface area, tilt angle, and azimuth angle. A summary of how these parameters can be calculated by the six main design parameters is given:
- Glass covers’ surface area; as given in Equations (11), (12) and (14), the glass covers’ surface area can be calculated by using the basin width and length, and the glass covers’ inclination angles, i.e., four of the main design parameters.
- Glass covers’ tilt angle: Equations (30) and (31) show that by using the solar still tilt angle and the glass covers’ inclination angle, i.e., two of the main design parameters, the tilt angle of the covers No. 1 and No. 2 are obtainable. The discussion above Equation (36) also reveals how the tilt angle of the other two surfaces can be obtained just by using the solar still tilt angle, which is one of the main design parameters.
- Glass covers’ azimuth angle: according to Equations (34) and (35), the azimuth angles of covers No. 1 and No. 2 are obtainable by using the solar still azimuth and tilt angles and the glass covers’ inclination angles, i.e., four of the main design parameters. Again, the discussion above Equation (36) shows how the azimuth angle for the two other glass covers can be found just by using the solar still azimuth angle.
The above summary indicates that, if the local and time data are available, only the six main parameters identified here are required to find the total energy input to a double slope solar still. Hence, the exact same parameters can be considered as design variables to find an optimum design that maximizes the energy input to the solar still. These design variables can be utilized for sensitivity analyses to find out how each of them affects the amount of energy input.
3. The Optimization Method
The Genetic Algorithm (GA) has been employed to find the optimum design of a double-slope solar still. All the main design parameters have been selected as the optimization parameters:
- Basin width ()
- Basin length ()
- Basin azimuth () and tilt () angles
- Inclination angles of the glass covers ( and ).
Two objective functions have been considered:
- Maximum annual energy input to the solar still
- Maximum annual energy input per total glass surface area
These functions can be defined by the equations below:
where is the total annual amount of solar thermal energy entering solar still (J), is the total surface area of the glass covers (m2), and is per (J/m2). The two functions have been chosen because each of them alone can lead to physically impossible results. If the total energy input were the only objective function, the larger designs would achieve higher amounts. Therefore, the glass cover inclination angles of near 90° must be among the characteristics of the optimum design because, in such angles, the glass covers will have an infinite surface area. Similarly, infinite basin length and width would create an optimum design. On the other hand, if there was only the second function chosen, the covers’ surface area of 0 m2 leads to infinite value for the objective function, which is again physically impossible. To resolve this issue, both parameters have been selected as the optimization functions. Furthermore, an annual basis has been chosen because the optimum design would differ for different seasons and it is practically impossible to change the configuration of a solar still setup for each season.
There are also some limitations defined for the optimization parameters to eliminate unrealistic and impractical results. These limitations are discussed below:
- Negative basin width or length might result in optimum values of the optimization functions but are physically impossible. Very small dimensions might also be able to satisfy the optimization problem, but in practice will not have enough capacity for the brine water that needs to be put inside the solar still. Very large dimensions can also be hard to manufacture, operate and maintain. With this regard, for the optimization problem a size limit of 0.2–2 m is considered for the basin length and width.
- In practice, the solar still cannot be tilted too much as the brine water inside it will get separated from the absorber surfaces and spill over the glass covers which will interrupt the desalination operation. Hence, a maximum basin tilt angle of 60° is considered for the optimization problem. The minimum value would be 0° indicating a horizontally placed solar still.
- Although each of the glass covers can have an inclination angle of between 0° and 90°, in practice, they both cannot be of 90° inclination angle simultaneously. Similarly, high inclination angles for both glass covers can create weird designs with very large glass covers. Hence, instead of limiting the covers’ inclination angles, the summation of both inclination angles is limited. With this regard, each cover can have an inclination angle of 0–90°, but the summation of these angles is considered to be between 0° and 150°. The value of 0° indicates one glass cover parallel to the basin bottom surface. The upper limit means that the angle at the intersection of the two covers has a minimum value of 30°.
There is no limit for the basin surface azimuth angle as it can be turned in that direction without creating any undesirable or impractical situation. It is highly important to note that the above limitations are considered for the optimization problem. The aim of optimization is finding a design with the most desirable performance based on the objective functions. Therefore, unrealistic and impractical values of the optimization parameters must be eliminated, as there would be a chance that such values will theoretically be among the optimum results. A sensitivity analysis, though, aims to provide a clear picture of how different parameters affect their dependent functions. For such analyses it is important to find the function trends based on the changes in the corresponding parameters. Therefore, here, with the aim of giving a clear picture of the trends and behavior, the size and basin tilt angle limits are considered to be 0–3 m and 0–90°, respectively. There is also no limit for the summation of the glass covers’ inclination angles.
GA determines different sets of values for all the optimization parameters in each of the calculation iterations. Therefore, by the modelling method presented here, for all the iterations, GA calculates all the parameters and obtains the total amount of thermal energy entering the solar still. To obtain the total annual energy input, hourly average direct and diffuse irradiance data for a horizontal surface ( and ) have been employed and using Equation (6) the values of incident angle () have been found. By using these values, the hourly total energy input is obtainable. The irradiance data have been gathered from a local meteorological station in the city of Tehran, Iran.
Therefore, in each calculation iteration, the total hourly input energy is calculated throughout the year and then the total annual amount is calculated by the summation of hourly values. Using these results, GA finds the optimum sets of parameters which lead to the maximum annual energy input to the solar still.
For a multi-objective optimization, there is no single parameter that should have a minimum or maximum value. Hence, GA presents different sets of optimum parameters, each set satisfying the objective functions differently. In such cases, decision-making methods such as TOPSIS are employed to determine the desirable parameter set, based on the importance of the objective functions for the decision maker [44]. Here, since the two objective functions emphasize the maximization of solar input and the elimination of physically impossible results, equal weights, i.e., of equal importance, are considered for both functions.
4. Results and Discussion
4.1. Validating the Presented Modelling and Optimization Methods
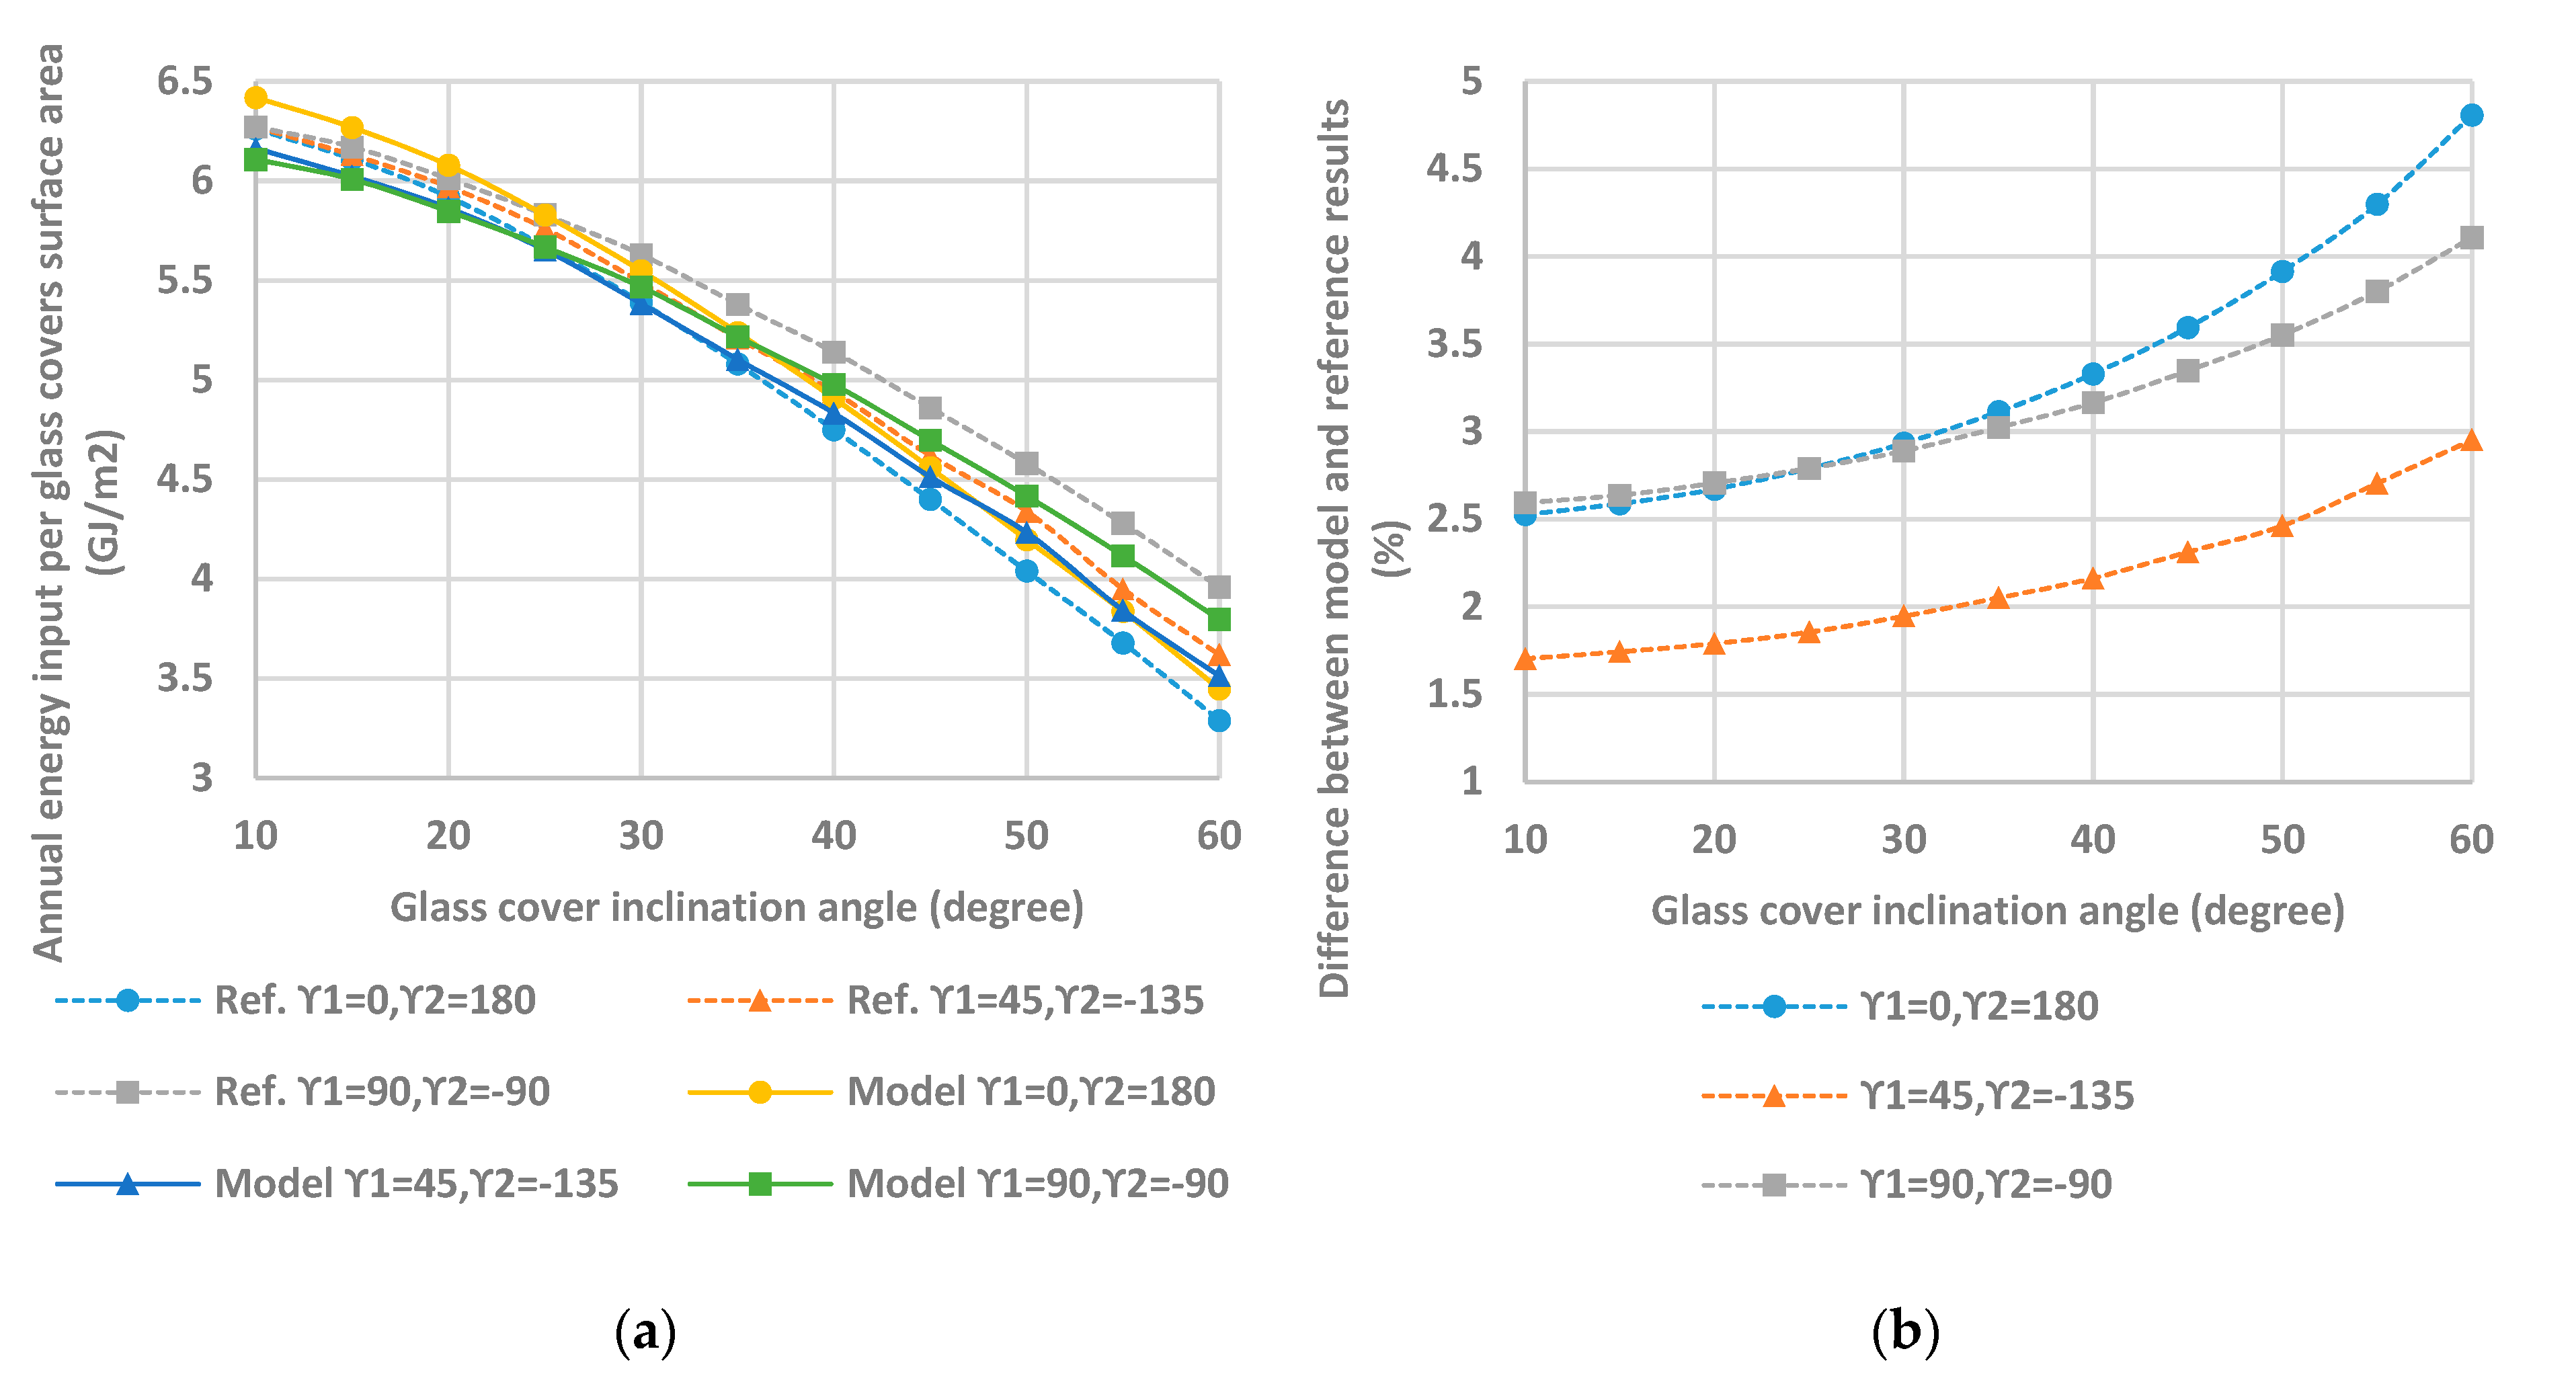
El-Maghlany [28] has found optimum glass inclination angles for three different basin azimuth angles, in fixed dimensions, of a double-slope solar still. The same formulation that El-Maghlany has employed for calculating the radiation data and the same design parameters have been used here as the model inputs. To validate the model proposed in this paper, the calculated value of the total annual energy input per glass covers’ surface area is compared with the values reported by El-Maghlany [28] with the same input parameters. Figure 6 shows the model validation results.
In Figure 6, the amount of annual energy input per glass cover surface area is shown for different glass cover tilt angles, i.e., and , and different glass cover azimuth angles, i.e., and . It must be noted that according to El-Maghlany [28], for this specific case, the same inclination angle is considered for both glass covers, i.e., . The results shown in Figure 6 indicate that the presented model has a very good agreement with the results of the study by El-Maghlany [28]. The difference between the calculated amounts and the amounts reported by El-Maghlany [28] varies between 1.5–5% which is totally acceptable. The minimum differences are obtained for .
In the next step, with the aim of validating the presented optimization method, the optimization results of the present study and the ones in the study by El-Maghlany [28] are compared. The specifications used in the optimization problem by El-Maghlany [28] are given in Table 2.
4.2. Sensitivity Analysis
By the modelling method presented in this paper, the effects of the main parameters on the total annual solar thermal energy input can be studied. The specific configuration given in Table 4 has been selected as the primary design and the sensitivity of the total energy input energy to each of the mentioned parameters has been analyzed. That is, for all the analyses in this section, all parameters except for the ones subjected to sensitivity analysis are equal to those given in Table 4.
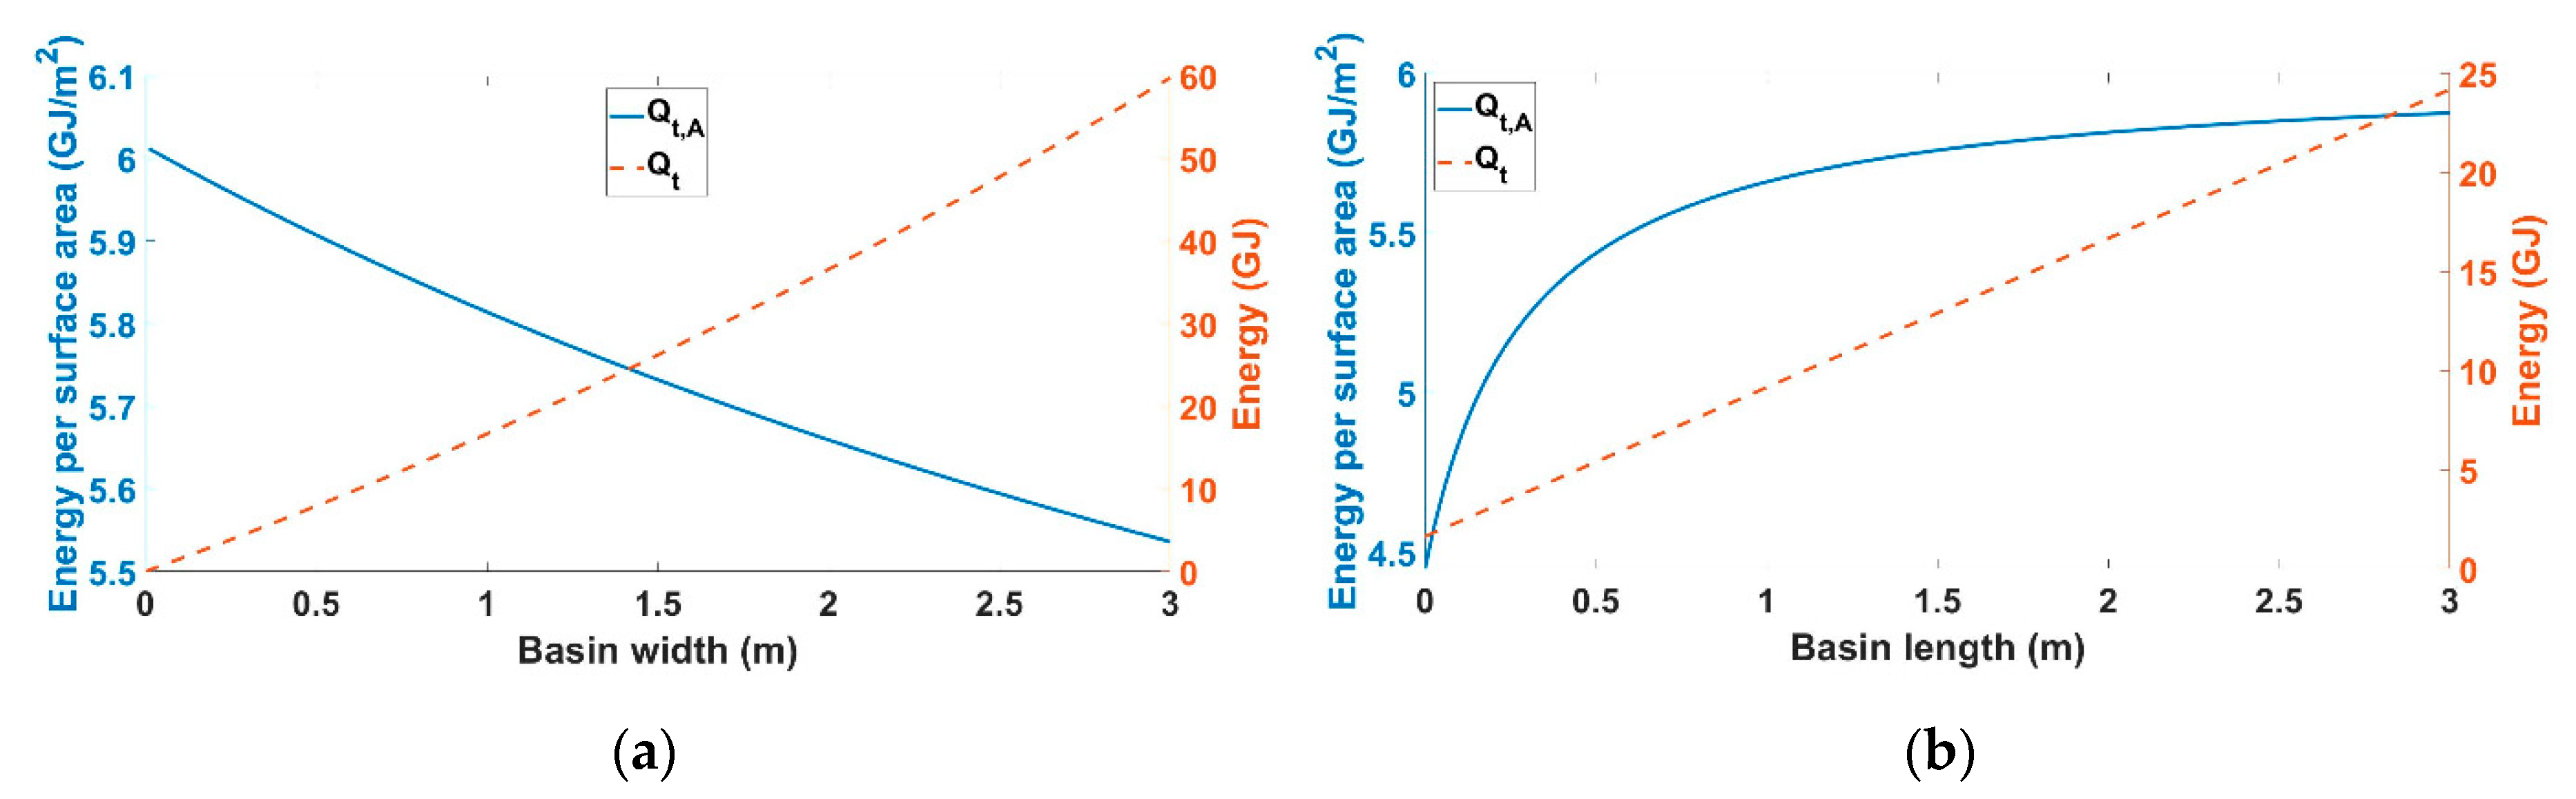
First, the effect of basin width () on and has been studied. To do so, all the other specifications are considered to be constant, and the value of is varied between 0 m and 3 m. The results are shown in Figure 7a. The same procedure has been followed for the basin length () and the results are shown in Figure 7b.
As was predicted and as shown in Figure 7a, the amount of total annual thermal energy entering the solar still significantly increases by increasing its width. By changing the width from 0 m to 3 m, the value of rises from 0 GJ to 60 GJ. However, a contrary behavior with a lower intensity is achieved for that amount per total glass cover surface area. This means that the increase rate in total glass surface area is more than that of total input energy. However, this rate for is not considerably higher than the rate for , because the decrease rate of has a relatively low pace. It decreases from about 6 GJ/m2 to about 5.5 GJ/m2. It must be noted that is not defined at , and there is no value calculated at this point, because, according to Figure 3a, there will be no surfaces when there is no width.
According to Figure 7b, totally a different behavior is obtained for the device length. Both and have a rising trend and they increase from about 4.4 GJ/m2 to 5.9 GJ/m2 and from about 2 GJ to 25 GJ, respectively. Figure 7b indicates that the increase rate in is higher than that of , especially in the smaller lengths. The energy input shows an almost linear dependence on length. For lengths of more than 2.5 m, the slope of becomes near zero meaning, that from this point both and increase at close rates. A specific characteristic of the graphs given in Figure 7b is that none of the investigated parameters has the value of zero when the length equals zero. Figure 3a can demonstrate the reason for such results. According to this figure, when , mathematically faces No. 3 and No. 4 still exist, and they have surface areas and can receive sunlight. However, this special condition is not possible physically.
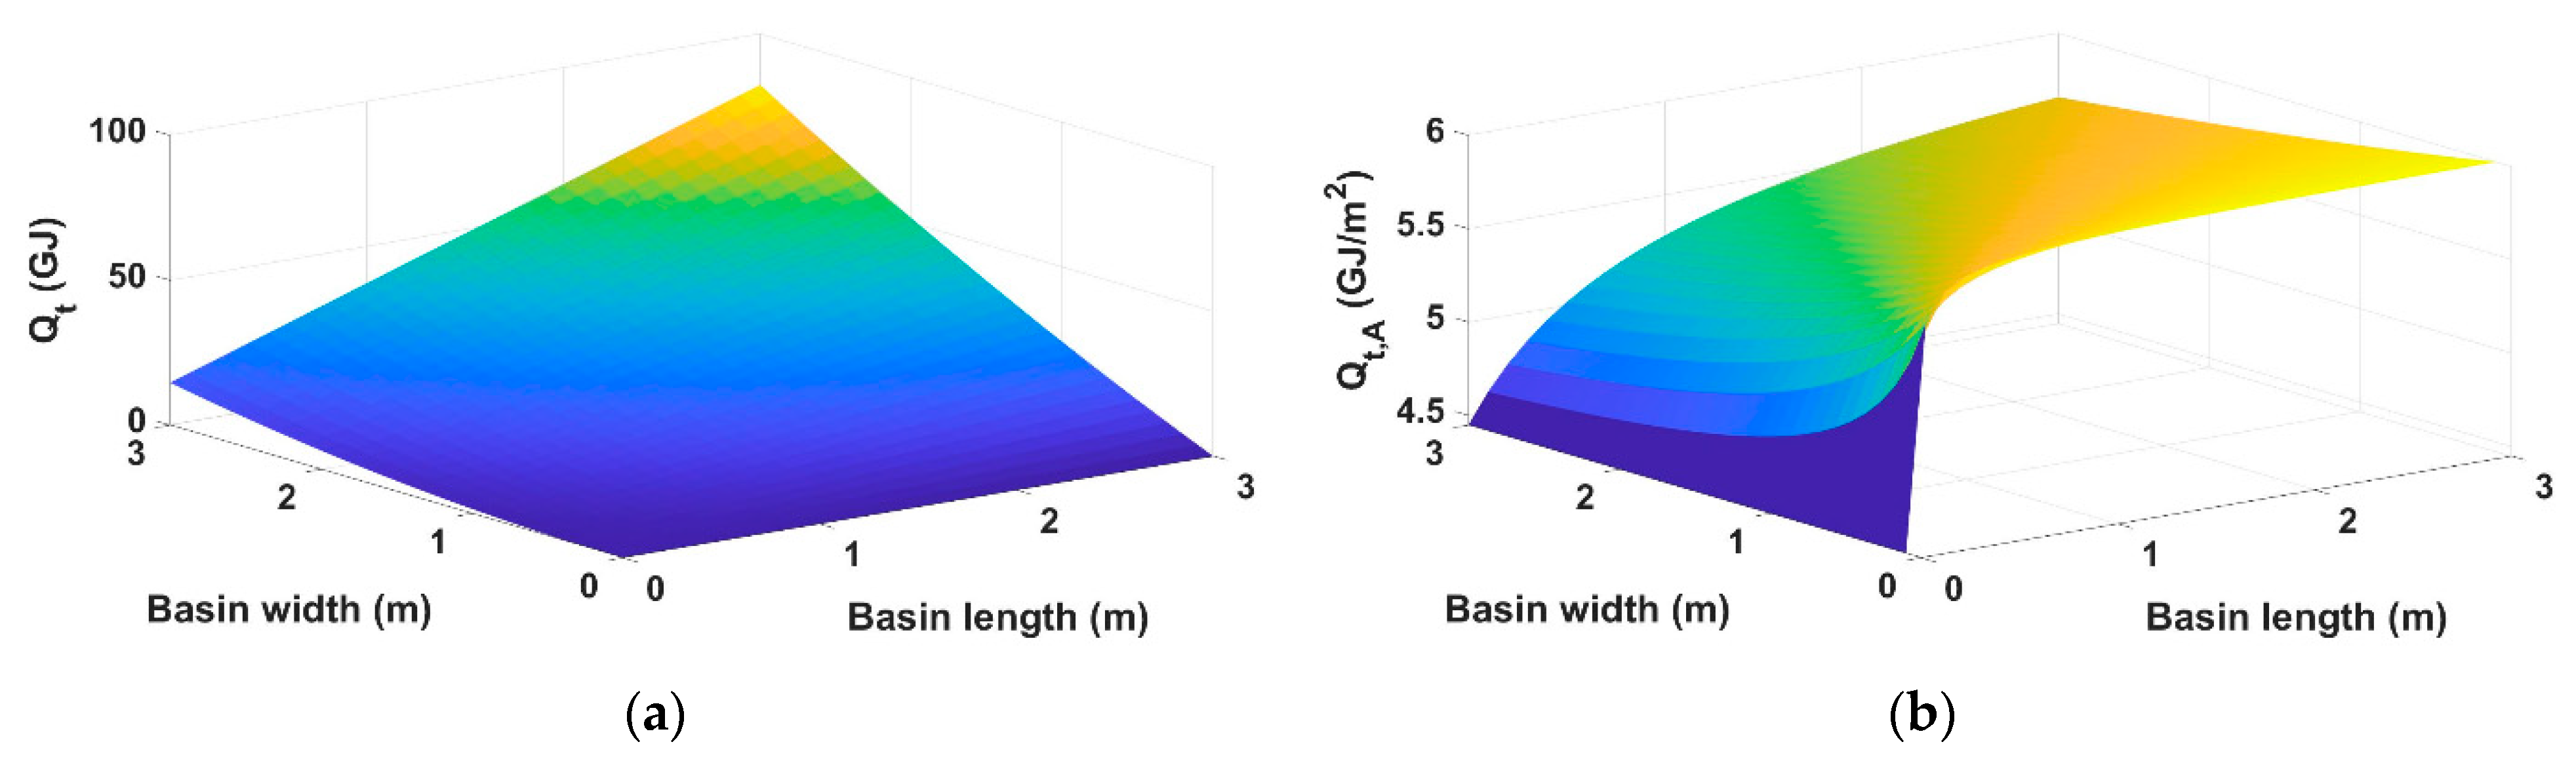
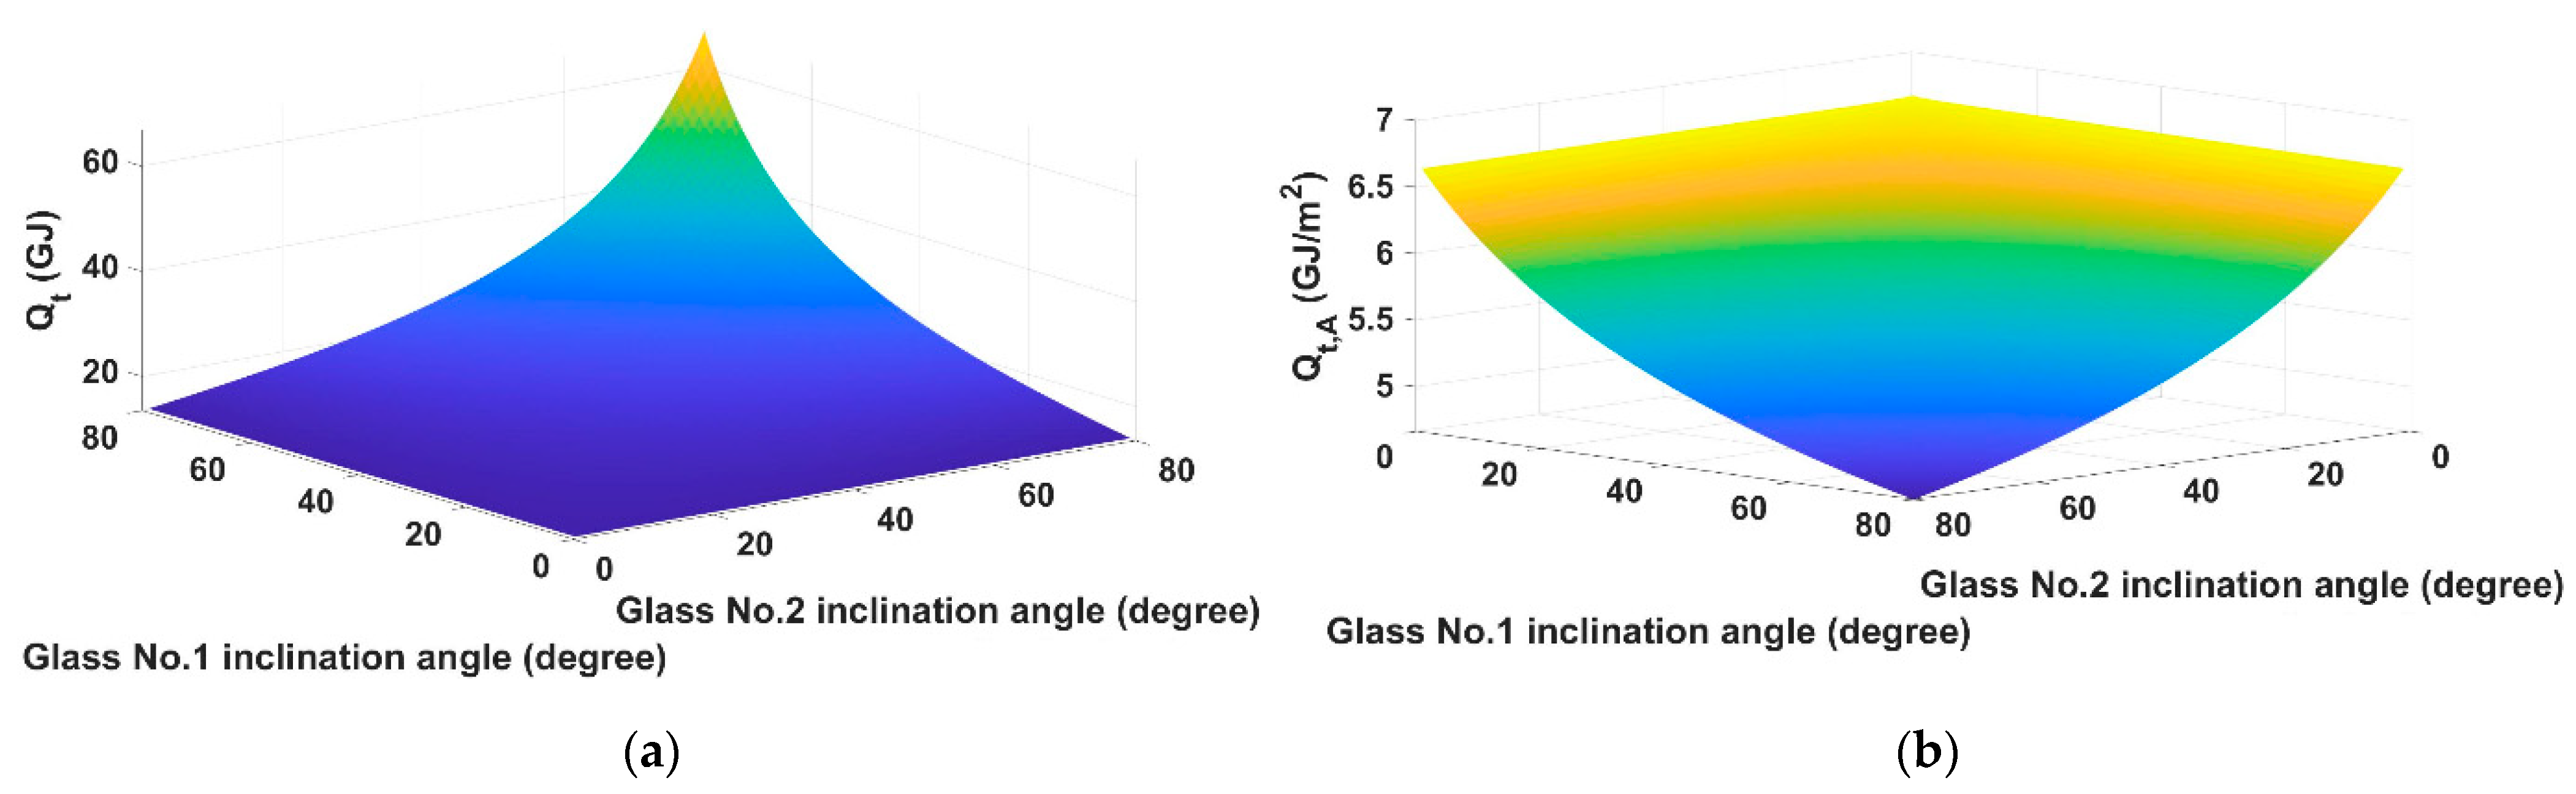
For a better comparison between the effects of the device width and length, Figure 8 shows and , respectively, when both width and length are variable.
Figure 8a indicates that the maximum annual energy input happens at the highest length and width, which is totally predictable. This figure also shows that the increase in width has more influence on the total amount of energy input. The different behaviors and effects of width and length in the value of are more visible in Figure 8b. According to this figure, smaller widths and larger lengths will lead to higher values of . It can also be seen that in lower values for both width and length, the effects on are more intense, especially for length.
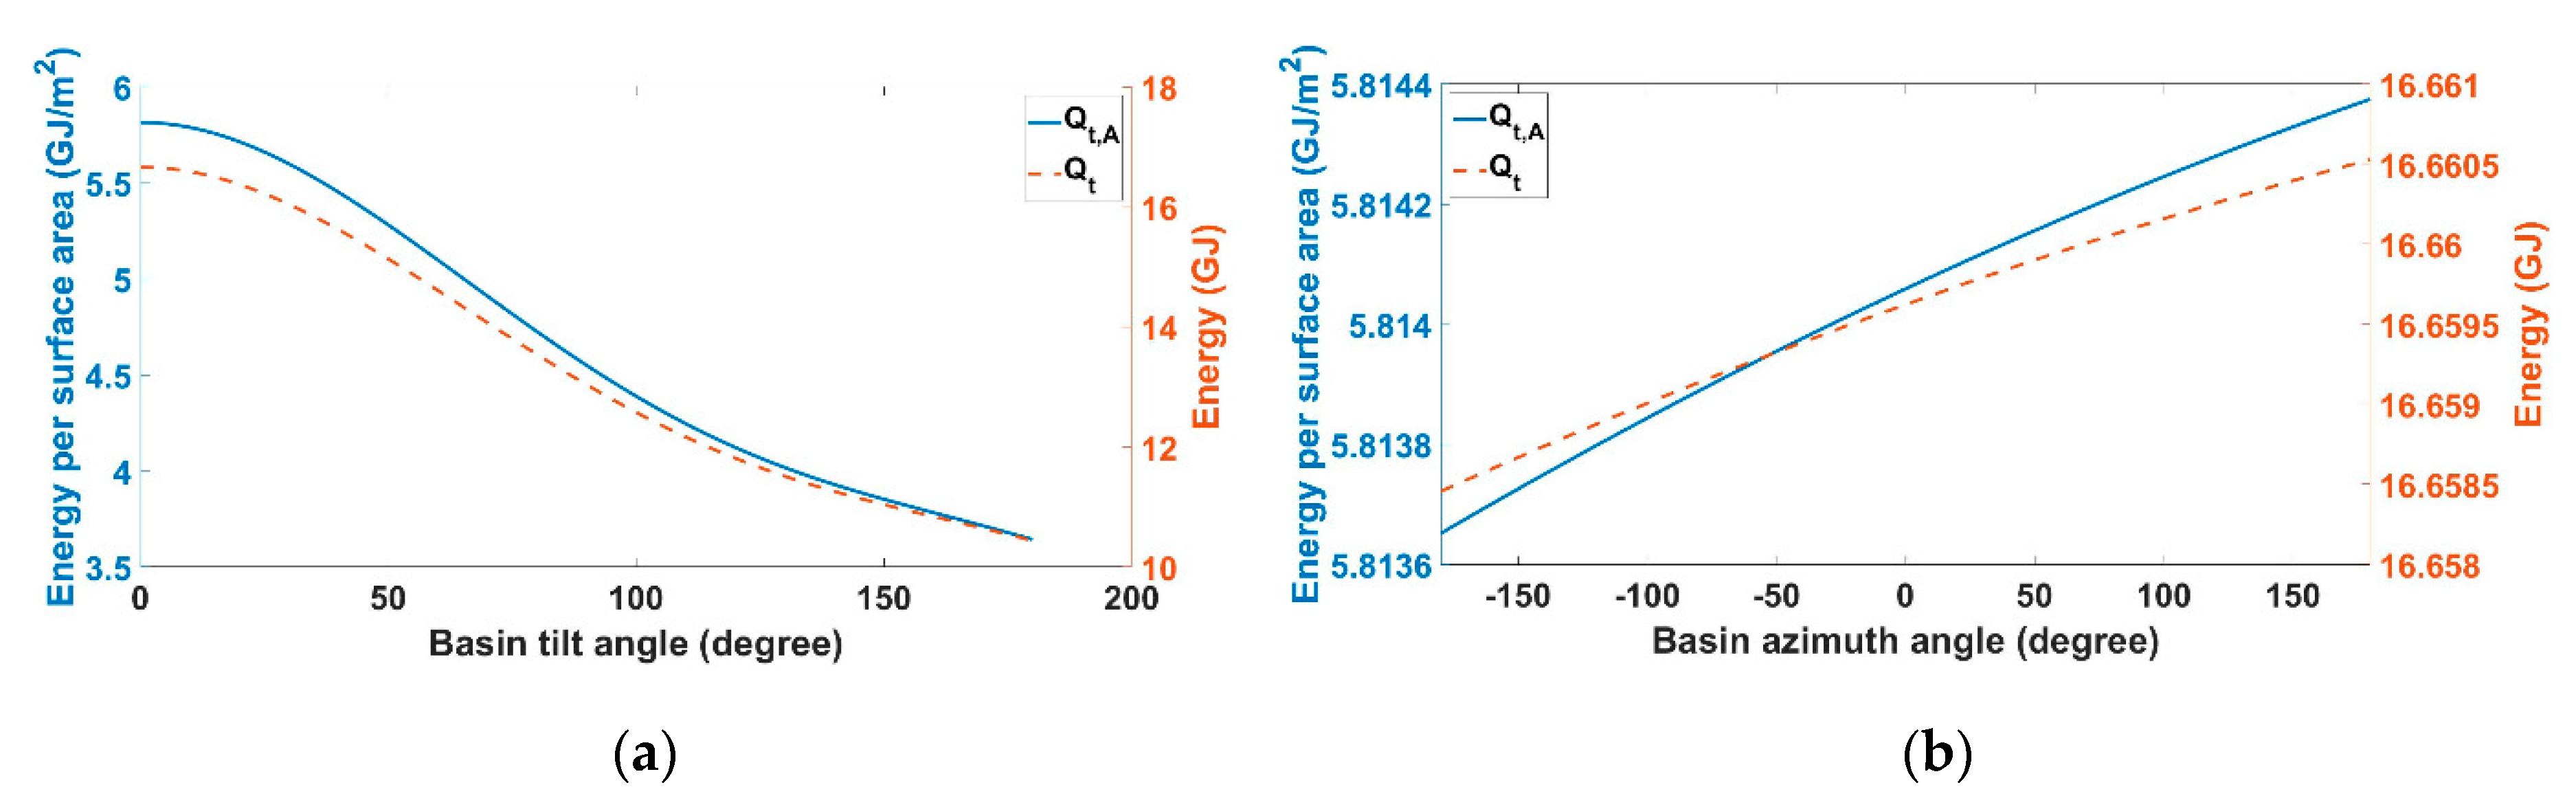
Similar investigations have been conducted for the basin tilt and azimuth angles. Figure 9 shows the effects of the device tilt angle () and azimuth angle () on the amounts of and .
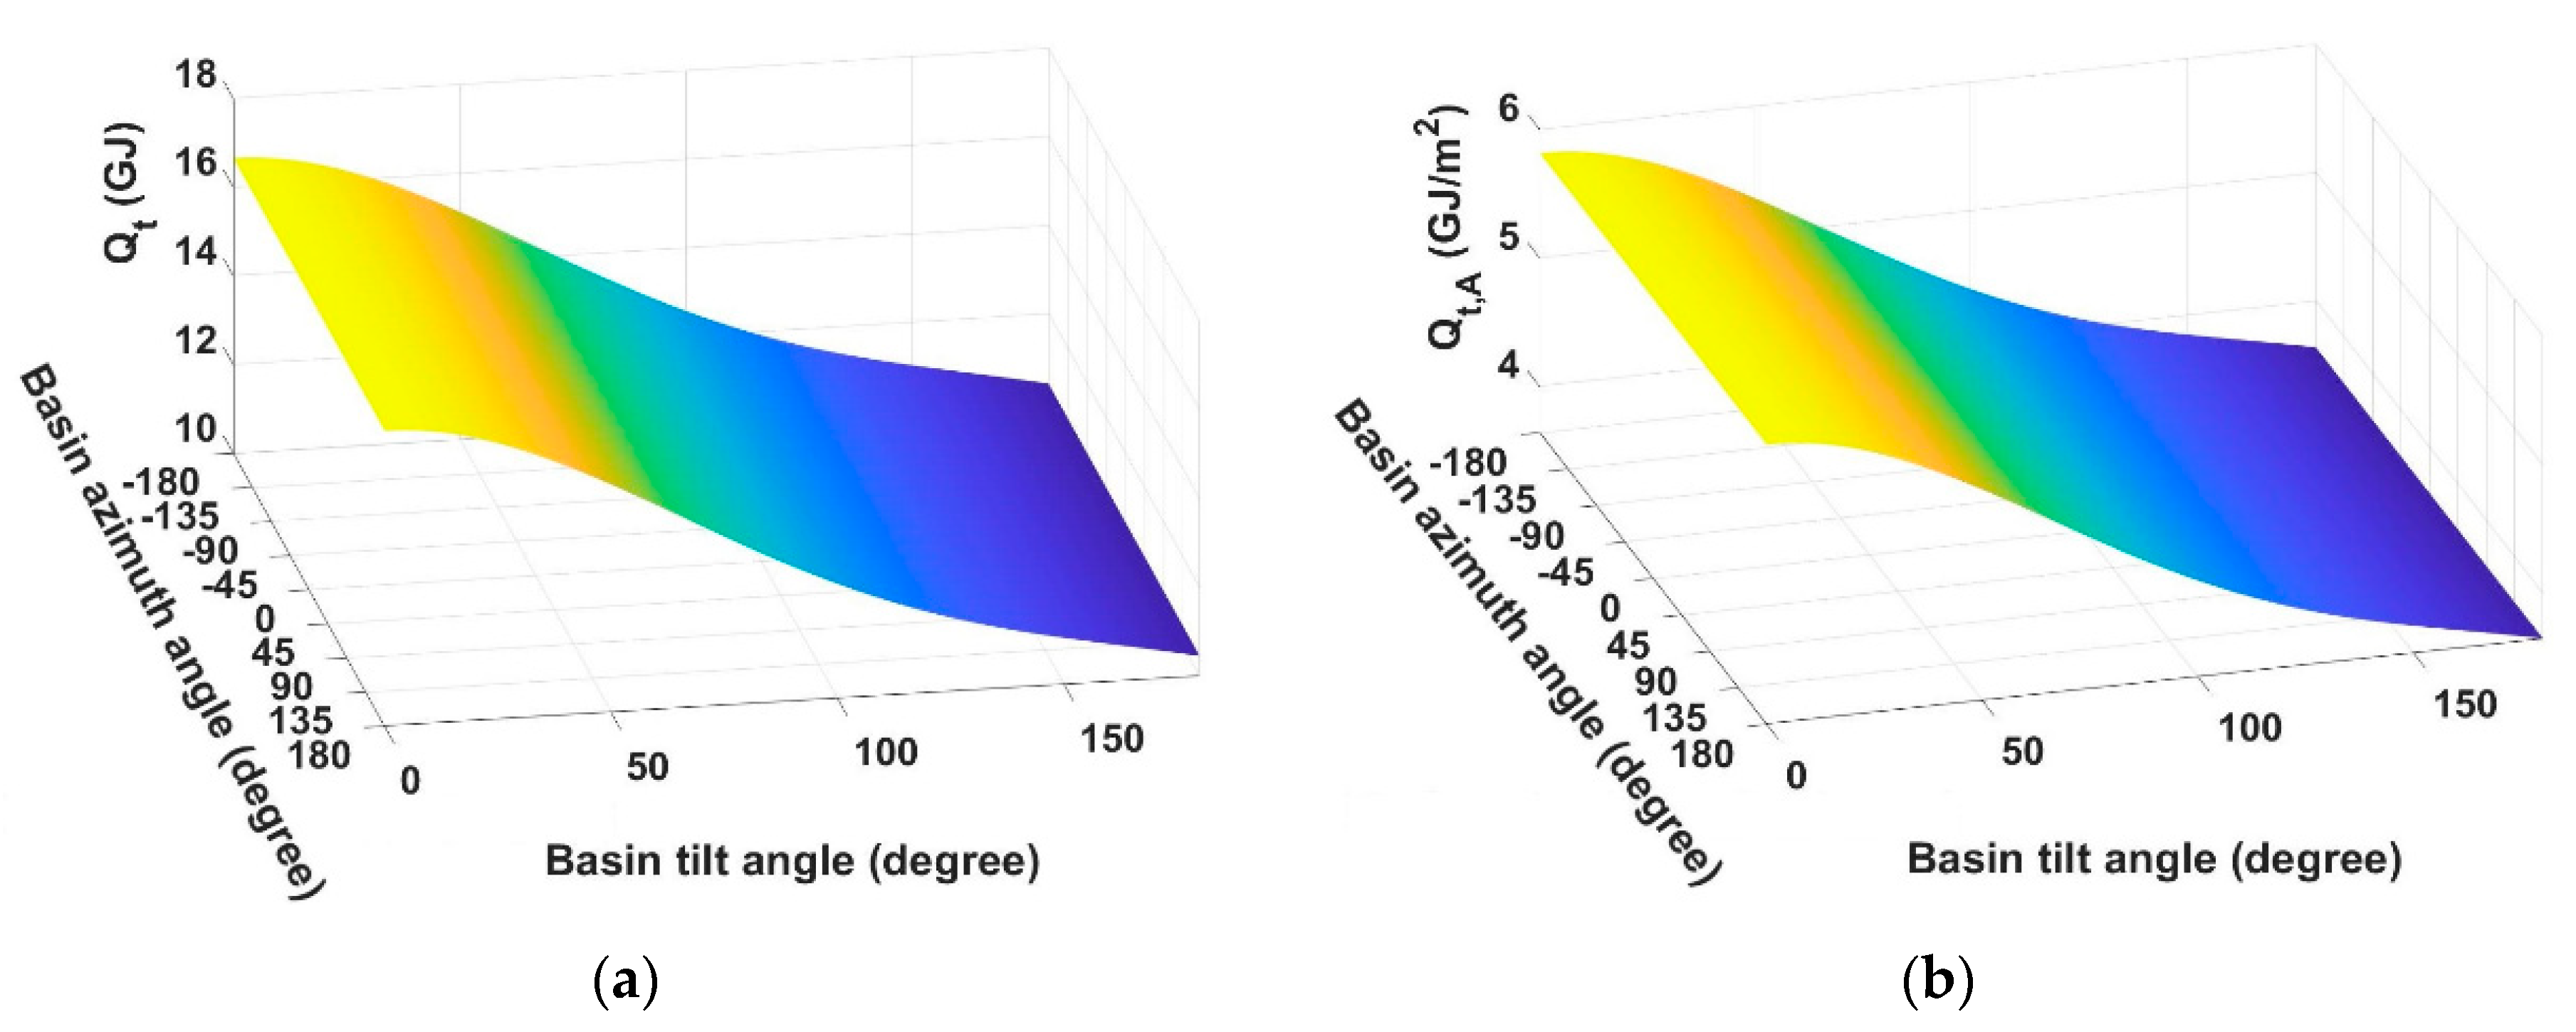
As Figure 9a suggests, the device tilt angle has a considerable impact on both and . However, this impact is totally identical for both the parameters because the basin tilt angle has no effects on the glasses’ surface area. The small difference between the graph lines in Figure 9a is because of the difference between the values on the vertical axes. When the device tilt angle increases from 0° to 180°, and reduce from 16.66 GJ to 10.44 GJ, and 5.814 GJ/m2 to 3.643 GJ/m2, respectively. Both parameters have reduced by exactly 37.34% at an identical rate. It can also be seen from Figure 9a that for the configurations given in Table 4 the maximum amount of annual input energy is achievable when the solar still is not tilted and higher tilt angles will lead to less energy input. Figure 9b shows similar comparison for the device azimuth angle. It can be concluded from this figure that the basin tilt angle has very low effects on the total annual energy input or on that per total glass cover surface area. When , and increase with the basin azimuth angle in the ranges of 16.6 GJ and 5.81 GJ/m2, respectively. Again, identical effects are obtained because the basin azimuth angle too has no impact on the total glass surface area. For both parameters, the maximum increase is 0.012%, which is almost negligible. To compare the effects of device tilt angle and azimuth angles, Figure 10 shows the sensitivity of and to both angles.
Figure 10 shows that in the configuration given in Table 4 and in different values of device tilt angle, the azimuth angle effect on the amount of input energy is negligible. On the contrary, the basin tilt angle greatly affects input energy. To find the reason for this behavior, further investigations on these two parameters have been conducted. The modelling method presented here suggests that the azimuth angle can be effective on the angle of solar incident on the glass covers. The incident angle itself, according to Equations (2) and (4), is significantly effective on the overall energy input to the solar still. Therefore, the effects of basin azimuth angle on the value of the incident angle on each of the four glass faces are studied by Figure 11.
Figure 11 indicates that faces No. 3 and No. 4, which are vertical and are exactly in opposite directions, show exactly opposite behavior. However, for the other two faces that are inclined with different inclination angles, different behaviors are achieved. However, the most important outcome of Figure 11 is determination of the overall effects of basin azimuth angle on the glass covers’ incident angle. For all four glass covers, the basin azimuth angle has very little effect on the glasses’ incident angle. In the range of 180° to 180° of the device azimuth angle, the incident angles on glass covers No. 1 to No. 4 vary from 58.0899° to 58.0909°, 57.8281° to 57.8297°, 57.0427° to 57.0471°, and 57.0427° to 57.0471°, respectively. According to the modelling method presented in this paper through Equations (1)–(38), the solar still azimuth angle only affects the azimuth angle of the four glass covers. That is, among the final relations derived for calculation of different design parameters, as can be seen in Equations (34) and (35), the basin azimuth angle only appears in the calculation of the glass covers’ azimuth angles. Furthermore, as given in Equation (6), the only parameter that the glass covers’ azimuth angles affect is the incident angle on each of the glasses. Hence, by the results shown in Figure 11, it can be concluded that the effect of solar still azimuth angle on the glass covers’ incident angle, and therefore on the amount of total input energy, is negligible.
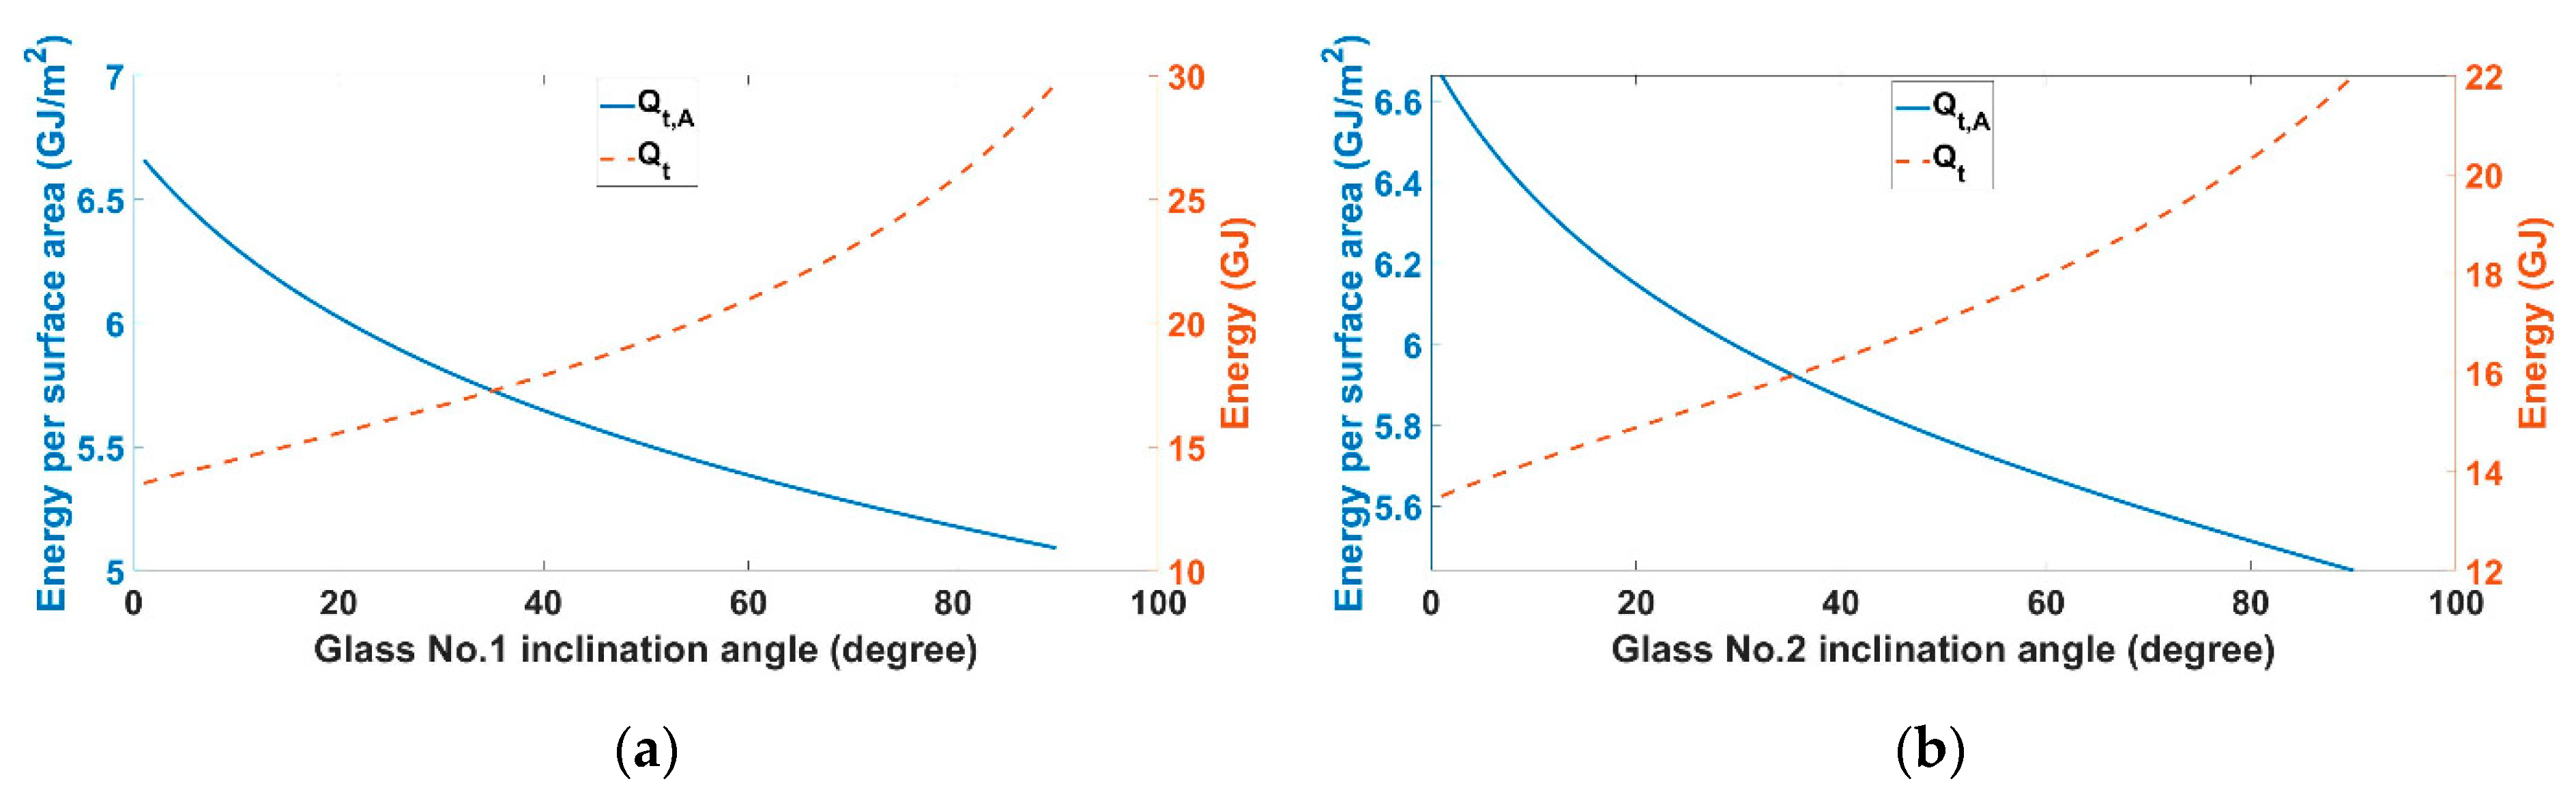
After studying the main design parameters of the solar still basin, the main design parameters of the glass covers, which are the inclination angles of faces No. 1 and No. 2, are investigated. Figure 12 shows the effects of these parameters on and .
For both and variable ranges of 0° to 90° have been considered because values more than 90° are meaningless for the inclination angle of a glass cover. The effect of the inclination angle of the glass cover No. 1 on and is like that of the basin width. The increase in increases the total glass surface area by a higher rate than it increases the total energy input. Therefore, the rise in leads to an increase in and a decrease in . Similar behaviors can be seen in Figure 12a,b for and ; however, the exact numerical values are different. The values of and change from about 14 GJ to 30 GJ and from about 6.7 GJ/m2 to 5.1 GJ/m2 when , and from about 6.7 GJ/m2 to 5.4 GJ/m2 and from about 13.5 GJ to 22 GJ when , respectively. The reason for this difference in the effects of the inclination angles of these faces is that their values in the primary design given in Table 4 are different. Figure 13 compares both and in variable values.
Considering that when , the glass covers will never intersect with each other in practice and angles near 90° will require huge glass covers, in Figure 13 the limitation of is considered for these two parameters. It can be seen from these figures that when there are no constant values considered for any of these two parameters, their effects on the solar still performance are identical. This similarity causes the graphs in Figure 13a,b to have symmetric shapes. In the case of total annual input energy, the maximum amount is obtainable at the maximum values of and . By contrast, the maximum value of is at the minimum values of and .
These different effects of the main design parameters on the amounts of and show the importance of finding an optimum design.
4.3. Optimization Results
To find the best possible design, the GA algorithm has been employed in this study. As was mentioned before, GA finds multiple optimum points when there are multiple objective functions. To choose the best optimum point, especially when the objective function values are in a relatively wide range, decision-making methods such as TOPSIS are usually employed [44]. These methods find the best optimum point by using user-defined objective function weights of importance. It was also discussed in Section 3 that, here, equal importance has been considered for the two objective functions.
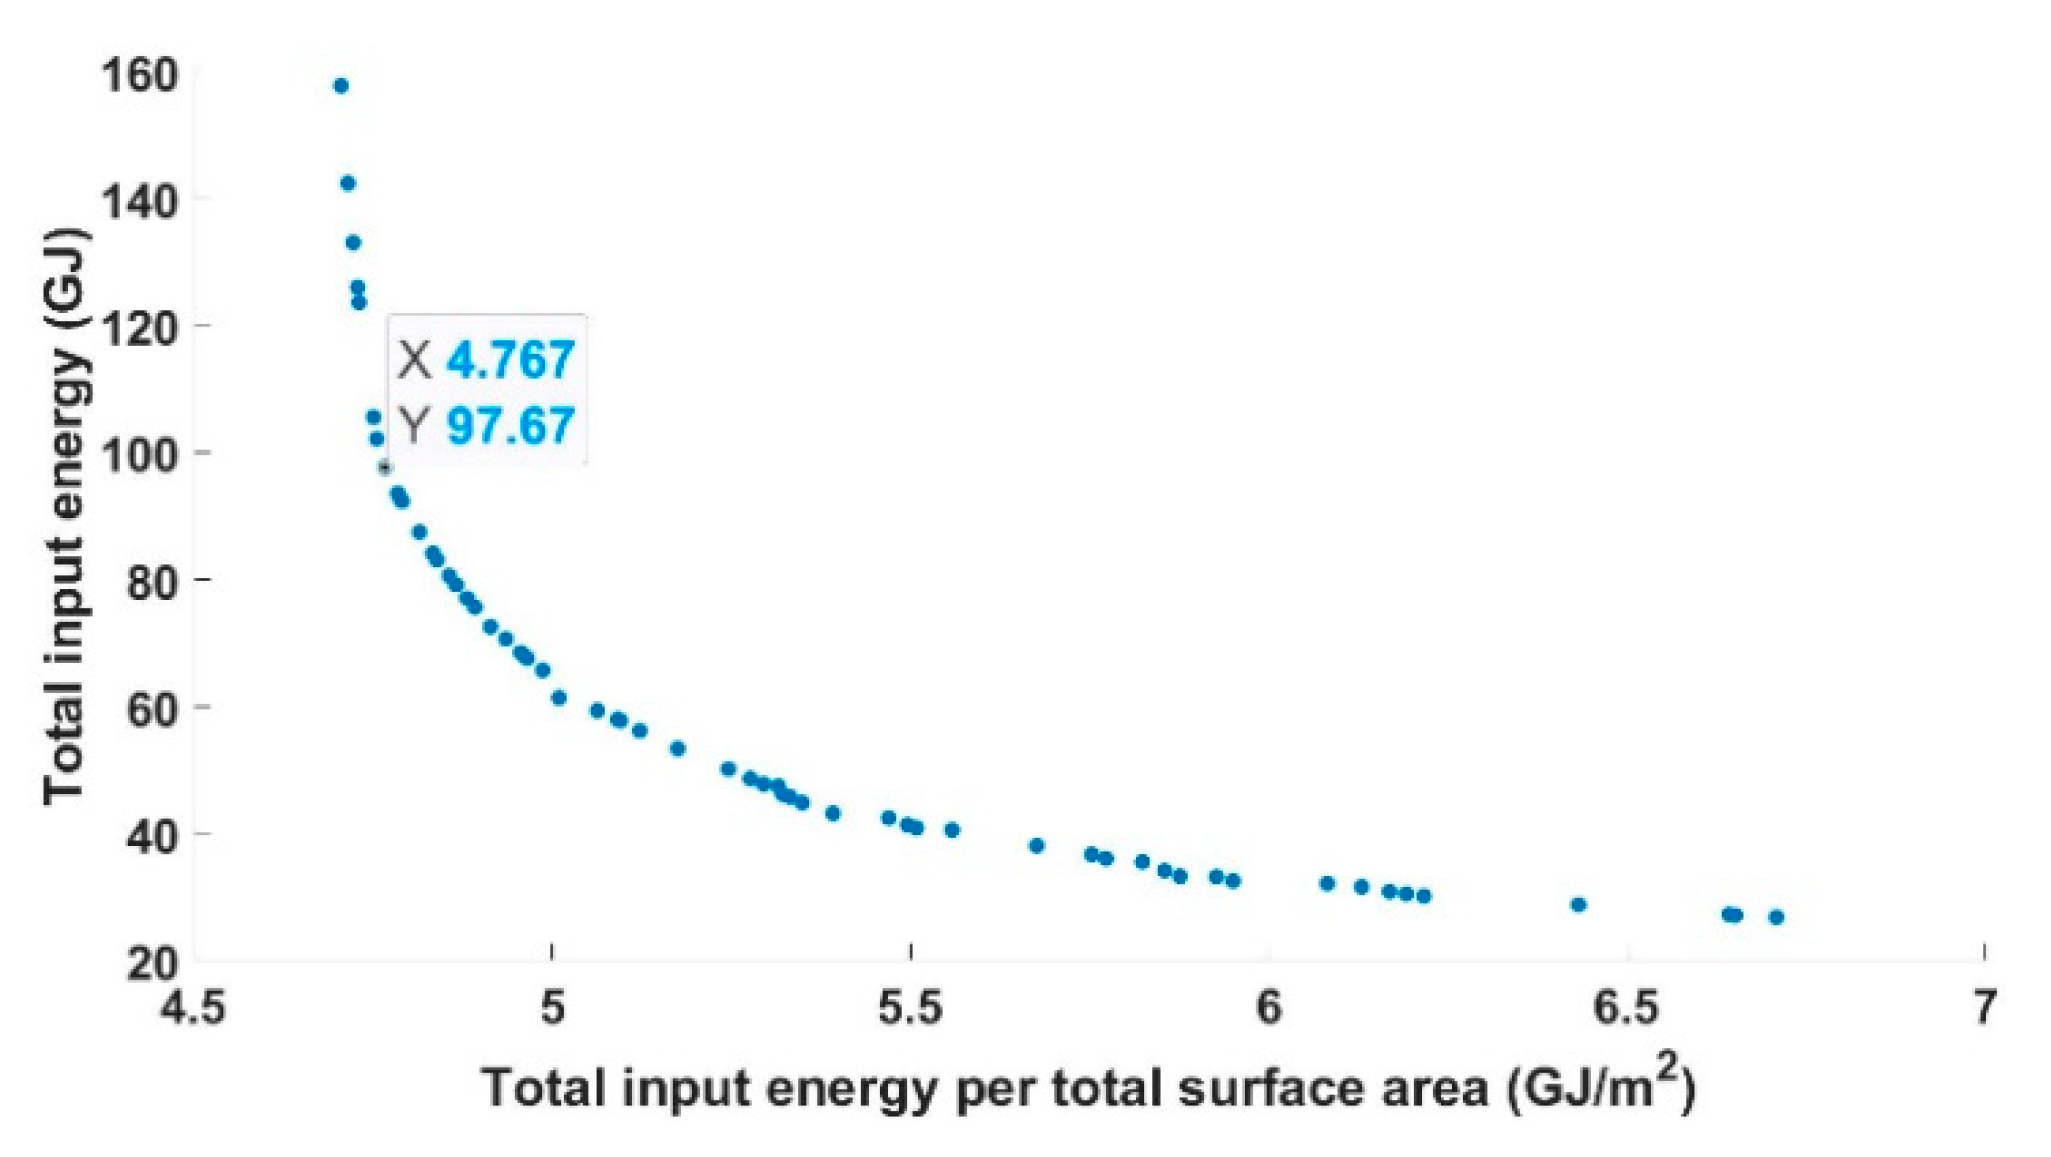
Based on the optimization problem specifications such as the number of the optimization parameters and objective functions, and also the ranges and limitations considered for the optimization parameters, the GA conducted by MATLAB software has offered a total of 60 different optimum configurations. This number of results provides sufficient flexibility for choosing a desirable optimum design and, as there are no other specific preferences for the number of optimum results, the software defaults are accepted here. Figure 14 shows and compares the obtained optimum values of the objective functions.
Figure 14 shows that in the optimum designs found by GA, the total annual energy input () varies between about 20 GJ to 160 GJ and the total input energy per unit of glass cover surface area () varies between about 4.7 GJ/m2 to 6.7 GJ/m2. The changes in are more intense, especially for the large surfaces (the left side of Figure 14). On the other hand, the main changes in the value of is in small-surface cases (right side of Figure 14).
As can be seen from Figure 14, the optimum designs are spread in a relatively wide range, hence the TOPSIS method has been employed to determine the best optimum point. With this regard, an equal importance of 0.5 has been assigned for both objective functions. To avoid any complexity and to follow the main purpose of the paper, this method has not been discussed here. The values of the optimum point chosen by TOPSIS are shown in Figure 14. Table 5 provides detailed specifications of this optimum design.
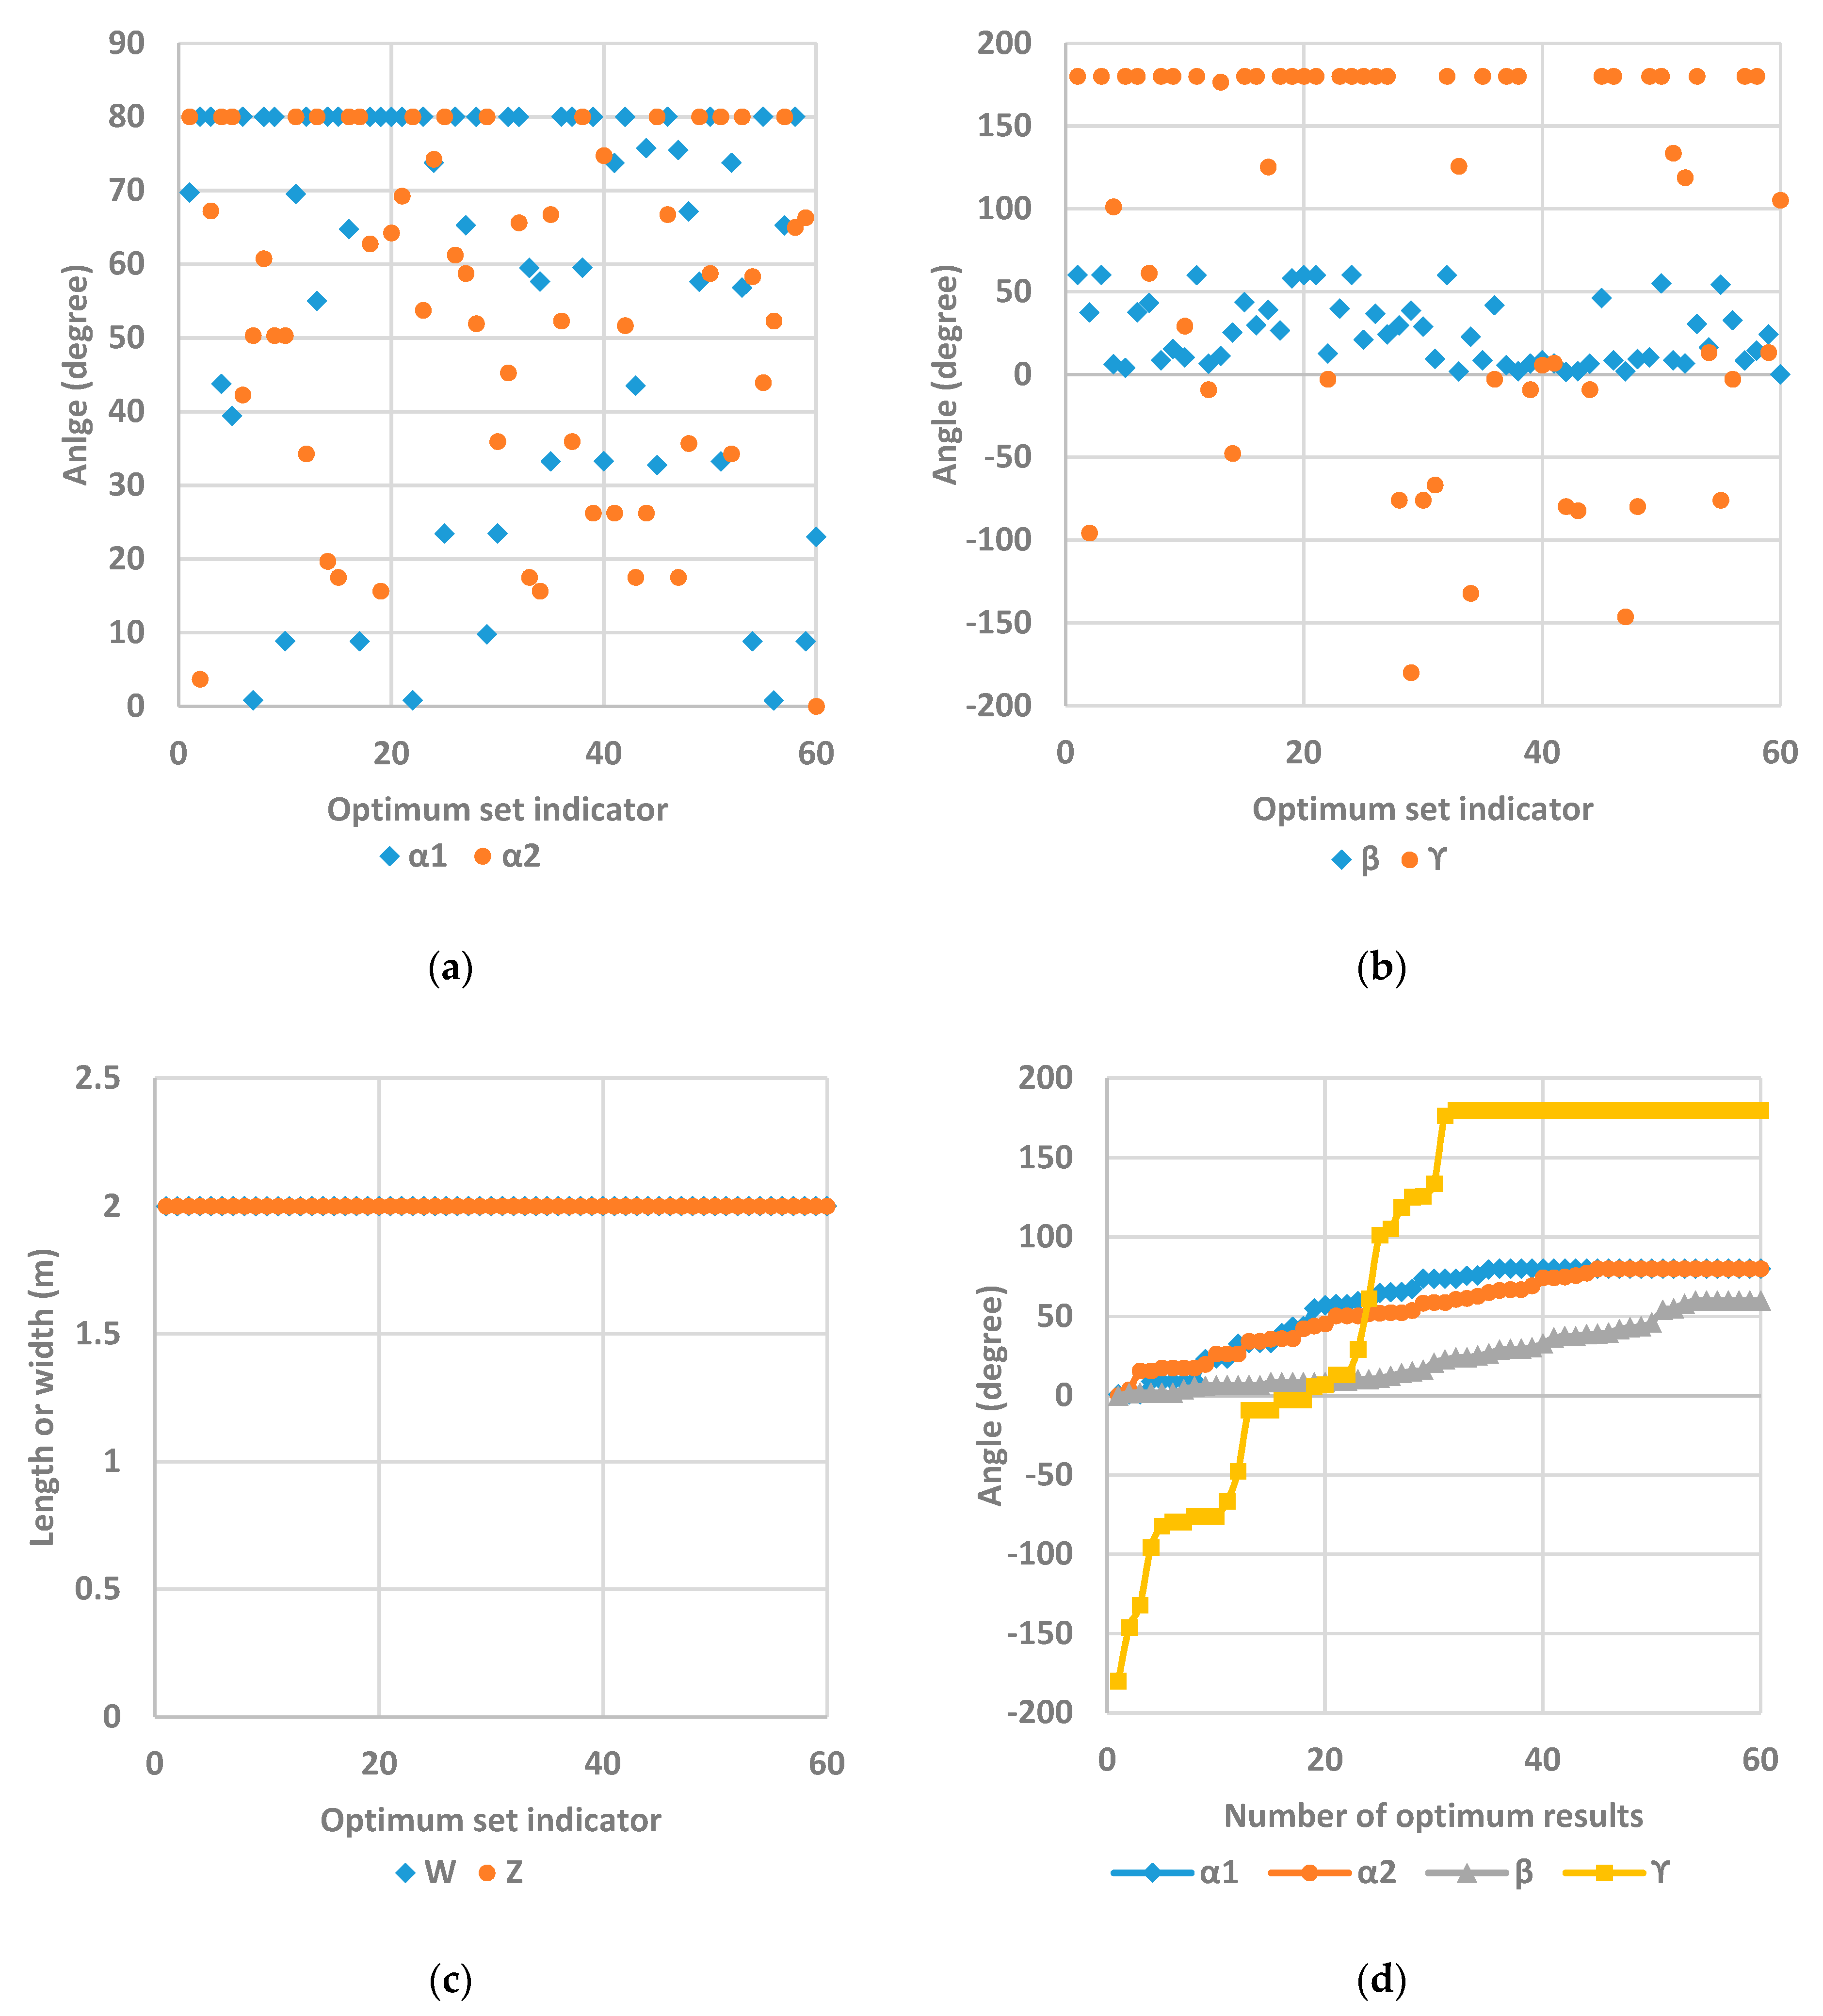
The optimum design suggested in Table 5 is chosen from one of the 60 optimum designs found by GA. A well-known drawback of GA is the probability of the algorithm getting stuck in local optima and consequently not finding the global optima [46]. To verify that such an issue has not occurred for the optimization results presented here, all the 60 obtained optimum designs are analyzed with the help of Figure 15.
Before discussing the results shown in Figure 15, it must be mentioned that the figures a, b, and c represent the actual results with the order obtained during GA calculations. That is, numbers 1 and 60 in the horizontal axis relate to the first and last optimum designs found by GA, respectively. Hence, for the first three figures, the results can be distinguished by the optimum set indicators of 1 to 60. For instance, all the parameter values given in the optimum set indicator of 20 in Figure 15a–c, altogether, represent the 20th optimum design found by GA. However, in Figure 15d, the obtained values of each parameter are individually sorted from the minimum to maximum values, and the values related to the same number in the horizontal axis are not related to one specific optimum design. With the above explanation in mind, Figure 15a,b show that, during calculations, GA has moved around the defined domain very well and there has not been a point from which all the results are close to a specific value. The constant values in Figure 15c, though, do not mean that the GA is stuck in that specific point for the solar still’s length and width. What it means is that only a maximum 2 m length and width will result in optimum values for the objective functions. Such a result is totally reasonable as a 0.2–2 m limit was placed on the basin length and width. If values near 0 m were included the energy input per surface area would have near-infinite values and would possibly be among the final optimum results. However, the minimum length and width of 0.2 m will not significantly increase the amount of energy input per surface area. On the other hand, the total energy input increases with the total surface area which is directly affected by the basin length and width. Therefore, it is reasonable that all the obtained optimum results are at the maximum length and width of 2 m. Figure 15d does not represent any specific optimum design; however, it sorts the obtained optimum angles so that the range of obtained values for each angle can be studied. This figure shows that, for all the four angles, the optimum values are well scattered between the lower and upper limits defined for them. For each parameter, a wide range of values between its limits are present among the optimum results. This means that the GA has effectively covered the whole domain of values for each parameter. The results given in Figure 15, altogether, prove that the GA results are totally reliable and are not presenting local optima.
5. Conclusions
In this paper, a novel modelling method was presented to obtain the total annual amount of solar thermal energy entering a double-slope solar still. To do so, general relations were gathered from the literature and then the main design parameters that can independently affect the energy input were identified. These main parameters were the length and width of the solar still, the tilt angle and azimuth angles of the solar still, and the glass covers’ inclination angle, all shown in Figure 3. By employing geometrical and trigonometry rules, accurate relations were derived to calculate all the other dimensions of the solar still based on the main parameters. Hence, the present model only needs the values for these six main parameters and the local irradiance data to calculate the total annual amount of solar energy entering a double slope solar still.
The modelling method was further employed for sensitivity analysis and optimization using GA and TOPSIS methods. To avoid mathematically possible but physically impossible results, ‘maximum annual energy input to the solar still’ () and ‘maximum annual energy input per total glasses surface area’ () were considered as the two objective functions for optimization. The important outcomes of the paper are reported here briefly.
The sensitivity analysis indicated that increasing the device width is more effective than increasing its length, because the width affects all glass surfaces while the length affects only two of them. For the exact same reason, for the primary dimensions defined for sensitivity analysis, the value of increased with increase in length but decreased with increase in width. On the other hand, the comparison of the two glass covers’ inclination angles showed that these two parameters have similar effects on and .
The sensitivity analysis also showed that the solar still tilt angle is highly effective on the total energy input. However, the device azimuth angle did not suggest significant effects on input energy. By further investigation of the reason for this behavior, it was revealed that the solar still azimuth angle only affects the solar incident angle on the glass covers, and its effect is limited.
Considering that two objective functions were determined, the GA algorithm found 60 optimum configurations, 6 of which were physically impossible because they had width and/or length equal to zero. To find the best optimum result, the TOPSIS method was employed and equal importance was considered for both and . In this case, the specifications of the best optimum point were obtained as follows:
- Solar still: width: 2 m, length: 2 m, tilt angle: 8°, and azimuth angle: 180°
- Glass covers: inclination angle of the glass cover No. 1: 80°, and inclination angle of the glass cover No. 2: 67°
The above-mentioned design leads to 97.67 GJ of total annual solar thermal energy input to the solar still and 4.77 GJ/m2 of that total per total glass cover surface area.
The modelling method presented in this paper is a strong tool for determining the optimum design of double-slope solar stills and predicting their performance for any location and with any arbitrary design.
Author Contributions
Conceptualization, H.Y.; methodology, H.Y. and M.A.; software, M.A.; validation, M.A.; formal analysis, M.A. and B.S.; investigation, M.A.; resources, H.Y. and B.S.; data curation, M.A.; writing—original draft preparation, M.A.; writing—review and editing, B.S. and H.Y.; visualization, M.A.; supervision, B.S. and H.Y.; project administration, H.Y. and M.A; funding acquisition, N/A. All authors have read and agreed to the published version of the manuscript.
Funding
This research received no external funding.
Institutional Review Board Statement
Not applicable.
Informed Consent Statement
Not applicable.
Data Availability Statement
Not applicable.
Conflicts of Interest
The authors declare no conflict of interest.
References
- Lacroix, C.; Perier-Muzet, M.; Stitou, D. Dynamic Modeling and Preliminary Performance Analysis of a New Solar Thermal Reverse Osmosis Desalination Process. Energies 2019, 12, 4015. [Google Scholar] [CrossRef] [Green Version]
- Liponi, A.; Tempesti, C.; Baccioli, A.; Ferrari, L. Small-Scale Desalination Plant Driven by Solar Energy for Isolated Communities. Energies 2020, 13, 3864. [Google Scholar] [CrossRef]
- Akrami, M.; Alsari, H.; Javadi, A.A.; Dibaj, M.; Farmani, R.; Fath, H.E.S.; Salah, A.H.; Negm, A. Analysing the Material Suitability and Concentration Ratio of a Solar-Powered Parabolic trough Collector (PTC) Using Computational Fluid Dynamics. Energies 2020, 13, 5479. [Google Scholar] [CrossRef]
- Tabasi, S.; Aslani, A.; Naaranoja, M.; Yousefi, H. Analysis of energy consumption in Finland based on the selected economics indicators. Int. J. Ambient Energy 2018, 39, 127–131. [Google Scholar] [CrossRef]
- Aramesh, M.; Kasaeian, A.; Pourfayaz, F.; Ahmadi, M.H. A Detailed Investigation of the Walls Shading Effect on the Performance of Solar Ponds. Environ. Prog. Sustain. Energy 2019, 38, e13014. [Google Scholar] [CrossRef]
- Tabasi, S.; Yousefi, H.; Noorollahi, Y.; Aramesh, M. A detailed investigation and performance optimization of a photovoltaic panel integrated with a reflecting mirror. Appl. Therm. Eng. 2019, 160, 114074. [Google Scholar] [CrossRef]
- Aramesh, M.; Shabani, B. On the integration of phase change materials with evacuated tube solar thermal collectors. Renew. Sustain. Energy Rev. 2020, 132, 110135. [Google Scholar] [CrossRef]
- Ghalandari, M.; Maleki, A.; Haghighi, A.; Safdari Shadloo, M.; Alhuyi Nazari, M.; Tlili, I. Applications of nanofluids containing carbon nanotubes in solar energy systems: A review. J. Mol. Liq. 2020, 313, 113476. [Google Scholar] [CrossRef]
- Kasaeian, A.; Tabasi, S.; Ghaderian, J.; Yousefi, H. A review on parabolic trough/Fresnel based photovoltaic thermal systems. Renew. Sustain. Energy Rev. 2018, 91, 193–204. [Google Scholar] [CrossRef]
- Aramesh, M.; Pourfayaz, F.; Haghir, M.; Kasaeian, A.; Ahmadi, M.H. Investigating the effect of using nanofluids on the performance of a double-effect absorption refrigeration cycle combined with a solar collector. Proc. Inst. Mech. Eng. Part A J. Power Energy 2019, 234, 981–993. [Google Scholar] [CrossRef]
- Ullah, I.; Rasul, M. Recent Developments in Solar Thermal Desalination Technologies: A Review. Energies 2018, 12, 119. [Google Scholar] [CrossRef] [Green Version]
- Velázquez-Limón, N.; López-Zavala, R.; Hernández-Callejo, L.; Aguilar-Jiménez, J.A.; Ojeda-Benítez, S.; Ríos-Arriola, J. Study of a Hybrid Solar Absorption-Cooling and Flash-Desalination System. Energies 2020, 13, 3943. [Google Scholar] [CrossRef]
- Sharshir, S.W.; Kandeal, A.W.; Ismail, M.; Abdelaziz, G.B.; Kabeel, A.E.; Yang, N. Augmentation of a pyramid solar still performance using evacuated tubes and nanofluid: Experimental approach. Appl. Therm. Eng. 2019, 160, 113997. [Google Scholar] [CrossRef]
- Roca, L.; Sánchez, J.; Rodríguez, F.; Bonilla, J.; de la Calle, A.; Berenguel, M. Predictive Control Applied to a Solar Desalination Plant Connected to a Greenhouse with Daily Variation of Irrigation Water Demand. Energies 2016, 9, 194. [Google Scholar] [CrossRef] [Green Version]
- Sharshir, S.W.; Abd Elaziz, M.; Elkadeem, M.R. Enhancing thermal performance and modeling prediction of developed pyramid solar still utilizing a modified random vector functional link. Sol. Energy 2020, 198, 399–409. [Google Scholar] [CrossRef]
- Afrand, M.; Kalbasi, R.; Karimipour, A.; Wongwises, S. Experimental Investigation on a Thermal Model for a Basin Solar Still with an External Reflector. Energies 2016, 10, 18. [Google Scholar] [CrossRef]
- Abdullah, A.S.; Essa, F.A.; Bacha, H.B.; Omara, Z.M. Improving the trays solar still performance using reflectors and phase change material with nanoparticles. J. Energy Storage 2020, 31, 101744. [Google Scholar] [CrossRef]
- Safaei, M.R.; Goshayeshi, H.R.; Chaer, I. Solar Still Efficiency Enhancement by Using Graphene Oxide/Paraffin Nano-PCM. Energies 2019, 12, 2002. [Google Scholar] [CrossRef] [Green Version]
- Parsa, S.M.; Rahbar, A.; Koleini, M.H.; Aberoumand, S.; Afrand, M.; Amidpour, M. A renewable energy-driven thermoelectric-utilized solar still with external condenser loaded by silver/nanofluid for simultaneously water disinfection and desalination. Desalination 2020, 480, 114354. [Google Scholar] [CrossRef]
- Parsa, S.M.; Rahbar, A.; Koleini, M.H.; Davoud Javadi, Y.; Afrand, M.; Rostami, S.; Amidpour, M. First approach on nanofluid-based solar still in high altitude for water desalination and solar water disinfection (SODIS). Desalination 2020, 491. [Google Scholar] [CrossRef]
- Thalib, M.M.; Manokar, A.M.; Essa, F.A.; Vasimalai, N.; Sathyamurthy, R.; Garcia Marquez, F.P. Comparative Study of Tubular Solar Stills with Phase Change Material and Nano-Enhanced Phase Change Material. Energies 2020, 13, 3989. [Google Scholar] [CrossRef]
- Danish, S.; El-Leathy, A.; Alata, M.; Al-Ansary, H. Enhancing Solar Still Performance Using Vacuum Pump and Geothermal Energy. Energies 2019, 12, 539. [Google Scholar] [CrossRef] [Green Version]
- Essa, F.A.; Abd Elaziz, M.; Elsheikh, A.H. An enhanced productivity prediction model of active solar still using artificial neural network and Harris Hawks optimizer. Appl. Therm. Eng. 2020, 170, 115020. [Google Scholar] [CrossRef]
- Pal, P.; Dev, R.; Singh, D.; Ahsan, A. Energy matrices, exergoeconomic and enviroeconomic analysis of modified multi-wick basin type double slope solar still. Desalination 2018, 447, 55–73. [Google Scholar] [CrossRef]
- Rubio, E.; Fernández, J.L.; Porta-Gándara, M.A. Modeling thermal asymmetries in double slope solar stills. Renew. Energy 2004, 29, 895–906. [Google Scholar] [CrossRef]
- Sahota, L.; Tiwari, G.N. Effect of Al2O3 nanoparticles on the performance of passive double slope solar still. Sol. Energy 2016, 130, 260–272. [Google Scholar] [CrossRef]
- Dwivedi, V.K.; Tiwari, G.N. Experimental validation of thermal model of a double slope active solar still under natural circulation mode. Desalination 2010, 250, 49–55. [Google Scholar] [CrossRef]
- El-Maghlany, W.M. An approach to optimization of double slope solar still geometry for maximum collected solar energy. Alex. Eng. J. 2015, 54, 823–828. [Google Scholar] [CrossRef] [Green Version]
- Gaur, M.; Tiwari, G. Optimization of number of collectors for integrated PV/T hybrid active solar still. Appl. Energy 2010, 87, 1763–1772. [Google Scholar] [CrossRef]
- Rashidi, S.; Bovand, M.; Rahbar, N.; Esfahani, J.A. Steps optimization and productivity enhancement in a nanofluid cascade solar still. Renew. Energy 2018, 118, 536–545. [Google Scholar] [CrossRef]
- Ahmed, A.M.; Ahmed, A.H.; Daoud, R.W.; Ahmed, O.K. Optimization of Simple Solar Still Performance Using Fuzzy Logic Control. In Proceedings of the 2020 6th International Engineering Conference “Sustainable Technology and Developmen (IEC)”, Erbil, Iraq, 26–27 February 2020; pp. 205–210. [Google Scholar]
- Peter, J.N.; Kanyarusoke, K.E. Design optimisation of pillar-mounted sun tracking solar-water purifiers for large households. In Proceedings of the 2019 International Conference on the Domestic Use of Energy (DUE), Wellington, South Africa, 25–27 March 2019; pp. 169–175. [Google Scholar]
- Altarawneh, I.; Rawadieh, S.; Batiha, M.; Al-Makhadmeh, L.; Alrowwad, S.; Tarawneh, M. Experimental and numerical performance analysis and optimization of single slope, double slope and pyramidal shaped solar stills. Desalination 2017, 423, 124–134. [Google Scholar] [CrossRef]
- Rehman, N.U. Optical-irradiance ray-tracing model for the performance analysis and optimization of a single slope solar still. Desalination 2019, 457, 22–31. [Google Scholar] [CrossRef]
- Khanmohammadi, S.; Khanmohammadi, S. Energy, exergy and exergo-environment analyses, and tri-objective optimization of a solar still desalination with different insulations. Energy 2019, 187, 115988. [Google Scholar] [CrossRef]
- Malik, M.Z.; Musharavati, F.; Khanmohammadi, S.; Khanmohammadi, S.; Nguyen, D.D. Solar still desalination system equipped with paraffin as phase change material: Exergoeconomic analysis and multi-objective optimization. Environ. Sci. Pollut. Res. 2020, 28, 220–234. [Google Scholar] [CrossRef] [PubMed]
- El-Sebaey, M.S.; Ellman, A.; Hegazy, A.; Ghonim, T. Experimental Analysis and CFD Modeling for Conventional Basin-Type Solar Still. Energies 2020, 13, 5734. [CrossRef]
- Kabeel, A.E.; Sathyamurthy, R.; Sharshir, S.W.; Muthumanokar, A.; Panchal, H.; Prakash, N.; Prasad, C.; Nandakumar, S.; El Kady, M.S. Effect of water depth on a novel absorber plate of pyramid solar still coated with TiO2 nano black paint. J. Clean. Prod. 2019, 213, 185–191. [Google Scholar] [CrossRef]
- Samuel Hansen, R.; Kalidasa Murugavel, K. Enhancement of integrated solar still using different new absorber configurations: An experimental approach. Desalination 2017, 422, 59–67. [Google Scholar] [CrossRef]
- Murugavel, K.K.; Srithar, K. Performance study on basin type double slope solar still with different wick materials and minimum mass of water. Renew. Energy 2011, 36, 612–620. [Google Scholar] [CrossRef]
- Kalogirou, S.A. Solar Energy Engineering: Processes and Systems; Elsevier Science: Amsterdam, The Netherlands, 2013. [Google Scholar]
- John, A.; Duffie, W.A.B. Solar Engineering of Thermal Processes, 4th ed.; Wiley: New York, NY, USA, 2013; p. 936. [Google Scholar]
- Aramesh, M.; Kasaeian, A.; Pourfayaz, F.; Wen, D. Energy analysis and shadow modeling of a rectangular type salt gradient solar pond. Sol. Energy 2017, 146, 161–171. [Google Scholar] [CrossRef]
- Nazari, M.A.; Haj Assad, M.E.; Haghighat, S.; Maleki, A. Applying TOPSIS Method for Wind Farm Site Selection in Iran. In Proceedings of the 2020 Advances in Science and Engineering Technology International Conferences (ASET), Dubai, UAE, 4 February–9 April 2020; pp. 1–4. [Google Scholar]
- Mirjalili, S. Genetic algorithm. In Evolutionary Algorithms and Neural Networks; Springer: Berlin/Heidelberg, Germany, 2019; pp. 43–55. [Google Scholar]
- Welikala, S.; Cassandras, C.G. Distributed Non-Convex Optimization of Multi-Agent Systems Using Boosting Functions to Escape Local Optima. IEEE Trans. Autom. Control 2020, 1. [Google Scholar] [CrossRef]
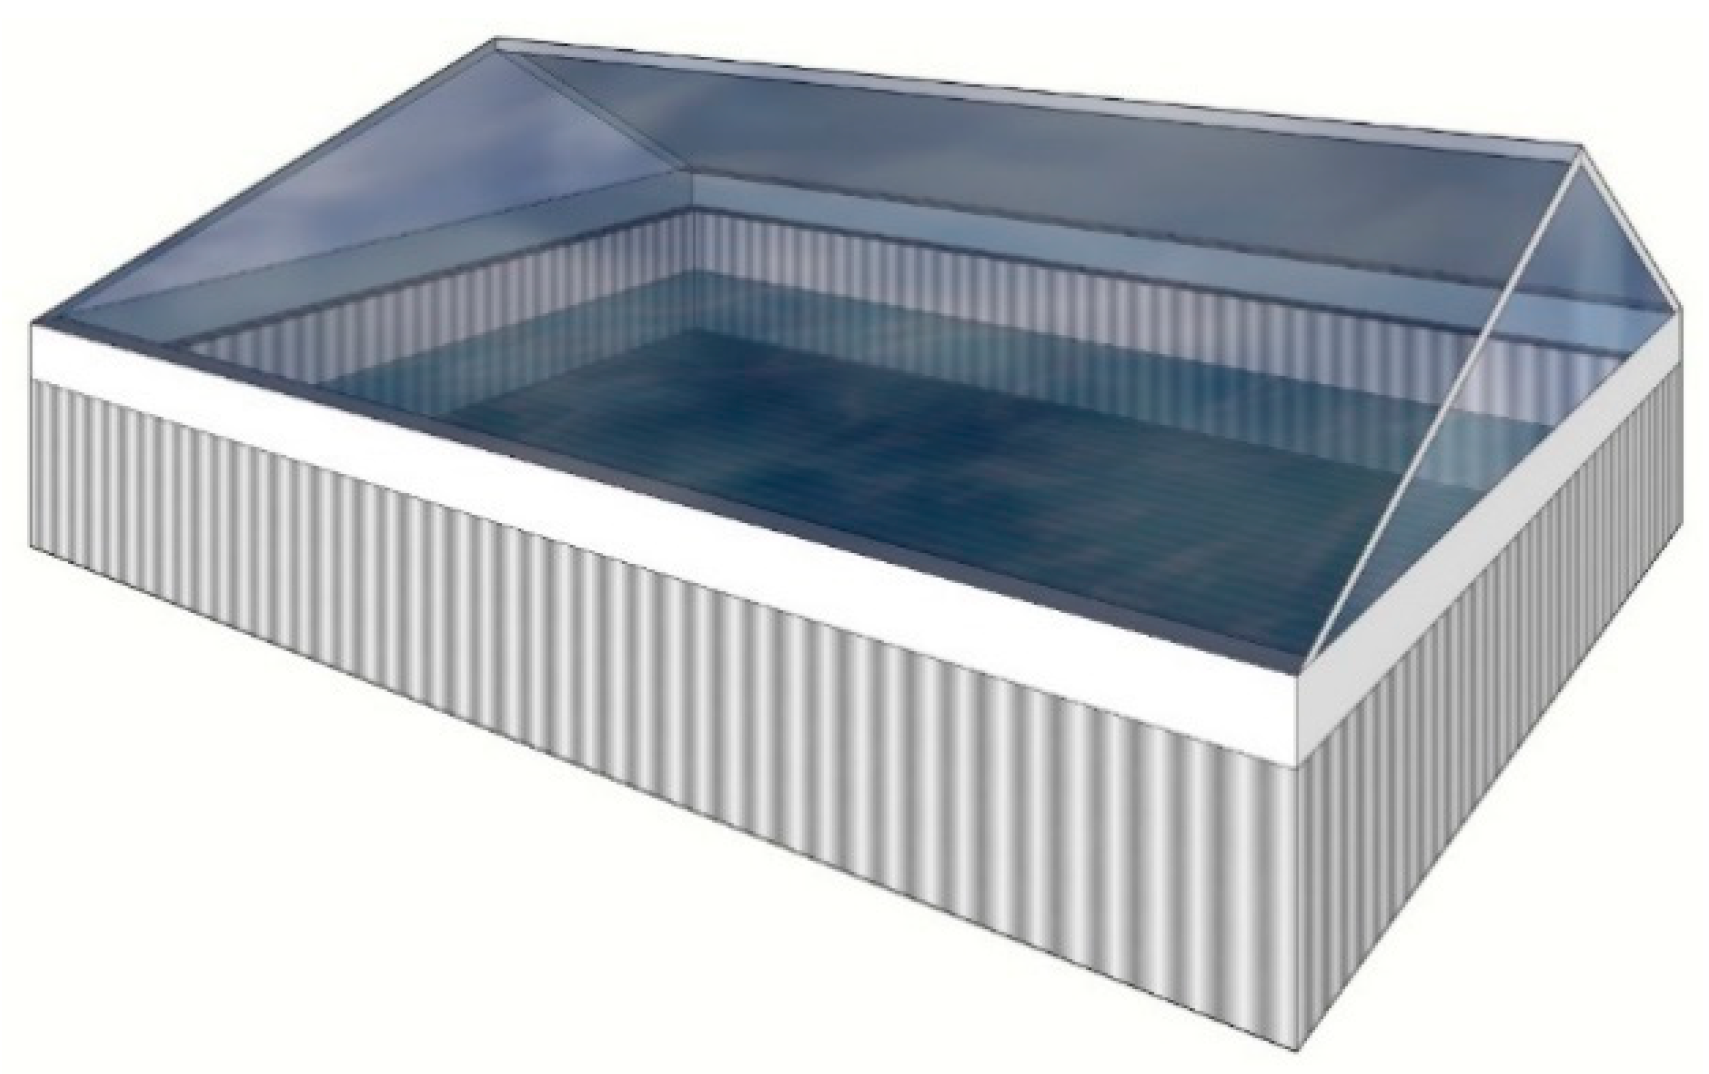
Figure 1.
3D schematics of a double-slope solar still.

Figure 2.
Definition of a surface azimuth and tilt angles.

Figure 3.
(a) Definition of the glass faces and surface azimuth and tilt angles of the body of a double-slope solar still. (b) Dimensions of a double-slope solar still.
Figure 3.
(a) Definition of the glass faces and surface azimuth and tilt angles of the body of a double-slope solar still. (b) Dimensions of a double-slope solar still.
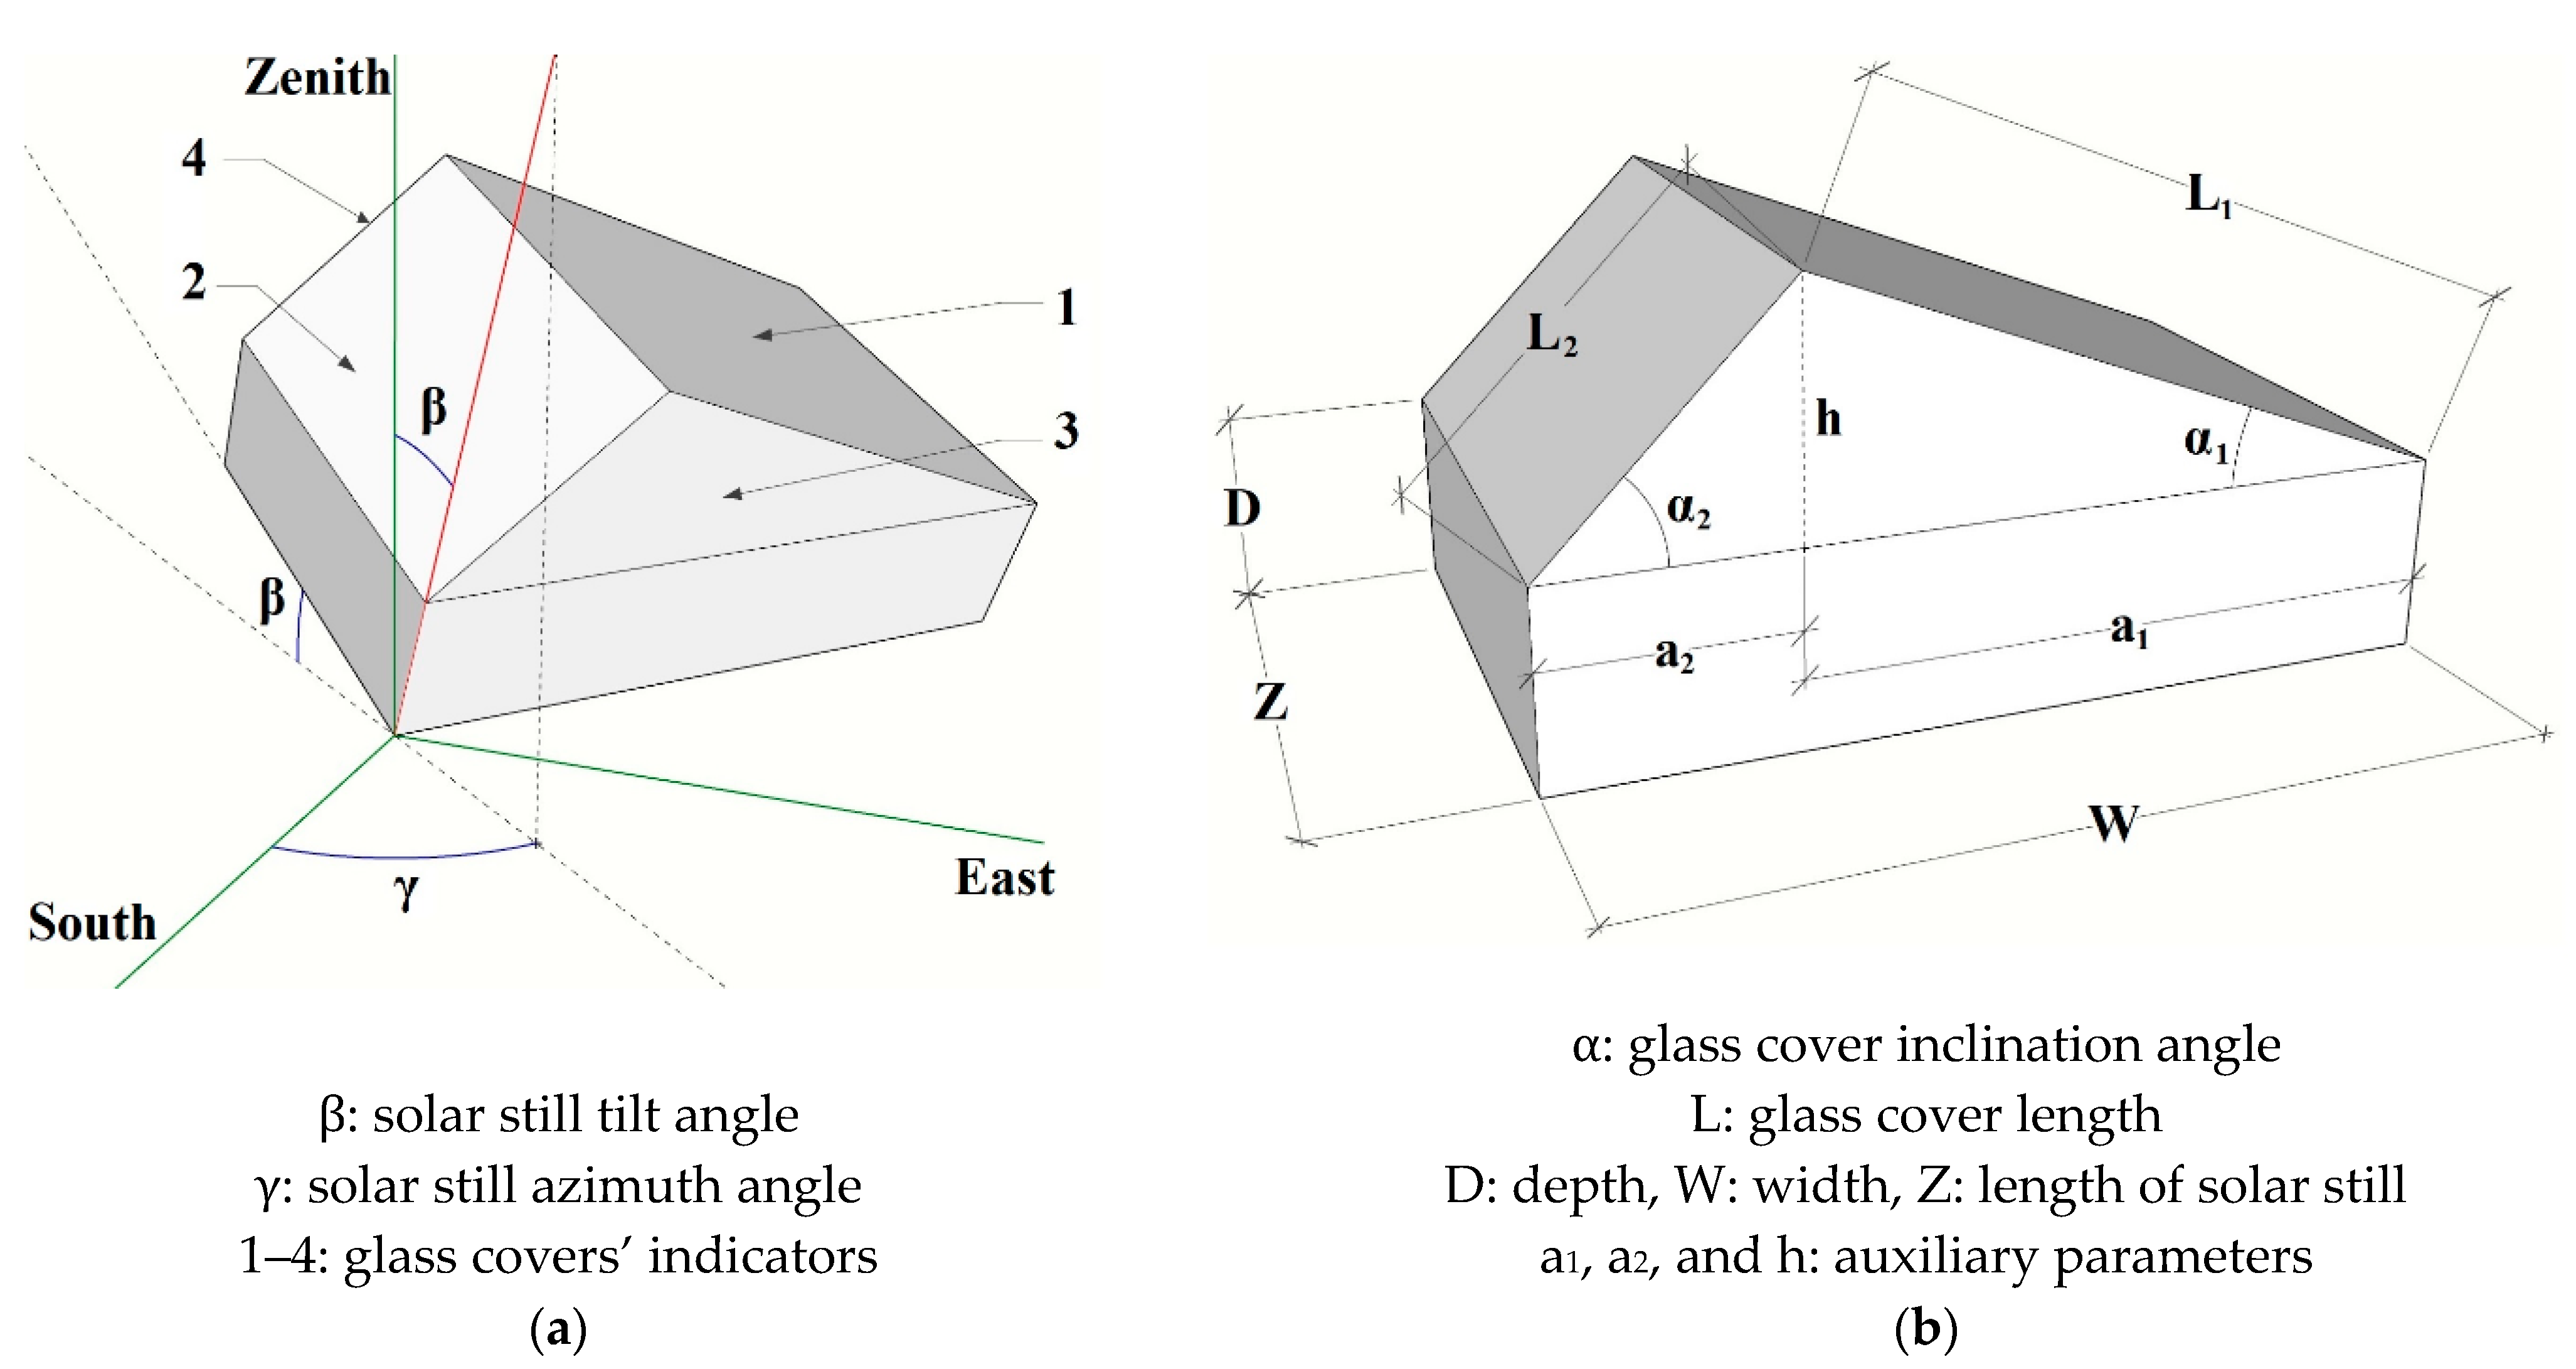
Figure 4.
(a) Side view of a not-inclined double-slope solar still and definition of auxiliary parameters. (b) Front view of a tilted double-slope solar still and definition of required auxiliary parameters.
Figure 4.
(a) Side view of a not-inclined double-slope solar still and definition of auxiliary parameters. (b) Front view of a tilted double-slope solar still and definition of required auxiliary parameters.

Figure 5.
(a) 3D view of a double-slope solar still with the defined auxiliary parameters. (b) Auxiliary parameters for calculation of glass cover surface azimuth angle.
Figure 5.
(a) 3D view of a double-slope solar still with the defined auxiliary parameters. (b) Auxiliary parameters for calculation of glass cover surface azimuth angle.

Figure 6.
Model validation by comparison of the calculated annual energy input per glass cover surface area with the results reported by El-Maghlany [28]; (a) comparison of actual values, (b) difference between the values.
Figure 6.
Model validation by comparison of the calculated annual energy input per glass cover surface area with the results reported by El-Maghlany [28]; (a) comparison of actual values, (b) difference between the values.

Figure 7.
Sensitivity of and to (a) basin width () and (b) basin length (). Other design parameters are considered as given in Table 4.
Figure 7.
Sensitivity of and to (a) basin width () and (b) basin length (). Other design parameters are considered as given in Table 4.

Figure 8.
Sensitivity of (a) and (b) , to basin length and width (). Other design parameters are considered as given in Table 4.
Figure 8.
Sensitivity of (a) and (b) , to basin length and width (). Other design parameters are considered as given in Table 4.

Figure 9.
Sensitivity of and to the basin (a) tilt angle () and (b) azimuth angle (). Other design parameters are considered as given in Table 4.
Figure 9.
Sensitivity of and to the basin (a) tilt angle () and (b) azimuth angle (). Other design parameters are considered as given in Table 4.

Figure 10.
Sensitivity of (a) and (b) , to the basin tilt and azimuth angles ( & ). Other design parameters are considered as given in Table 4.
Figure 10.
Sensitivity of (a) and (b) , to the basin tilt and azimuth angles ( & ). Other design parameters are considered as given in Table 4.

Figure 11.
Sensitivity of glass covers’ incident angle to the solar still azimuth angle (). Other design parameters are considered as given in Table 4.
Figure 11.
Sensitivity of glass covers’ incident angle to the solar still azimuth angle (). Other design parameters are considered as given in Table 4.
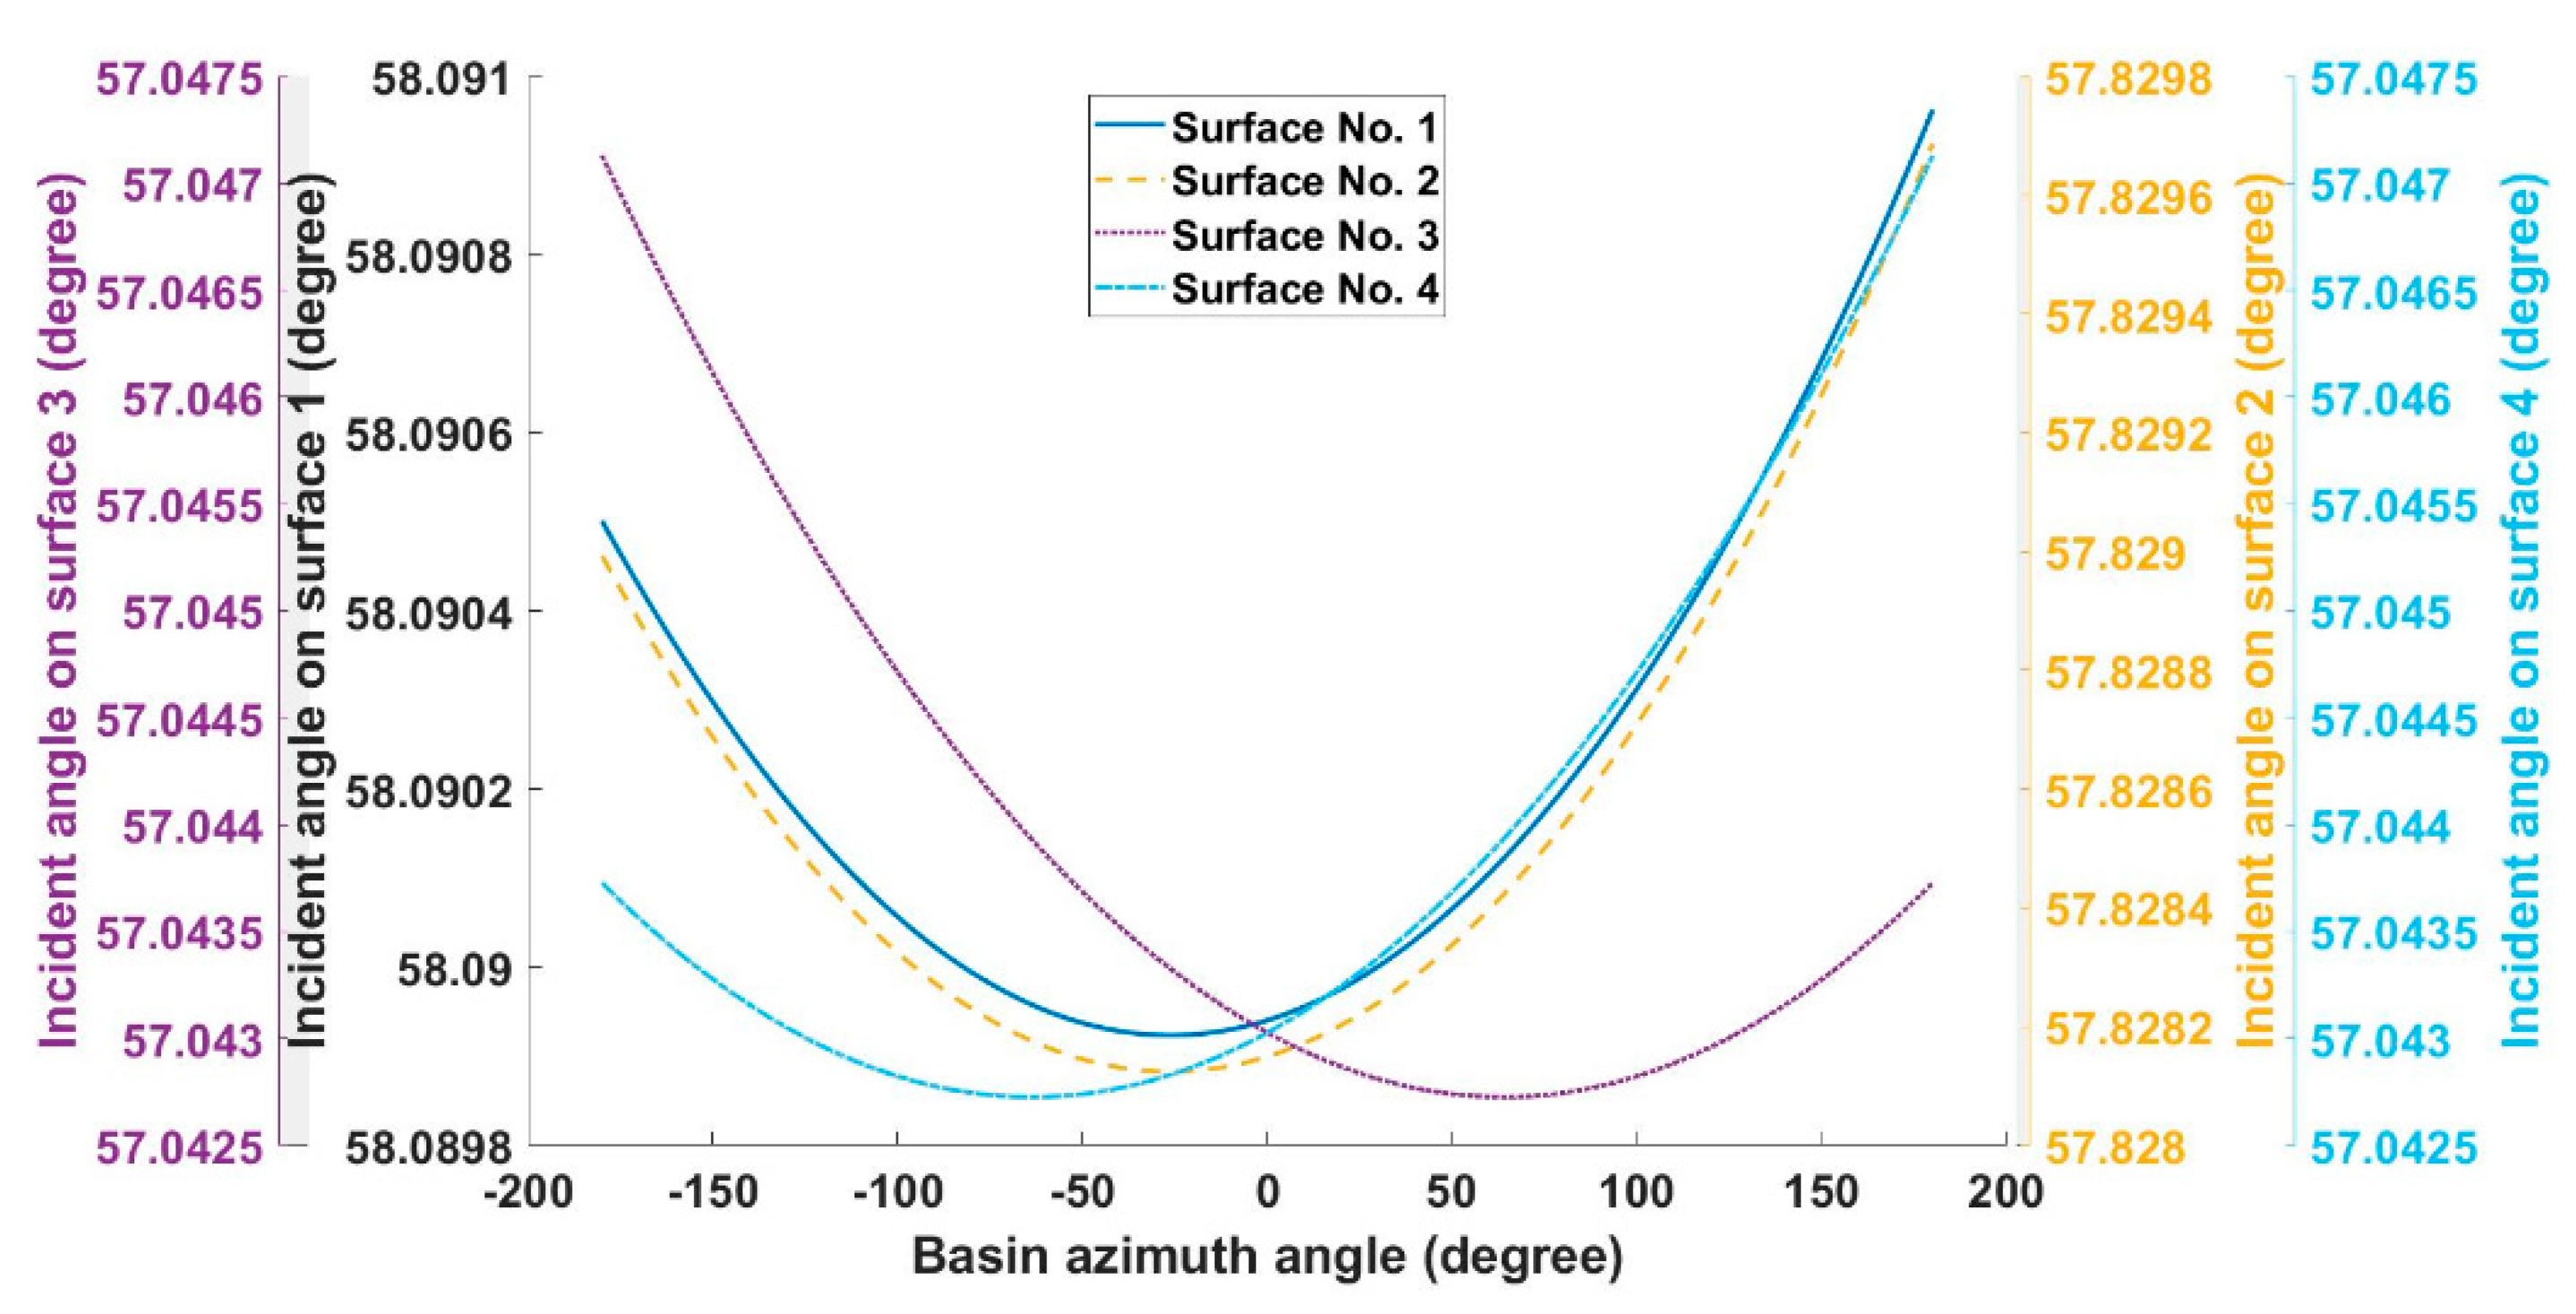
Figure 12.
Sensitivity of and to the inclination angle of the glass cover (a) No. 1 () and (b) No. 2 (). Other design parameters are considered as given in Table 4.
Figure 12.
Sensitivity of and to the inclination angle of the glass cover (a) No. 1 () and (b) No. 2 (). Other design parameters are considered as given in Table 4.

Figure 13.
Sensitivity of (a) and (b) , to the inclination angles of the glasses No. 1 and No. 2 (). Other design parameters are considered as given in Table 4.
Figure 13.
Sensitivity of (a) and (b) , to the inclination angles of the glasses No. 1 and No. 2 (). Other design parameters are considered as given in Table 4.

Figure 14.
Pareto front of the objective functions.

Figure 15.
Distribution of optimum values obtained by Genetic Algorithm (GA) for the optimization parameters of (a) the glass covers’ inclination angle, (b) the solar still tilt and azimuth angles, (c) solar still length and width, (d) the glass covers’ inclination angle and the solar still tilt and azimuth angles, each sorted from the minimum to maximum obtained values.

Table 1.
Comparison of the present study with the literature.
| Ref. | Solar Still Type | Solar Input Model | Considered Geometrical Parameters | Outcomes |
|---|---|---|---|---|
| [30] | Cascade single-slope | Simulation software | Cascade steps length and height | Optimized freshwater output |
| [35] | Cascade single-slope | Irradiance times surface area | The distance between the absorber plate and the cover | Optimized costs and exergy |
| [36] | Cascade single-slope | Irradiance times surface area | The distance between the absorber plate and the cover | Optimized costs and exergy |
| [37] | Single-slope | Irradiance times surface area | Simulation of a specific design | Simulation of temperature profile inside solar still |
| [32] | Single-slope | Irradiance times surface area | No geometrical parameters, employed a tracking system | Optimized freshwater output |
| [29] | Single-slope | Irradiance times surface area | No geometrical parameters | Optimized freshwater output |
| [31] | Single-slope | Irradiance times surface area | No geometrical parameters | Optimized freshwater output |
| [33] | single-slope, double-slope, and pyramidal | Irradiance times surface area | No geometrical parameters | Optimized freshwater output |
| [34] | Single-slope | Derived relations | Glass cover angle and the ratio of basin area to the cover angle | Optimized solar energy input |
| [28] | Double-slope | Derived relations | Glass covers’ angle | New modelling method for and optimization of solar energy input |
| Present study | Double-slope | Derived relations | All the individually effective geometrical parameters | New modelling method and optimized solar energy input |
Table 2.
Specification of the double-slope solar still, studied by El-Maghlany [28].
Table 2.
Specification of the double-slope solar still, studied by El-Maghlany [28].
| Parameter | Value |
|---|---|
| Basin tilt angle () | 0° |
| Glass No. 1 azimuth angle () | 0°, 45°, and 90° |
| Glass No. 2 azimuth angle () | 180°, −135°, and −90° |
| Latitude | 24° |
Table 3.
Validation of the presented model.
| Design Conditions | |||
|---|---|---|---|
| Optimum (ref. [28]) | 25 | 10 | 20 |
| Optimum (model) | 26.11 | 10.28 | 19.13 |
| Model error for | 4.44% | 2.80% | 4.35% |
| Optimum (ref. [28]) | 10 | 10 | 10 |
| Optimum (model) | 10.38 | 10.31 | 10.42 |
| Model error for | 3.80% | 3.10% | 4.2% |
| Optimum energy input (ref. [28]) | 6.21 GJ/m2 | 6.49 GJ/m2 | 6.30 GJ/m2 |
| Optimum energy input (model) | 6.28 GJ/m2 | 6.41 GJ/m2 | 6.32 GJ/m2 |
| Model error for input energy | 1.01% | 1.38% | 3.66% |
Table 4.
Primary design defined for sensitivity analysis.
| Parameter | Value |
|---|---|
| Basin width () | 1 m |
| Basin length () | 2 m |
| Basin tilt angle () | 0° |
| Basin azimuth angle () | 90° |
| Inclination angle of the glass cover No. 1 () | 30° |
| Inclination angle of the glass cover No. 2 () | 45° |
Table 5.
The specifications of the optimum point chosen by TOPSIS method.
| Parameter | Value |
|---|---|
| Basin width (W) | 2 m |
| Basin length () | 2 m |
| Basin tilt angle () | 8.44° |
| Basin azimuth angle () | 180° |
| Inclination angle of the glass cover No. 1 () | 80° |
| Inclination angle of the glass cover No. 2 () | 66.75° |
| Total annual input energy () | 97.67 GJ |
| Total annual input energy per total glass cover surface area () | 4.77 GJ/m2 |
Publisher’s Note: MDPI stays neutral with regard to jurisdictional claims in published maps and institutional affiliations. |
© 2021 by the authors. Licensee MDPI, Basel, Switzerland. This article is an open access article distributed under the terms and conditions of the Creative Commons Attribution (CC BY) license (http://creativecommons.org/licenses/by/4.0/).
Share and Cite
MDPI and ACS Style
Yousefi, H.; Aramesh, M.; Shabani, B. Design Parameters of a Double-Slope Solar Still: Modelling, Sensitivity Analysis, and Optimization. Energies 2021, 14, 480. https://doi.org/10.3390/en14020480
AMA Style
Yousefi H, Aramesh M, Shabani B. Design Parameters of a Double-Slope Solar Still: Modelling, Sensitivity Analysis, and Optimization. Energies. 2021; 14(2):480. https://doi.org/10.3390/en14020480
Chicago/Turabian StyleYousefi, Hossein, Mohamad Aramesh, and Bahman Shabani. 2021. "Design Parameters of a Double-Slope Solar Still: Modelling, Sensitivity Analysis, and Optimization" Energies 14, no. 2: 480. https://doi.org/10.3390/en14020480
Note that from the first issue of 2016, this journal uses article numbers instead of page numbers. See further details here.