Article

Assessment of Sinkhole Hazard in the Area of Shallow Mining Workings Using Electrical Resistivity Tomography

Faculty of Mining, Safety Engineering and Industrial Automation, Silesian University of Technology, ul. Akademicka 2a, 44-100 Gliwice, Poland
*
Author to whom correspondence should be addressed.
Energies 2021, 14(24), 8197; https://doi.org/10.3390/en14248197
Submission received: 30 October 2021 / Revised: 22 November 2021 / Accepted: 30 November 2021 / Published: 7 December 2021

Abstract

:
This paper presents the results of investigating shallow rock mass layers with the use of electrical resistivity tomography. The aim of the study was to assess the condition of near-surface rock mass layers located above shallow mining workings of a historical mine in view of the possibility of the occurrence of loose zones or possible voids that could pose a sinkhole hazard for the surface. The study was carried out under the conditions of the “Sztygarka” Training Mine and Museum in Dąbrowa Górnicza City (Upper Silesian Coal Basin, Poland), where discontinuous surface deformations occurred in the past in the form of sinkholes. The study and its interpretation indicate the existence of a sinkhole hazard due to the ongoing processes of the transformation of the near-surface rock mass layers above the shallow workings of a historical mine.

1. Introduction

The transformation processes, ongoing around the world and especially in Europe towards a modern zero-carbon economy, are leading to a reduction in the fossil fuel exploitation in the mining industry. It should be taken into account that the termination of mining operations, in particular those of underground mines, does not entirely eliminate the problem of the impact of the excavations of an inactive mine on the rock mass and, in consequence, on the surface [1,2,3,4,5]. Although the problem of the continuous deformations related to the direct impact of the current exploitation disappears relatively quickly [6,7,8], one of the possible long-term dangers is the discontinuous deformation hazard, which may take the form of linear deformations (ground steps, fissures) [9,10] or surface deformations (sinkholes—Figure 1) [2,11,12,13]. The sinkhole hazard is a very serious problem in post-mining areas [12,13,14,15], especially highly urbanised ones.
The objective of this study was to determine the sinkhole creation hazard due to the existence of the shallow underground workings of the historical industrial objects of former training mine presently open to the public as touristic attractions. In the past, a few sinkholes formed on the surface in this area, so it was important from a public safety point of view to assess the present state of the hazard in a way that would be non-destructive for the elements of surface urban development.
The problem is significant because this hazard, in the case of non-liquidated shallow workings, may exist for many decades after the end of exploitation [3,4,12].
The formation of discontinuous deformations on the surface may be caused by many factors, which include [2,16]:
  • Anthropogenic factors related to human activity, mainly concerning the operation of mining works.
  • Natural factors related to natural processes occurring in the rock mass, such as tectonic movements, landslide movements, karst phenomena, erosion processes, etc.
The most important causes of sinkholes on the surface include:
  • The exploitation of deposits at shallow depths, especially with caving. Under the conditions of the Upper Silesian Coal Basin, a depth of 100 m is defined as a safe limit due to the possibility of sinkholes forming on the surface.
  • The activation of voids in the rock mass, e.g., inadequately liquidated shallow galleries and chamber workings or shafts [17,18,19,20,21,22].
  • Changes in hydrogeological and geotechnical conditions caused, for example, by mechanical scouring, resulting in the formation of voids in the rock mass [23].
  • The reactivation of shallow old gobs due to, e.g., drainage, additional surface loads—especially dynamic ones, mining works, seismic phenomena, etc.
  • Fires in the remnants of seams deposited at shallow depths [24].
Bearing in mind the above-mentioned conditions, it should be stated that the recognition of the rock mass’ condition in the area of old shallow mining exploitation is very important in terms of the occurrence of old shallow non-liquidated galleries and zones of loose rock mass layers created as a direct result of the mining works [1].
The most precise method of ascertaining the existence of a void or a loose zone is drilling testing boreholes from the surface [3,12,15]. However, this method involves the degradation of the drilling site, is expensive to conduct, and can only be conducted locally, which excludes a comprehensive hazard identification.
Therefore, the geophysical methods [25,26,27,28,29,30,31,32] are used during the preliminary hazard identification, which allow for an approximate assessment of the rock mass structure in its near-surface layers in a non-destructive manner. Such a preliminary interpretation of the hazard makes it possible, for example, to identify areas particularly at risk, where drilling should be carried out, and if a cavity is found, the hazard should subsequently be eliminated via filling.
In this study, the electrical resistivity tomography was used to assess the condition of the rock mass above the shallow mine workings due to the possibility of the occurrence of a sinkhole hazard on the surface.

2. Material and Methods

2.1. Area of Study

The study was carried out in the area of the currently inactive old “Sztygarka” Training Mine–Museum in the city of Dąbrowa Górnicza [16,33], in the Upper Silesian Coal Basin, Poland. The underground workings are located below the surface of a small park in a highly urbanised area. The location of the workings in relation to the surface development is shown in Figure 2.
The Training Mine at the State School of Mining and Metallurgy in Dąbrowa Górnicza was established in 1927. The length of the accessible underground workings (the galleries, slopes, and adit) is approx. 800 m. Since January 2010, the mine has been open to the public as an underground tourist route with a length of 650 m and a level difference of 25 m [16,33]. The characteristic B–B cross-section through the main excavations of the mine is shown in Figure 3. The discussed area on the surface is a green area, mainly grassy with relatively numerous shrubs and trees. Several walking paths were marked out on the square paved with concrete blocks, as shown in Figure 4.

2.2. Geological Structure

The rock mass in the area of the Training Mine is composed of Quaternary formations and Carboniferous strata directly under them [16].
The Quaternary of small thickness (1–5 m), in the form of clays, as well as silty and sandy loams, is covered by a layer of weathering and embankment soils.
The Carboniferous strata in the area of the neighbouring closed “Paryż” coal mine were recognised to the depth of approx. 1000 m and are represented by: “Orzeskie”, “Rudzkie”, “Siodłowe”, “Porębskie”, “Jaklowieckie”, and Upper “Pietrzkowickie” beds (nomenclature consistent with Polish classification of Carboniferous strata).
Due to the nature of this paper being related to the impact of shallow post-mining workings, it will only include the structure up to the depth of the occurrence of the “Siodłowe” beds.
The “Orzeskie” beds are limited to the lower part of the complex. Lithologically, they comprise claystones of variable silting levels, mudstones, and fine- and medium-grained sandstones. Within the “Orzeskie” beds, coal seams are quite numerous. The seams 358/1 and 358/2 of approx. 0.3 m thickness were identified in the area of the mine. The outcrops of these seams are located to the south of the mine.
The “Rudzkie” beds are characterised by a considerable coal-bearing capacity. There are 15 coal seams in these beds. The outcrops of the seams run north-east from the mine. In the mine area, the seam 401 is accessible. It is 0.8 m thick and dips in the south-western direction at an angle of 10°–15°. The remaining seams of the “Rudzkie” beds lie slightly deeper, to a depth of approx. 110 m.
The “Siodłowe” beds were subjected to intensive mining exploitation in the past. In lithological terms, they are a clayey-carboniferous series with seam 510 (the “Reden” seam). Seams 501, 504, 506, and 510 occur to the west. In the area of the mine, the coal seam 510 lies at the depth of approx. 140–180 m and is approx. 16 m thick.

2.3. Former Mining Exploitation

So far, directly under the Training Mine objects, the mining was carried out only in seam 510. Seam 510, which lies at a depth of 140–180 m, was extracted using a longwall system with the application of hydraulic backfilling. The mining was carried out intermittently between 1912 and 1954.
In the deposits of group 400, the mining was carried out to the east, not far from the area of the drill mine (at the distance of approx. 100–300 m), in seam 405/1, in the years 1917–1923; in seam 405/3, in the years 1920–1923; in seam 409/1, in the years 1902–1923; and in seam 409/2, in the years 1902–1923. In the area of the Training Mine, the exploitation was carried out in the following seams: seam 409/2, with a thickness of approx. 2.4 m in the years 1990–1995; seam 510, layer IV + V (thickness of approx. 6 m) in the years 1992–1996; and seam 816, with a thickness of 1.3–2.2 m in the years 1990–1996. The exploitation was carried out by a longwall system with the use of hydraulic backfilling.

2.4. Discontinuous Deformations Identified in the Past

On the surface above the mining workings area, eight sinkholes with variable area and depth were found in 2011 [16]. They arose directly above the underground workings of the mine. The sinkholes had an average area of about 10–70 m2. They formed on the surface as the “cover–subsidence” type sinkholes with depth of 0.2–0.3 m. The location, shapes, and sizes of the sinkholes are presented in Figure 5.

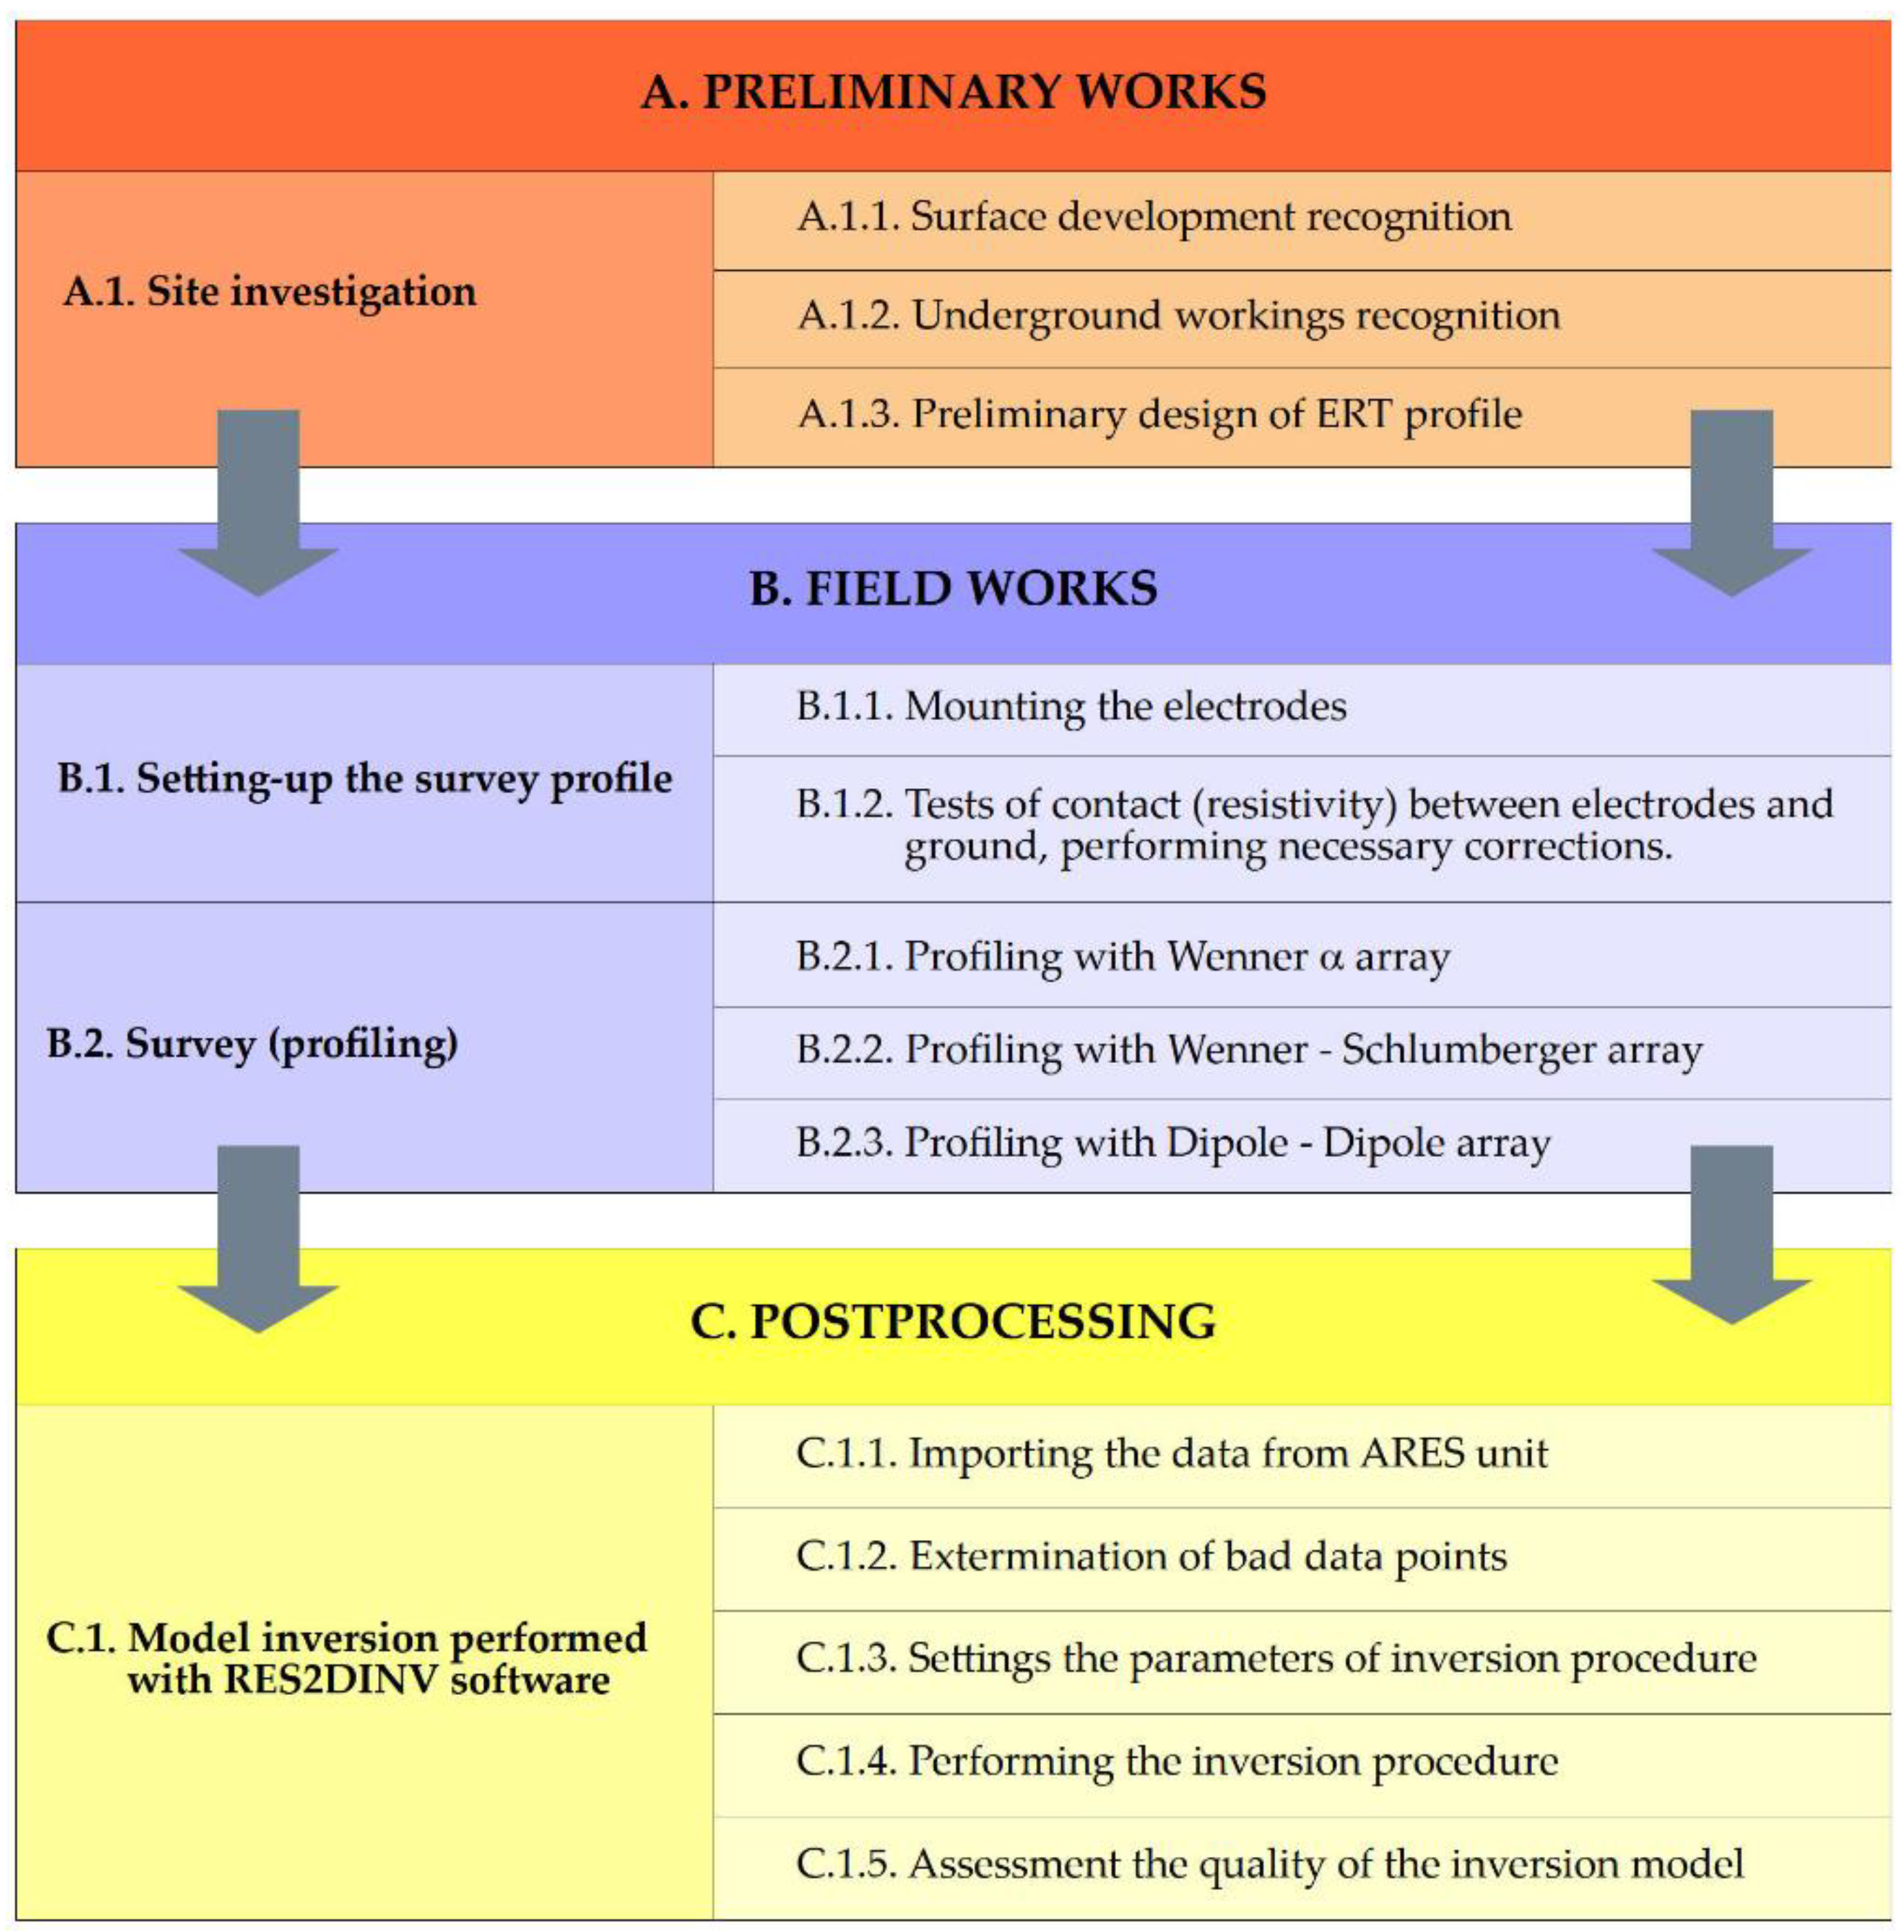
2.5. Research Methods

As already mentioned in the introduction, the electrical resistivity tomography (ERT) method was used to assess the condition of near-surface rock mass layers.
When comparing it to other geophysical methods popular in this field, such as a ground-penetrating radar, seismic methods, and microgravimetry, it may be stated that the ERT method presently gives one of the best balances between the cost of the survey, necessary workload, and the quality of results.
The essence of the electrical resistivity method is to use the phenomenon of current flow through the rock mass layers. The basic measurement method, which has been known for decades, uses four electrodes. Two are used as current electrodes and two as measuring electrodes; they measure the potential difference generated by the current flowing through the near-surface rock mass layers [27]. The depth of penetration is a function of electrode spacing—the greater the spacing, the greater the vertical range. The average penetration depth, depending on the electrode array used, ranges from approx. 20% to 40% of the electrode spacing [27,34].
Nowadays, systems based on a larger number of electrodes—from a dozen to as many as several hundred—are used for measurements. The electrodes are stabilised along specified profile lines or within the area of the analysed surface, in the case of 3D measurements. A measuring device is connected to the line; its task is to select appropriate electrode combinations for a given measurement, emit a current pulse, and record it on the measuring electrodes. This is called Electrical Resistivity Tomography (ERT).
In this case, for measurement, more than one electrode array can be used, along with associated measurement methods with different imaging resolutions, sensitivity, and depth range. The schematics of typical measurement systems can be found in the documents [34,35].
Due to the ERT measurement technique, it is possible to obtain the following imaging:
  • Two-dimensional, in the form of vertical cross-sections through near-surface rock mass structures. The results from a single survey line arranged in the form of a rectilinear section over the studied part of the rock mass are necessary for such an analysis.
  • The 3D imaging of:
    The spatial distribution of resistivity in the surveyed rock mass;
    The distribution of resistivity on any horizontal or vertical planes constituting cross-sections of the analysed rock mass.
In the study area, the ERT sounding was carried out on the profile running above the workings of the Training Mine, mainly above the workings in “Level 1”. For studies with the electrical resistivity method, a measuring system from the Czech company GF Instruments ARES-II [34] was used. Software Res2Dinv [27,35] from GEOTOMO was used to process the measurement results.
The real survey was preceded with a recognition of the study area, where the situation on the surface and the state of the underground workings were identified. In Figure 6, a flowchart shows all key stages of the performed works during the ERT surveys.
The possibilities of the unconstrained location of the ERT profile line were limited due to the layout of the underground workings as well as the configuration and land development of the area. The optimal location of the profile on the surface which was used in practice is presented in Figure 7. The profile line consisted of 48 electrodes stabilised at mutual distances of 1.5 m. Therefore, the total length of the profile was 70.5 m. The location of the profile in relation to the workings is shown in Figure 8.
The investigation was carried out on the profile line using 3 electrode arrays [34,35]:
  • Wenner α;
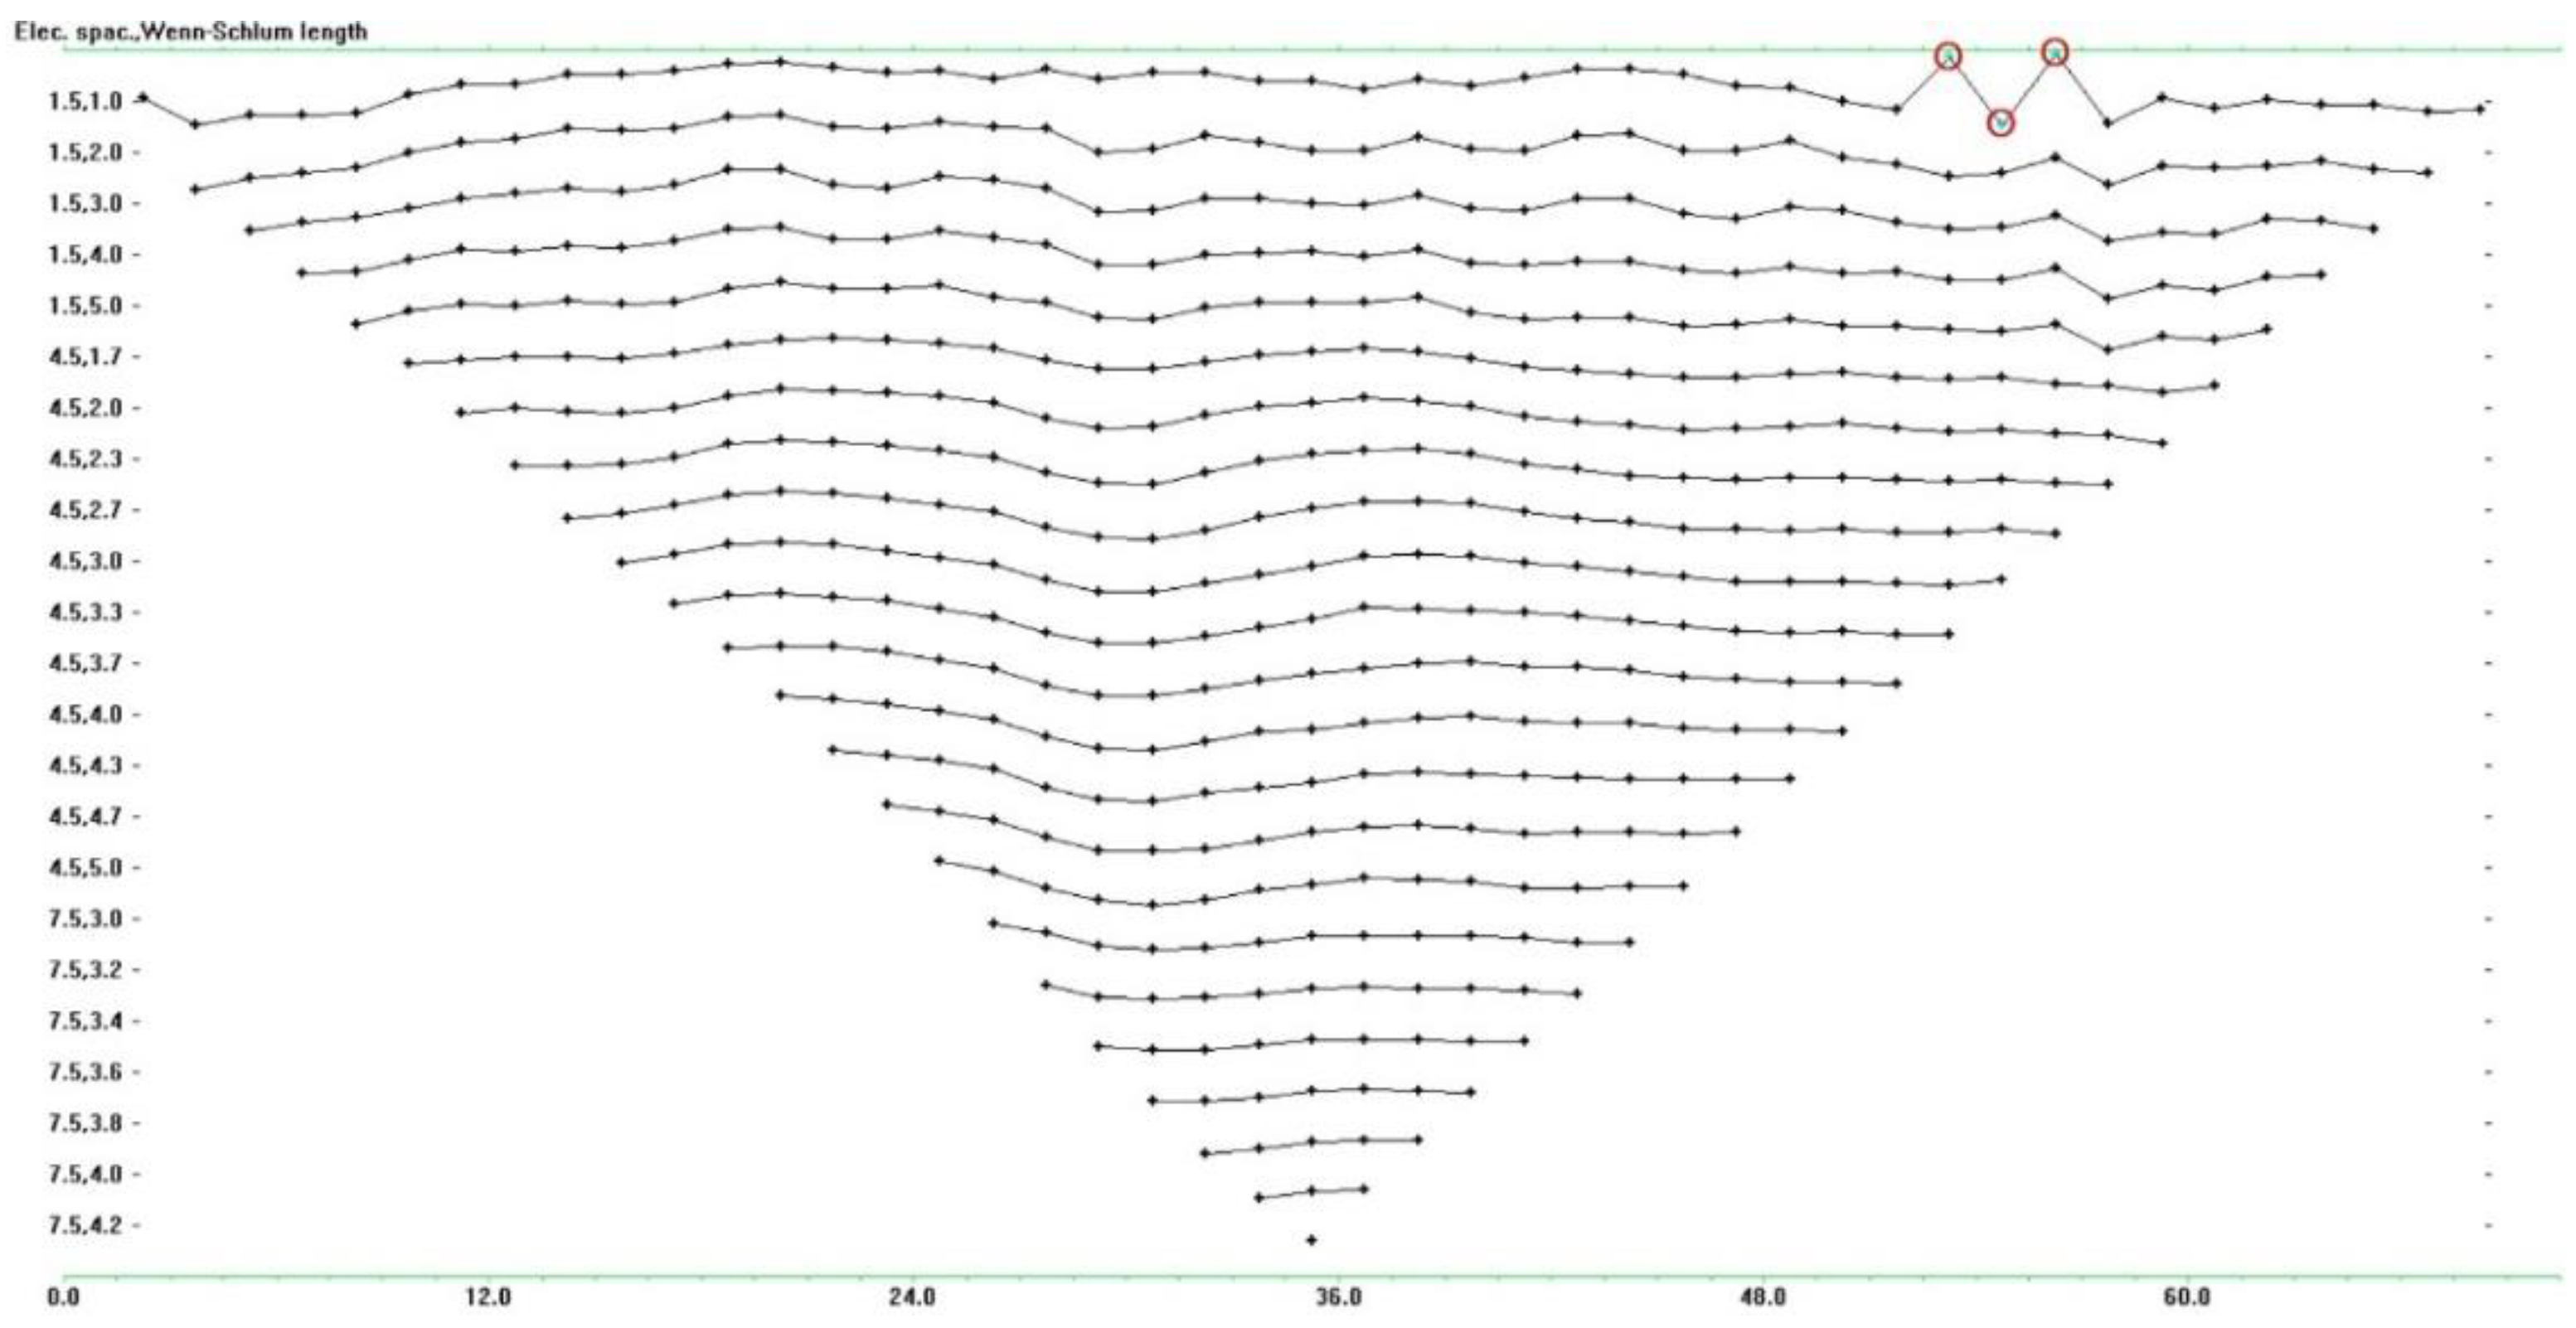
  • Wenner–Schlumberger;
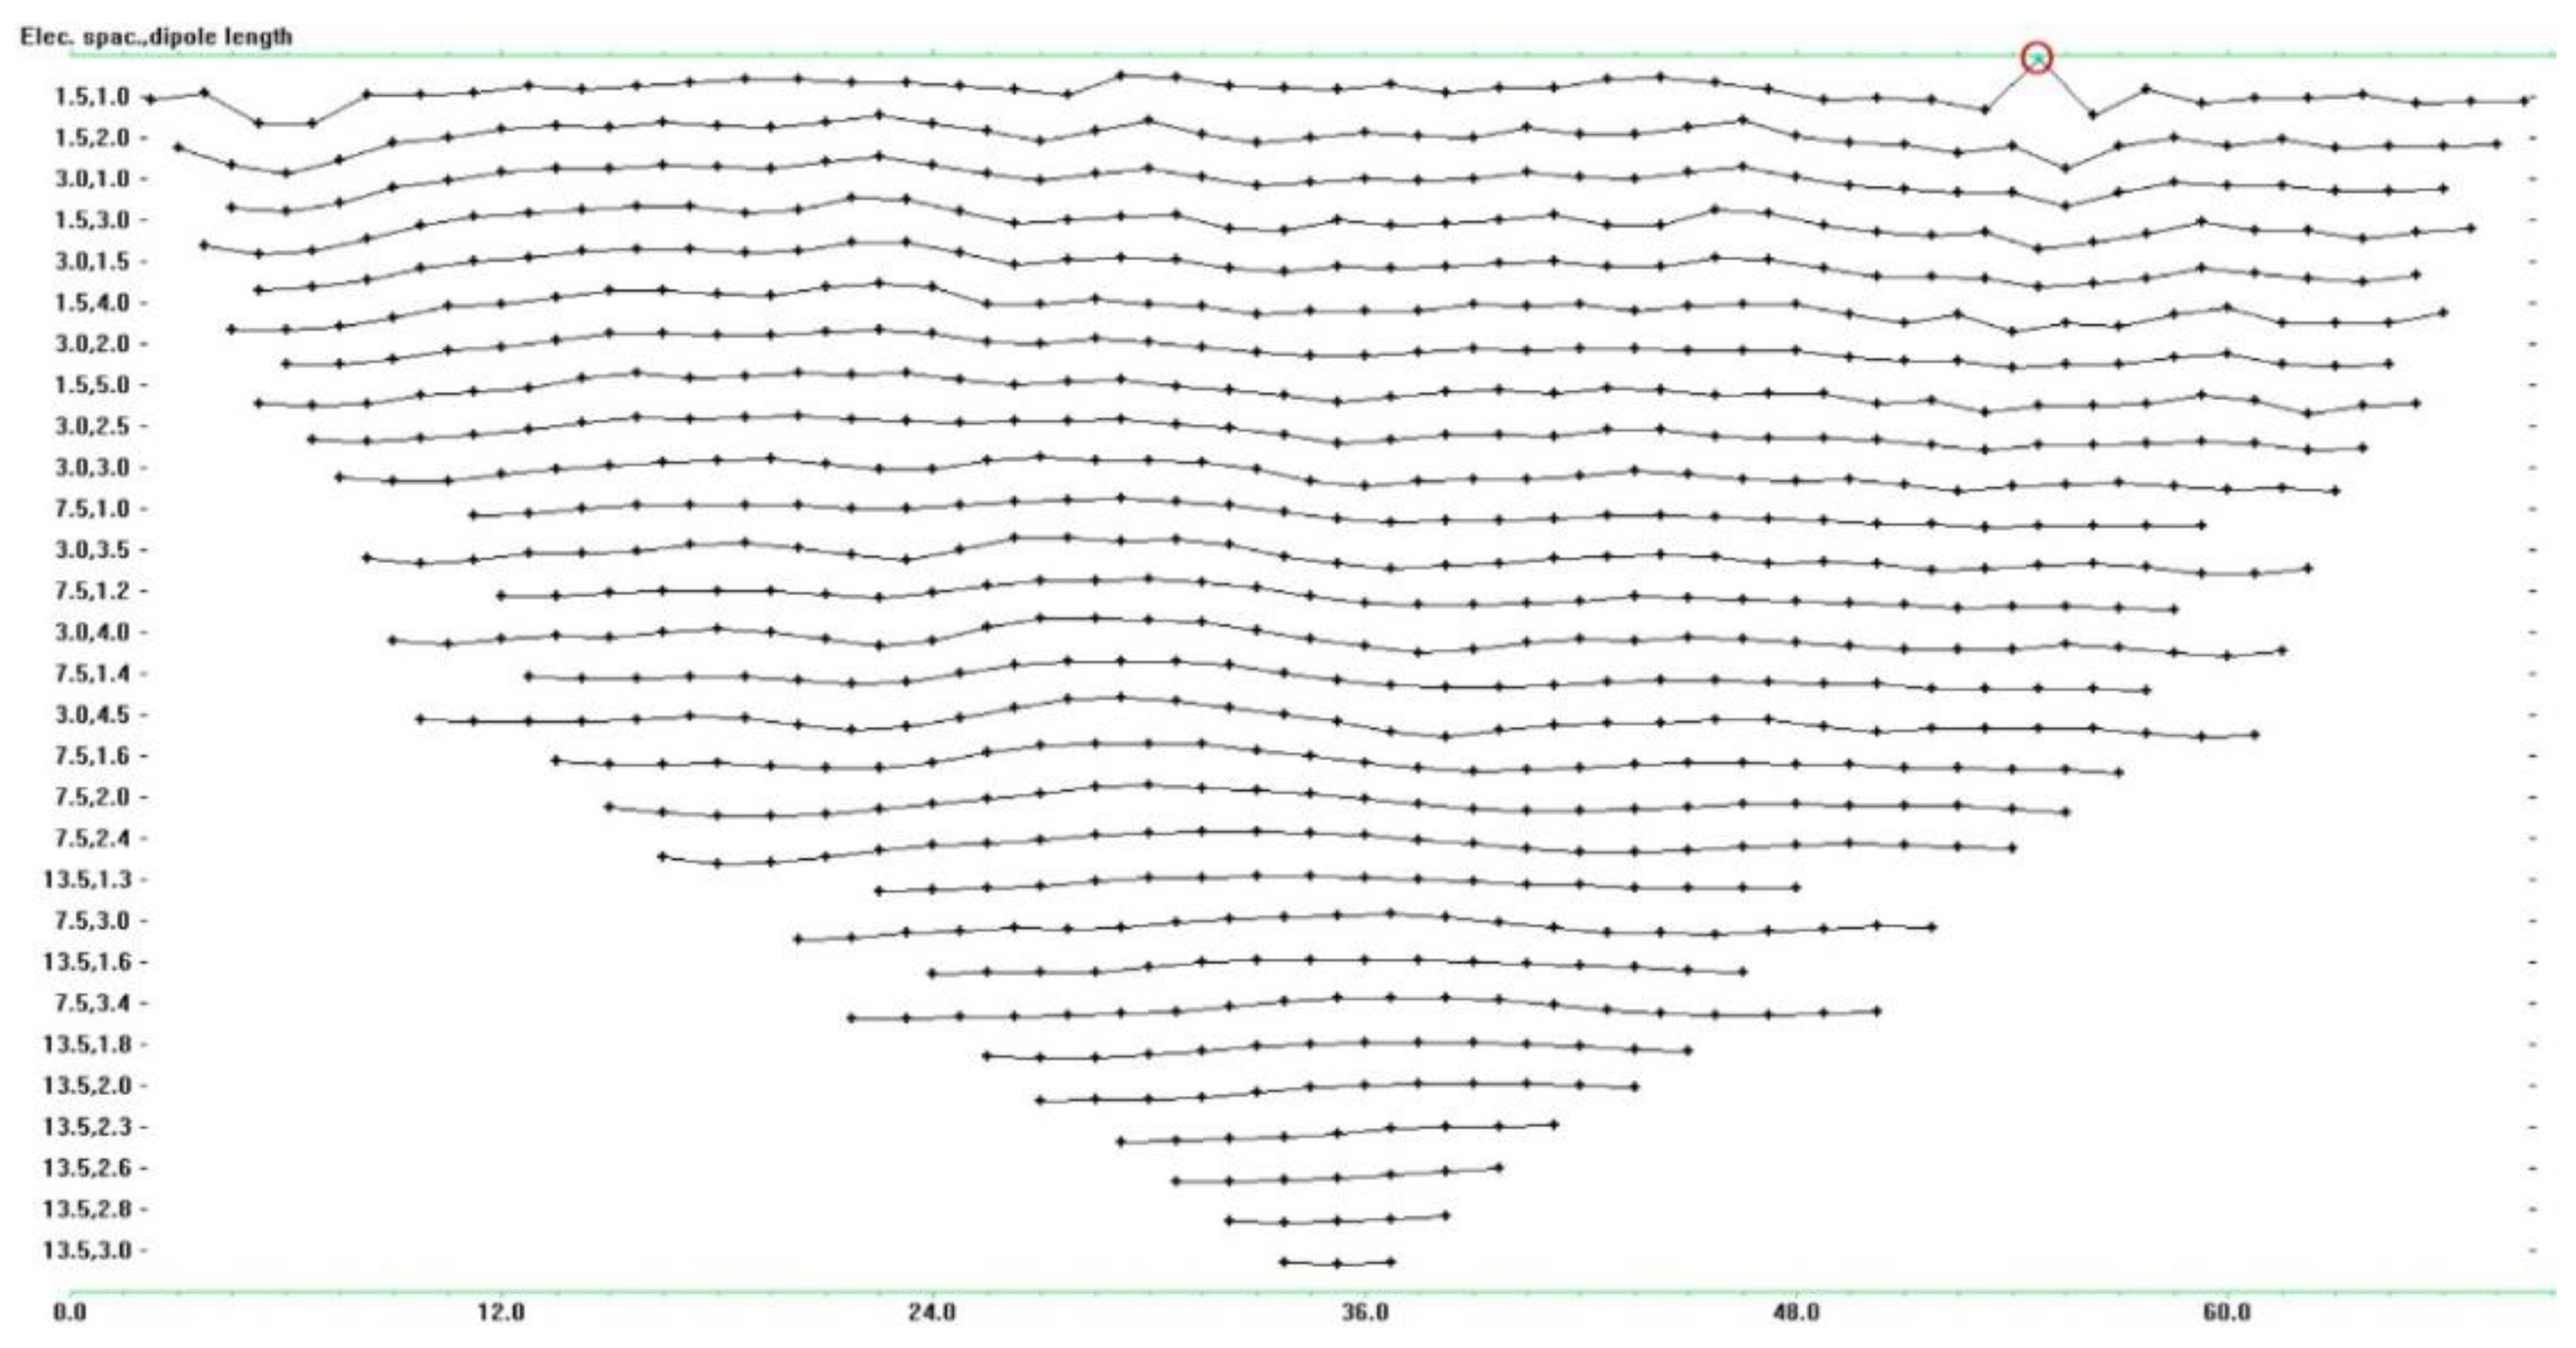
  • Dipole–Dipole.

3. Results

The RES2DINV software was used to analyse the measurement results. Before processing the inversion models, the results from all three profiles were analysed to eliminate measurements with abnormal resistivity values. The inspection of such points was conducted by viewing a profile plot in RES2DINV, which is illustrated in Figure 9, Figure 10 and Figure 11, respectively, for every used array. After the resistivity datasets acquired in the field were inspected and all unrealistic values were removed, the inversion was performed to convert the measured ERT resistivity profile to a geologic model which reflects the lateral and vertical resistivity distribution. The removed points are marked in these Figures with red circles.
The developed ERT results in the form of apparent resistivity distributions are illustrated in the following Figures:
  • Figure 12—the ERT profile based on measurements with the Wenner α array;
  • Figure 13—the ERT profile based on measurements with the Wenner–Schlumberger array;
  • Figure 14—the ERT profile based on measurement with the Dipole–Dipole array.
Figure 15, Figure 16 and Figure 17 show the results of the basic statistical analysis of the measurement quality and the 2D inversion model performed with the RES2DINV software. The left section in this figure contains the error histogram, while the right section contains the correlation plot between the measured resistivity and the calculated apparent resistivity obtained by the 2D inversion model in the RES2DINV software.

4. Discussion

Analysing the obtained interpretation of the measurement results in the shape of the apparent resistivity distribution (Figure 12, Figure 13 and Figure 14 and Figure 18), the following can be stated:
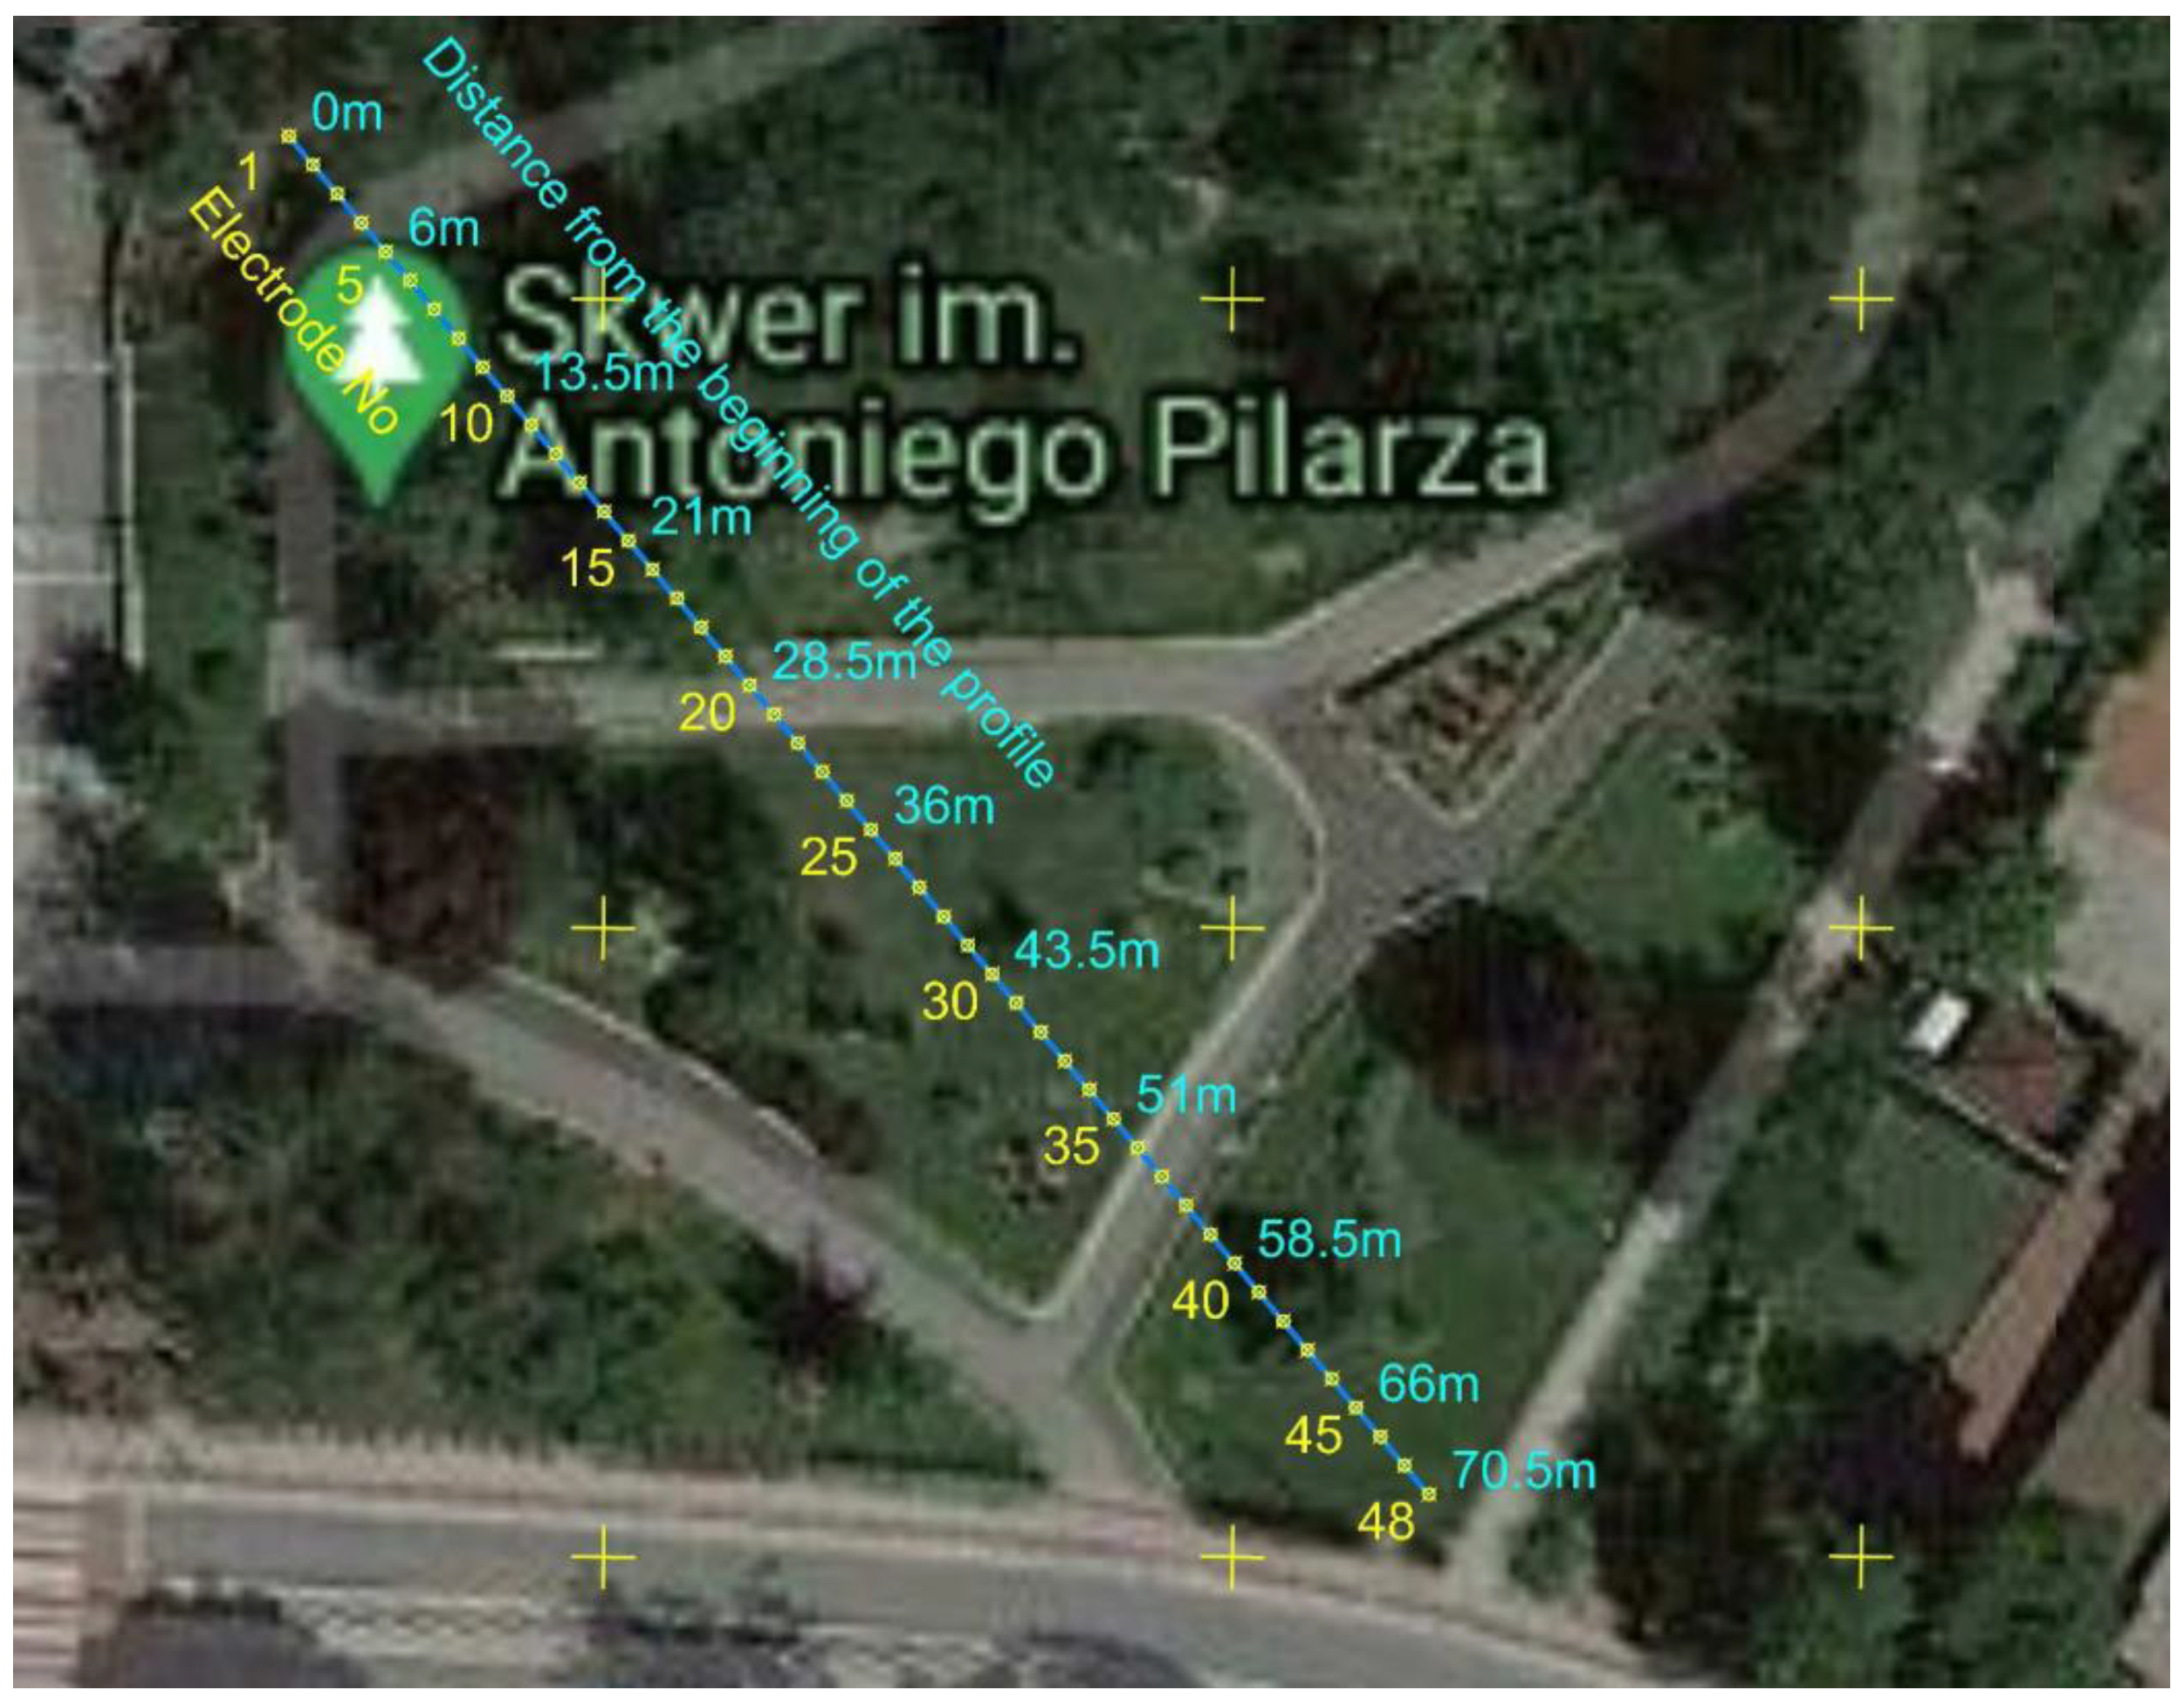
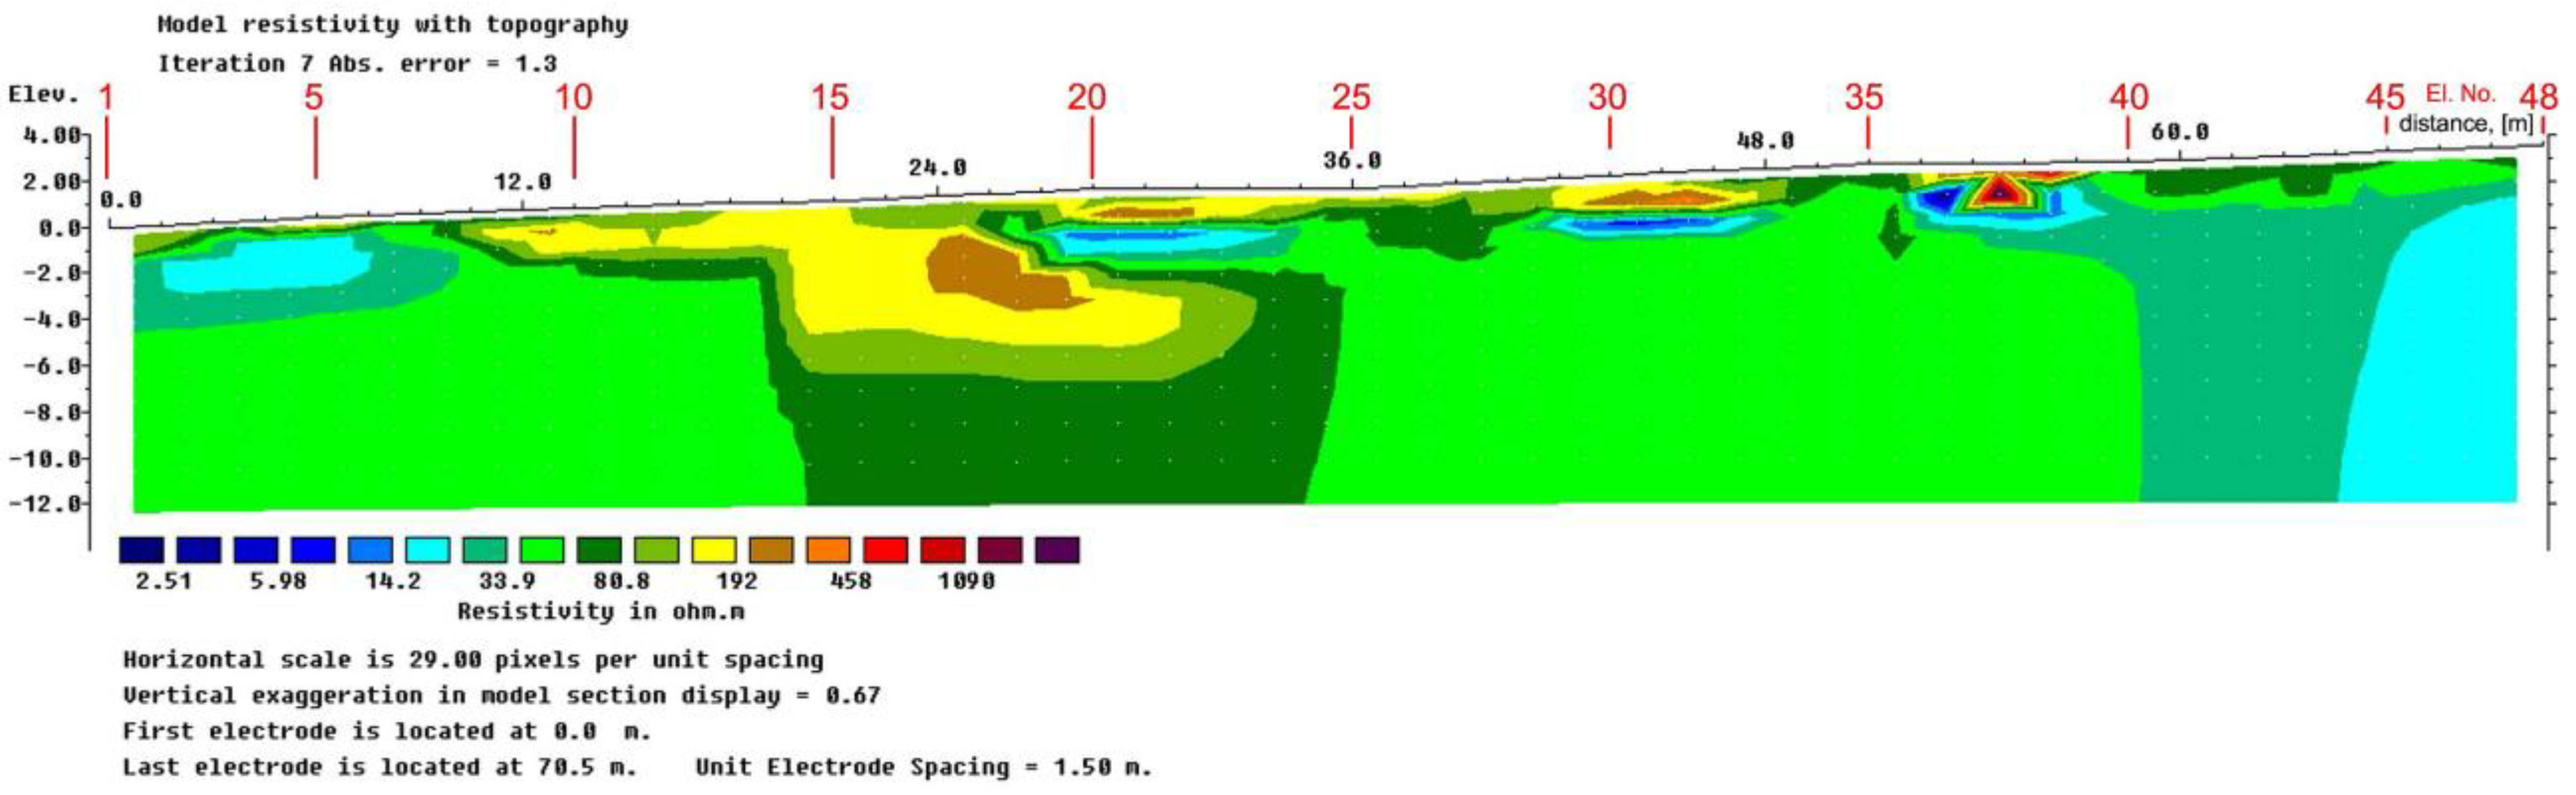
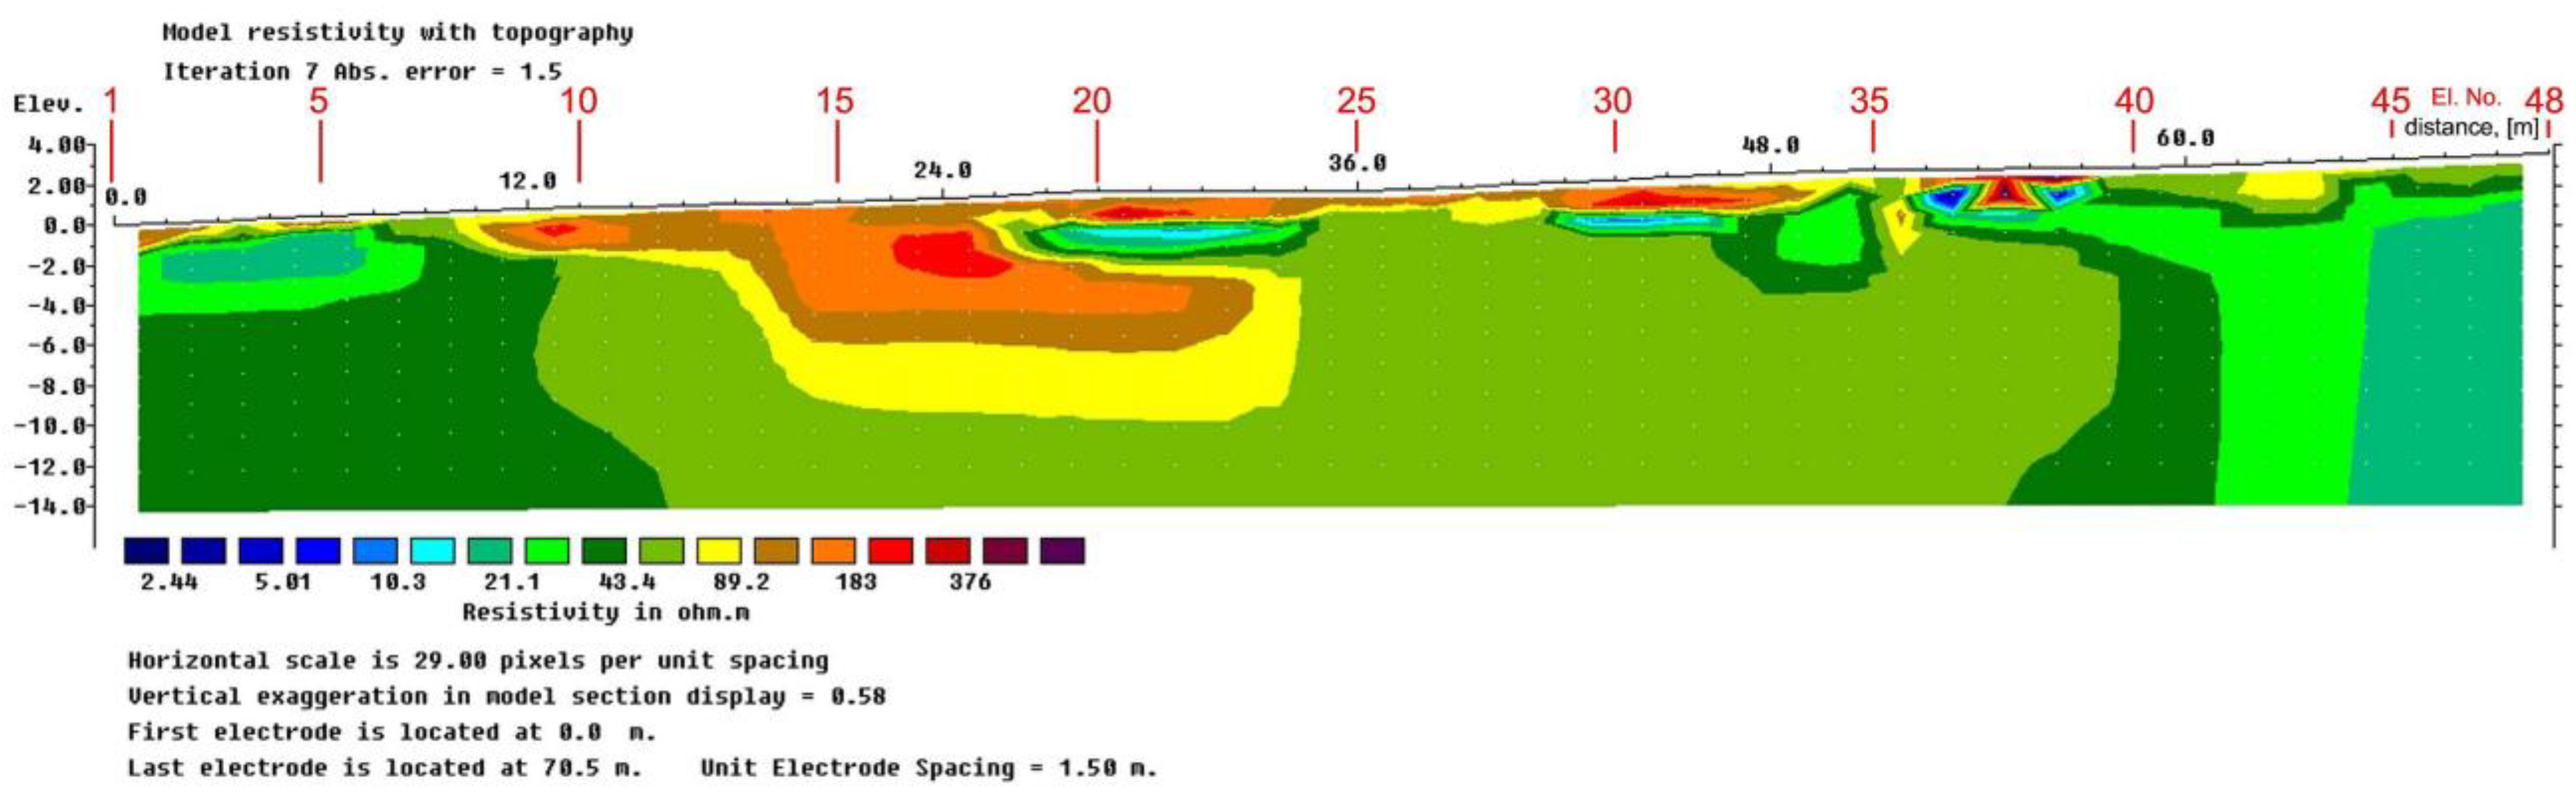
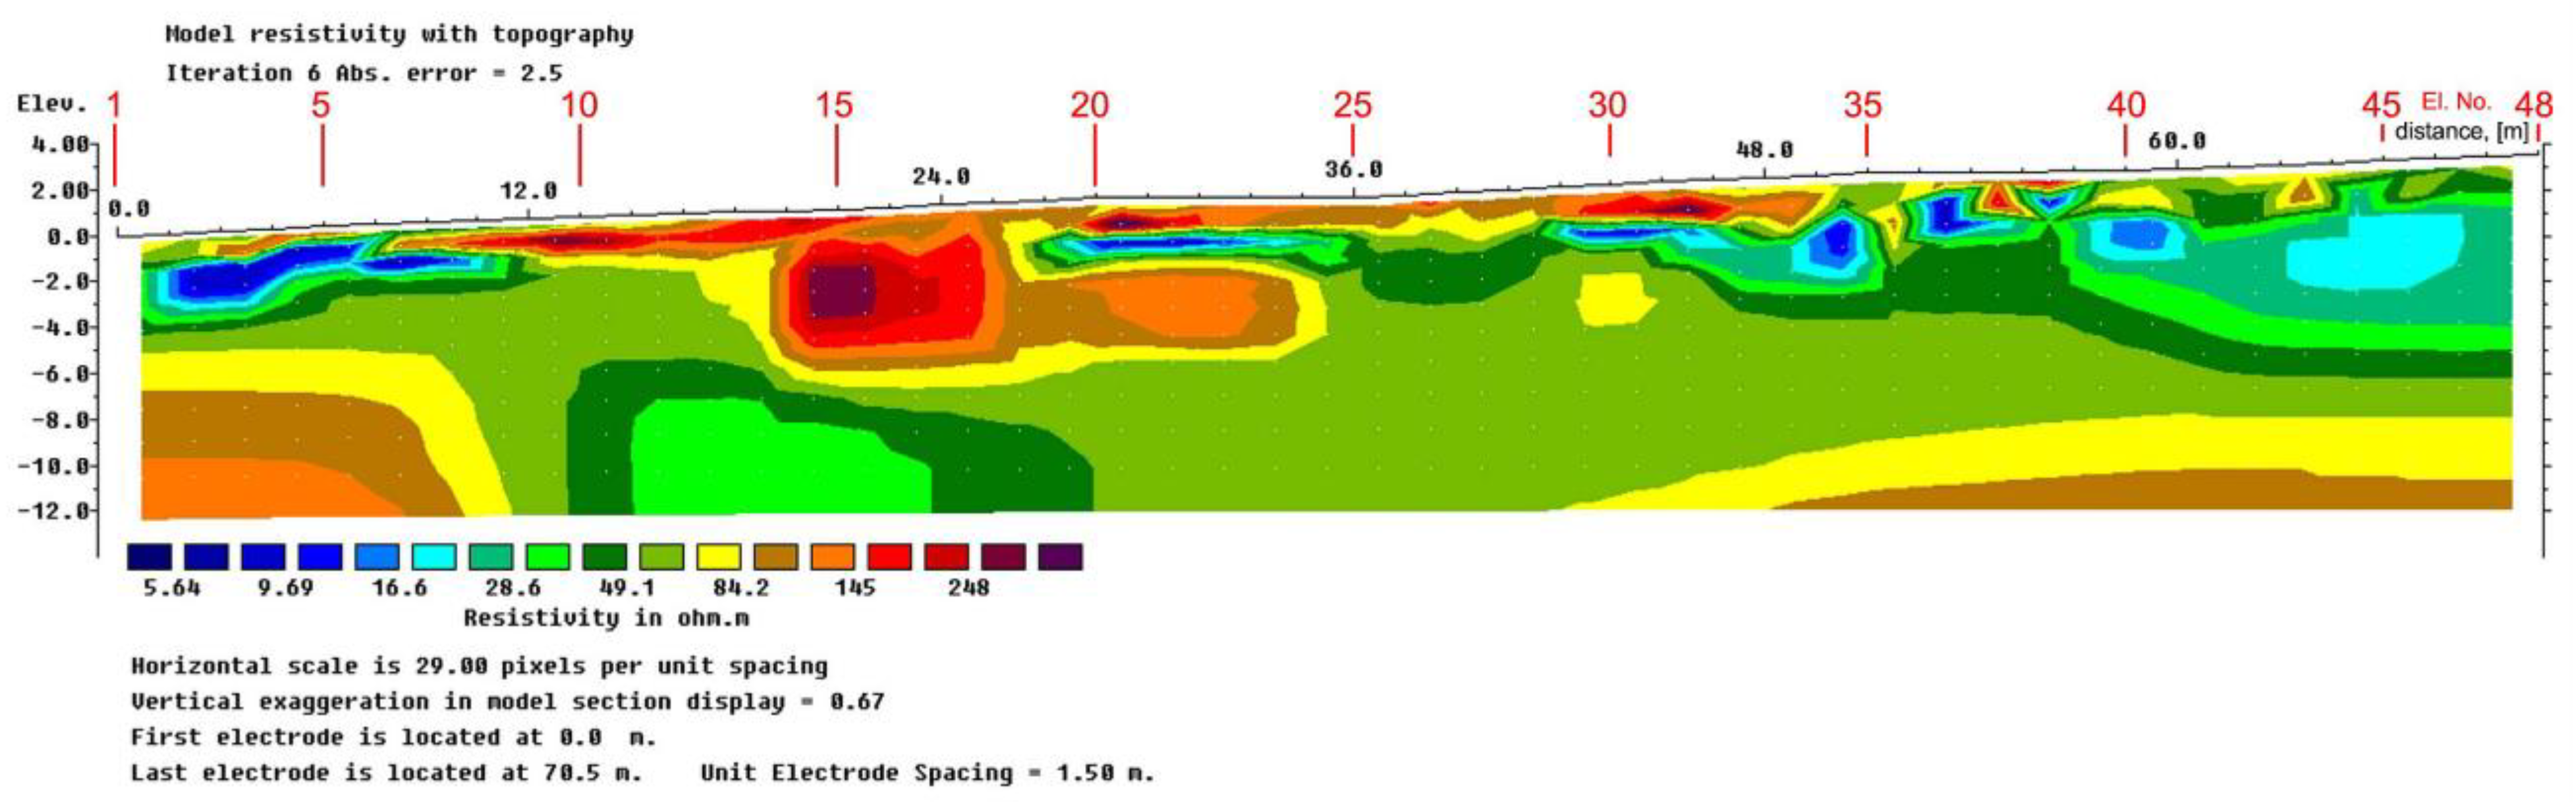
  • Due to the length of the ERT profile line being equal to 70.5 m, the estimated depth of penetration was about 11–12 m. Therefore, the obtained distributions practically concern a fragment of the rock mass from the ground surface to the roof of the underground workings of the first level of the mine.
  • In all carried out measurements, there are visible disturbances in the resistivity distribution (Figure 18):
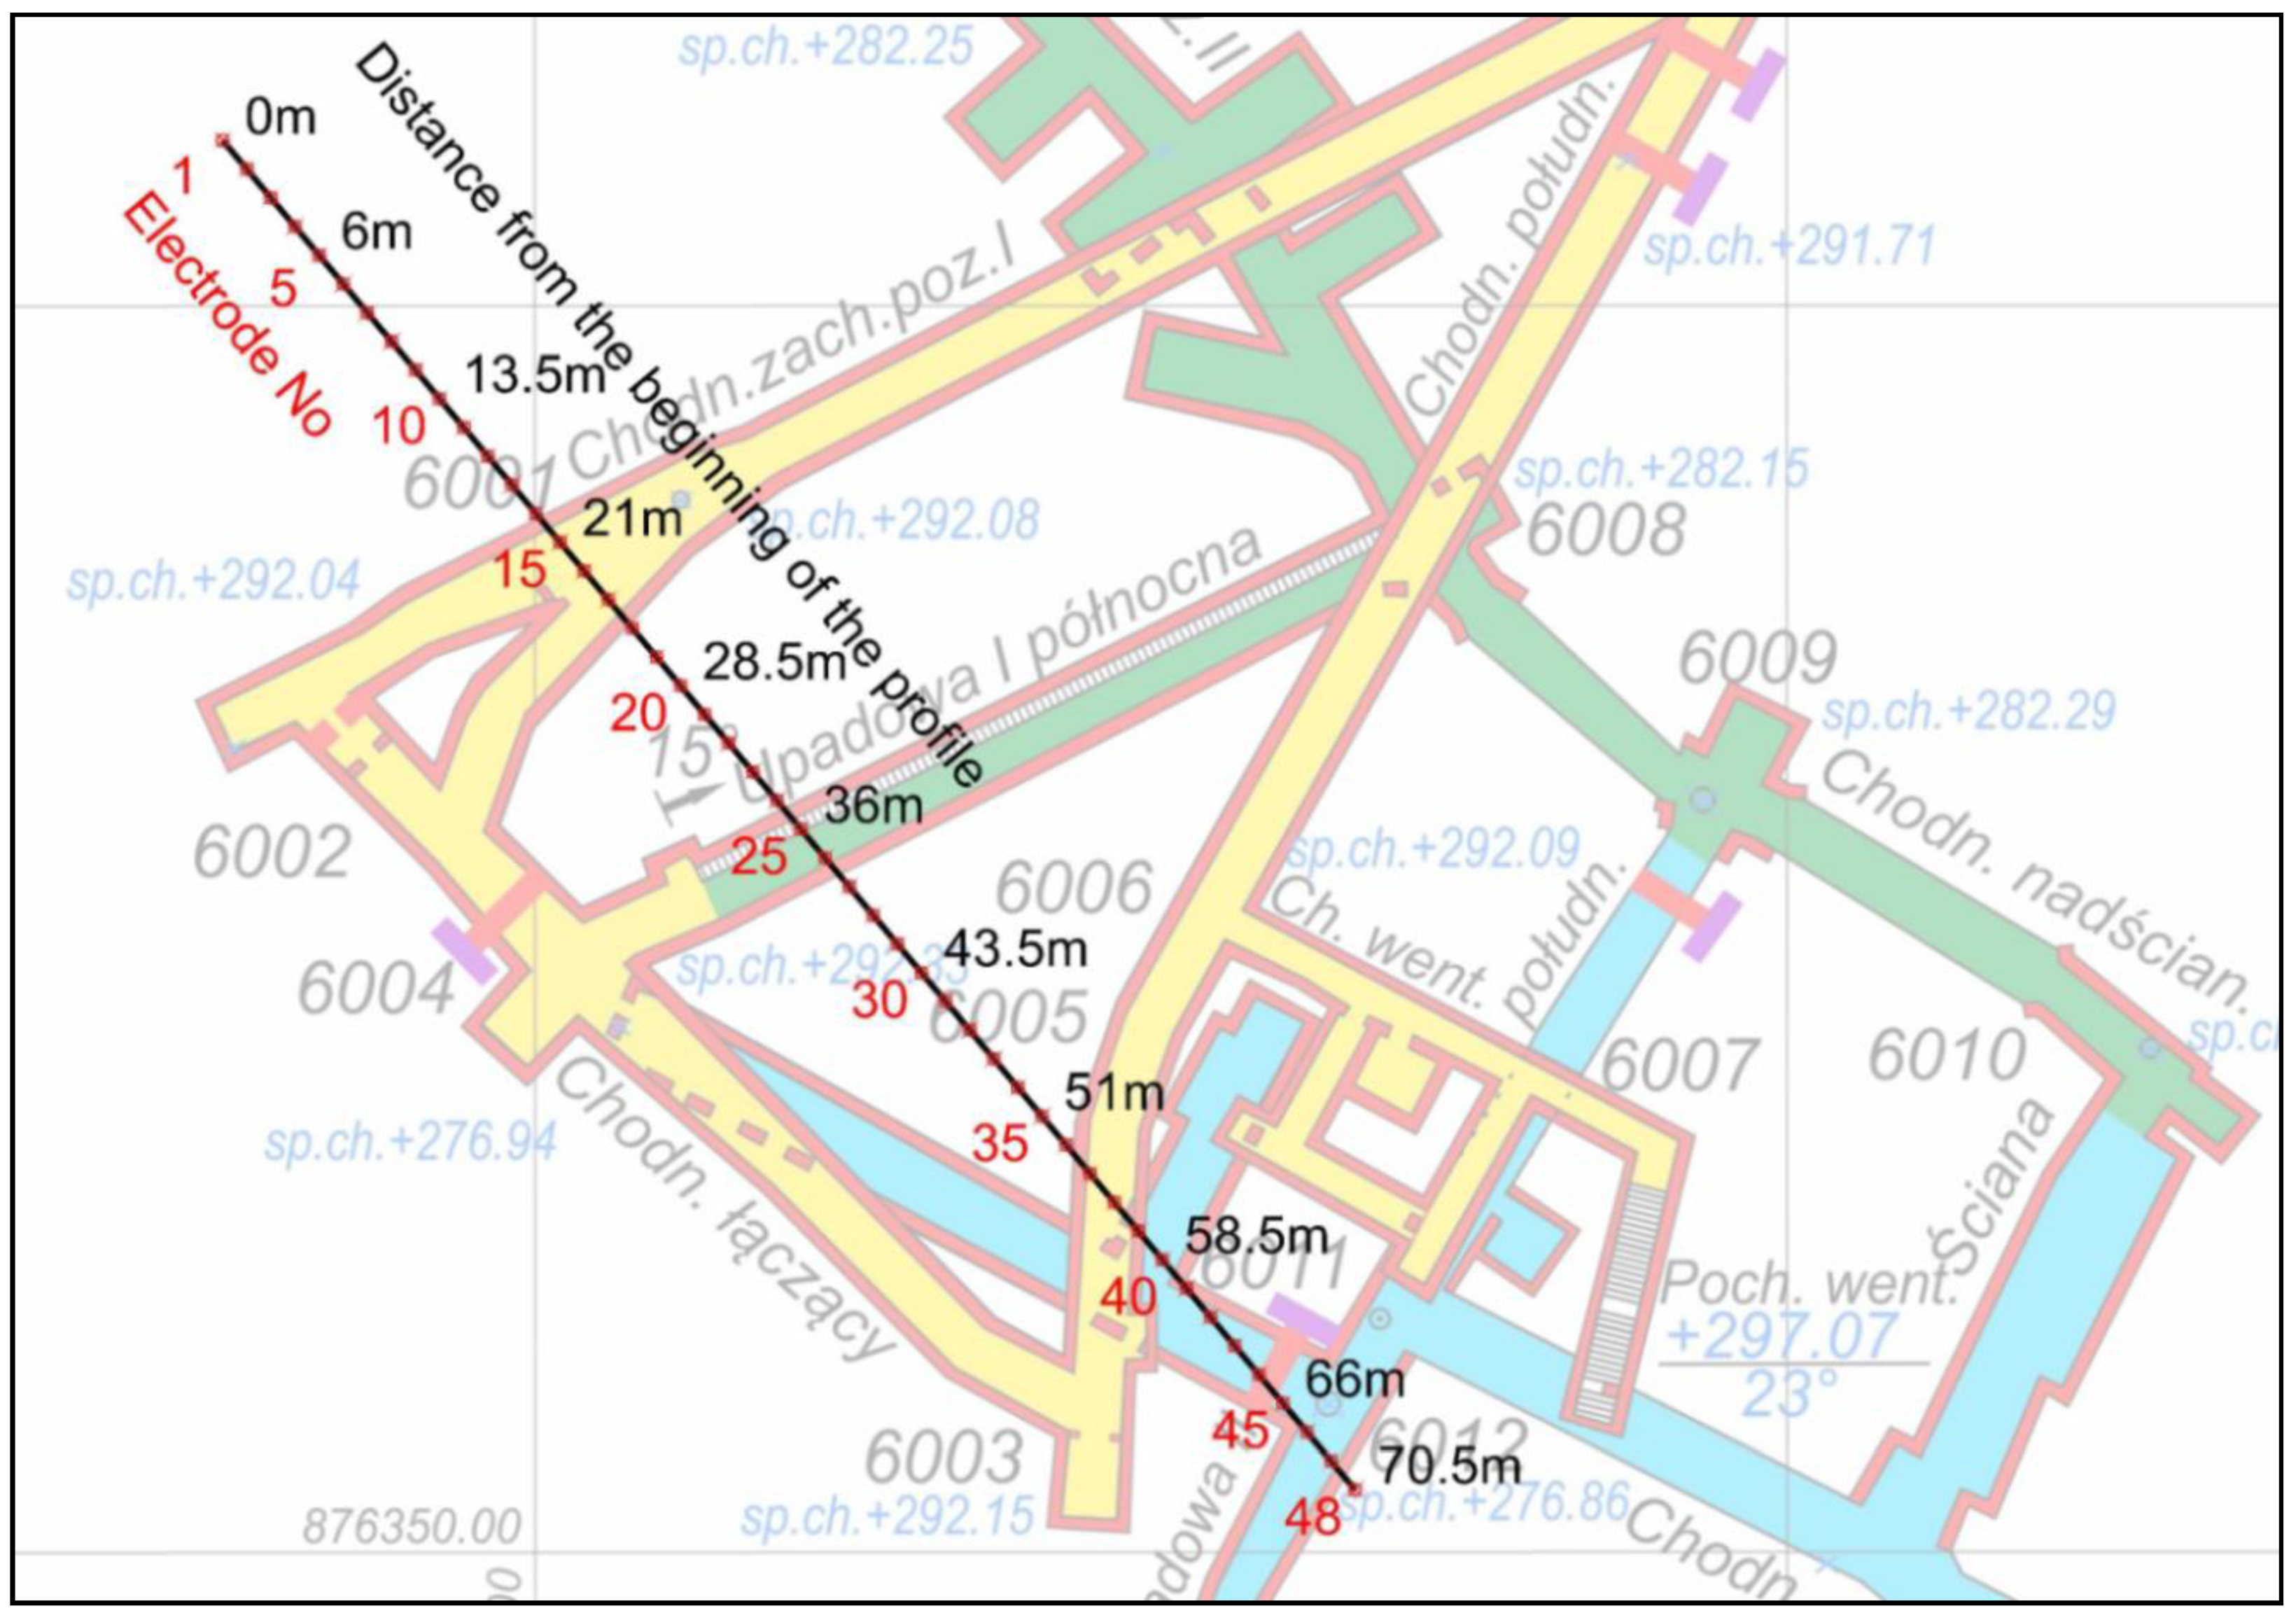
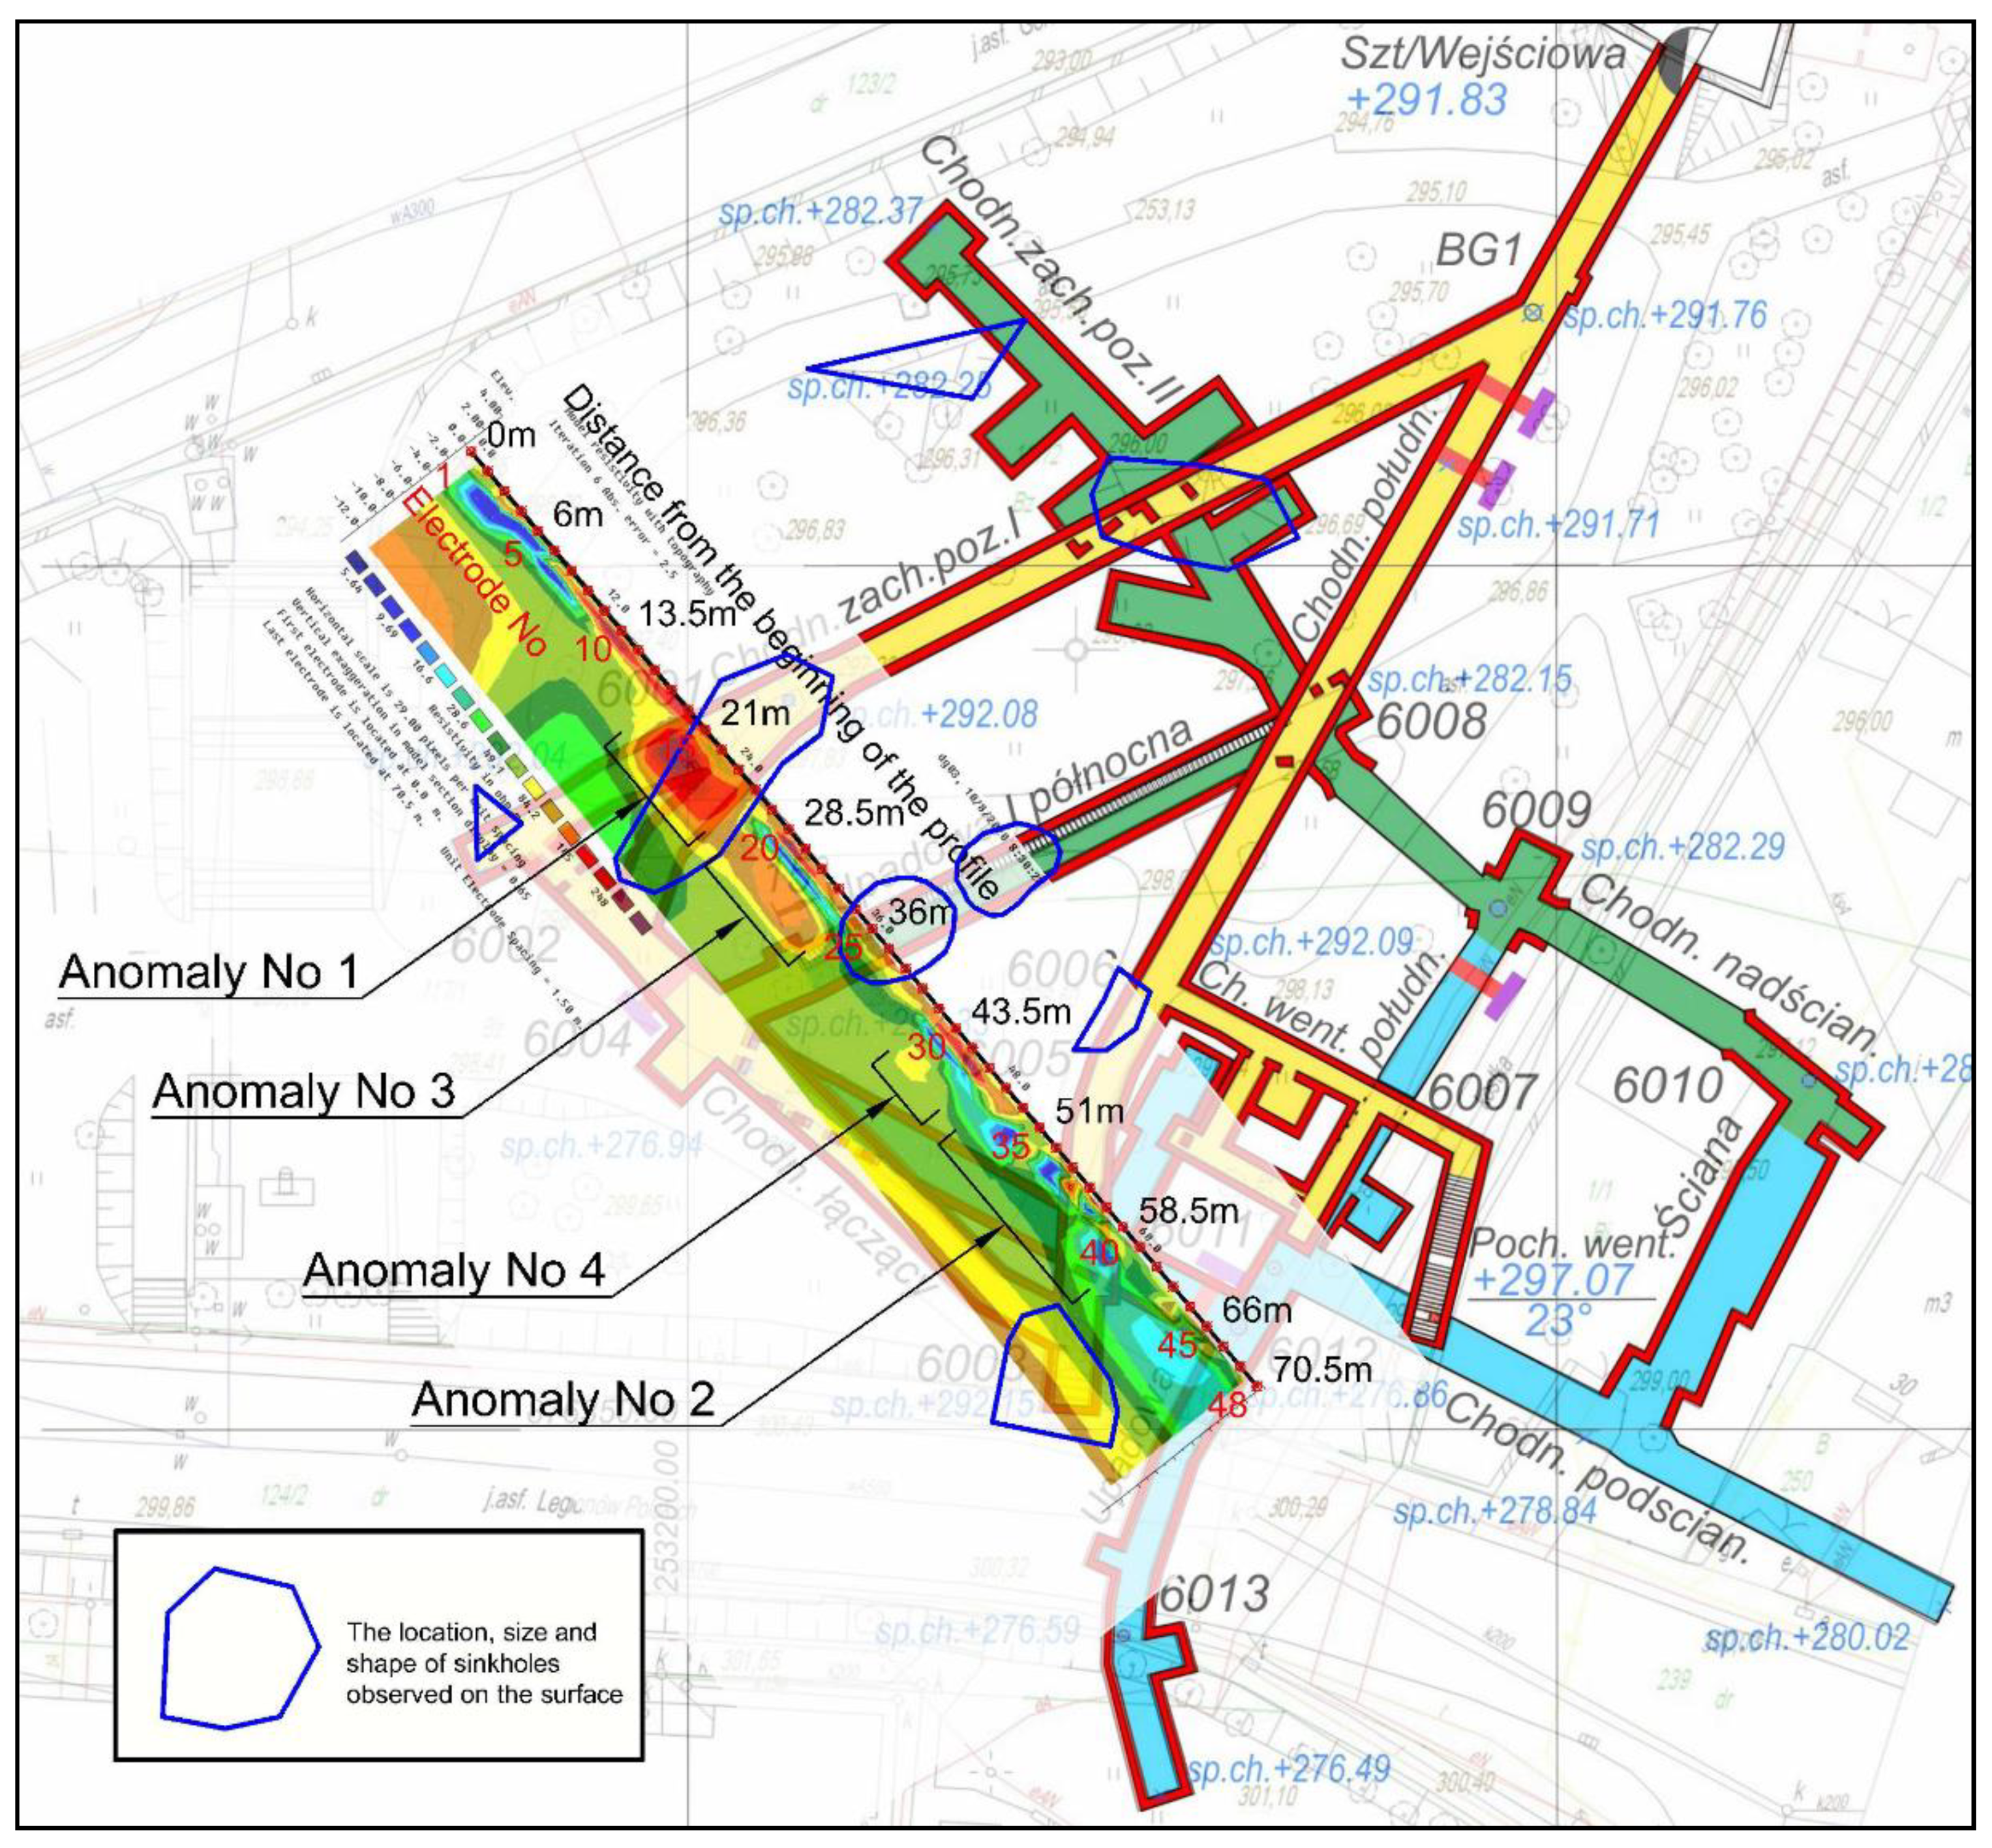
    Anomaly No. 1 in the section between electrodes 13–18, in the area of the “West Gallery” (“Chodnik Zachodni”), level 1;
    Anomaly No. 2 in the section between electrodes 33–41, in the section of the “South Gallery” (“Chodnik Południowy”), level 1, in the area crossing with the “Connecting Gallery” (“Chodnik Łączący”), level 1;
    East of anomaly No. 1, in the section between electrodes 19–24, anomaly No. 3 can be observed;
    West of anomaly No. 2, in the section between electrodes 29–32, anomaly No. 4 can be observed.
  • The locations of anomalies No. 1 and 2 coincide with the location of the workings of the shallowest level 1 of the mine. The extensive area of the high-resistivity anomaly No. 1 indicates the existing significant loosening of the rock mass above the workings. It is also a location where a sinkhole formed in the past (Figure 18). It should be marked as the hazard of a secondary sinkhole formation in the future. Anomaly No. 2 is a near-surface occurrence and is rather linked with local conditions, most probably related to the varying degree of the water flooding of shallow layers due to the weather conditions. In the opinion of the authors, anomaly No. 2 does not pose a sinkhole hazard at this location.
  • Anomalies No. 3 and 4 are shallow and relatively “weaker” in comparison to anomalies No. 1 and 2. Therefore, it is difficult to attribute them to the direct effect of the existing workings. It is most probably an area of loose rocks occurring close to the surface, which may result from the scouring phenomena due to rainwater infiltration.
  • The most unambiguous picture of the disturbances connected with the existence of galleries under the given measurement conditions in this area was given by the measurement conducted using the Dipole–Dipole electrode array.
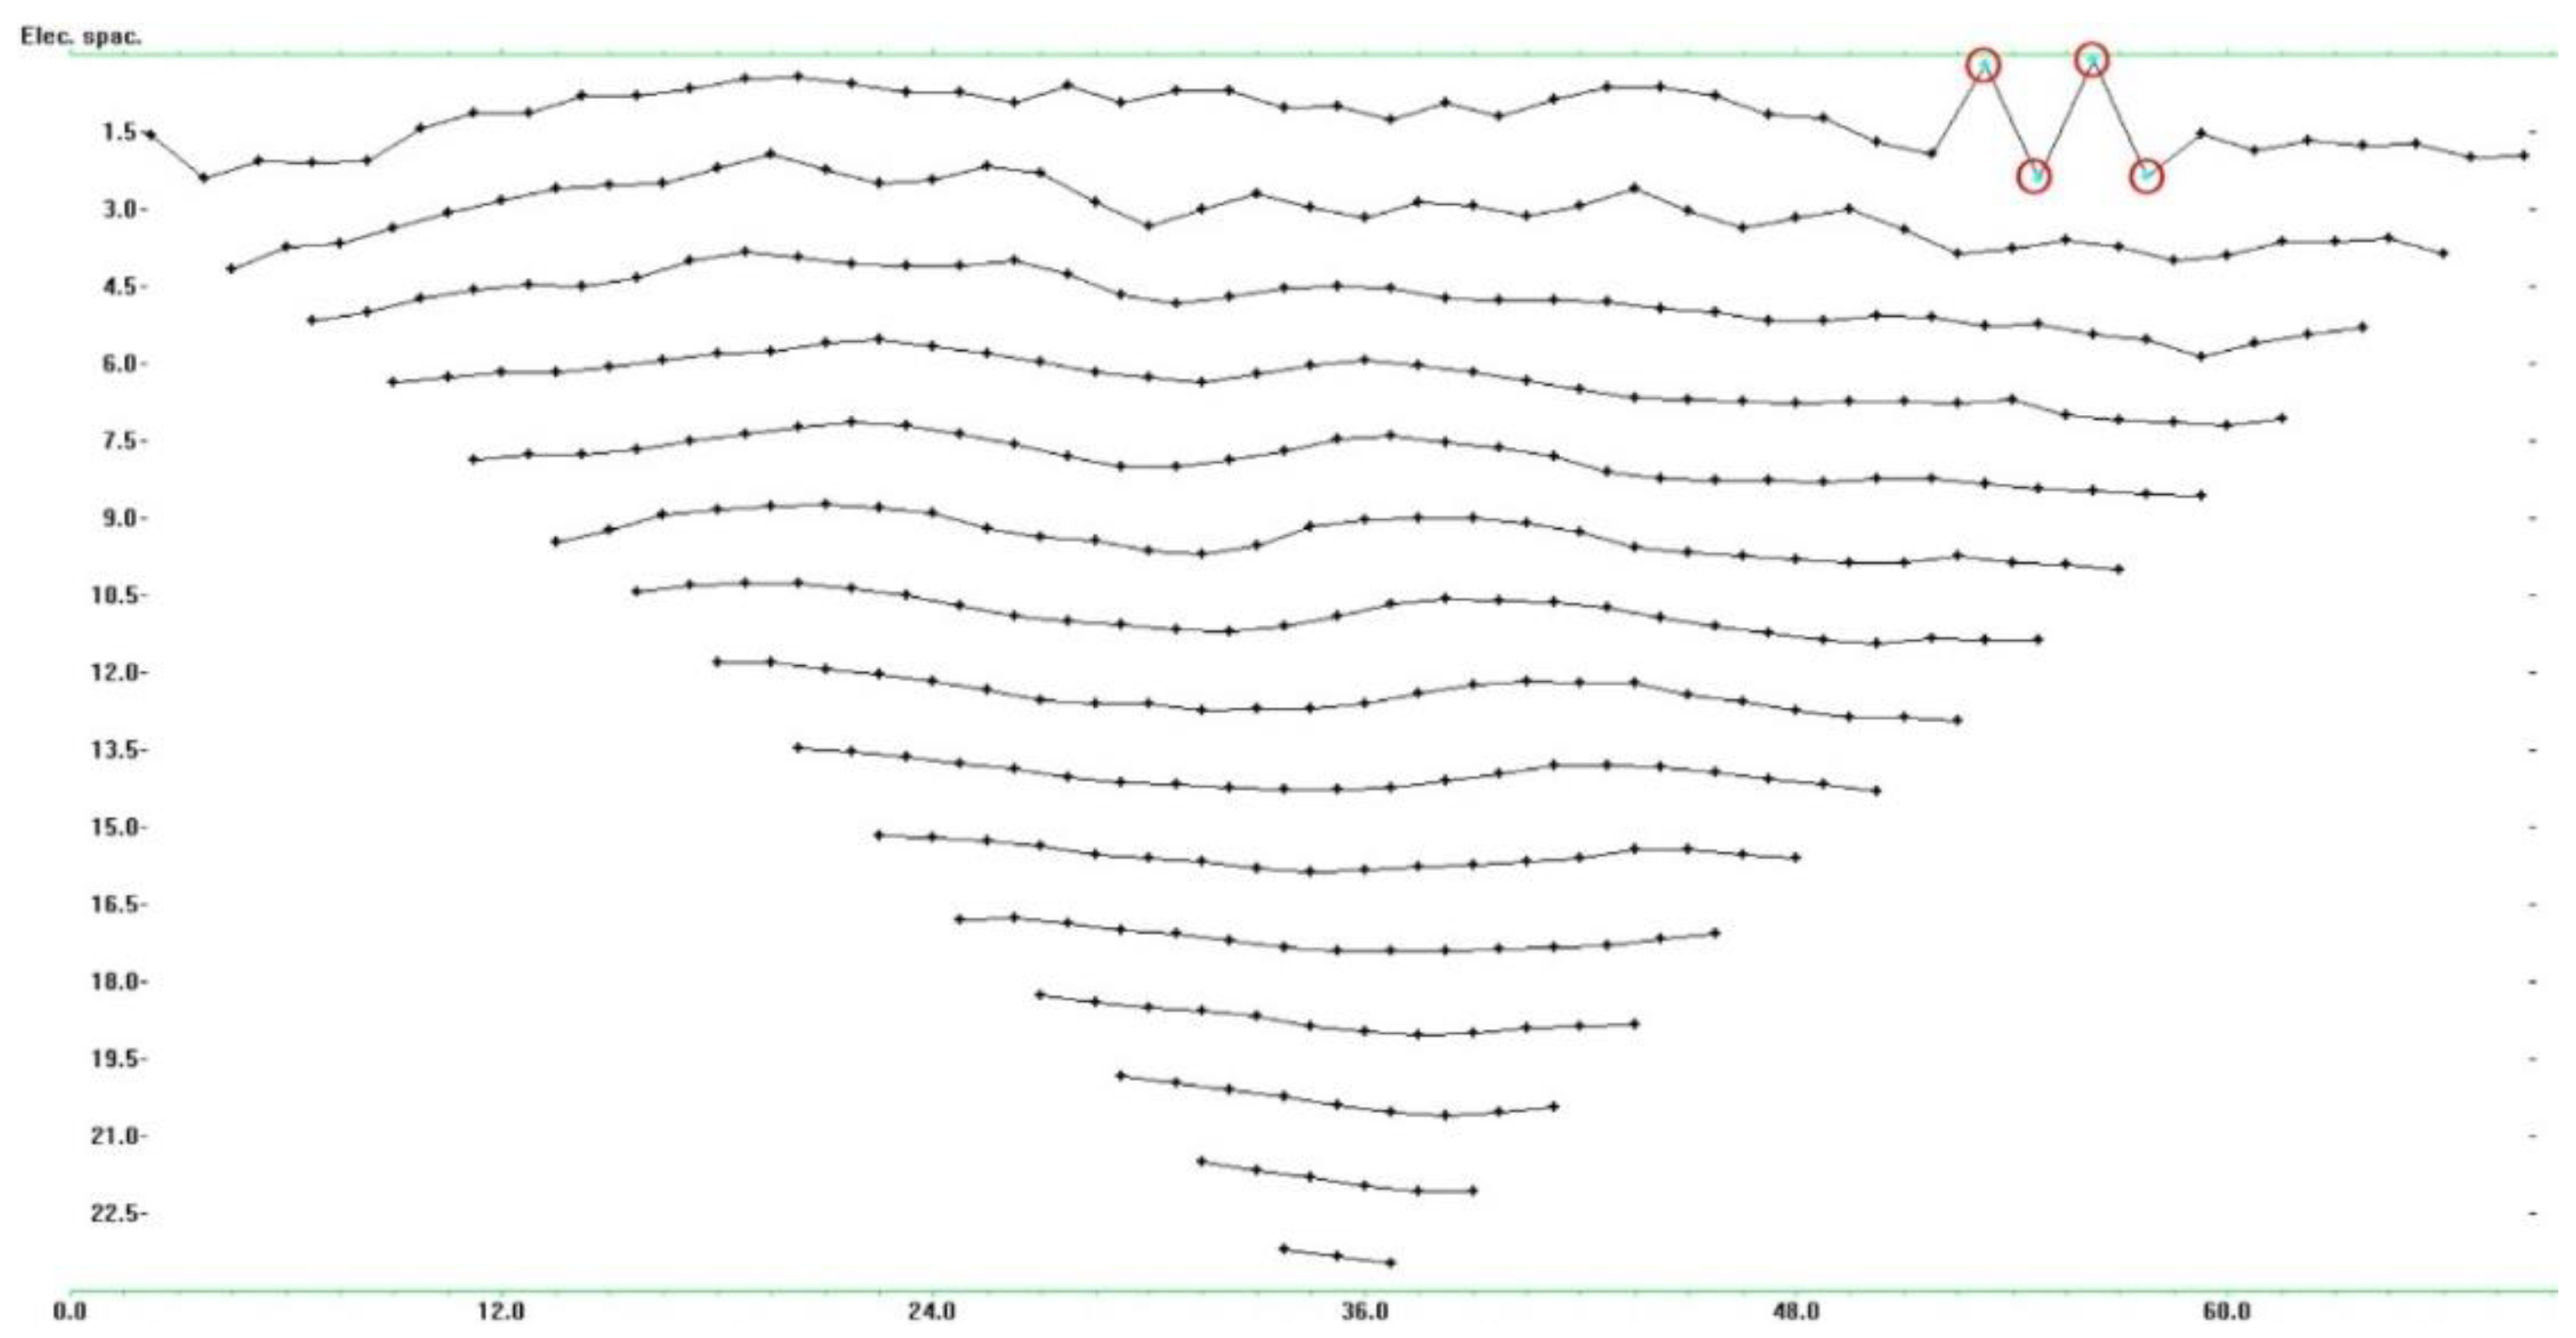
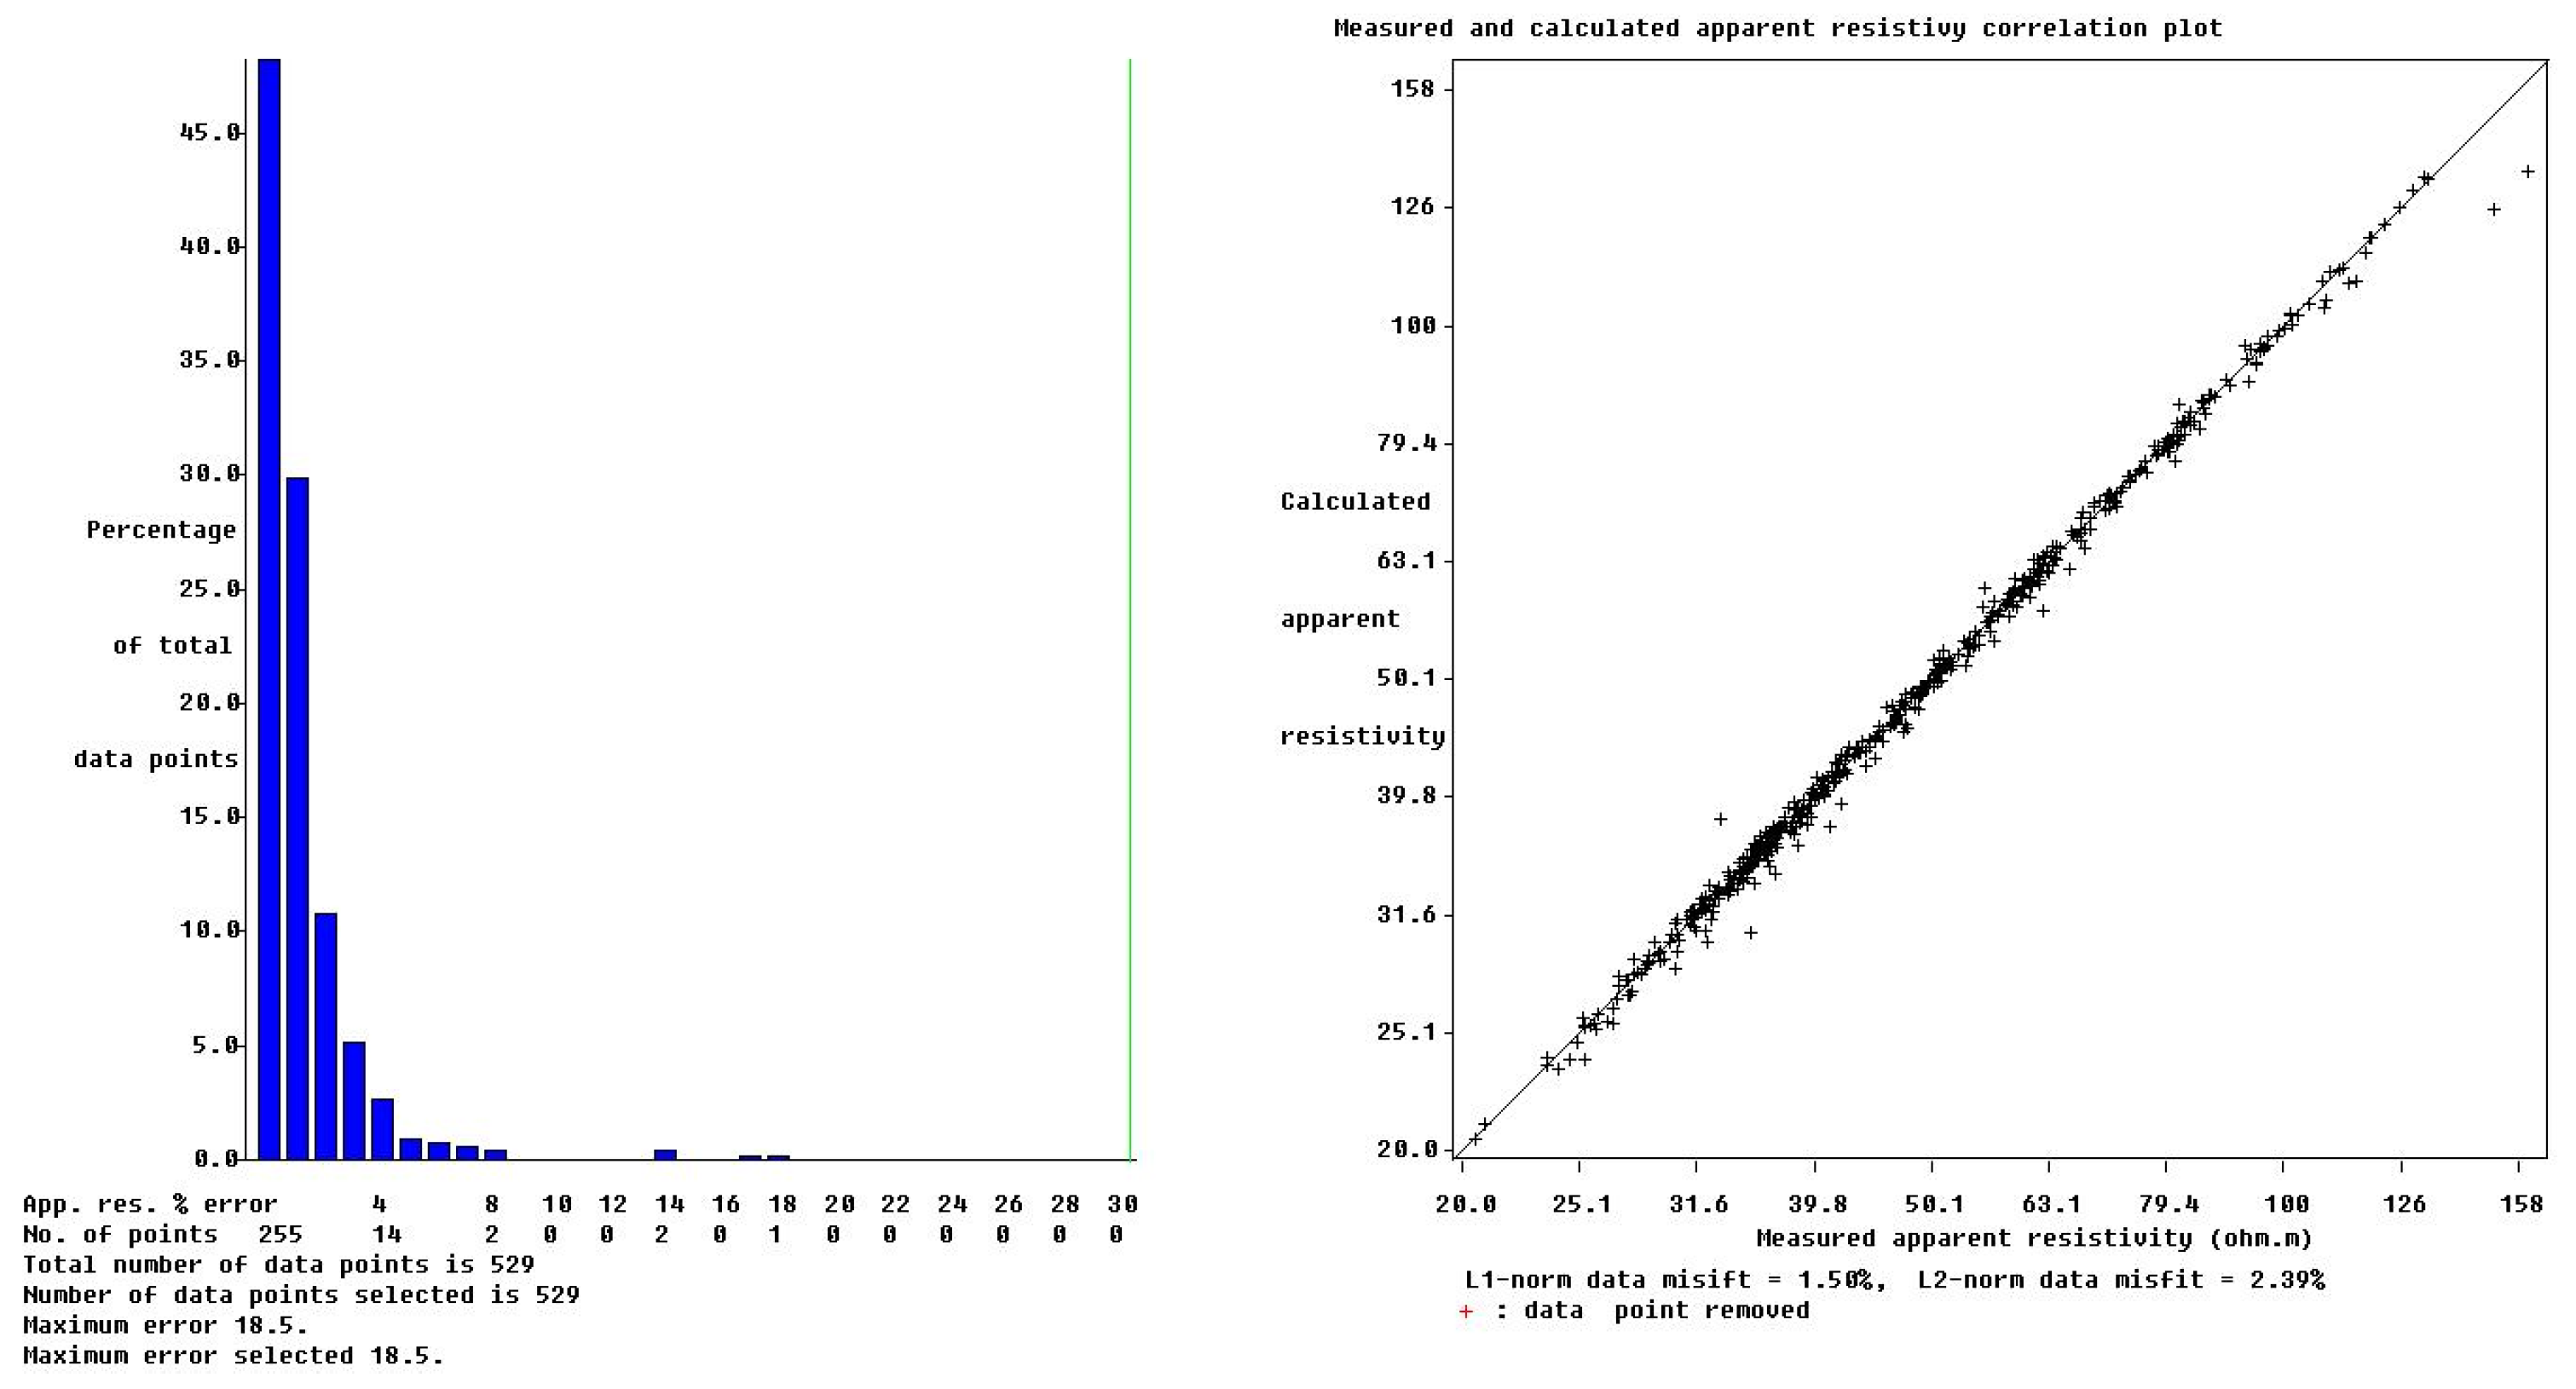
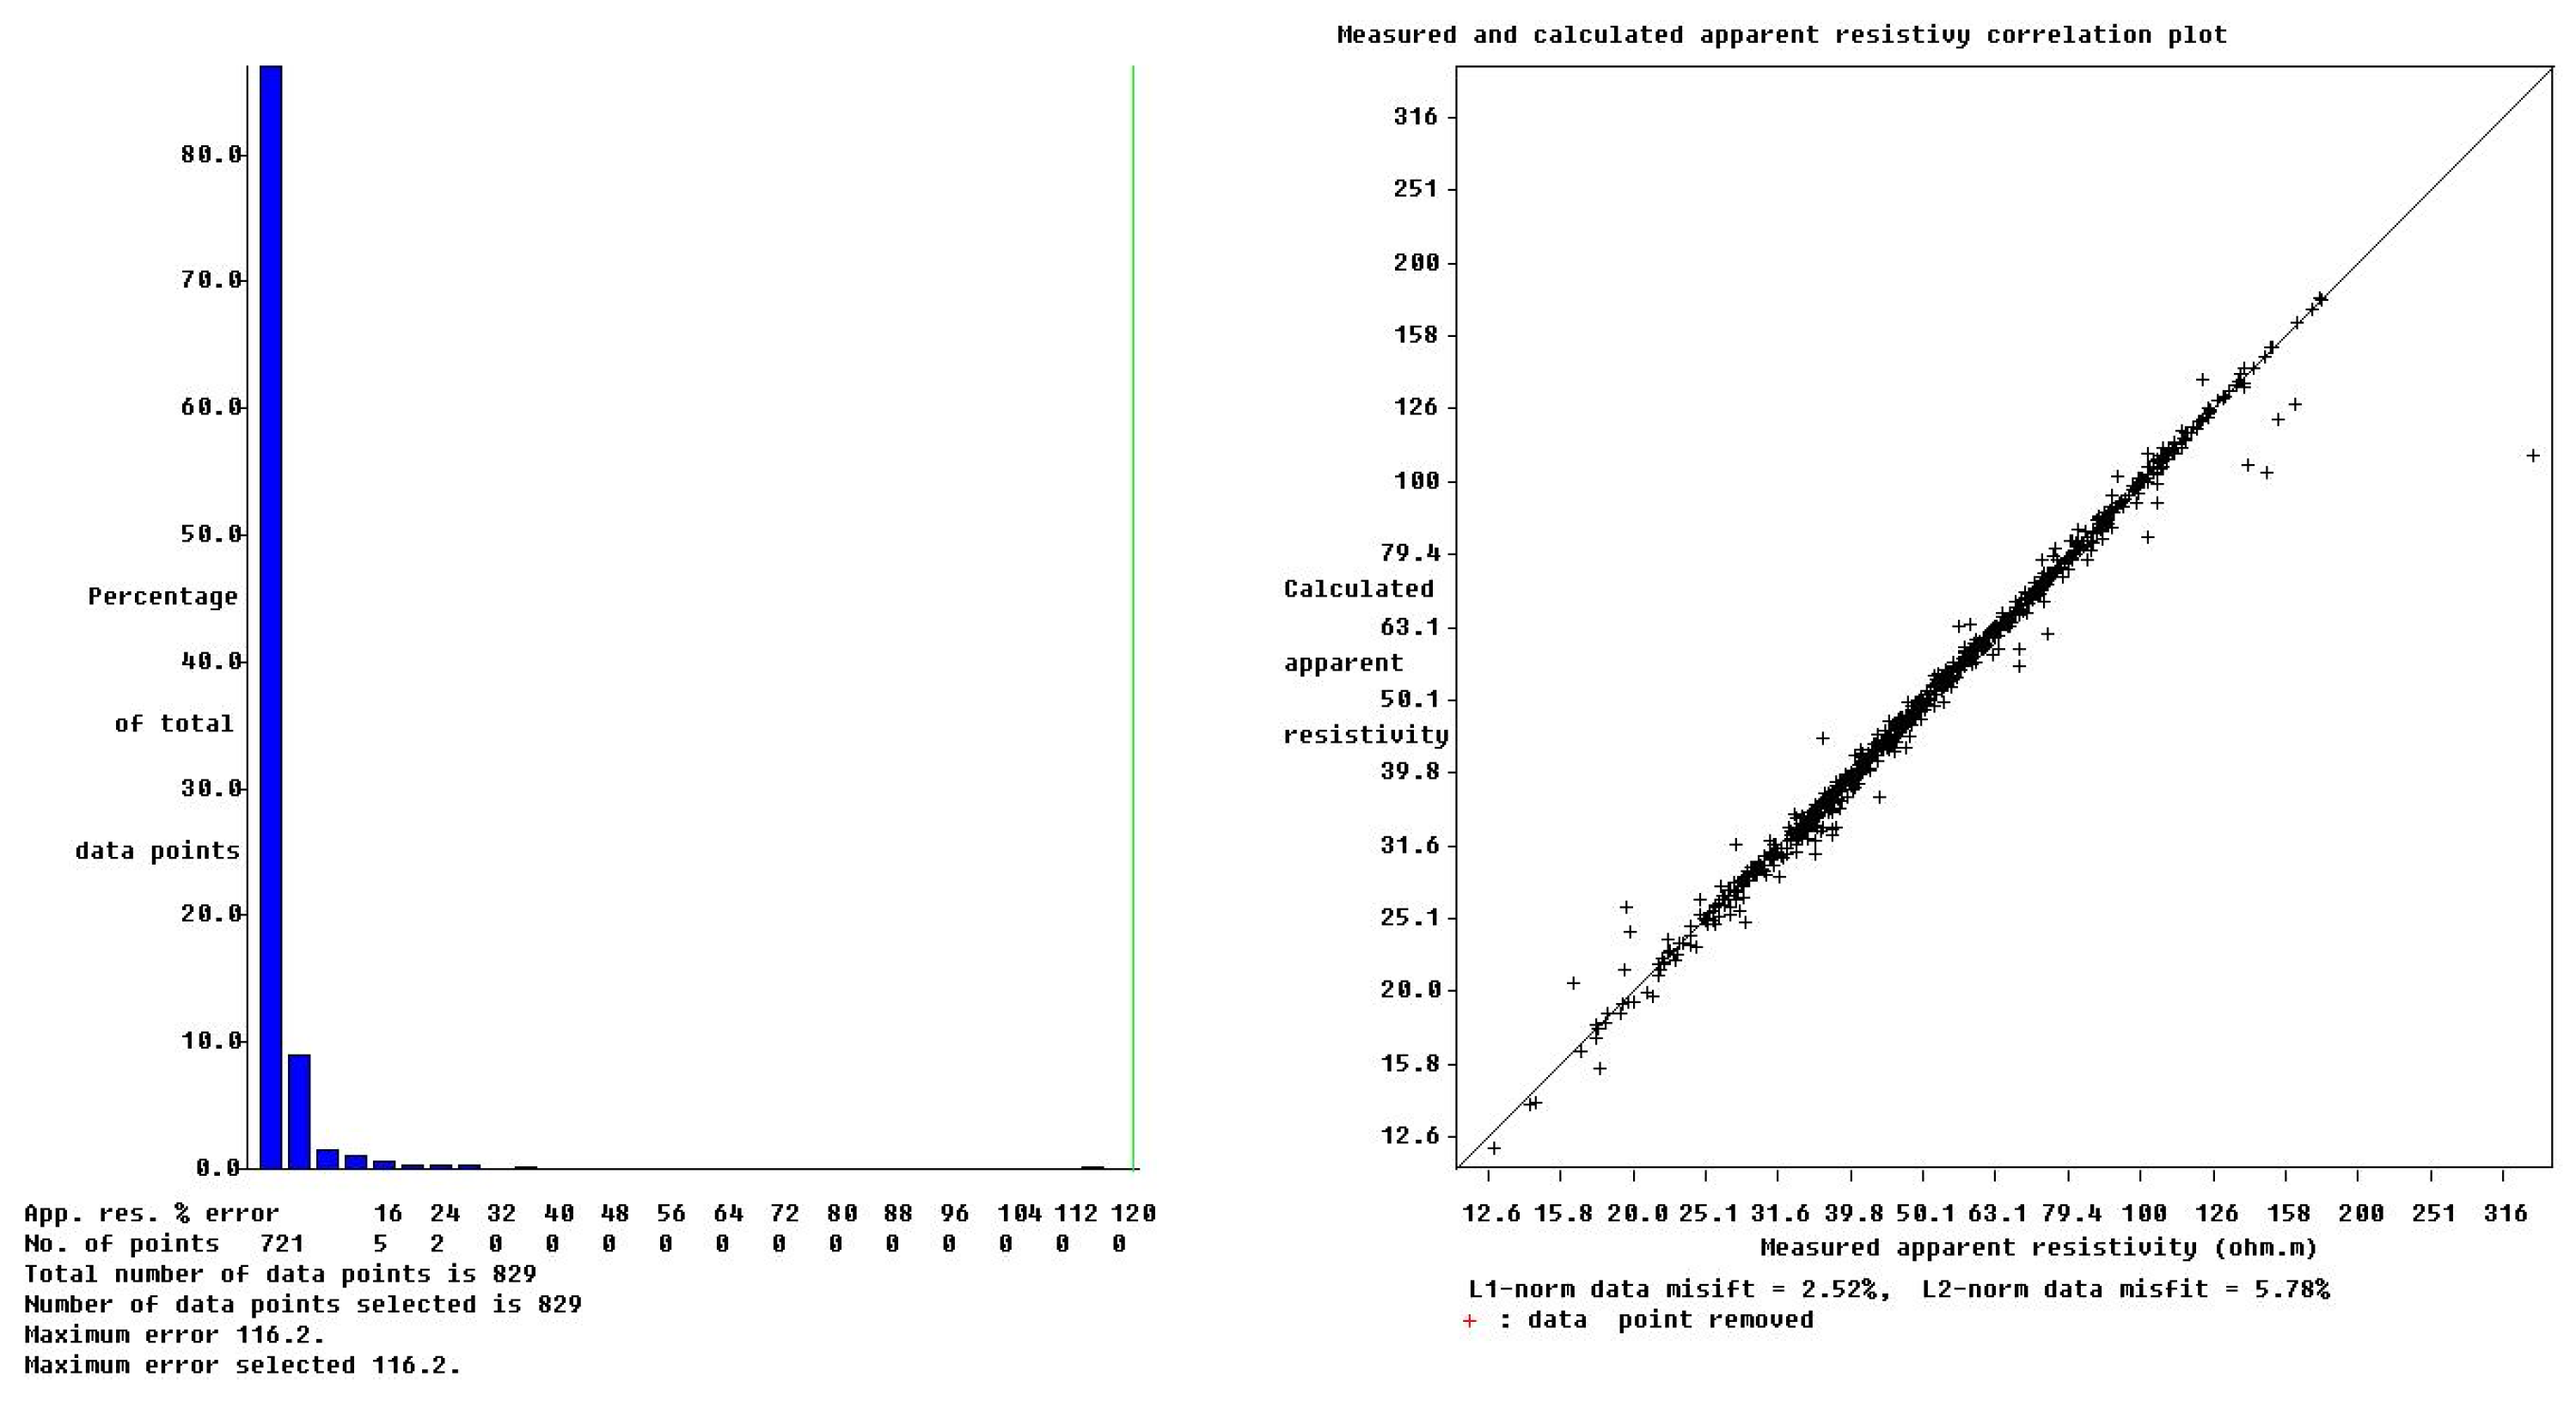
  • The results of the error analysis presented in Figure 15, Figure 16 and Figure 17 indicate that the quality of the performed measurements and the calculated 2D inversion model of the apparent resistivity distribution does not raise any objections in any of the three analysed cases; the percentage error of fitting the inversion model to the measurement results is within the range of 1.3–2.5%.
  • The in situ inspection of the Training Mine underground workings confirmed the periodical infiltration of surface water from precipitation. This indicates the possibility of the occurrence of mechanical scouring, which may intensify the sinkhole hazard due to the leaching of loose rock material into the underground workings.
  • It should be noted that the hazard assessment concerns the ground surface area in the immediate vicinity of the ERT survey profile. Due to the development of the area, it was not possible to carry out tests on other profiles, which would allow making a more extensive assessment of the hazard over the whole area of the underground workings complex.

5. Conclusions

This study has shown that the ERT method can be effectively used to assess the sinkhole threat in the post-mining areas, where shallow underground workings exist. The idea of the research focused on the assumption that above the roof of underground workings, some unfavourable phenomena may lead to the creation of a sinkhole on the surface. The two most critical cases should be taken into account:
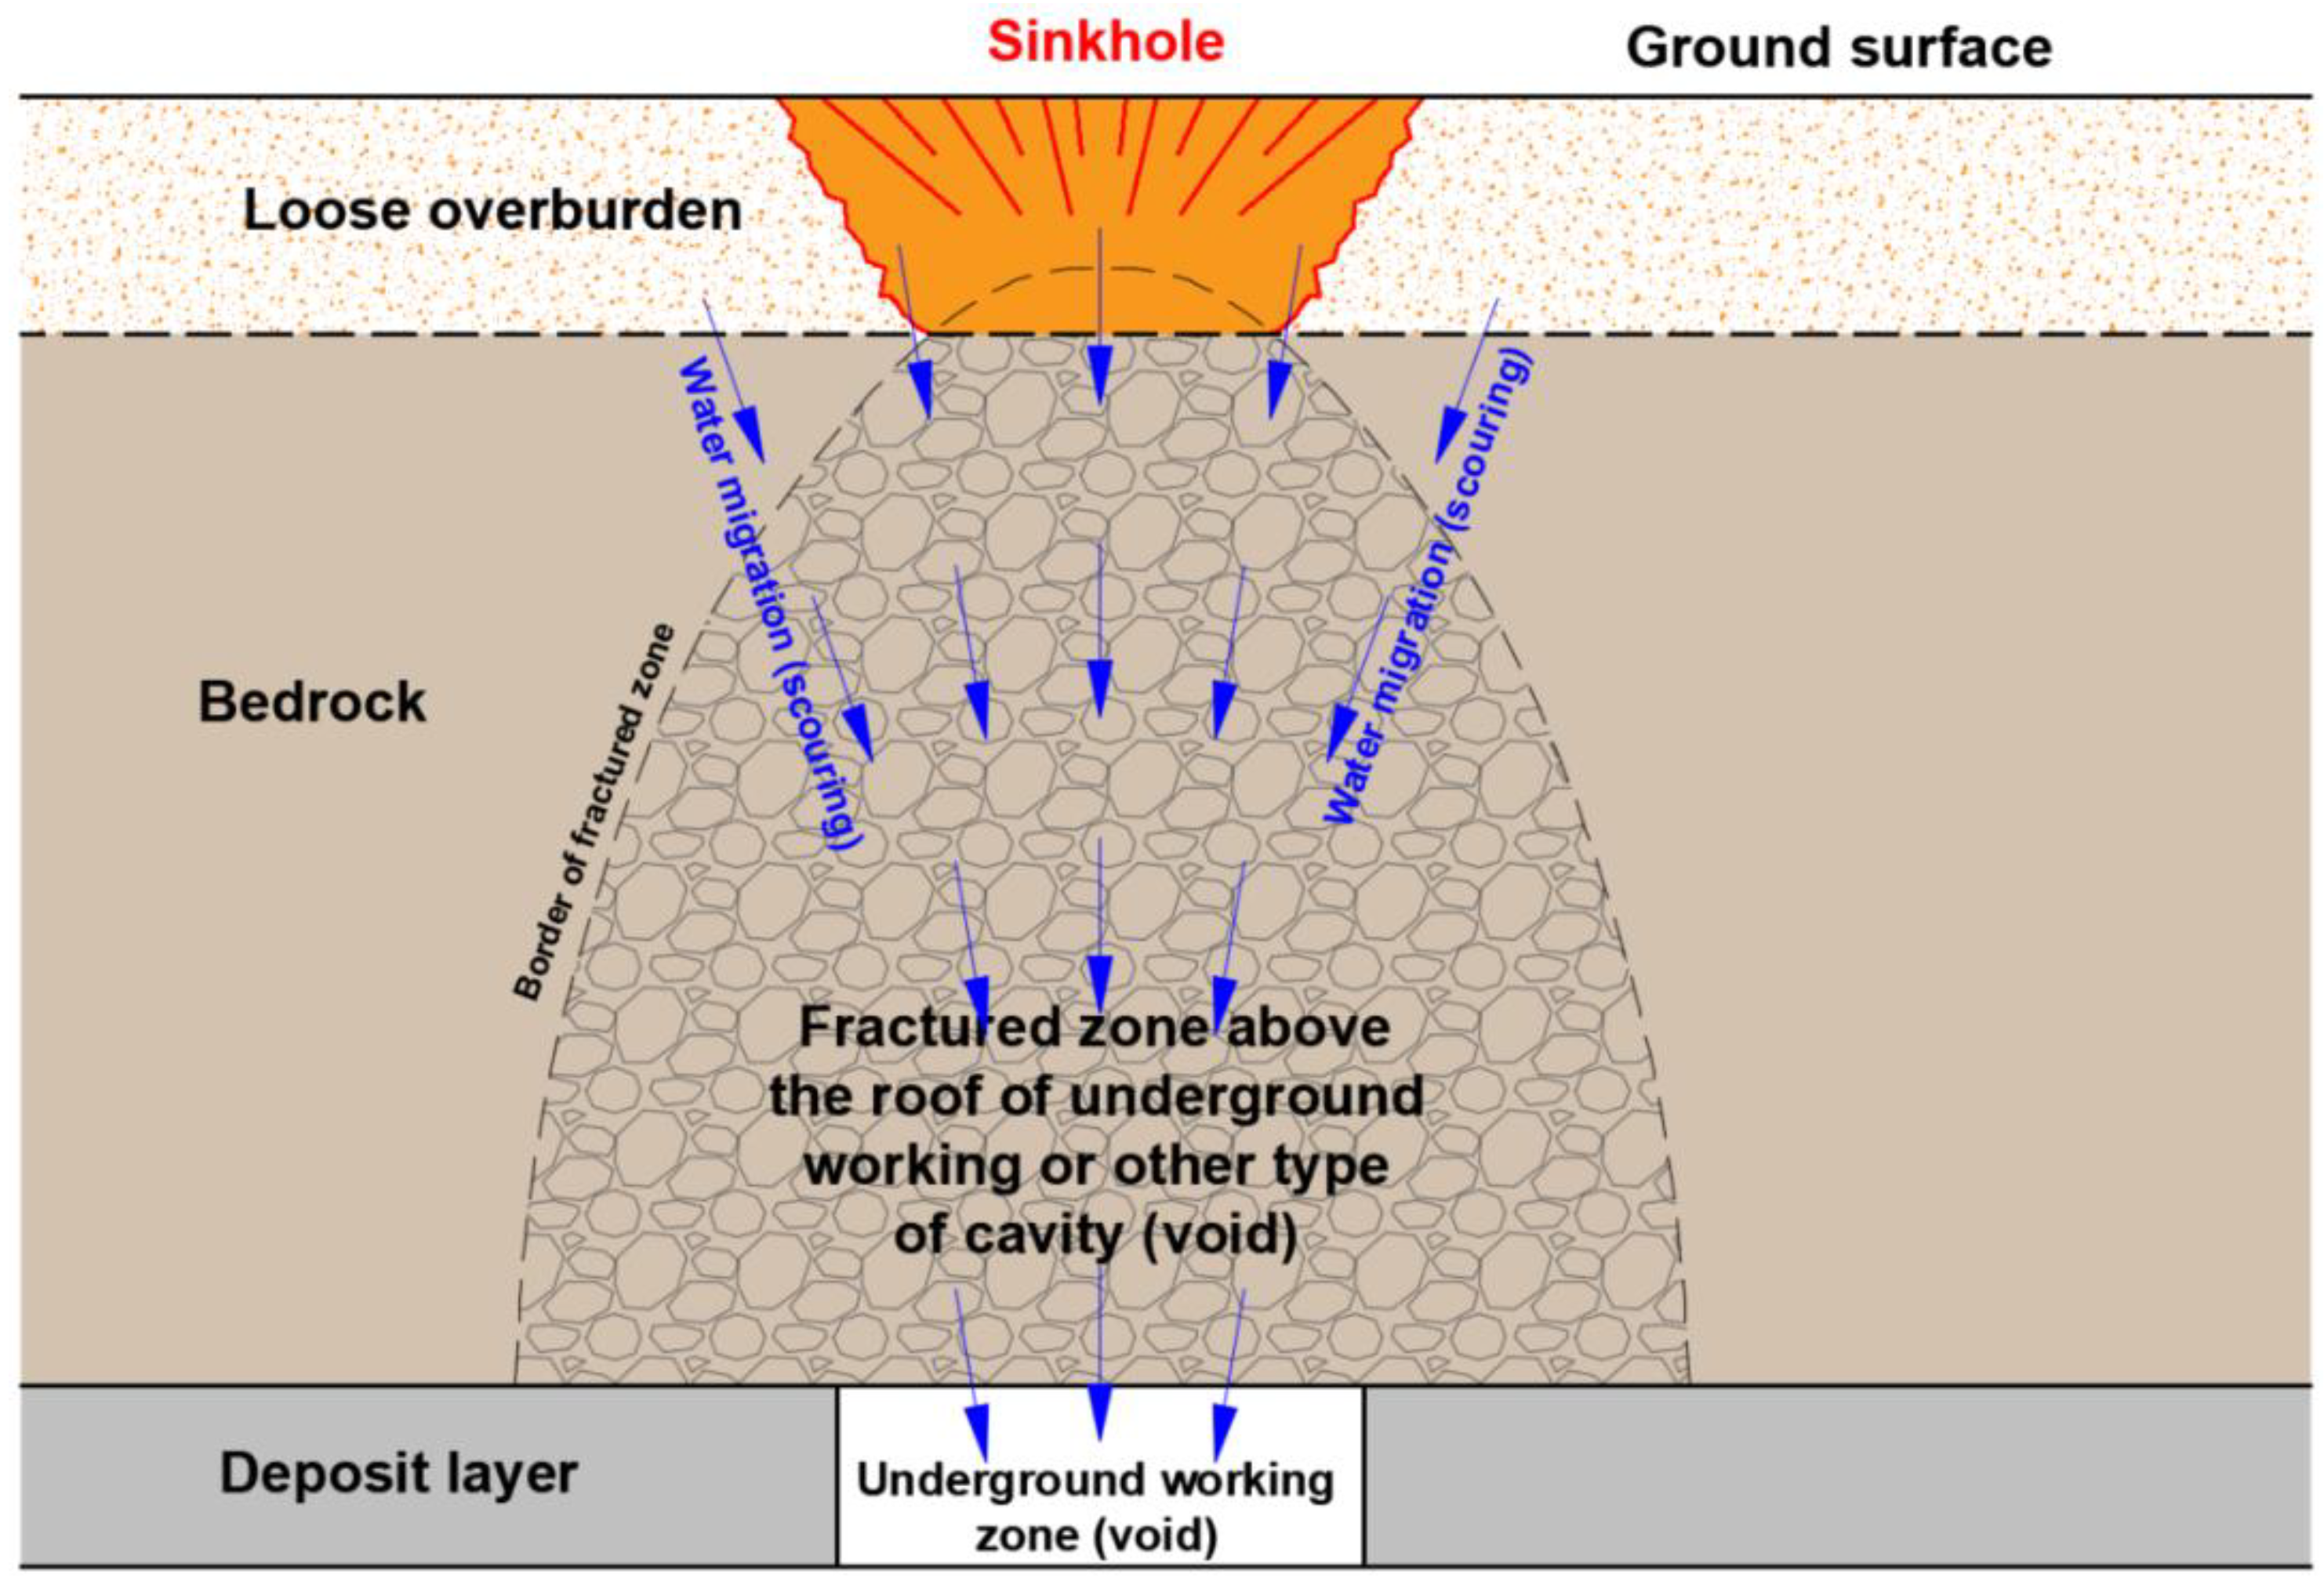
  • The creation of the fractured rock zone above the roof of the underground workings, which may favour the mechanical scouring (see Figure 1).
  • In the case of a loss of gallery support stability, the direct self-filling of the damaged working may be triggered.
Such processes may lead to the creation of a secondary void above the working, then migrating upwards, so it may initiate the process of a sinkhole creation on the surface.
In both cases, geophysical methods may help to recognise the existence of such shallow voids, or even loosened zones of fractured rocks, in non-destructive ways. The ERT method used in this study is, according to the authors, the most adequate one for such investigations.
The research carried out allows concluding that:
  • The ERT method is able to correctly detect voids or loose rock zones in the case of assessing the sinkhole threat in post-mining areas. Compared to other geophysical methods, it gives a reliable ratio between cost and effect.
  • The profiling performed in this study with the Dipole–Dipole array shows the most detailed picture of the apparent resistivity anomalies in the part of the rock mass between the roof of the underground workings and the ground surface when compared to the Wenner and Schlumberger arrays.
  • It should be kept in mind that in urbanised areas, problems arise with a possibly limited profile length constrained due to the existing elements of land development—buildings, roads, etc. The short profile lines significantly limit the depth of the current penetration, which will, of course, constrain the effective use of the ERT method for the recognition of deeper located cavities.
  • When planning the ERT profiling in an urbanised area, care should be taken to avoid the location of the profile in the vicinity of the underground infrastructure elements, such as steel pipelines, sewage systems, etc. They can significantly disturb the current flow inside the rock mass.
  • The continuation of investigations is planned in this area, aiming at assessing the periodical changes of the rock mass resistivity, which may help to empirically model the level of sinkhole threats.

Author Contributions

Conceptualisation, R.Ś.; methodology, K.S. and R.Ś.; software, R.Ś.; validation, R.Ś. and K.S.; formal analysis, R.Ś., K.S. and S.D.; investigation, R.Ś. and K.S.; resources, S.D. and R.Ś.; data curation, K.S.; writing—original draft preparation, S.D., R.Ś. and K.S.; writing—review and editing, G.D. and M.J.; visualisation, K.S. and M.K.; supervision, M.J. and G.D.; project administration, K.S., M.K. and G.D. All authors have read and agreed to the published version of the manuscript.

Funding

This research was funded by the Silesian University of Technology, Faculty of Mining, Safety Engineering and Industrial Automation, Gliwice, Poland (Grants No. 06/040/BK_20/0097 and 06/040/BK_21/1008).

Institutional Review Board Statement

Not applicable.

Informed Consent Statement

Not applicable.

Data Availability Statement

The data presented in this study are available on request from corresponding author.

Acknowledgments

The authors would like to thank the Silesian University of Technology, Gliwice, Poland, and the Training Mine–Museum “Sztygarka”, Dąbrowa Górnicza, Poland, for providing all the facilities and helping to perform the research work.

Conflicts of Interest

The authors declare no conflict of interest.

References

  1. Pilecki, Z. The role of geophysical methods in the estimation of sinkhole threat in the post-mining areas of shallow exploitation in the Upper Silesian Coal Basin, Poland. Miner. Resour. Manag. 2008, 24, 27–40. [Google Scholar]
  2. Strzałkowski, P. Sinkhole formation hazard assessment. Environ. Earth Sci. 2019, 78, 9. [Google Scholar] [CrossRef] [Green Version]
  3. Strzałkowski, P.; Ścigała, R.; Szafulera, K.; Kołodziej, K. Surface Deformations Resulting from Abandoned Mining Excavations. Energies 2021, 14, 2495. [Google Scholar] [CrossRef]
  4. Strzałkowski, P.; Ścigała, R. Assessment of post-mining terrain suitability for economic use. Int. J. Environ. Sci. Technol. 2020, 17, 3143–3152. [Google Scholar] [CrossRef] [Green Version]
  5. Ścigała, R.; Szafulera, K. Lokalizacja płytkich pustek pogórniczych z wykorzystaniem metod tomografii elektrooporowej. Bud. Górnicze I Tunelowe 2017, 4, 6–10. Available online: http://yadda.icm.edu.pl/baztech/element/bwmeta1.element.baztech-7c6f62da-2304-490d-85dd-038b3af95a7f (accessed on 30 November 2021).
  6. Kratzsch, H. Mining Subsidence Engineering; Springer: Berlin/Heidelberg, Germany; New York, NY, USA, 1983; p. 543. [Google Scholar]
  7. Whittaker, B.N.; Reddish, D.J. Subsidence. Occurrence, Prediction and Control; Elsevier: Amsterdam, The Netherlands, 1989; p. 528. [Google Scholar]
  8. Orwat, J. Depth of the mining exploitation and its progress in the time, and a random dispersion of observed terrain subsidence and their derivatives. IOP Conf. Ser. Earth Environ. Sci. 2019, 261, 012037. [Google Scholar] [CrossRef]
  9. Orwat, J.; Gromysz, K. Occurrence consequences of mining terrain surface discontinuous linear deformations in a residential building. J. Phys. Conf. Ser. 2021, 1781, 012013. [Google Scholar] [CrossRef]
  10. Ścigała, R.; Szafulera, K. Linear discontinuous deformations created on the surface as an effect of underground mining and local geological conditions—Case study. Bull. Eng. Geol. Environ. 2020, 79, 2059–2068. [Google Scholar] [CrossRef]
  11. Singh, K.B.; Dhar, B.B. Sinkhole subsidence due to mining. Geotech. Geol Eng 1997, 15, 327–341. [Google Scholar] [CrossRef]
  12. Chudek, M.; Arkuszewski, J.; Olaszowski, W. Deformacje Nieciągłe w Obszarach Górniczych; Research Journal of Silesian University of Technology: Gliwice, Poland, 1980. (In Polish) [Google Scholar]
  13. Strzałkowski, P.; Ścigała, R.; Szafulera, K.; Tomiczek, K. Forecasting of Discontinuous Deformations of Surface Type on the Mining and Post-Mining Areas; Publishing House of Silesian University of Technology: Gliwice, Poland, 2020; p. 127. [Google Scholar]
  14. Chudek, M. Rock Mass Mechanics with Basics of Environment Management in Mining and Post-Mining Areas; Publishing House of Silesian University of Technology: Gliwice, Poland, 2010; p. 499. [Google Scholar]
  15. Strzałkowski, P. The influence of selected mining and natural factors on the sinkhole creation hazard based on the case study. Environ. Earth Sci. 2021, 80, 117. [Google Scholar] [CrossRef]
  16. Duży, S.; Preidl, W. Deformacje nieciągłe na obszarze kopalni ćwiczebnej “Sztygarka” w Dąbrowie Górniczej. Górnictwo i Geologia 2011, 6, 59–73. [Google Scholar]
  17. Bell, F.G. Land development. State of the art in the location of old mine shafts. Bull. Inst. Ass. Eng. Geol. 1988, 37, 91–98. [Google Scholar] [CrossRef]
  18. Hunter, J. Old mines and new sinkholes along the Hucklow Edge vein, Derbyshire. Am. Geol. 2015, 18, 213–226. [Google Scholar]
  19. Stałęga, S. Principles of Liquidation of Shafts and Surrounding Workings in Hard Coal Mines. In Technical Handbook; Publishing House of Central Mining Institute: Katowice, Poland, 1988. [Google Scholar]
  20. Lecomte, A.; Salmon, R.; Yang, W.; Marshall, A.; Purvis, M.; Prusek, S.; Bock, S.; Gajda, L.; Dziura, J.; Niharra, A.M. Case studies and analysis of mine shafts incidents in Europe. In Proceedings of the 3rd International Conference on Shaft Design and Construction (SDC 2012), London, UK, 22–28 April 2012; Available online: https://hal-ineris.archives-ouvertes.fr/ineris-00973661/document (accessed on 21 May 2021).
  21. Ma, F.; Deng, Q.; Cunningham, D.; Yuan, R.; Zhao, H. Vertical shaft collapse at the Jinchuan Nickel Mine, Gansu Province, China: Analysis of contributing factors and causal mechanisms. Environ. Earth Sci. 2013, 69, 21–28. [Google Scholar] [CrossRef]
  22. Longoni, L.; Papini, M.; Brambilla, D.; Arosio, D.; Zanzi, L. The risk of collapse in abandoned mine sites: The issue of data uncertainty. Open Geosci. 2016, 8, 246–258. [Google Scholar] [CrossRef]
  23. Hutcheson, S.M.; Kipp, J.A.; Dinger, J.S.; Carey, D.I.; Sendlein, L.V.A.; Secrist, G.L. Effects of Longwall Mining on Hydrogeology, Leslie County, Kentucky Part 3: Post-Mining Conditions; University of Kentucky: Lexington, KY, USA, 2018. [Google Scholar]
  24. Lagny, C. The emissions of gases from abandoned mines: Role of atmospheric pressure changes and air temperature on the surface. Environ. Earth Sci. 2014, 71, 923. [Google Scholar] [CrossRef] [Green Version]
  25. Cardarelli, E.; Marrone, C.; Orlando, L. Evaluation of tunnel stability using integrated geophysical methods. J. Appl. Geophys. 2003, 52, 93–102. [Google Scholar] [CrossRef]
  26. Fajklewicz, Z. Applied Gravimetry; AGH University of Science and Technology Press: Kraków, Poland, 2007; p. 434. [Google Scholar]
  27. Loke, M.H.; Barker, R.D. Practical techniques for 3D resistivity surveys and data inversion. Geophys. Prospect. 1996, 44, 499–523. [Google Scholar] [CrossRef]
  28. Loj, M.; Porzucek, S. Detailed analysis of the gravitational effects caused by the buildings in microgravity survey. Acta Geophys. 2019, 67, 1799–1807. [Google Scholar] [CrossRef] [Green Version]
  29. Loj, M. Microgravity monitoring discontinuous terrain deformation in a selected area of shallow coal extraction. In Proceedings of the 14th International Multidisciplinary Scientific GeoConference SGEM, Albena, Bulgary, 17–26 June 2014; Volume 1, pp. 521–528. [Google Scholar]
  30. Madej, J. Gravity surveys for assessing rock mass condition around a mine shaft. Acta Geophys. 2017, 65, 465–479. [Google Scholar] [CrossRef] [Green Version]
  31. Pringle, J.K.; Styles, P.; Howell, C.P.; Branston, M.W.; Furner, R.; Toon, S.M. Long-term time-lapse microgravity and geotechnical monitoring of relict salt mines, Marston, Cheshire, UK. Geophysics 2012, 77, B287–B294. [Google Scholar] [CrossRef]
  32. Van Schoor, M. Detection of sinkholes using 2D electrical receptivity imaging. J. Appl. Geofizy. 2002, 50, 393–399. [Google Scholar] [CrossRef] [Green Version]
  33. WWW Site. Available online: https://muzeum-dabrowa.pl (accessed on 30 November 2021).
  34. GF Instruments. ARES II—Automatic Resistivity and IP System; GF Instruments: Brno, Czech Republic, 2014; Available online: http://www.gfinstruments.cz (accessed on 30 November 2021).
  35. Loke, M.H. Electrical Imaging Surveys for Environmental and Engineering Studies, a Practical Guide to 2-D and 3-D Surveys; Minden Heights: Penang, Malaysia, 1997–1999. [Google Scholar]
Figure 1. The common mechanism of sinkhole creation due to the existence of a shallow underground void.
Energies 14 08197 g001
Figure 2. The location of the studied area with marked underground excavations.
Energies 14 08197 g002
Figure 3. The cross-section B–B.
Energies 14 08197 g003
Figure 4. The general look over the area of study.
Energies 14 08197 g004
Figure 5. The location of cover-subsidence sinkholes confirmed during the revision in the year 2011 [16].
Energies 14 08197 g005
Figure 6. The flowchart of works performed during the ERT survey.
Energies 14 08197 g006
Figure 7. The location of the ERT profile in relation to the surface development.
Energies 14 08197 g007
Figure 8. The location of the ERT survey profile in relation to the underground workings.
Energies 14 08197 g008
Figure 9. The distribution of bad data points (red circles) for the survey performed with the Wenner α array.
Energies 14 08197 g009
Figure 10. The distribution of bad data points (red circles) for the survey performed with the Wenner–Schlumberger array.
Energies 14 08197 g010
Figure 11. The distribution of bad data points (red circles) for the survey performed with the Dipole–Dipole array.
Energies 14 08197 g011
Figure 12. The distribution of the apparent resistivity based on the measurement with the Wenner α array.
Energies 14 08197 g012
Figure 13. The distribution of the apparent resistivity based on the measurement with the Wenner–Schlumberger array.
Energies 14 08197 g013
Figure 14. The distribution of the apparent resistivity based on the measurement with the Dipole–Dipole array.
Energies 14 08197 g014
Figure 15. The results of the statistical analysis of errors in fitting the inversion model to the apparent resistivity distribution measured with the Wenner α array.
Energies 14 08197 g015
Figure 16. The results of the statistical analysis of errors in fitting the inversion model to the apparent resistivity distribution measured with the Wenner–Schlumberger array.
Energies 14 08197 g016
Figure 17. The results of the statistical analysis of errors in fitting the inversion model to the apparent resistivity distribution measured with the Dipole–Dipole array.
Energies 14 08197 g017
Figure 18. The location of the resistivity anomalies along the ERT profile (measurement with the Dipole–Dipole array) against the workings and the sinkholes recorded during the 2011 inspection.
Energies 14 08197 g018
Publisher’s Note: MDPI stays neutral with regard to jurisdictional claims in published maps and institutional affiliations.

