
Energy and Economic Assessment of Energy Efficiency Options for Energy Districts: Case Studies in Italy and Egypt

 , , ,
, , ,  ,
,  and
and 
Abstract
:1. Introduction
- This paper analyzes the energy, environmental and economic performances of several energy measures for two districts with different climate—namely, cold paint adoption, boiler replacement and a renewable option based on the evacuated solar collector.
- The analysis of the energy performance of cold paint for a high-irradiance country (Egypt), highlighting how the solar gain affects the district energy demand.
- The comparison of the performance of the renewable energy options in Naples and Fayoum, highlighting the potentials for reducing the environmental impact of residential districts.
- The present work is able to provide a green pathway for achieving a sustainable residential district with a very low primary energy consumption.
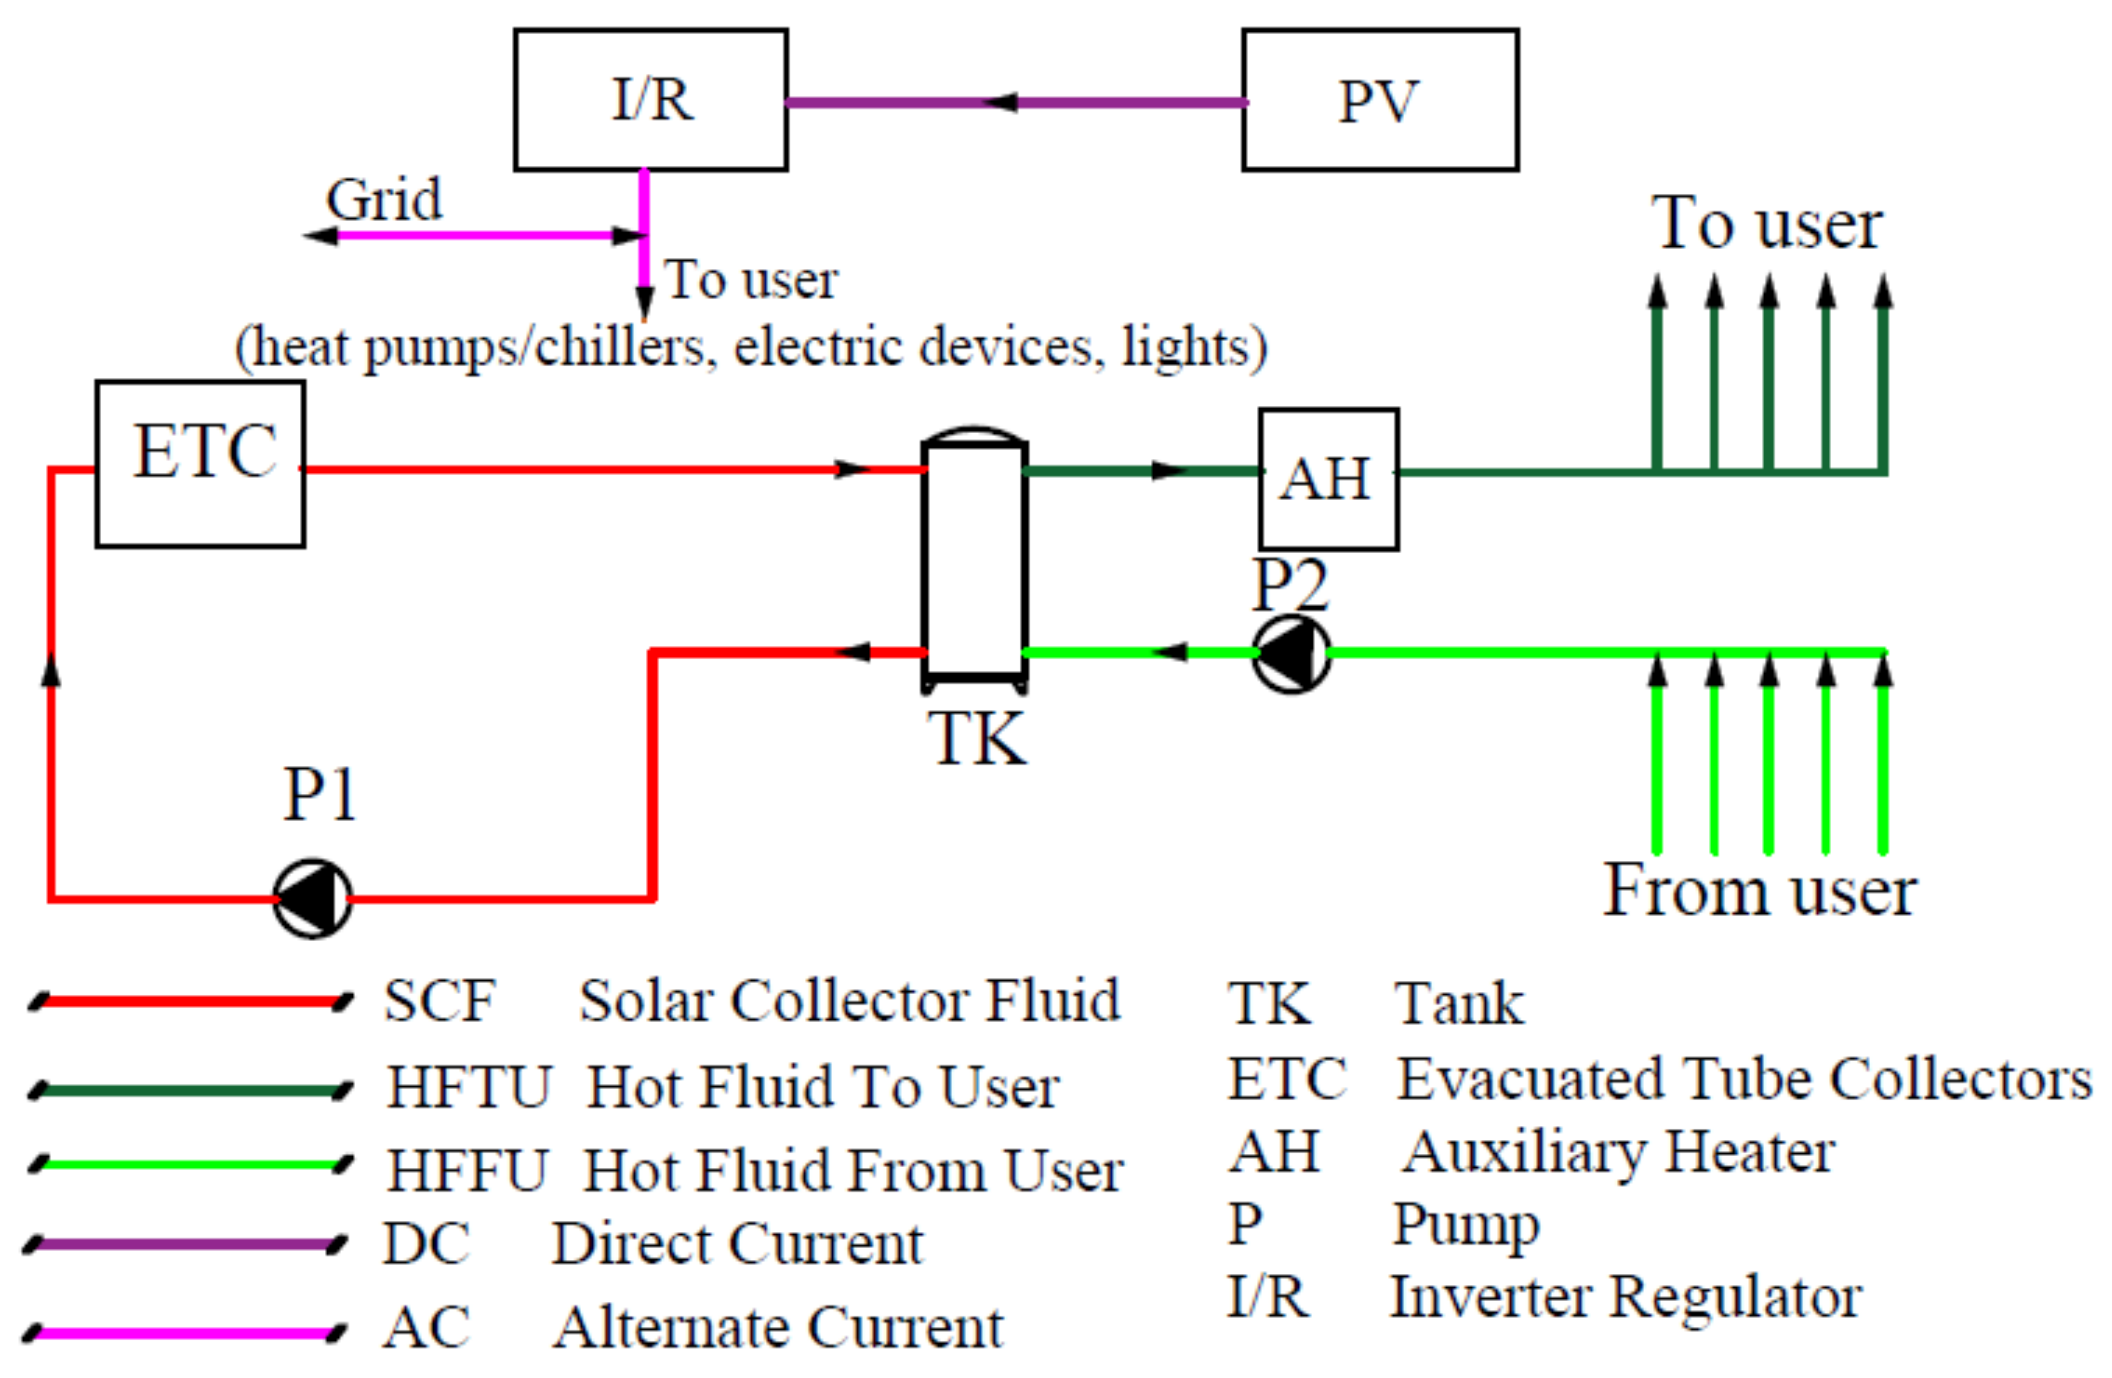
2. System Layout
3. System Models
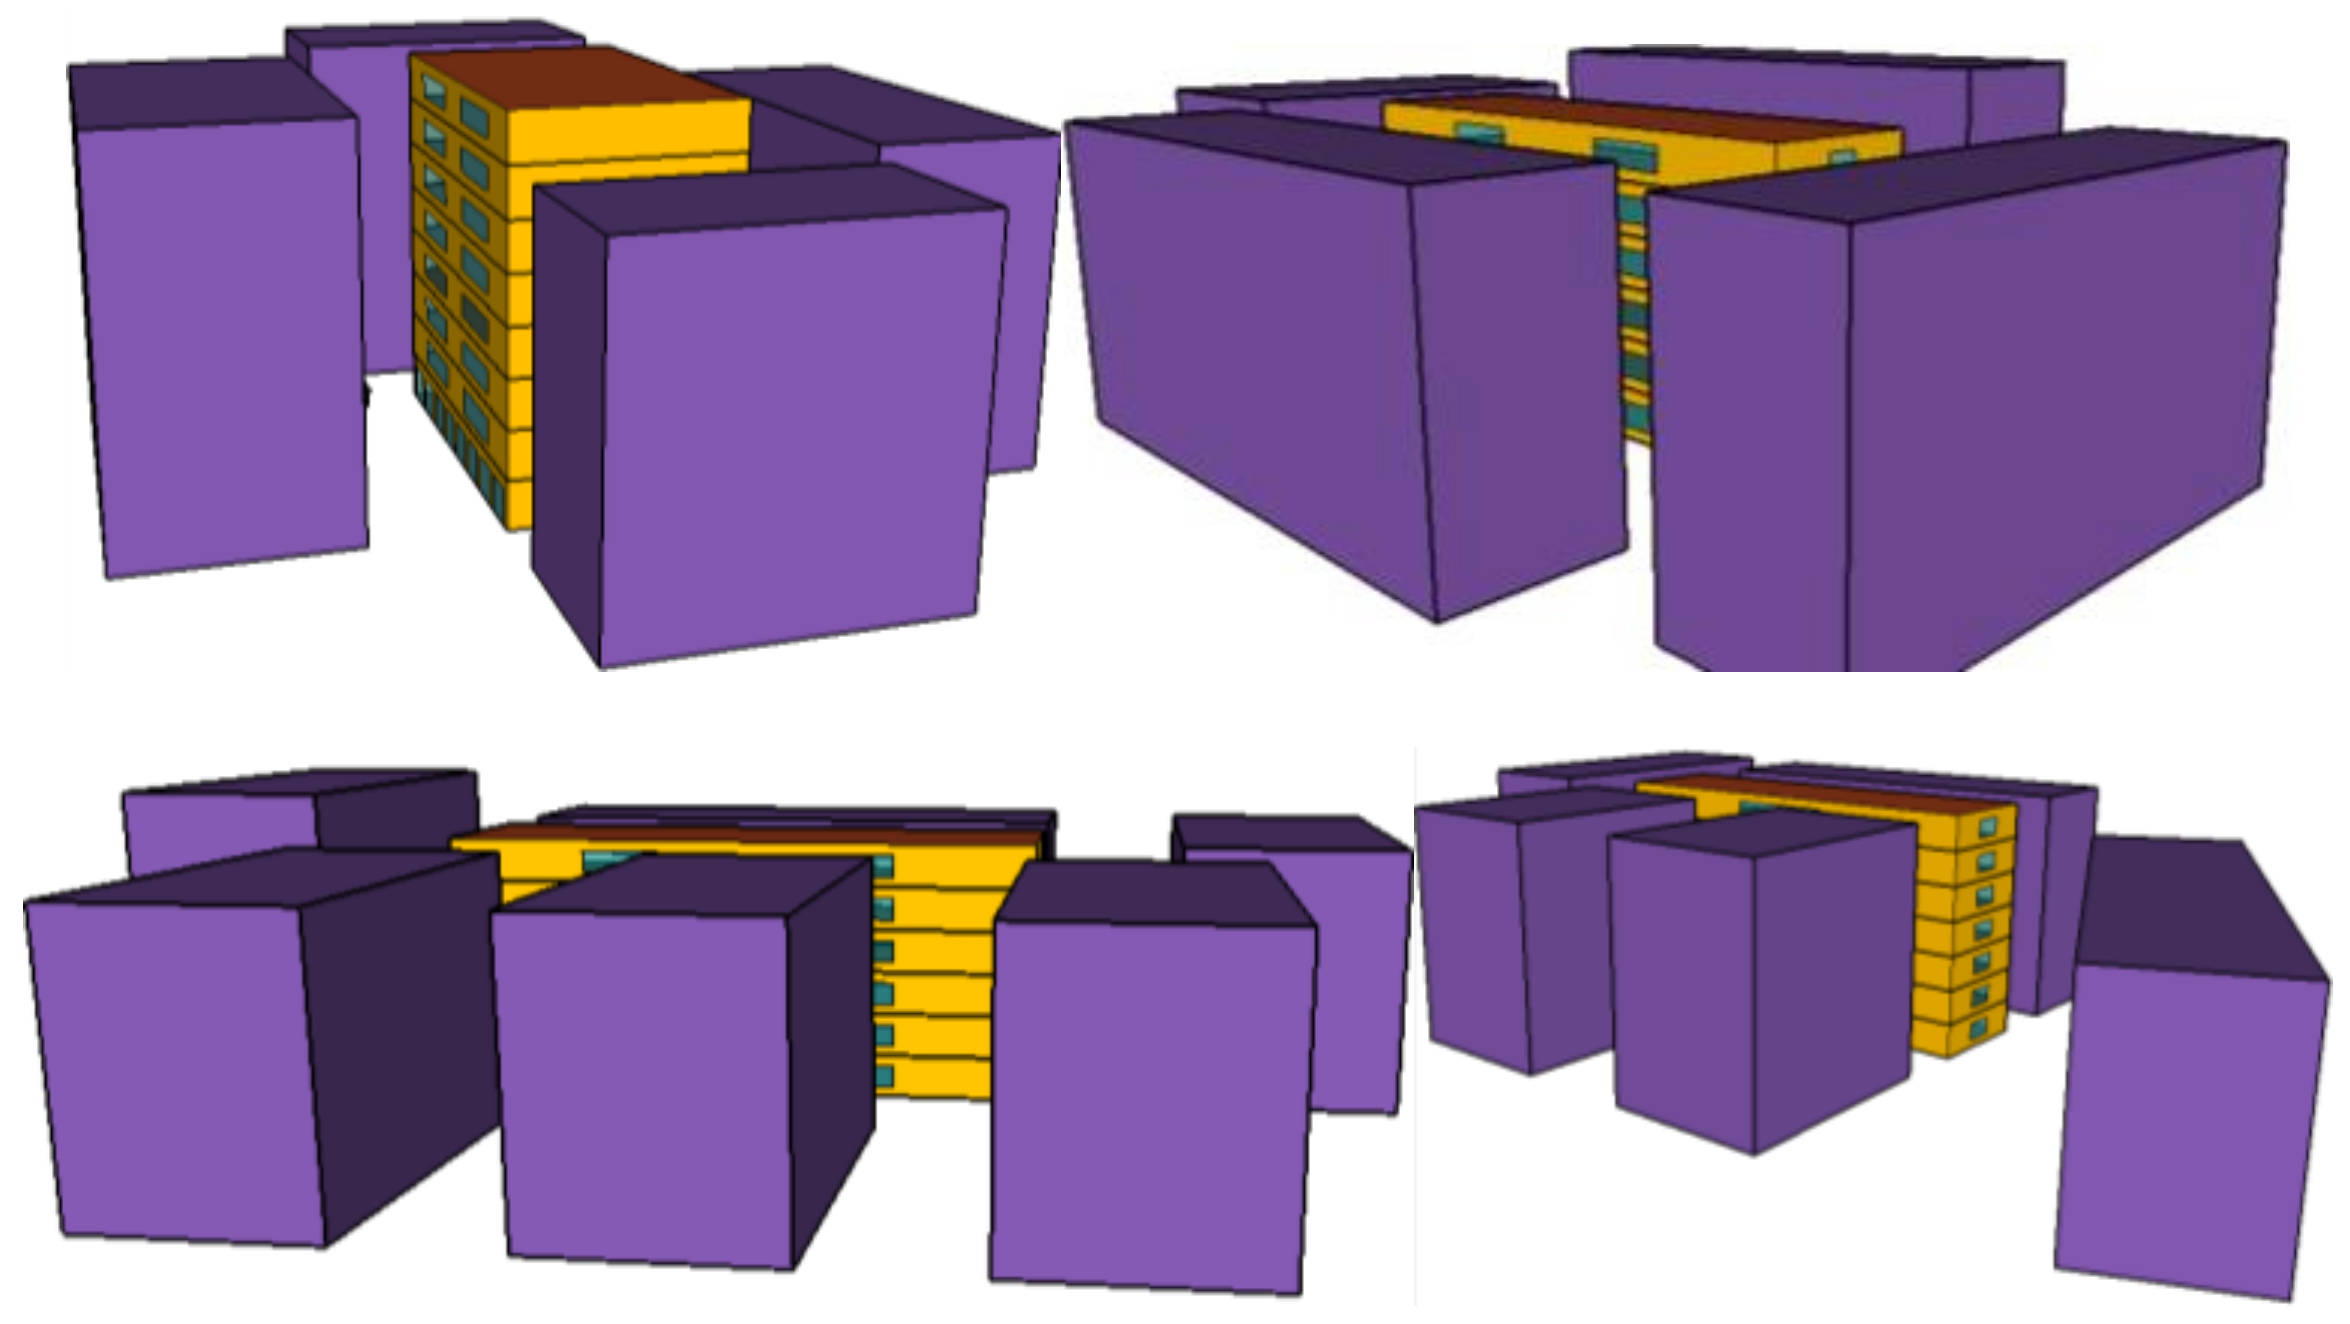
- Type 56: This library takes the building’s 3D geometry, the thermophysical proprieties of the envelope and the effects of the environment into account to dynamically evaluate the energy performance of the building. Reference [25] provides a detailed description of this library.
- Type 94: This library models the PV panel performance using the “four parameters” method [25].
Thermoeconomic Model

| Parameter | Description | Value (Unit) | |
|---|---|---|---|
| Cwindows | Replacement cost of windows per m2 | 300 (€/m2) | |
| CCP | Cool paint cost per m2 | 2.91 (€/m2) [30] | |
| CCB,aux | Cost of auxiliary condensing boiler | 40 (€/kWth) | |
| CETC | Capital cost of ETC unit per m2 of solar plant | 300 (€/m2) [5] | |
| CPV | Capital cost of PV unit per kWel | 1000 (€/kWel) [31] | |
| CTK | The tank cost | (€) [32] | |
| Cpumps | small | The small pumps costs | (€) [33] |
| 40 m3/h | The Salmson pump cost (40 m3/h) | 1490 (€/pump) [34] | |
| 80 m3/h | The Salmson pump cost (80 m3/h) | 1900 [€/pump) [34] | |
| Cpiping | Piping cost for district heating network | 33 (€/m) [28] | |
| Jel,fromGRID (Naples) | Purchasing price of electric energy | 0.18 (€/kWh) | |
| Jel,toGRID (Naples) | Selling price electric energy | 0.07 (€/kWh) | |
| JNG (Naples) | Purchasing price of natural gas | 0.88 (€/Sm3) | |
| Jel,fromGRID (Fayoum) | Purchasing price of electric energy | 0.0764 (€/kWh) | |
| Jel,toGRID (Fayoum) | Selling price electric energy | 0.07 (€/kWh) | |
| JNG (Fayoum) | Purchasing price of natural gas | 0.1186 (€/Sm3) | |
| mETC | Annual maintenance cost ETC | 2 (%/year) | |
| mPV | Annual maintenance cost for PV | 1.5 (%/year) | |
| LHVNG | Lower heating value of natural gas | 9.59 (kWh/Sm3) | |
| ηel (Naples) | Efficiency of conventional electric power plant | 46 (%) | |
| ηel (Fayoum) | Efficiency of conventional electric power plant | 45.9 (%) | |
| ηB | Efficiency of natural gas boiler | 75 (%) | |
| ηCB | Efficiency natural gas condensing boiler | 95 (%) | |
| FNG | Equivalent CO2 emissions coefficient for natural gas | 0.20 (kgCO2/kWhPE) | |
| Fel (Naples) | Equivalent CO2 emissions coefficient for electricity in Naples | 0.48 (kgCO2/kWhel) | |
| Fel (Fayoum) | Equivalent CO2 emissions coefficient for electricity in Fayoum | 0.431 (kgCO2/kWhel) | |
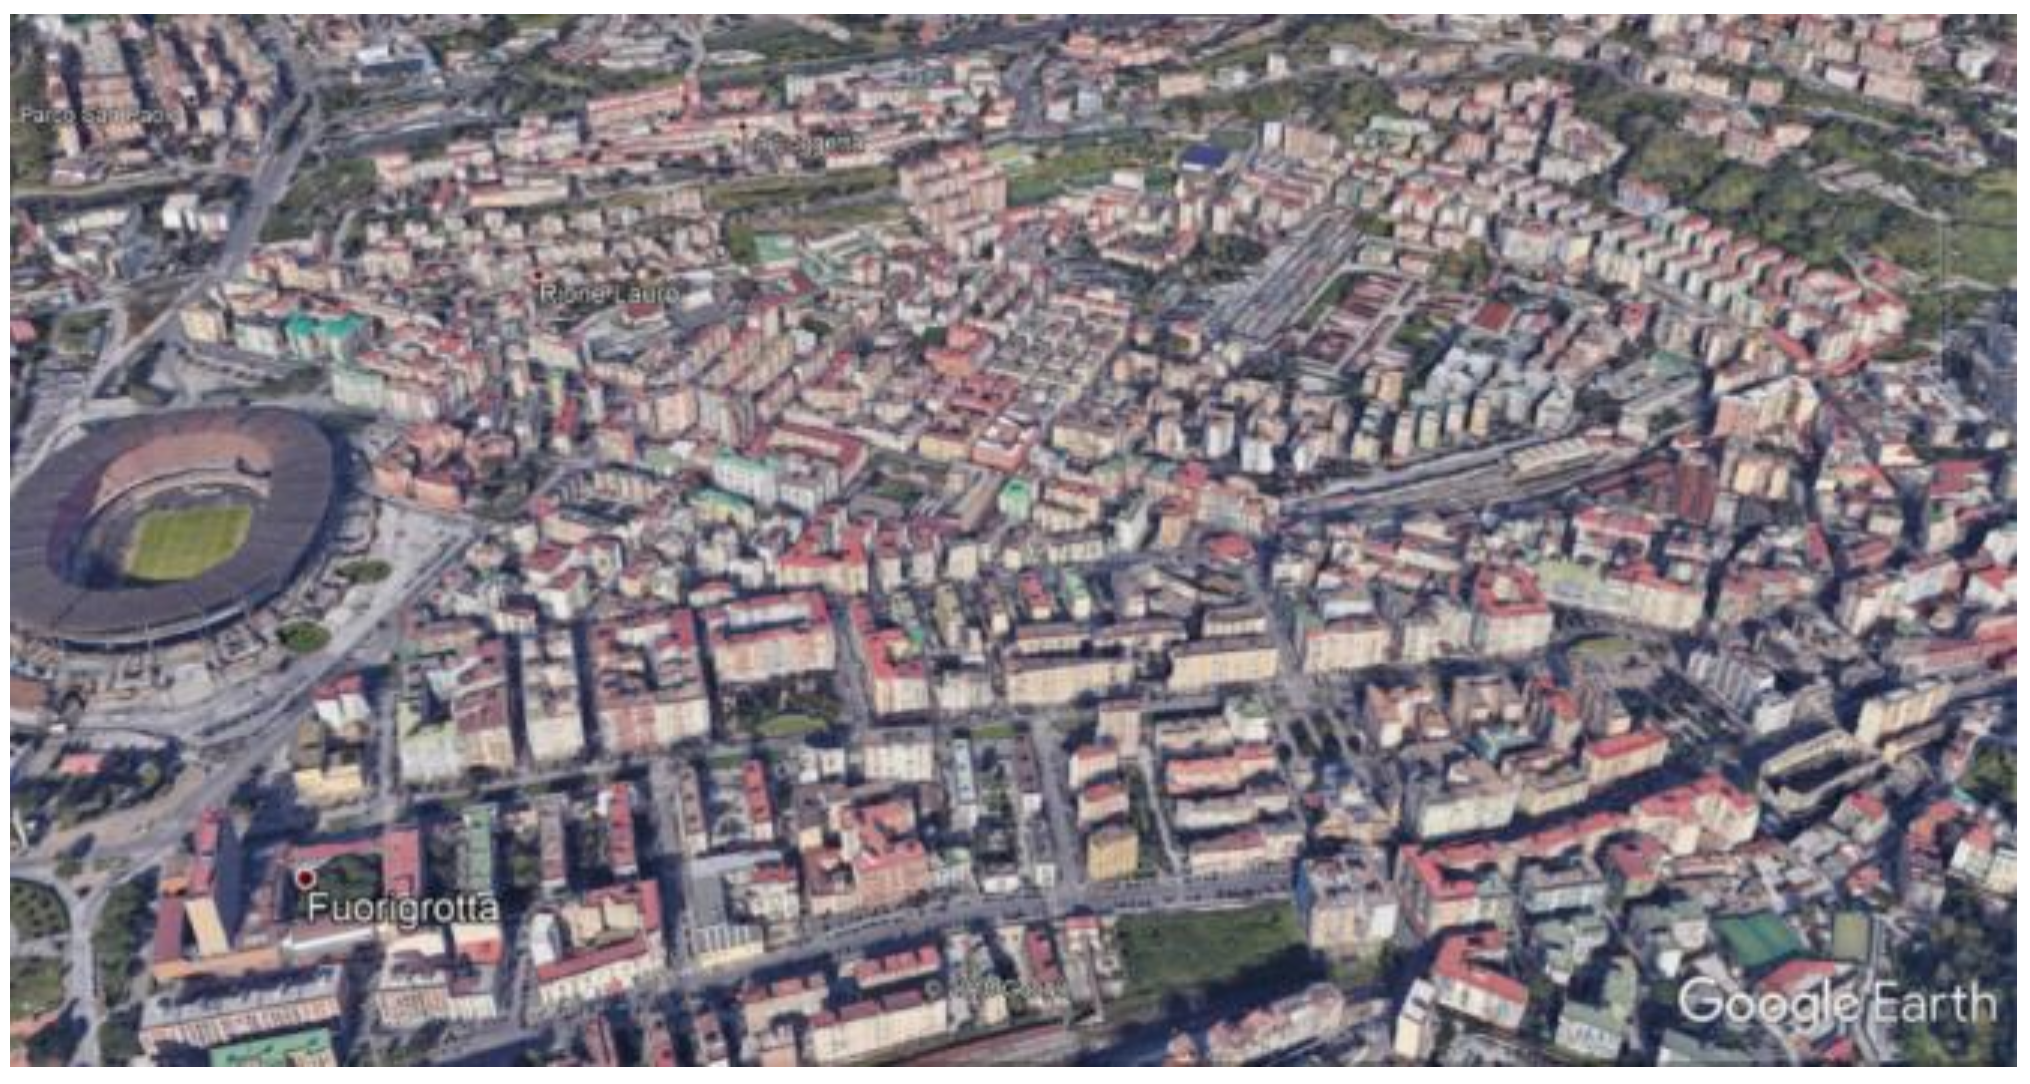
4. Case Study
5. Results and Discussion
5.1. Balance of Energy, Economics and Environment
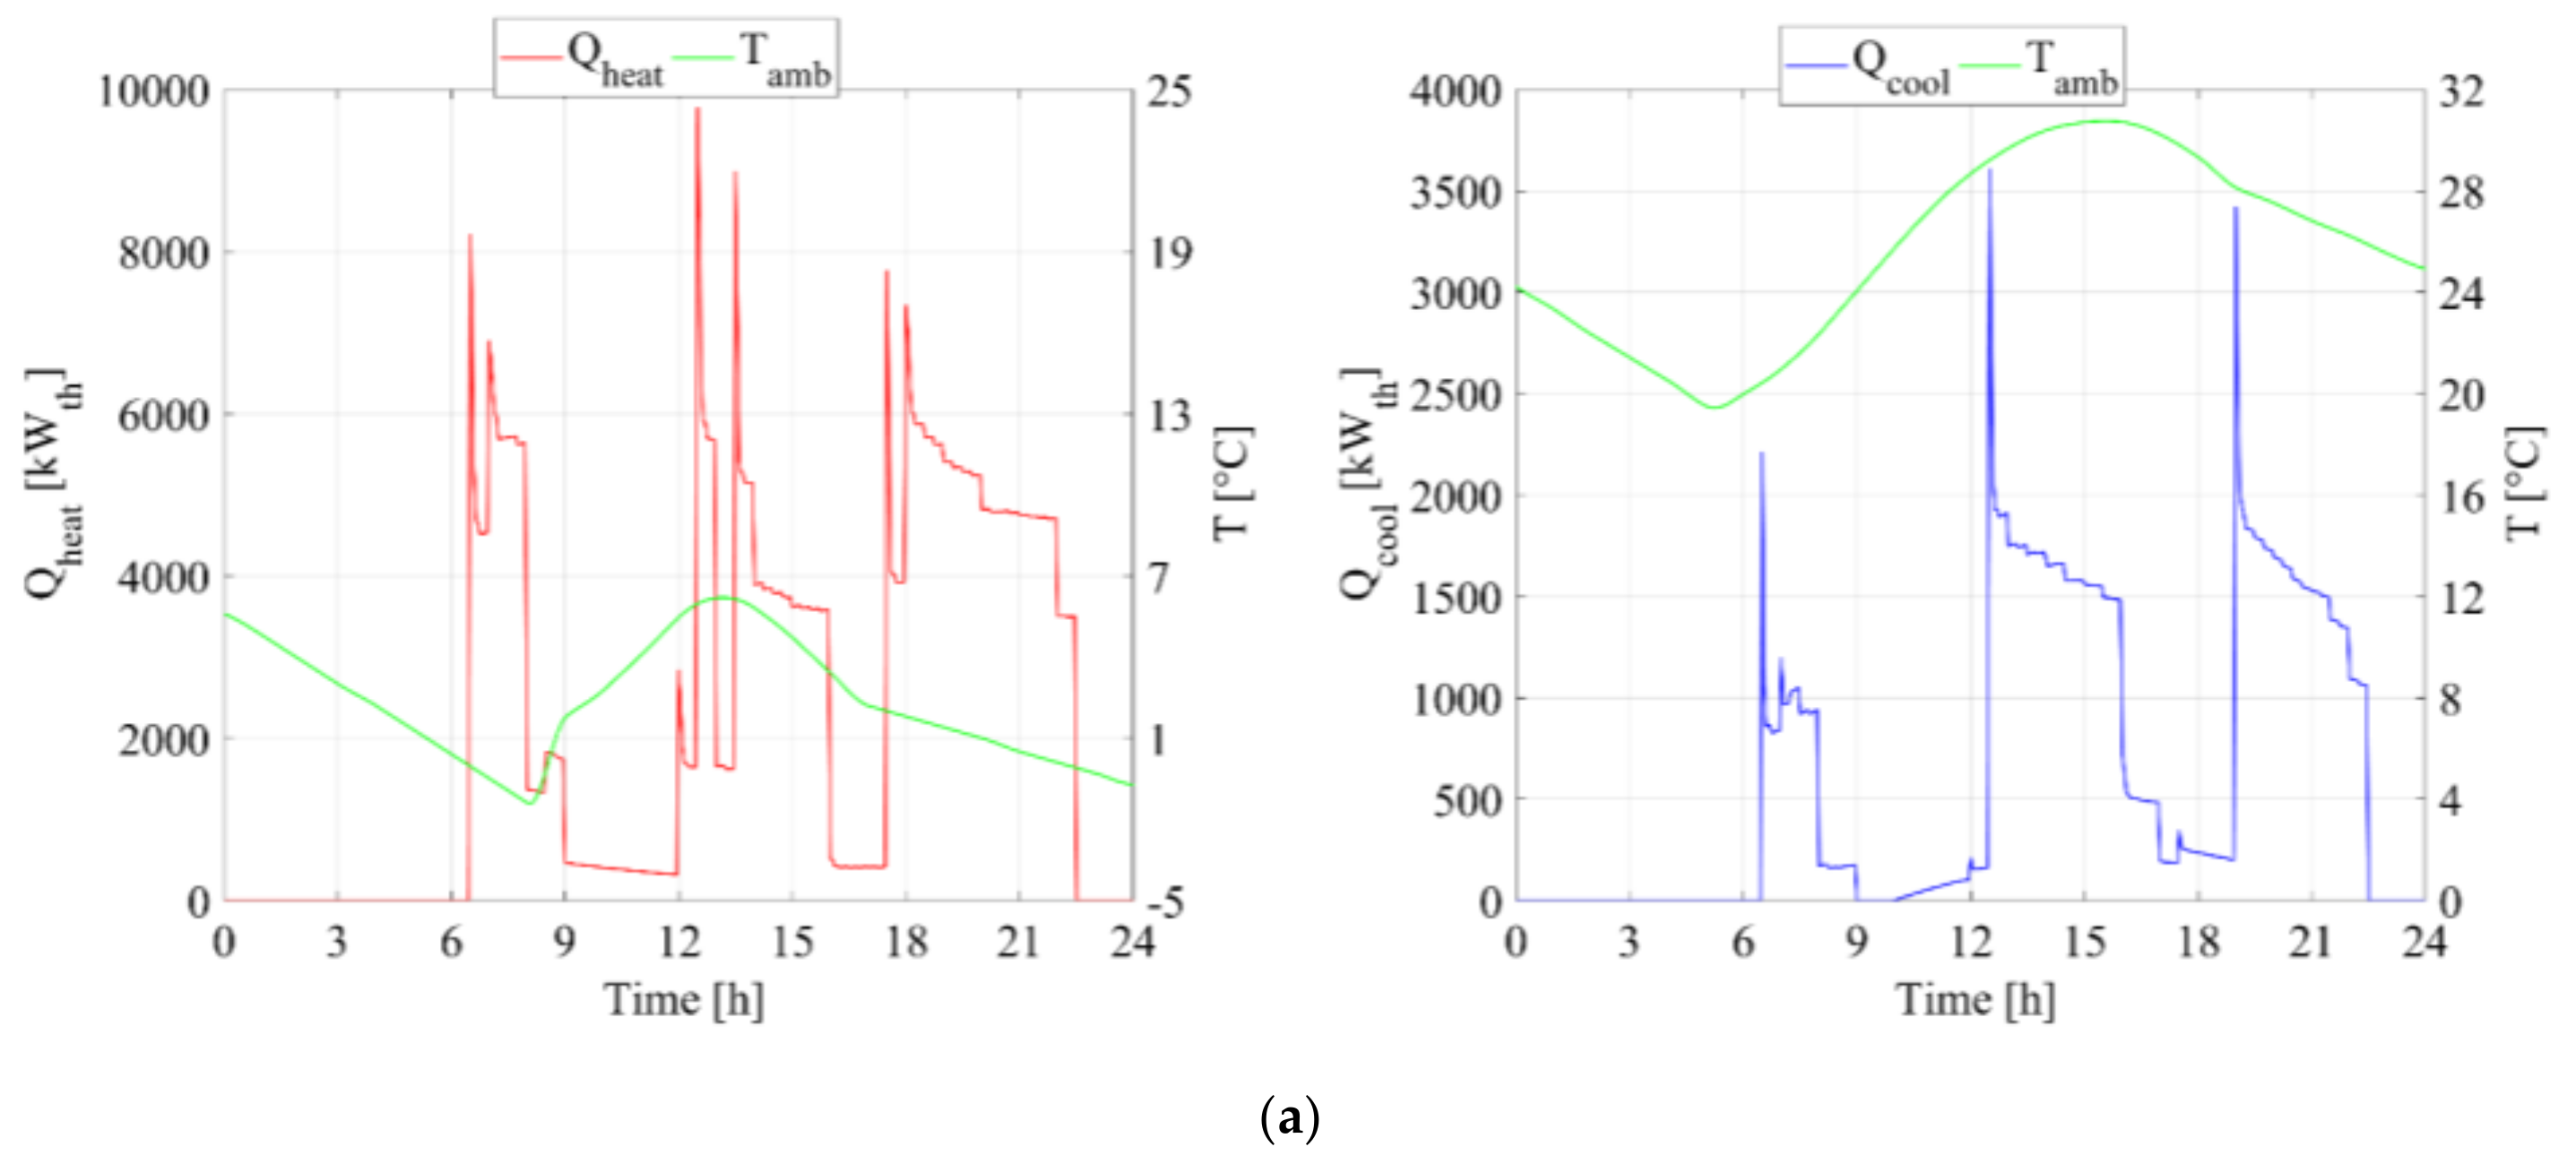
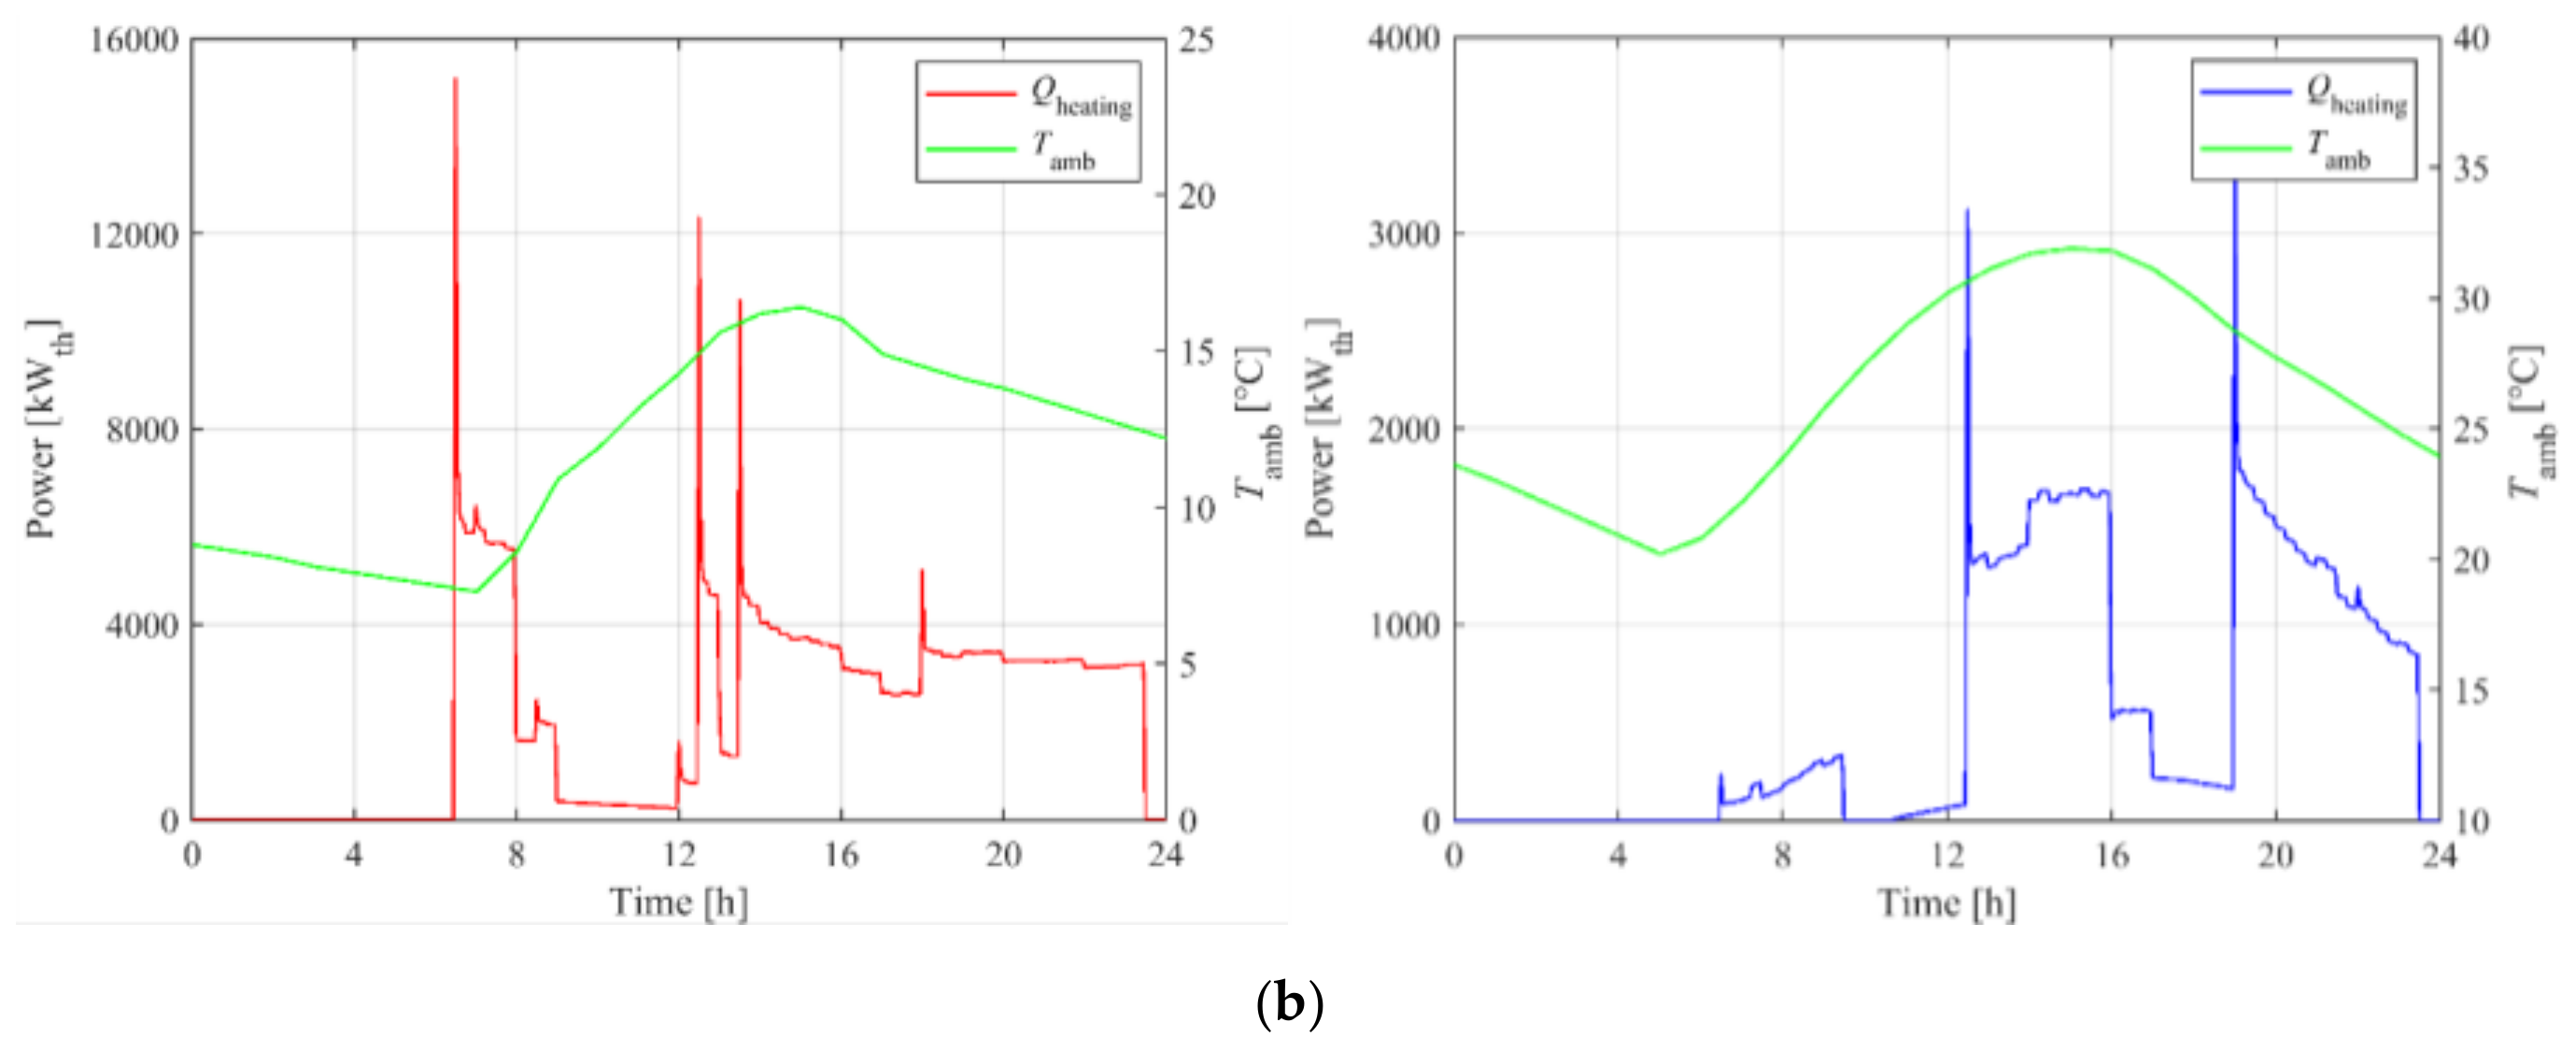
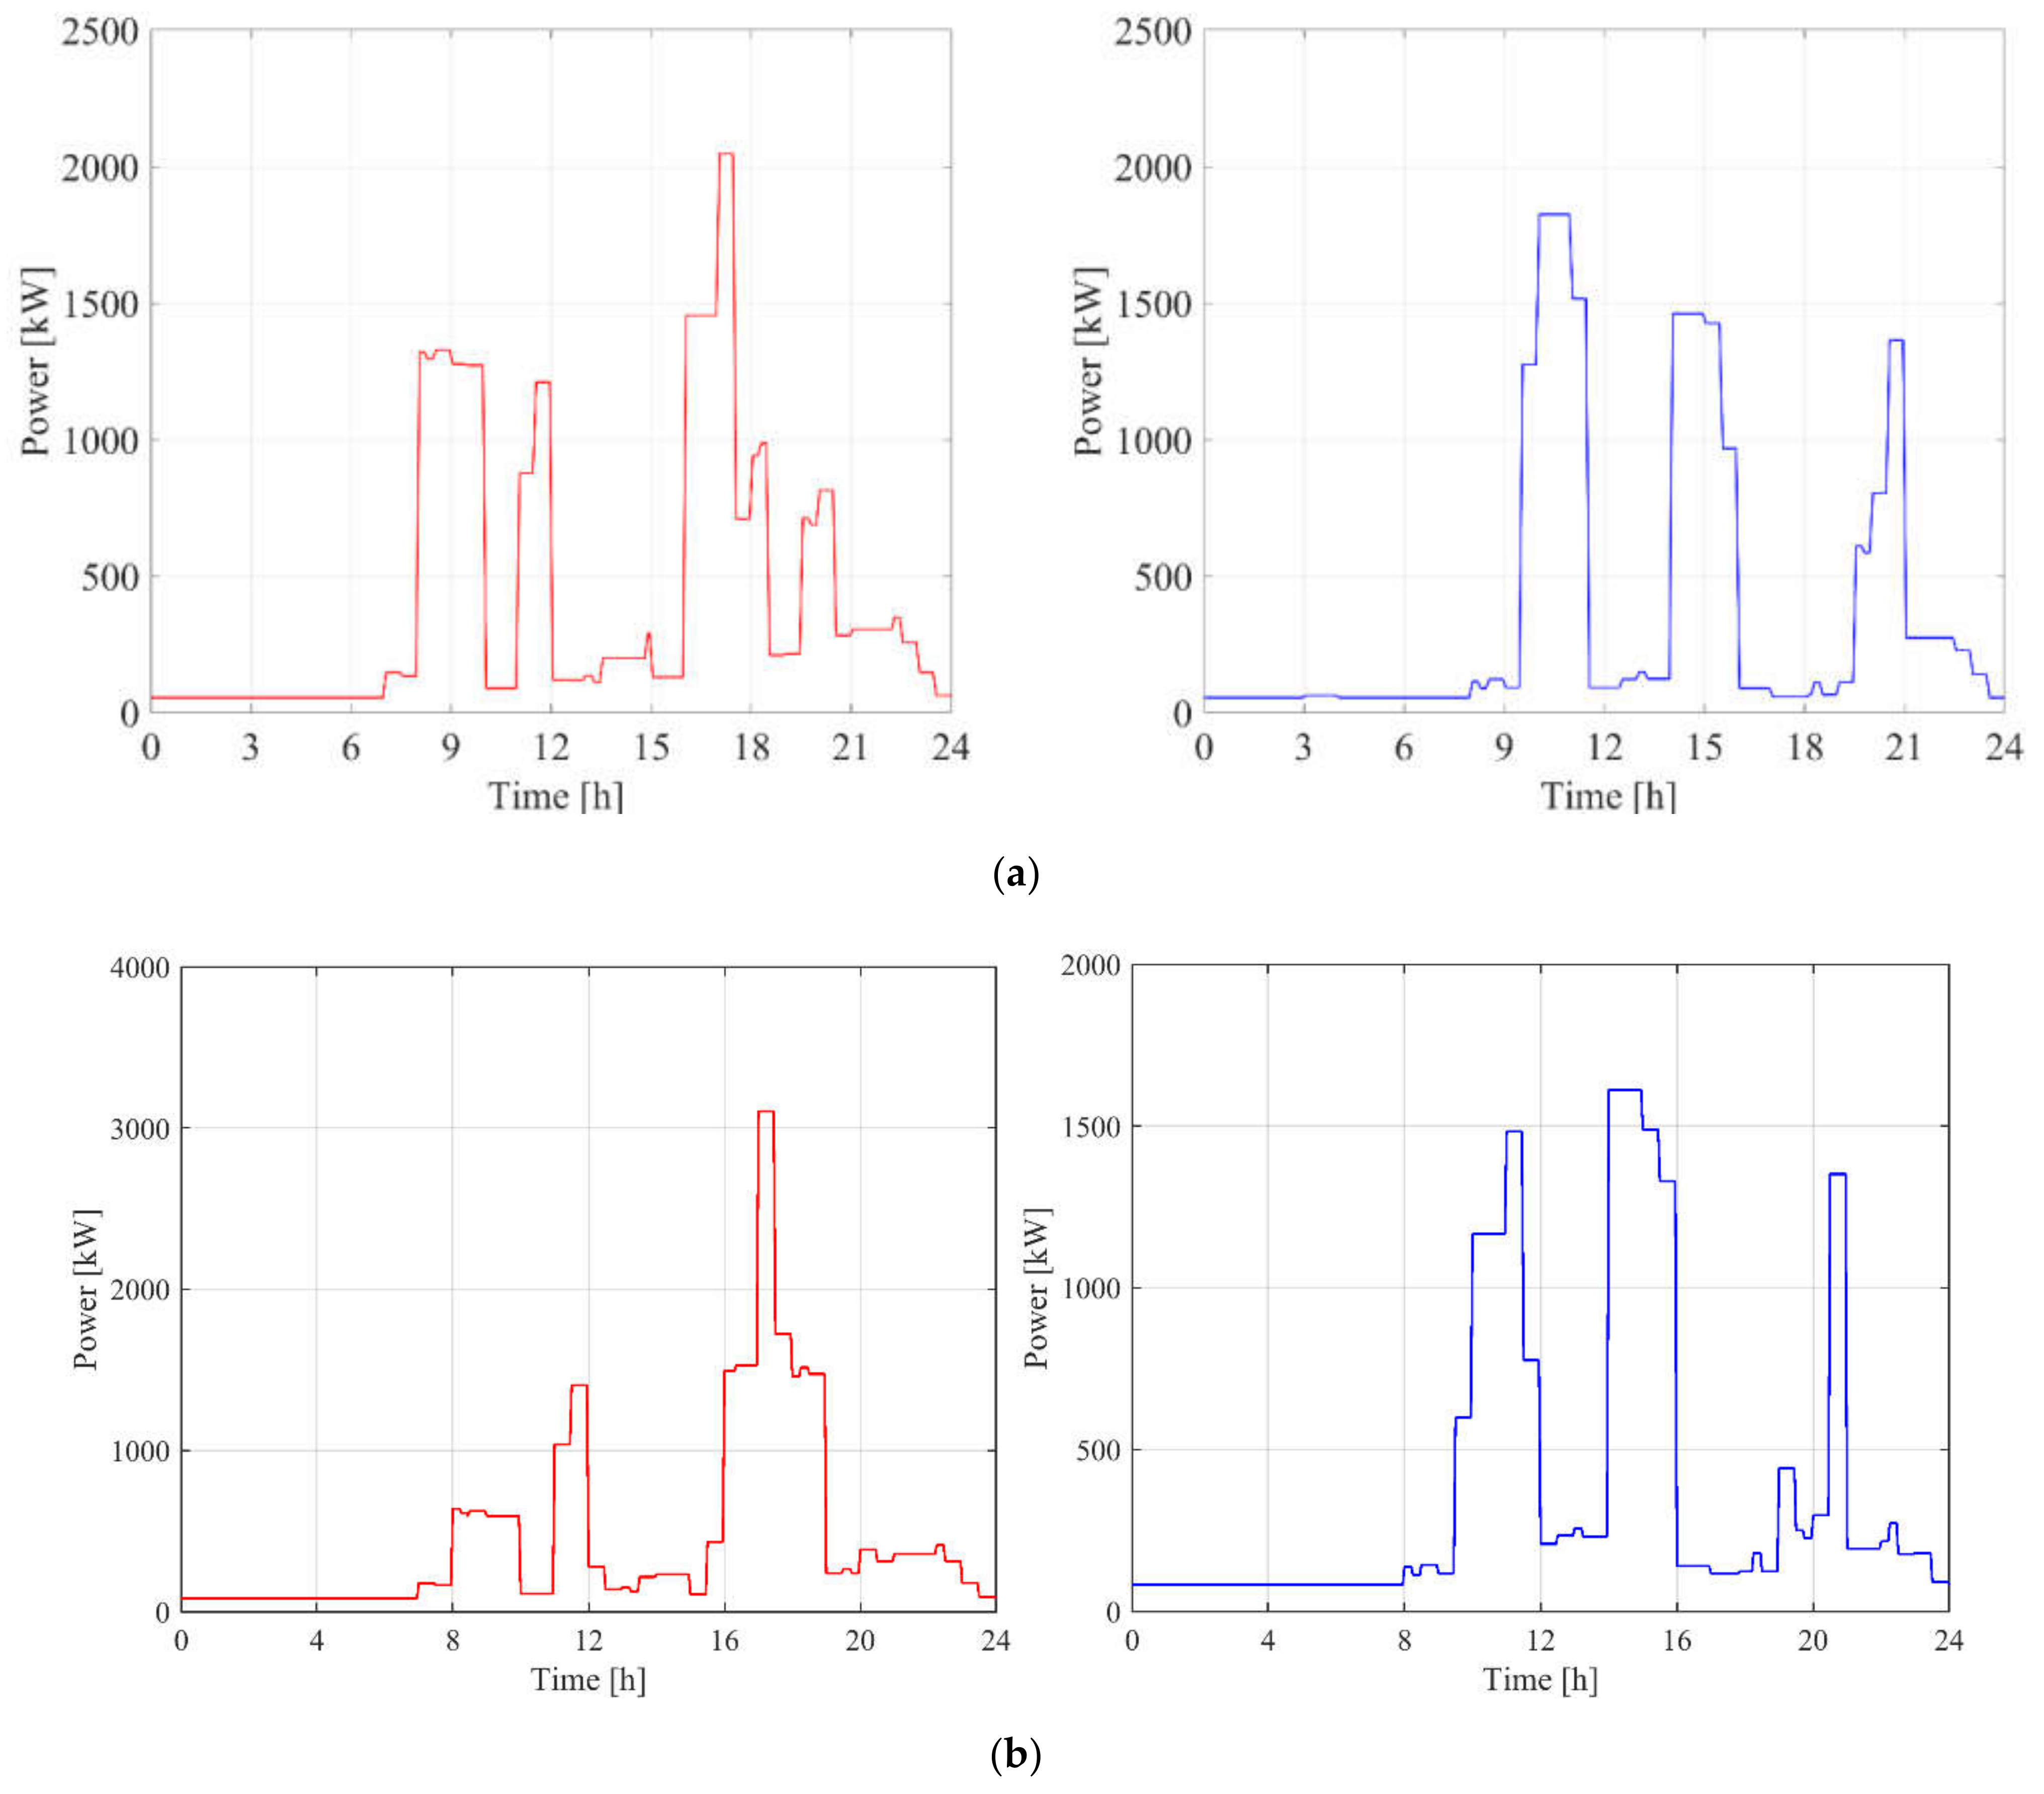
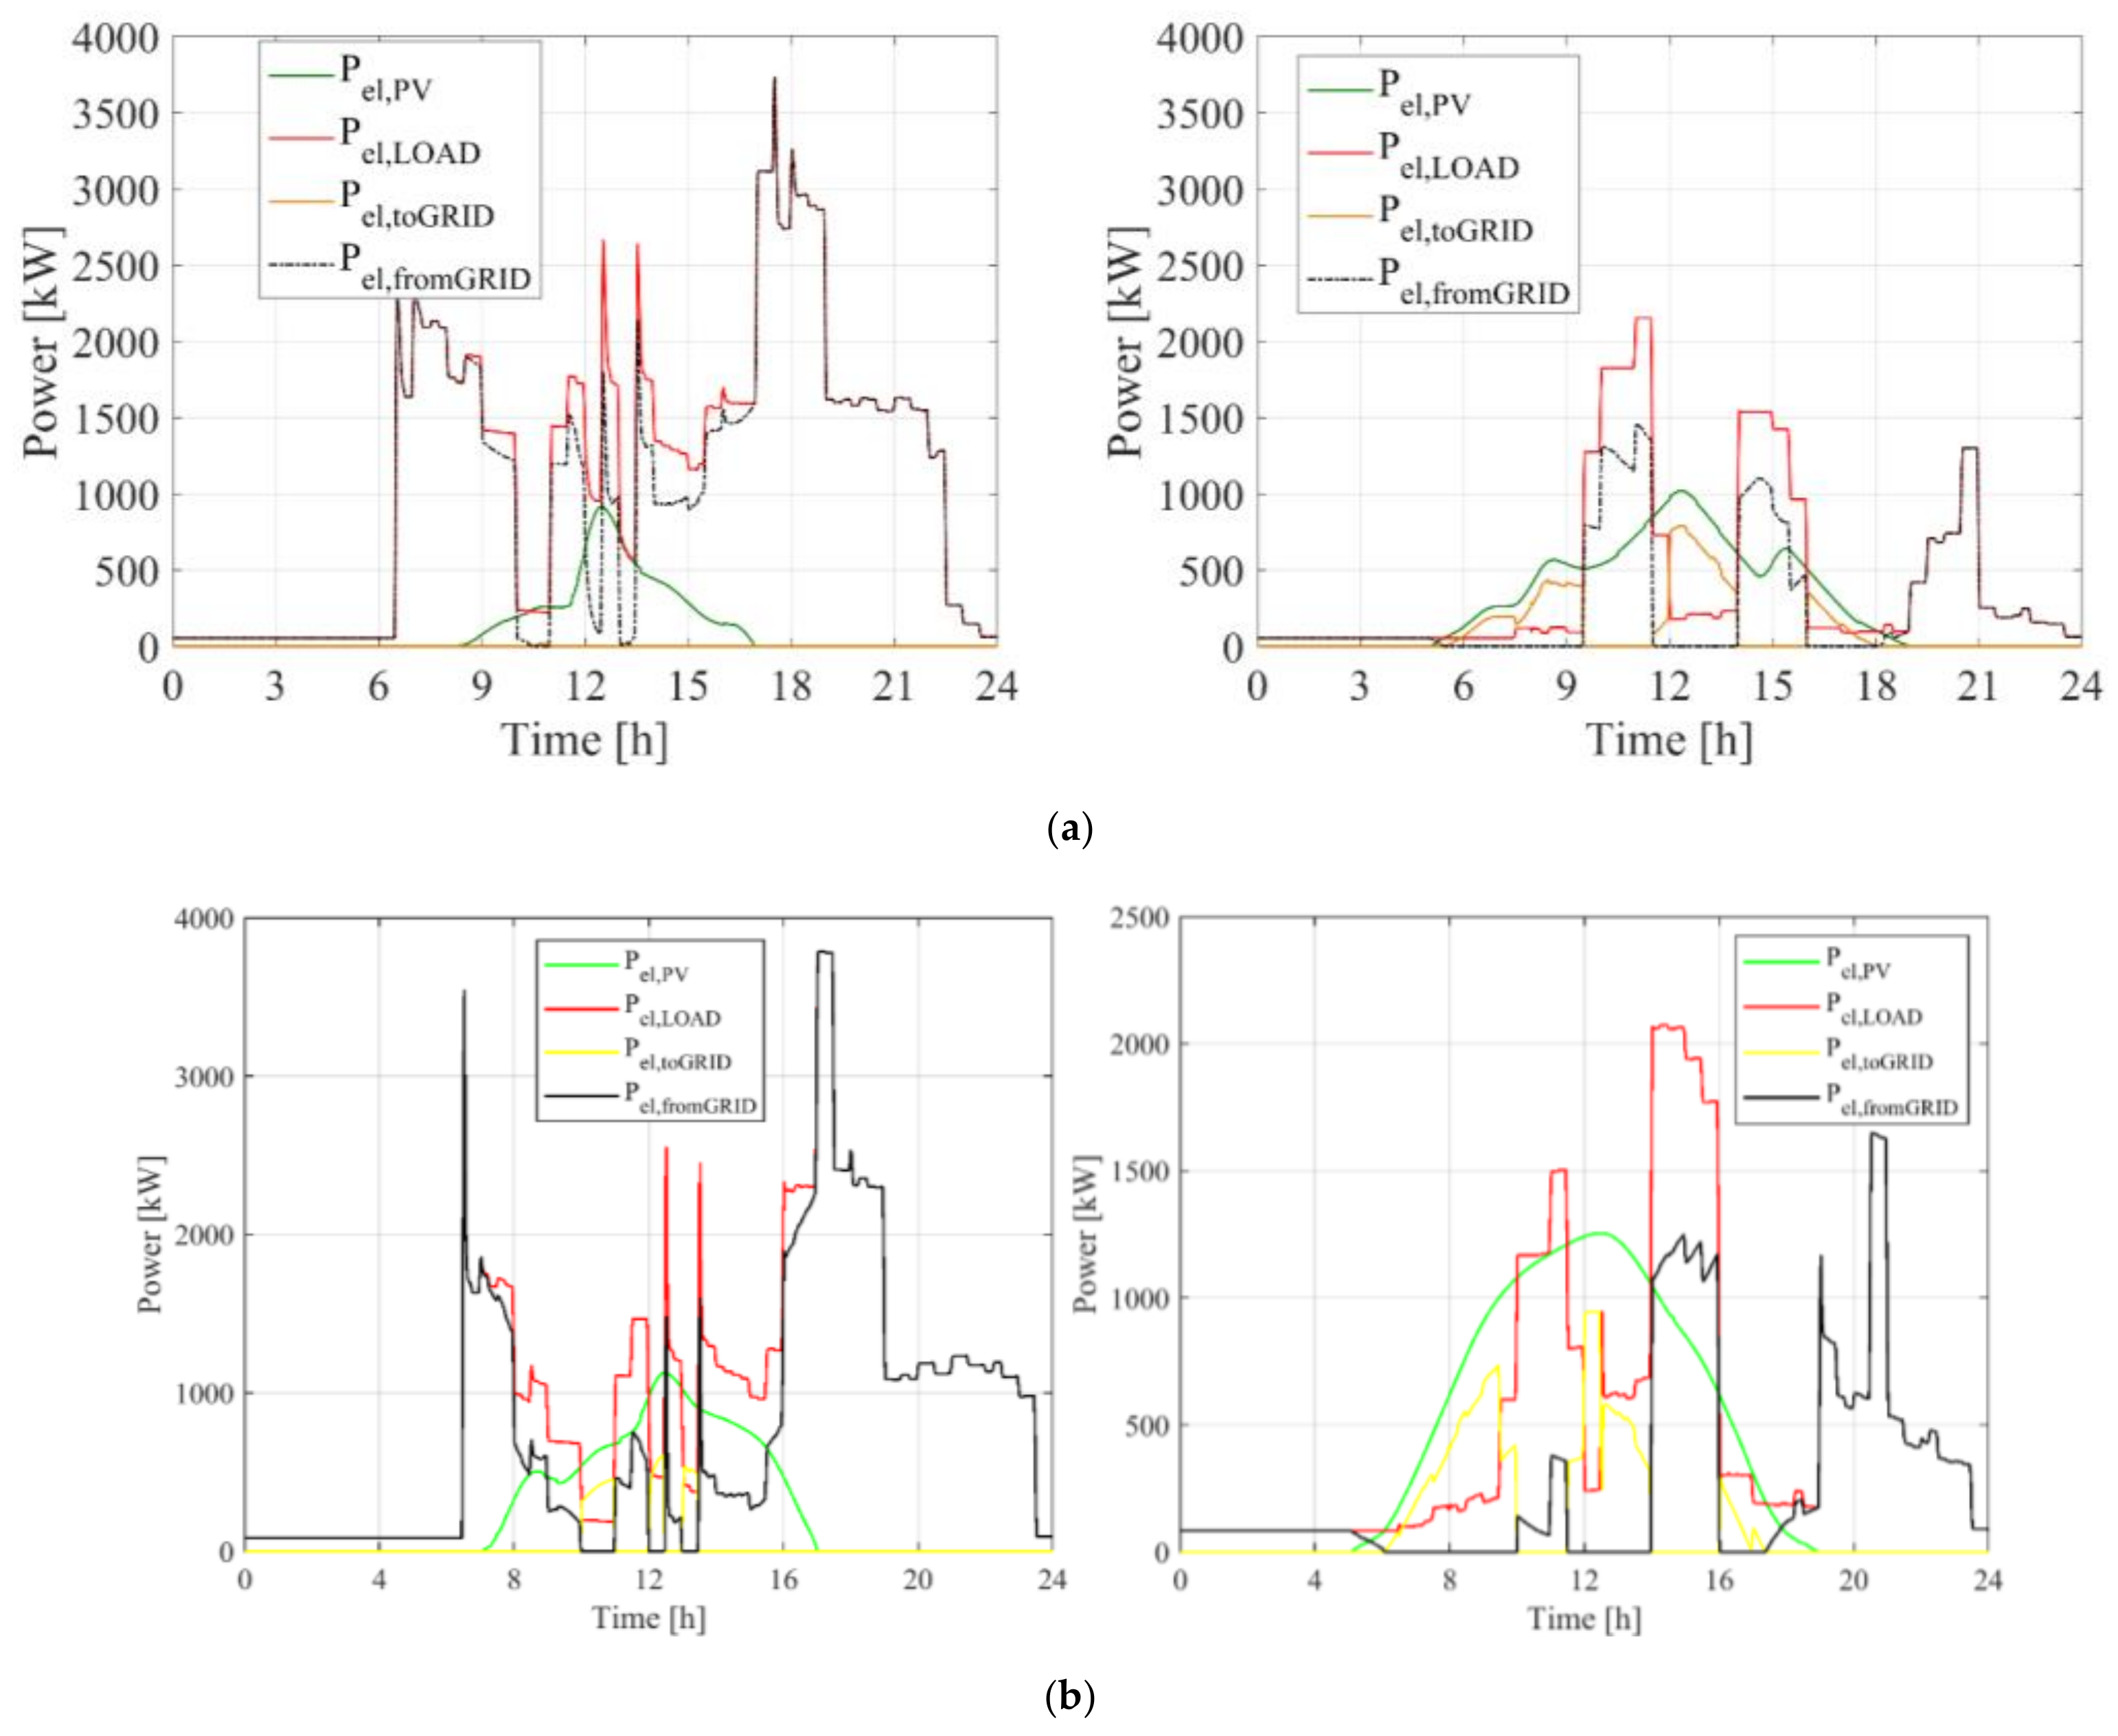
5.2. Energy Demand and Generation Profiles
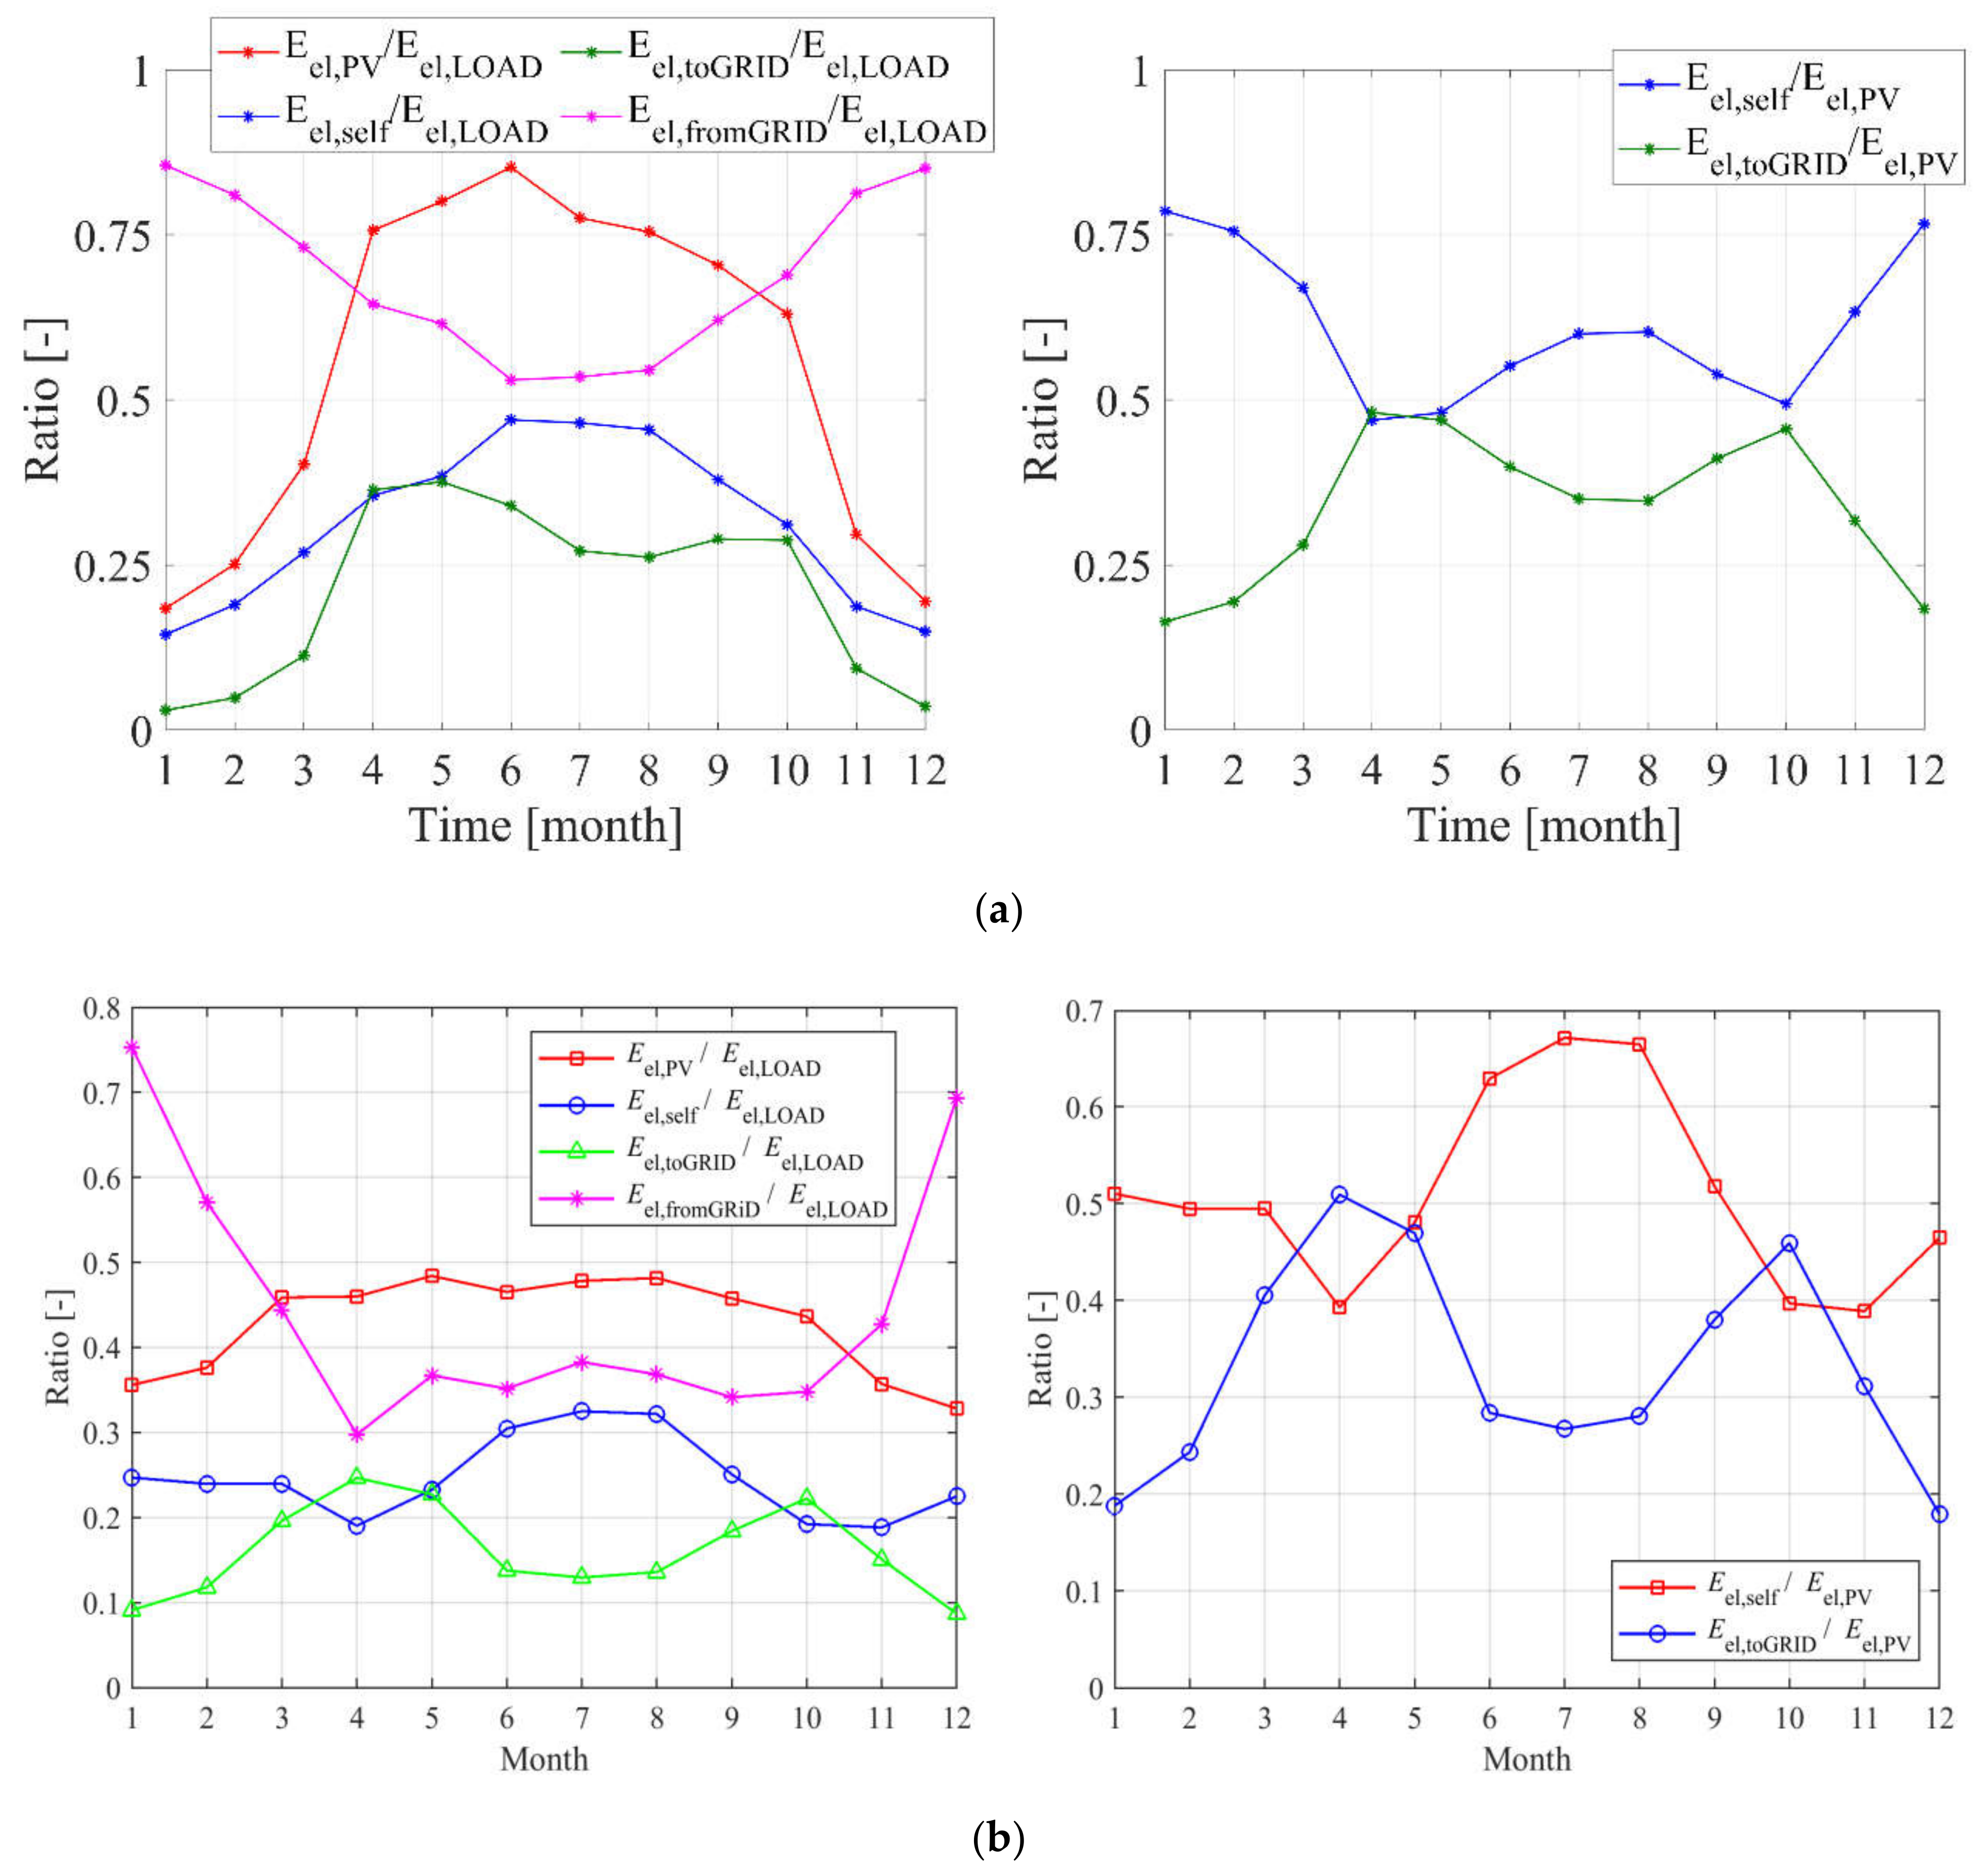
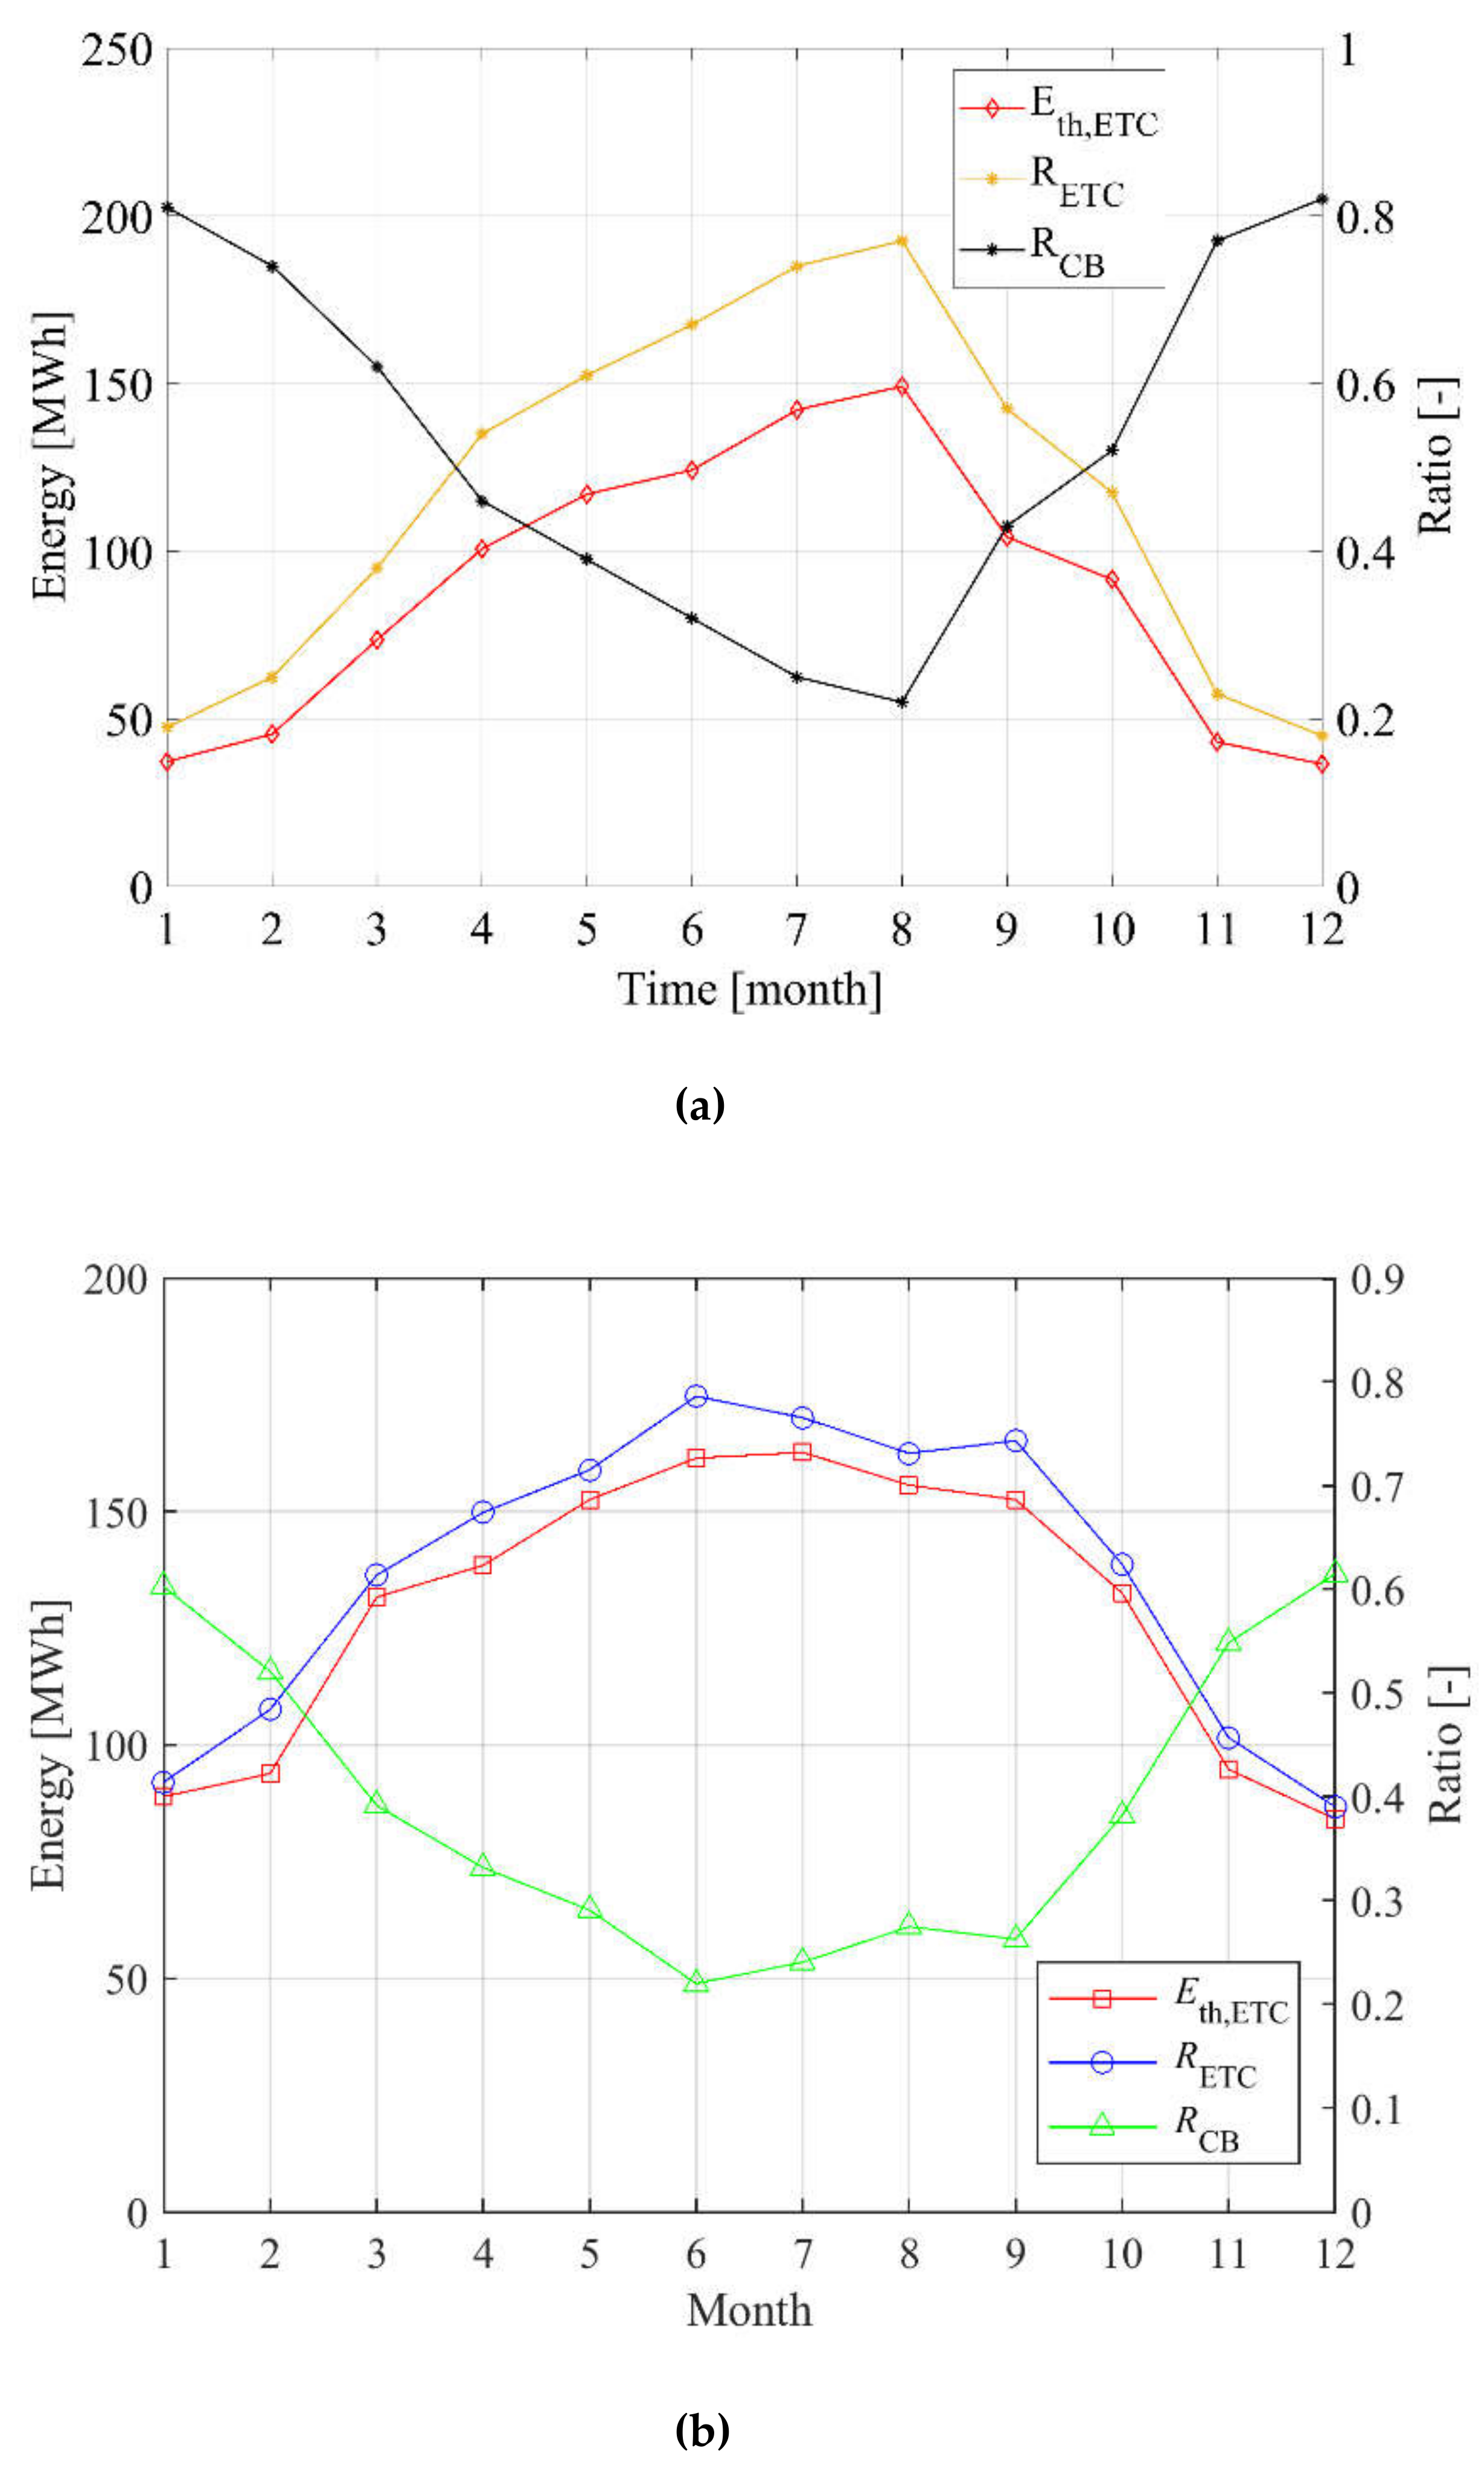
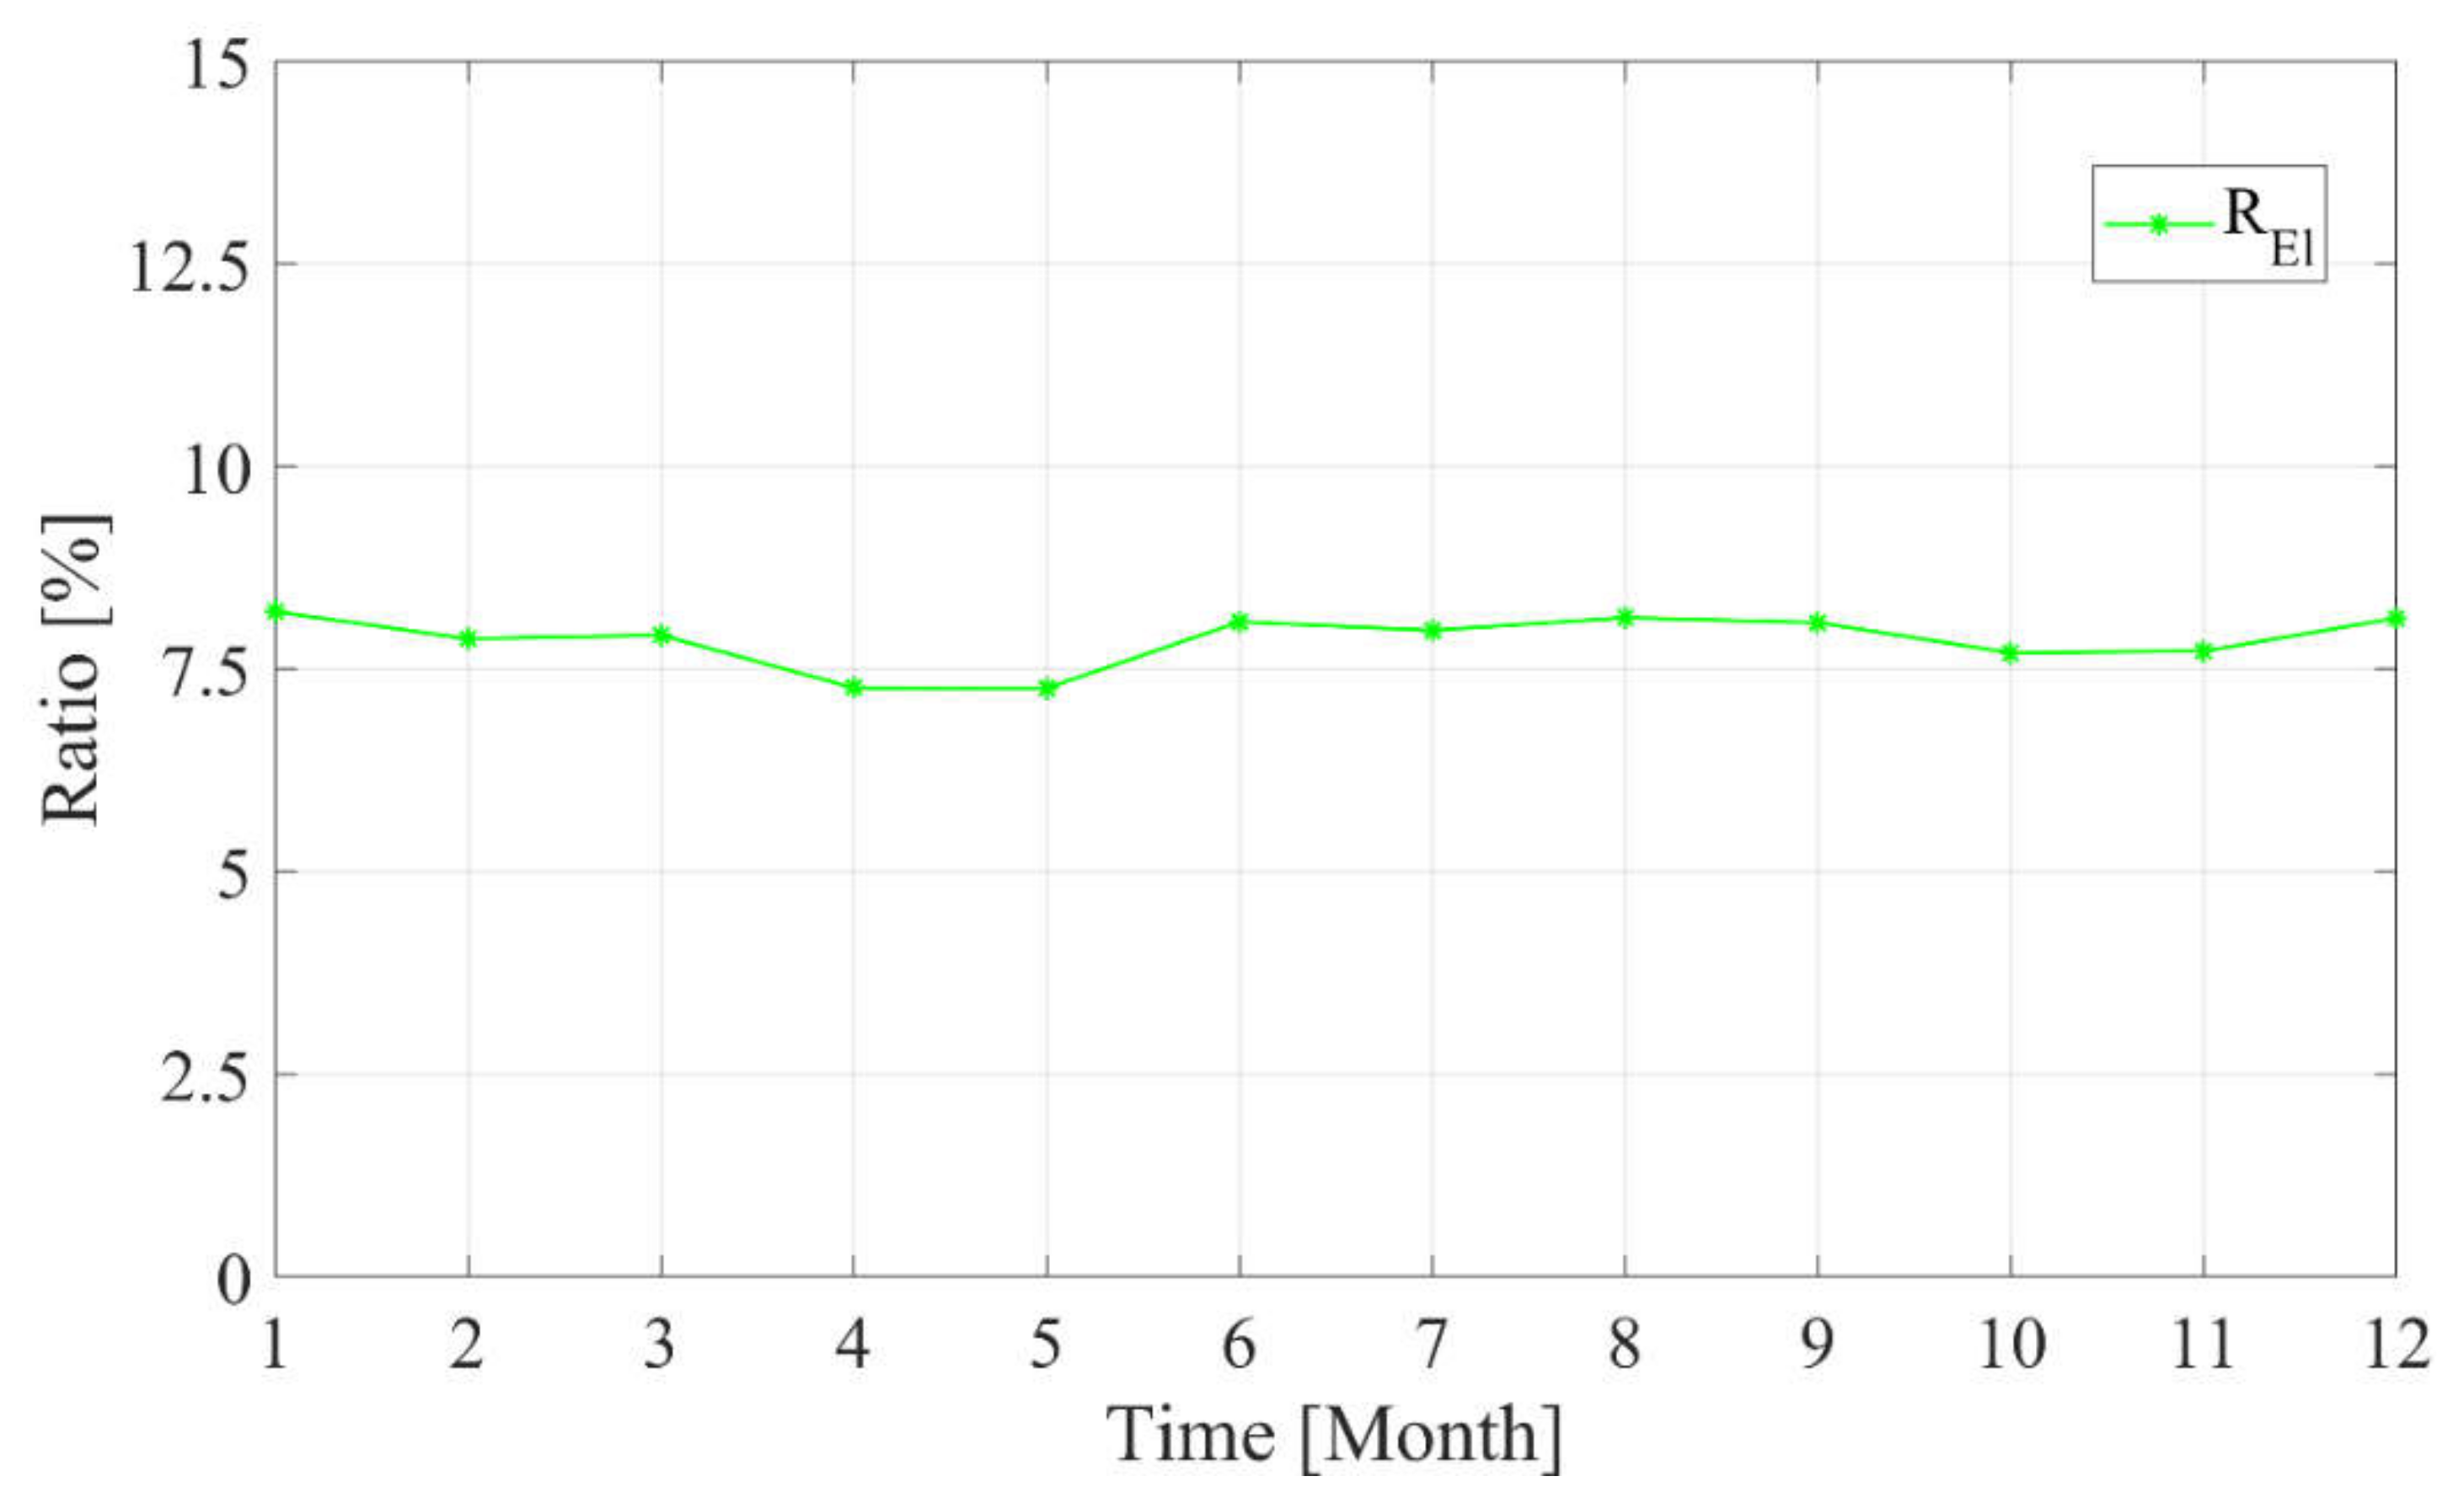
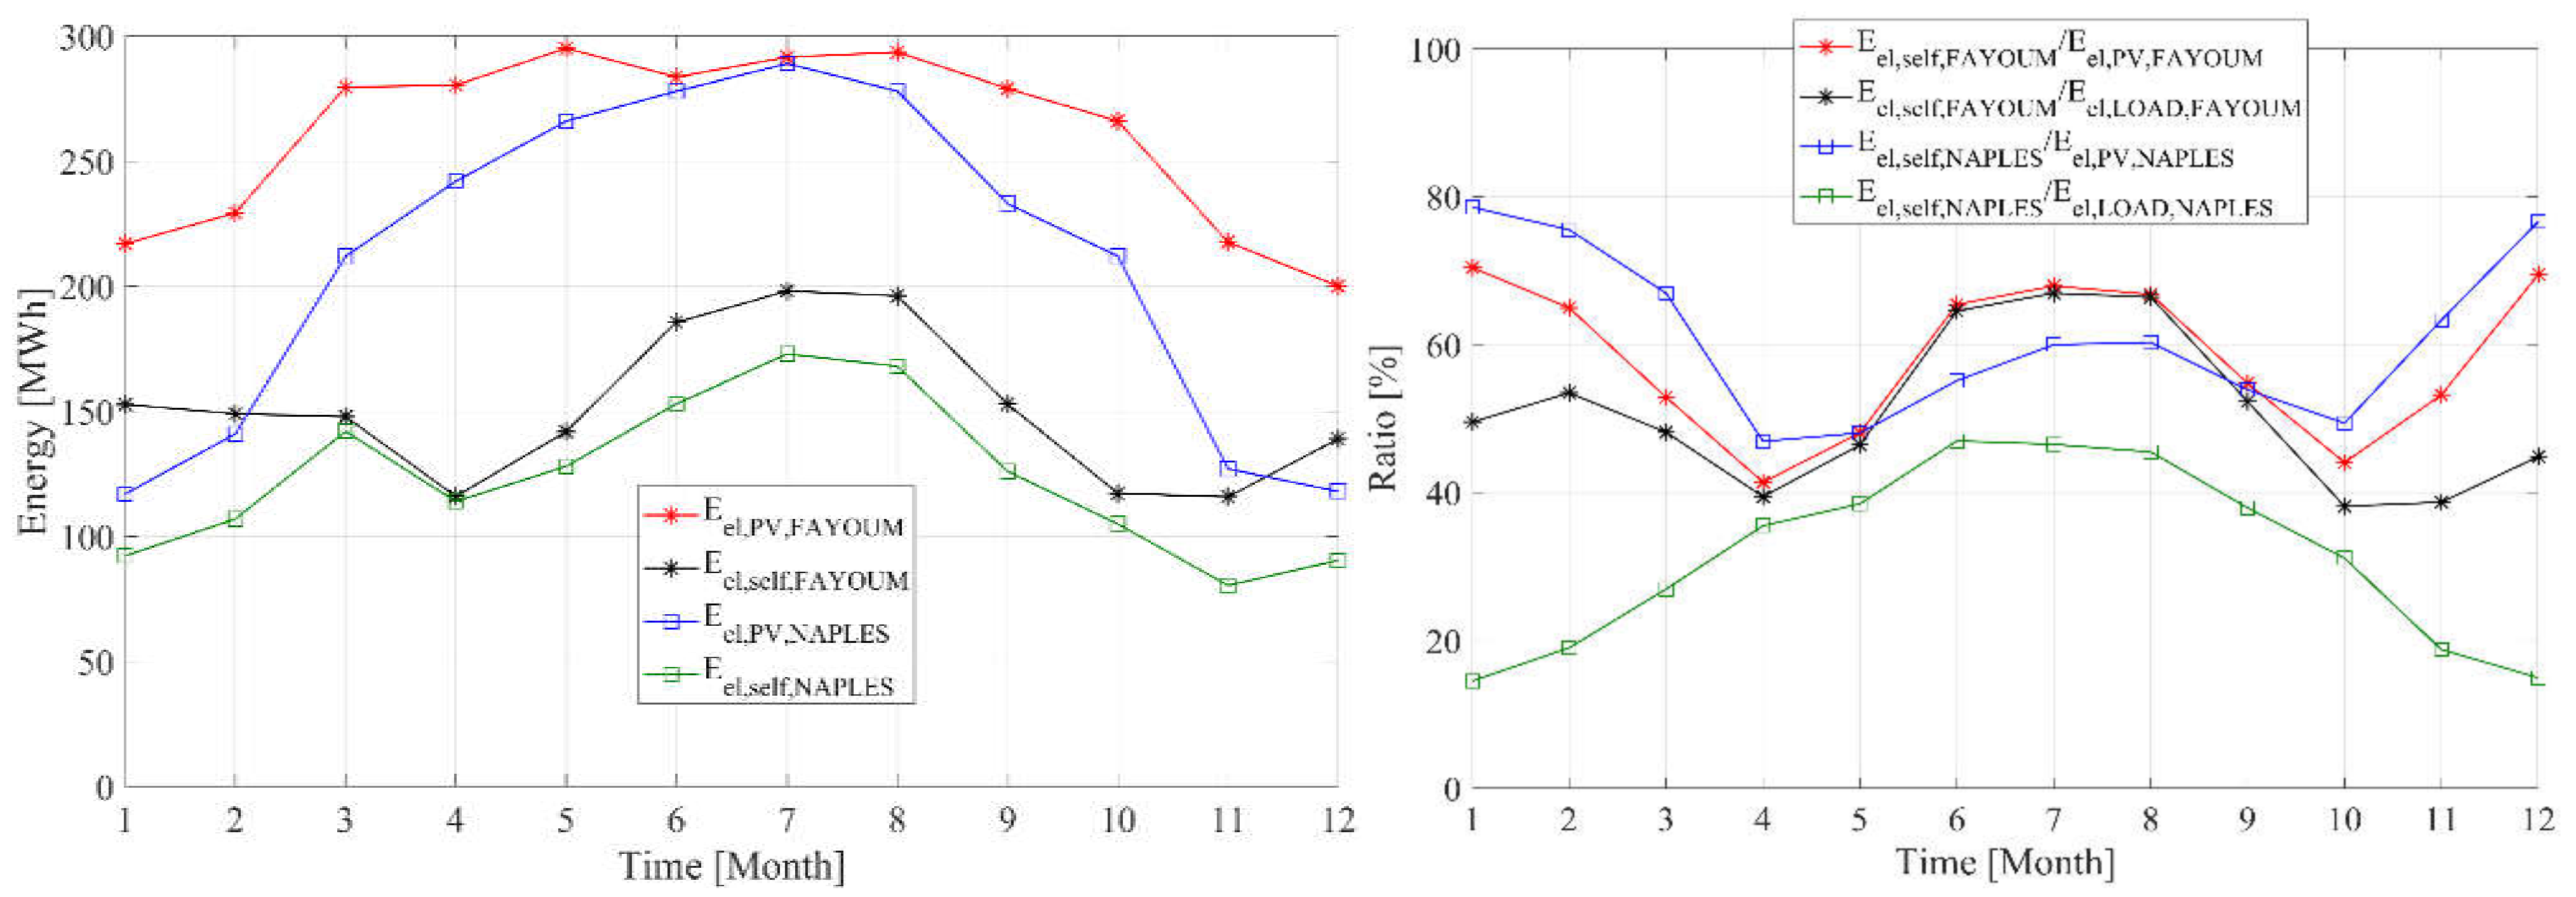
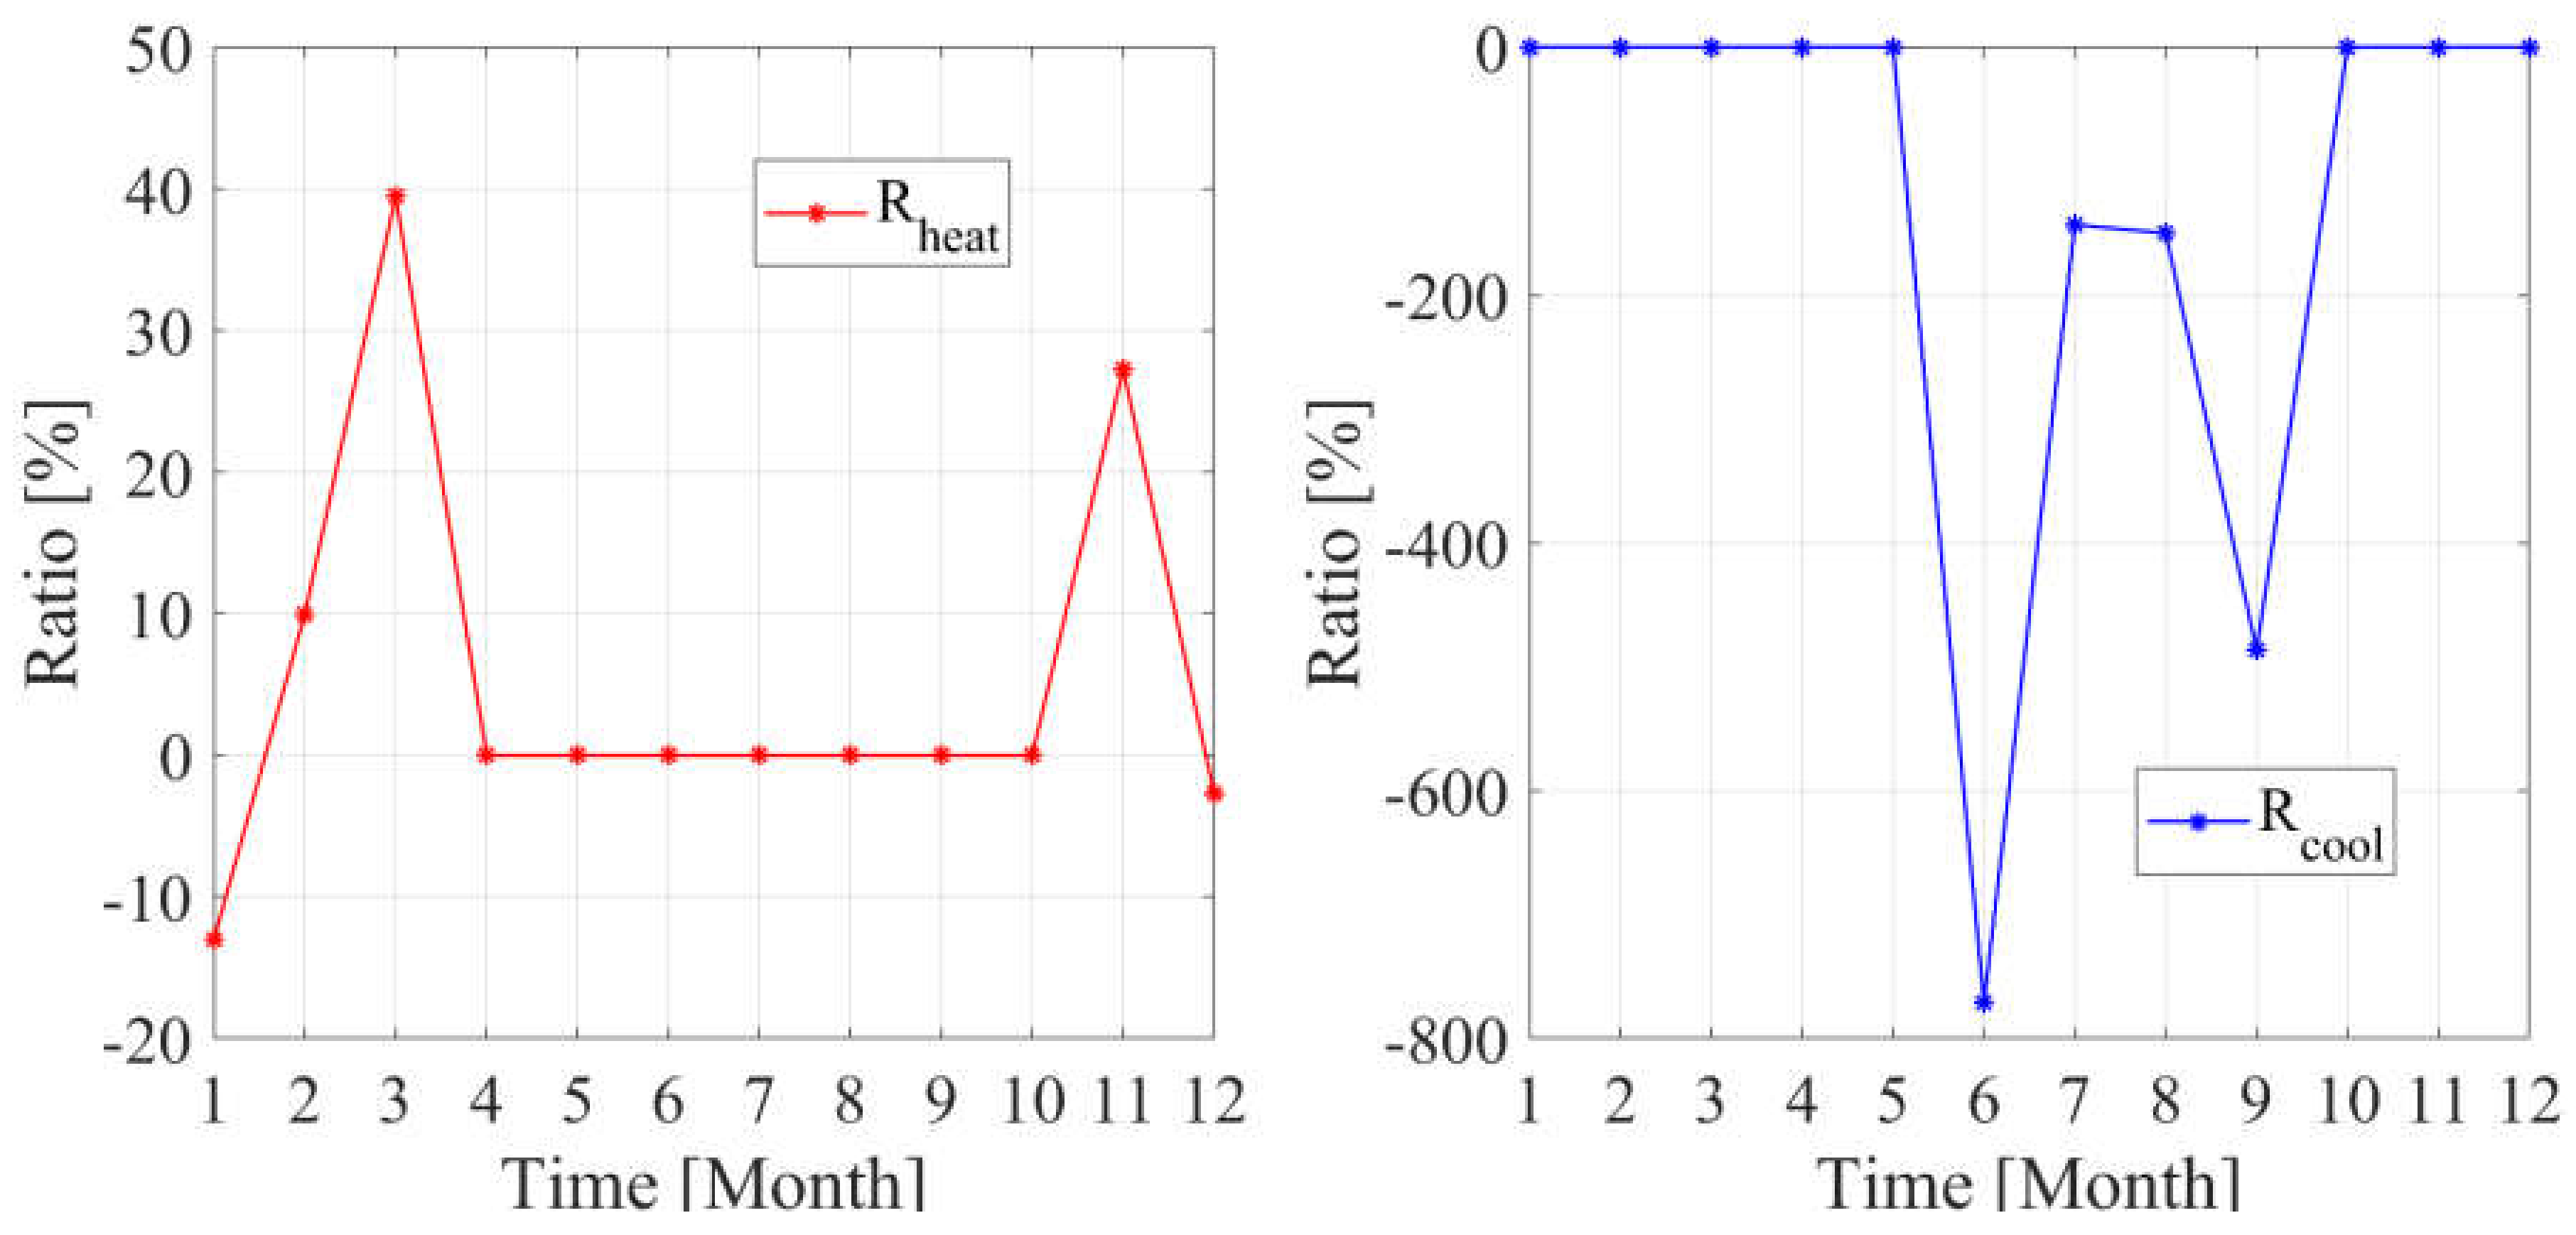
5.3. Monthly Results
6. Conclusions
- The residential district of Fayoum features a yearly thermal energy demand of 3.7 GWh for heating and 2.0 GWh for cooling. The cooling demand of the investigated district in Fayoum is significantly higher than the cooling demand of the district located in Naples, i.e., 0.5 GWh, due to the higher solar irradiance in Fayoum. Conversely, the heating energy demand of the Naples district is almost similar to the one of Fayoum, being equal to 4.0 GWh.
- The district located in Fayoum has an annual demand of primary energy of 17 GWh, with an annual operating cost of 0.41 M€/year.
- The envelope refurbishment for the district located in Fayoum, dealing with the use of cool paint for the roof, led to a very long payback period. This is mainly due to the low electricity price in Egypt.
- The adoption of electric-driven air-to-air heat pumps reduced the consumption of primary energy. In particular, the consumption of primary energy of the district located in Fayoum decreased by 16% due to the high efficiency of the heat pumps compared to the efficiency of the condensing boilers.
- The renewable energy measure based on photovoltaic panels, evacuated solar collectors and air-to-air heat pumps reached a promising primary energy savings of 67% in the Fayoum district and 58% in the Naples district. The differences were mainly related to the higher solar radiation in Fayoum with respect to Naples. These results suggest that this solution is quite promising in reducing the consumption of primary energy and the environmental impact of residential districts located in the Mediterranean region.
- The payback period of the renewable energy system in Naples is five years, while, in Fayoum, is 23 years, which shows that this energy-efficient renovation is not profitable, as expected. This is mainly related to the lower electricity and natural gas prices in Fayoum. However, with the increase of energy prices and the growing attention for environment protection, such systems could offer interesting profitability.
Author Contributions
Funding
Conflicts of Interest
Nomenclature
| A | area (m2) |
| c | cost-price per unit (€/kWh or €/m2 or €/m or €/t) |
| cp | specific heat at constant pressure (kJ kg−1 K−1) |
| G | incident solar total radiation (W m−2) |
| Cinv | capital cost for a component/system (€) |
| k | counter (-) |
| LHV | lower heating value (kWh Sm−3) |
| mass flow rate (kg s−1) | |
| mPV | Percent of annual PV maintenance (%/year) |
| mETC | Percent of annual ETC maintenance (%/year) |
| Np | number of people (-) |
| Npar | number of PV modules in parallel (-) |
| Ns | number of PV modules in series (-) |
| NPV | net present value (€) |
| P | electric power (kW) |
| PE | primary energy (kWh/year) |
| PES | primary energy saving (-) |
| PI | profit index |
| thermal power (kW) | |
| SPB | simple pay back (years) |
| T | temperature (°C) |
| U | overall heat transfer coefficient (W m−2 K−1) |
| v | velocity (m s−1) |
| Vol | volume (m3) |
| Greek Symbols | |
| Δ | difference (-) |
| ε | long wave emissivity (-) |
| η | efficiency (-) |
| ρ | density (kg m−3) |
| ρs | solar reflectance (-) |
| Subscripts | |
| amb | ambient |
| act | activation |
| avg | average |
| B | referred to boiler |
| CB | referred to condensing boiler |
| conv | convective |
| cool | cooling |
| DHW | domestic hot water |
| E | energy |
| el | electric |
| ETC | evacuated solar thermal collector |
| from GRID | electric energy imported from national power grid |
| indoor | indoor electric load |
| LOAD | electric demand |
| min | minimum |
| NG | natural gas |
| out | output |
| p | primary energy |
| PS | proposed system |
| PV | photovoltaic plant |
| RS | reference system |
| self | self-consumed electric energy |
| solar | thermal solar energy |
| t | value of a parameter in time step t |
| th | thermal |
| to GRID | electric energy sent to national electric grid |
| Tk | tank |
| u | user |
References
- International Energy Agency—IEA. Energy Climate and Change—World Energy Outlook Special Report; Special Report on Energy and Climate Change; IEA: Paris, France, 2015. [Google Scholar]
- Lake, A.; Rezaie, B.; Beyerlein, S. Review of district heating and cooling systems for a sustainable future. Renew. Sustain. Energy Rev. 2017, 67, 417–425. [Google Scholar] [CrossRef]
- Lund, H.; Werner, S.; Wiltshire, R.; Svendsen, S.; Thorsen, J.; Hvelplund, F.; Vad Mathiesen, B. 4th Generation District Heating (4GDH): Integrating smart thermal grids into future sustainable energy systems. Energy 2014, 68, 1–11. [Google Scholar] [CrossRef]
- Carpaneto, E.; Lazzeroni, P.; Repetto, M. Optimal integration of solar energy in a district heating network. Renew. Energy 2015, 75, 714–721. [Google Scholar] [CrossRef]
- Calise, F.; Cappiello, F.L.; D’Accadia, M.D.; Vicidomini, M. Thermo-Economic Analysis of Hybrid Solar-Geothermal Polygeneration Plants in Different Configurations. Energies 2020, 13, 2391. [Google Scholar] [CrossRef]
- Alkan, A.M.; Keçebaş, A.; Yamankaradeniz, N. Exergoeconomic analysis of a district heating system for geothermal energy using specific exergy cost method. Energy 2013, 60, 426–434. [Google Scholar] [CrossRef]
- Unternährer, J.; Moret, S.; Joost, S.; Maréchal, F. Spatial clustering for district heating integration in urban energy systems: Application to geothermal energy. Appl. Energy 2017, 190, 749–763. [Google Scholar] [CrossRef] [Green Version]
- Fang, H.; Xia, J.; Zhu, K.; Su, Y.; Jiang, Y. Industrial waste heat utilization for low temperature district heating. Energy Policy 2013, 62, 236–246. [Google Scholar] [CrossRef]
- Fang, H.; Xia, J.; Jiang, Y. Key issues and solutions in a district heating system using low-grade industrial waste heat. Energy 2015, 86, 589–602. [Google Scholar] [CrossRef]
- Aunedi, M.; Pantaleo, A.M.; Kuriyan, K.; Strbac, G.; Shah, N. Modelling of national and local interactions between heat and electricity networks in low-carbon energy systems. Appl. Energy 2020, 276, 115522. [Google Scholar] [CrossRef]
- Gabrielli, P.; Gazzani, M.; Martelli, E.; Mazzotti, M. Optimal design of multi-energy systems with seasonal storage. Appl. Energy 2018, 219, 408–424. [Google Scholar] [CrossRef]
- Mateu-Royo, C.; Sawalha, S.; Mota-Babiloni, A.; Navarro-Esbrí, J. High temperature heat pump integration into district heating network. Energy Convers. Manag. 2020, 210, 112719. [Google Scholar] [CrossRef]
- Roselli, C.; Sasso, M.; Tariello, F. Integration between electric heat pump and PV system to increase self-consumption of an office application. Renew. Energy Environ. Sustain. 2017, 2, 28. [Google Scholar] [CrossRef] [Green Version]
- Roselli, C.; Sasso, M.; Tariello, F. Dynamic Simulation of a Solar Electric Driven Heat Pump for an Office Building Located in Southern Italy. Int. J. Heat Technol. 2016, 34, S496–S504. [Google Scholar] [CrossRef]
- Izquierdo, M.; de Agustín, P.; Martín, E. A Micro Photovoltaic-heat Pump System for House Heating by Radiant Floor: Some Experimental Results. Energy Procedia 2014, 48, 865–875. [Google Scholar] [CrossRef] [Green Version]
- Dai, B.; Qi, H.; Liu, S.; Zhong, Z.; Li, H.; Song, M.; Ma, M.; Sun, Z. Environmental and economical analyses of transcritical CO2 heat pump combined with direct dedicated mechanical subcooling (DMS) for space heating in China. Energy Convers. Manag. 2019, 198, 111317. [Google Scholar] [CrossRef]
- Calabrese, N.; Mastrullo, R.; Mauro, A.W.; Rovella, P.; Tammaro, M. Performance analysis of a rooftop, air-to-air heat pump working with CO2. Appl. Thermal Eng. 2015, 75, 1046–1054. [Google Scholar] [CrossRef]
- Heibati, S.; Maref, W.; Saber, H.H. Assessing the Energy and Indoor Air Quality Performance for a Three-Story Building Using an Integrated Model, Part One: The Need for Integration. Energies 2019, 12, 4775. [Google Scholar] [CrossRef] [Green Version]
- Li, H.; Xu, W.; Yu, Z.; Wu, J.; Yu, Z. Discussion of a combined solar thermal and ground source heat pump system operation strategy for office heating. Energy Build. 2018, 162, 42–53. [Google Scholar] [CrossRef]
- Paiho, S.; Ketomäki, J.; Kannari, L.; Häkkinen, T.; Shemeikka, J. A new procedure for assessing the energy-efficient refurbishment of buildings on district scale. Sustain. Cities Soc. 2019, 46, 101454. [Google Scholar] [CrossRef]
- Gong, E.; Wang, N.; You, S.; Wang, Y.; Zhang, H.; Wei, S. Optimal operation of novel hybrid district heating system driven by central and distributed variable speed pumps. Energy Convers. Manag. 2019, 196, 211–226. [Google Scholar] [CrossRef]
- Gu, J.; Wang, J.; Qi, C.; Yu, X.; Sundén, B. Analysis of a hybrid control scheme in the district heating system with distributed variable speed pumps. Sustain. Cities Soc. 2019, 48, 101591. [Google Scholar] [CrossRef]
- Calise, F. Thermoeconomic analysis and optimization of high efficiency solar heating and cooling systems for different Italian school buildings and climates. Energy Build. 2010, 42, 992–1003. [Google Scholar] [CrossRef]
- Klein, S.A.; Beckman, W.; Mitchell, J.W.; Duffie, J.A.; Duffie, N.A.; Freeman, T.L. Solar Energy Laboratory, TRNSYS. A Transient System Simulation Program; Solar Energy Laboratory, University of Wisconsin: Madison, WI, USA, 2006. [Google Scholar]
- Buonomano, A.; Calise, F.; Palombo, A.; Vicidomini, M. BIPVT systems for residential applications: An energy and economic analysis for European climates. Appl. Energy 2016, 184, 1411–1431. [Google Scholar] [CrossRef]
- American Society of Heating, Refrigerating and Air-Conditioning Engineers. ASHRAE Handbook: Fundamentals; ASHRAE: Atlanta, GA, USA, 1993. [Google Scholar]
- Murray, M.C.; Finlayson, N.; Kummert, M.; Macbeth, J. Live Energy Trnsys -Trnsys Simulation within Google Sketchup. In Proceedings of the Eleventh International IBPSA Conference, Glasgow, Scotland, 27–30 July 2009. [Google Scholar]
- Piemonte, R. Bollettino Unico Regione Piemonte. 2018. Available online: http://www.regione.piemonte.it/oopp/prezzario/dwd/2018/Prezzario_Regione_Piemonte_2018.pdf (accessed on 1 July 2020).
- Government of Egypt. Available online: https://www.egas.com.eg/ (accessed on 1 July 2020).
- ISOVER. 2019. Available online: http://bituver.it/impermeabilizzazione/prodotti/gamma-ad-alta-riflettanza/california-p/ (accessed on 1 July 2020).
- Buonomano, A.; Calise, F.; d’Accadia, M.D.; Vicidomini, M. A hybrid renewable system based on wind and solar energy coupled with an electrical storage: Dynamic simulation and economic assessment. Energy 2018, 155, 174–189. [Google Scholar] [CrossRef]
- Buonomano, A.; Calise, F.; Palombo, A.; Vicidomini, M. Adsorption chiller operation by recovering low-temperature heat from building integrated photovoltaic thermal collectors: Modelling and simulation. Energy Convers. Manag. 2017, 149, 1019–1036. [Google Scholar] [CrossRef]
- Calise, F.; Cappiello, F.L.; Dentice d’Accadia, M.; Vicidomini, M. Dynamic simulation, energy and economic comparison between BIPV and BIPVT collectors coupled with micro-wind turbines. Energy 2020, 191, 116439. [Google Scholar] [CrossRef]
- SALMSON. 2019. Available online: http://www.salmson.com/index.php?id=19&L=2 (accessed on 15 September 2020).
- Ministry of Housing, Egypt. Energy Efficiency Commercial Building Code. Available online: http://www.hbrc.edu.eg/code.html (accessed on 18 December 2020).
- Luca, A.P.G.D.; Patto dei Sindaci. Piano di Azione per L’energia Sostenibile (PAES)—Relazione Specialistica Sull’efficienza Energetica negli Edifici (Climatizzazione e Acqua Calda Sanitaria); Patto dei Sindaci: Napoli, Italy, 2018. [Google Scholar]
- Agenzia nazionale per le nuove tecnologie2019. Available online: http://www.enea.it/it (accessed on 10 May 2020).
- Specifica Tecnica UNI TS 11300-2:2019. UNI TS 11300. 2019. Available online: https://www.certifico.com/aziende-safety/234-consulting/norme-tecniche/index.php?option=com_content&view=article&id=7781&catid=358&Itemid=494 (accessed on 10 May 2020).
- Calise, F.; Cappiello, F.L.; D’Accadia, M.D.; Vicidomini, M. Energy efficiency in small districts: Dynamic simulation and technoeconomic analysis. Energy Convers. Manag. 2020, 220, 113022. [Google Scholar] [CrossRef]
- Alimonti, C.; Conti, P.; Soldo, E. A comprehensive exergy evaluation of a deep borehole heat exchanger coupled with a ORC plant: The case study of Campi Flegrei. Energy 2019, 189, 116100. [Google Scholar]


| Component | Parameter | Description | Value | Unit |
|---|---|---|---|---|
| ETC | a1 | First order efficiency coefficient | 2.78 | Wm−2K−1 |
| a2 | Second order efficiency coefficient | 0.0083 | Wm−2K−2 | |
| AETC (Naples) | Aperture area of solar collector for Naples | 1700 | m2 | |
| AETC (Fayoum) | Aperture area of solar collector for Fayoum | 1700 | m2 | |
| qP2 | Rated flow rate of PSol | 85,000 | kg/h | |
| η0 | SC Zero loss efficiency at normal incidence | 0.70 | - | |
| cp | Specific heat of water | 4.190 | kJ/kg K | |
| α | Collector Slope | 30 | ° | |
| β | Collector Azimuth | 0 | ||
| Tset,ETC (Naples) | SC outlet set point temperature for Naples proposed system | 50 | °C | |
| Tset,ETC (Fayoum) | SC outlet set point temperature for Fayoum proposed system | 50 | ||
| Tset,tUsers | Set point temperature for Users | 54 | ||
| PV | Pmax | Maximum PV power | 260 | Wp |
| Voc | Voltage of open-circuit | 37.7 | V | |
| Isc | Current of short-circuit | 9.01 | A | |
| Vmpp | Voltage at MPP | 30.5 | V | |
| Impp | Current at MPP | 8.51 | A | |
| Ns | Number of modules in series | 2 | - | |
| Np (Naples) | Number of modules in parallel for Naples | 2920 | ||
| Np (Fayoum) | Number of modules in parallel for Fayoum | 2920 | ||
| A | PV module area | 1.6 | m2 | |
| Ncell | Number of PV cells in series | 15 | - | |
| ηPV | Efficiency of PV module | 15.8 | ||
| Prated,PV | Rated power of PV panel | 570 | kW | |
| Atot (Naples) | PV plant area | 9397 | m2 | |
| Atot (Fayoum) | PV plant area | 9397 | m2 |
| Building Type | Number of Buildings | ||
|---|---|---|---|
| Family | Old People | Young People | |
| A (Naples) | 9 | 3 | 2 |
| B (Naples) | 9 | 3 | 2 |
| C (Naples) | 8 | 3 | - |
| D (Naples) | 8 | 3 | - |
| A (Fayoum) | 9 | 2 | 2 |
| B (Fayoum) | 9 | 3 | 2 |
| C (Fayoum) | 9 | 3 | - |
| D (Fayoum) | 8 | 3 | - |
| Building Element | Buildings A, B, C and D | |||
|---|---|---|---|---|
| U-Value (W/m2 K) | Thickness (m) | ρs (–) | ε (–) | |
| Roof (Naples) | 0.916 | 0.255 | 0.4 | 0.9 |
| Façades (Naples) | 1.204 | 0.240 | ||
| Ground floor (Naples) | 1.030 | 0.285 | ||
| Adjacent ceiling (Naples) | 1.157 | 0.295 | ||
| Windows glass (Naples) | 2.89 | 0.004/0.016/0.004 | 0.13 | 0.18 |
| Roof (Fayoum) | 1.377 | 0.155 | 0.4 | 0.9 |
| Façades (Fayoum) | 1.728 | 0.150 | ||
| Ground floor (Fayoum) | 1.030 | 0.285 | ||
| Adjacent ceiling (Fayoum) | 1.157 | 0.295 | ||
| Windows glass (Fayoum) | 2.89 | 0.004/0.016/0.004 | 0.13 | 0.18 |
| Devices | Average Power (kW) | Heat Gain (kW) | Radiative Part (%) | Convective Part (%) |
|---|---|---|---|---|
| Fridge | 0.040 (Naples) 0.060 (Fayoum) | 0.040 (Naples) 0.060 (Fayoum) | 0 | 100 |
| Dishwasher | 1.820 | 0.364 | 51 | 34 |
| Bakery | 0.870 | 0.522 | 14 | 49 |
| Cooking plane | 1.500 | 0.900 | 24 | 16 |
| TV | 0.240 | 0.240 | 40 | 60 |
| PC (Processor: 3.5 GHz, RAM: 16 GB) | 0.090 | 0.090 | 10 | 90 |
| Laptop | 0.059 | 0.059 | 25 | 75 |
| Washing machine | 1270 (Naples) 500 (Fayoum) | 0.254 (Naples) 0.100 (Fayoum) | 40 | 60 |
| Building Geometric Features | A | B | C | D |
|---|---|---|---|---|
| Building height (m2) | 24 | 18 | 18 | 21 |
| Building volume (m3) | 7056 | 6840 | 8316 | 7980 |
| Building floor area (m2) | 336 | 380 | 461 | 680 |
| Number of building floors (-) | 8 | 6 | 6 | 7 |
| Number of apartments per building floor (-) | 4 | 4 | 5 | 4 |
| Apartment area (m2) | 84 | 95 | 92 | 95 |
| Glass area (m2) | 254.75 | 221.75 | 264.20 | 240.48 |
| Seasonal heating and cooling (Naples 1034-degrees day) | Heating: Tset = 20 °C [39] 15 November–31 March Cooling: Tset,residential = 27 °C & Tset,commercial = 26 °C 1 May–30 September [39] | |||
| Seasonal heating and cooling (Fayoum 1096-degrees day) | Heating: Tset = 24 °C [35] 15 November–15 March Cooling: Tset,residential = 28 °C & Tset,commercial = 28 °C 1 May–31 October [35] | |||
| Occupancy schedule (Naples) | See Reference [35] | |||
| Occupancy schedule (Fayoum) | ||||
| Power load per day (kW) (Naples) | ||||
| Power load per day (kW) (Fayoum) | ||||
| Infiltration rate of air (vol/h) | 0.6 | |||
| Average daily demand of DH (m3/day) | 194.17 | |||
| Set point temperature of DHW (°C) | 45 | |||
| System | Electric Energy | Heating of Building Space | Cooling of Building Space | DHW | Envelope | |||
|---|---|---|---|---|---|---|---|---|
| Uroof (W/m2 K) | ρs,roof (–) | Uwindow (W/m2 K) | g,windows (–) | |||||
| Proposed System 1 (Fayoum) | Grid supplied | boiler ηB = 0.75 | air-to-air HP | boiler ηB = 0.75 | 0.305 | 0.83 | 1.01 | 0.305 |
| 0.916 | 0.83 | 2.89 | 0.789 | |||||
| Proposed System 2 (Fayoum) | Grid supplied | boiler ηB = 0.75 | 0.916 | 0.4 | 2.89 | 0.789 | ||
| Proposed System 3 (Fayoum) | PV plant (9397 m2) + grid | ETC plant (1700 m2) + 4600 kWth condensing boiler ηCB = 0.95 | 0.916 | 0.4 | 2.89 | 0.789 | ||
| Proposed System 3 (Naples) | PV plant (9397 m2) + grid | ETC plant (1700 m2) + 4613 kWth condensing boiler ηCB = 0.95 | 0.916 | 0.4 | 2.89 | 0.789 | ||
| Thermal Insulation | Conductivity | Density | Thickness | Cost |
|---|---|---|---|---|
| W/mK | kg/m3 | m | €/m2 | |
| Polyurethane | 22 | 43 | 0.03 | 26.51 |
| 0.04 | 31.45 | |||
| 0.05 | 34.13 | |||
| 0.06 | 40.67 | |||
| 0.07 | 44.48 | |||
| Roof painting | ρs,roof | ε | Painting style | Cost |
| - | - | kg/m2 | €/kg | |
| Cool painting | 0.83 | 0.90 | 0.500 | 5.816 |
| Eel,LOAD (GWh) | Eel,tot (GWh) | Eth,heat (GWh) | Eth,cool (GWh) | Eth,DHW (GWh) | PE (GWh) | C (M€) | VolNG (Sm3) | CO2 (Gg) | ||
|---|---|---|---|---|---|---|---|---|---|---|
| RS N | 3.9 | 4.0 | 4.0 | 0.5 | 2.5 | 17.3 | 1.5 | 900,594 | 3.7 | |
| RS F | 3.6 | 4.1 | 3.7 | 2.0 | 2.5 | 17.2 | 0.4 | 860,000 | 3.4 | |
| Eel,tot (GWh) | Eth,heat&cool (GWh) | PE (GWh) | ΔPE (GWh) | PES (%) | ΔCO2 (Gg) | ΔCO2 (%) | |
|---|---|---|---|---|---|---|---|
| PS1 N | 4.0 | 4.0 | 16.8 | 0.5 | 2.8 | 0.01 | 2.7 |
| PS2 N | 5.1 | 4.5 | 14.4 | 2.9 | 16.9 | 0.5 | 14.7 |
| PS3 N | 5.1 | 4.5 | 7.3 | 10.1 | 58.2 | 2.1 | 56.8 |
| PS1 F | 3.9 | 5.5 | 17.8 | −0.7 | −3.8 | −0.1 | −3.8 |
| PS2 F | 5.1 | 5.7 | 14.4 | 2.7 | 16.0 | 0.6 | 16.2 |
| PS3 F | 5.1 | 5.7 | 5.7 | 11.4 | 66.7 | 2.3 | 66.8 |
| C (M€/Year) | ΔC (M€/Year) | SPB (Year) | PI (-) | NPV (M€) | Cinv (M€) | ΔVolNG (Sm3) | |
|---|---|---|---|---|---|---|---|
| PS1 N | 1.47 | 0.04 | 71 | −0.80 | −2.52 | 3.14 | 42,600 |
| PS2 N | 1.22 | 0.29 | 0 | - | 4.38 | 0 | 557,000 |
| PS3 N | 0.63 | 0.88 | 5 | 1.75 | 6.82 | 3.89 | 769,000 |
| PS1 F | 0.41 | 0.003 | 182 | −0.92 | −0.51 | 0.56 | 118,000 |
| PS2 F | 0.43 | 0.016 | 0 | - | - | 0 | 515,000 |
| PS3 F | 0.25 | 0.167 | 23 | −0.39 | −1.53 | 3.89 | 754,000 |
| Eel,PV (GWh) | Eth,ETC (GWh) | Eel,toGRID (GWh) | Eel,self (GWh) | Eel,self/Eel,tot (%) | Eel,self/Eel,PV (%) | ηPV (-) | ηETC (-) | RETC (%) | RCB (%) | |
|---|---|---|---|---|---|---|---|---|---|---|
| PS3 N | 2.5 | 1.1 | 0.9 | 1.5 | 28.8 | 59.0 | 0.15 | 0.36 | 46.79 | 53.2 |
| PS3 F | 3.1 | 1.6 | 1.2 | 1.8 | 35.3 | 57.9 | 0.15 | 0.41 | 61.71 | 39.0 |
Publisher’s Note: MDPI stays neutral with regard to jurisdictional claims in published maps and institutional affiliations. |
© 2021 by the authors. Licensee MDPI, Basel, Switzerland. This article is an open access article distributed under the terms and conditions of the Creative Commons Attribution (CC BY) license (http://creativecommons.org/licenses/by/4.0/).
Share and Cite
Calise, F.; Cappiello, F.L.; Vicidomini, M.; Song, J.; Pantaleo, A.M.; Abdelhady, S.; Shaban, A.; Markides, C.N. Energy and Economic Assessment of Energy Efficiency Options for Energy Districts: Case Studies in Italy and Egypt. Energies 2021, 14, 1012. https://doi.org/10.3390/en14041012
Calise F, Cappiello FL, Vicidomini M, Song J, Pantaleo AM, Abdelhady S, Shaban A, Markides CN. Energy and Economic Assessment of Energy Efficiency Options for Energy Districts: Case Studies in Italy and Egypt. Energies. 2021; 14(4):1012. https://doi.org/10.3390/en14041012
Chicago/Turabian StyleCalise, Francesco, Francesco L. Cappiello, Maria Vicidomini, Jian Song, Antonio M. Pantaleo, Suzan Abdelhady, Ahmed Shaban, and Christos N. Markides. 2021. "Energy and Economic Assessment of Energy Efficiency Options for Energy Districts: Case Studies in Italy and Egypt" Energies 14, no. 4: 1012. https://doi.org/10.3390/en14041012