
Experimental Study of Transient Flow Regimes in a Model Hydroturbine Draft Tube


1
Kutateladze Institute of Thermophysics, 630090 Novosibirsk, Russia
2
Department of Physics, Novosibirsk State University, 630090 Novosibirsk, Russia
*
Author to whom correspondence should be addressed.
Energies 2021, 14(5), 1240; https://doi.org/10.3390/en14051240
Submission received: 12 January 2021
/
Revised: 15 February 2021
/
Accepted: 20 February 2021
/
Published: 24 February 2021
Abstract
:Swirling flow with the formation of a precessing vortex core (PVC) in the draft tube model of a hydroturbine was studied. Experiments were performed on an aerodynamic setup under transient operating conditions of the hydroturbine. The turbine operating conditions were varied by continuously changing the flow rate at a constant runner speed. The transition from the partial load regime, when a precessing vortex core is formed, to the best efficiency point without a core is considered. Applied to this task, a comparison of the windowed Fourier transform with wavelet analysis is given. The dependence of the PVC lifetime in the transient regime correlates with the transient time. It is shown that the velocity profiles and the spectrum of pressure pulsations in transient regimes change quasistatically between part-load operation and the best efficiency point of the turbine. The phase-averaged velocity distributions in the transient regimes show that a transient regime is a sequence of quasisteady regimes.
1. Introduction
The increase in the share of renewable energy sources such as wind and sunlight necessitates the storage of the generated electricity to compensate for fluctuations in these energy resources over time with changes in weather. Hydroelectric power plants are a suitable energy source for stabilizing power generation due to their flexible operational capabilities [1,2]. Generally, turbines are designed to operate under nominal operating conditions where they operate stably and at the best efficiency point (BEP). However, during regulation, startup or shutdown, a turbine operates under nonoptimal conditions. An important problem of hydropower engineering is the extension of the range of stable and reliable operation of hydroelectric stations to the region of off-design operating conditions of hydroturbines [3]. The need to operate a hydraulic turbine in off-design and nonoptimal operating modes is dictated by the desire to generate exactly as much electricity as electricity consumers need at a particular time. The off-design and nonoptimal operation of hydroturbines can produce dangerous hydrodynamic instabilities behind the runner in the form of vortex breakdown and a precessing vortex core (PVC) [4,5]. The PVC effect leads to strong periodic pressure pulsations in the axial direction along the water column due to the presence of an elbow in the draft tube of hydroelectric stations (HESs). In addition, the vortex rotation frequency may coincide with the natural frequencies of the constituent parts of the HES structure [6], causing resonance. A sharp increase in the amplitude of vibrations reduces the hydroturbine efficiency and can damage the hydraulic unit due to fatigue accumulation. Theoretically describing the PVC phenomenon in the draft tube is difficult due to the complex structure of the flow through the turbine with a complex geometric shape [4].
Transient regimes are associated with the adjustment of the opening of the guide vanes when switching the hydroturbine from one steady-state operation mode to another or when changing the load on the runner. Most of these regimes are highly unsteady and involve a sharp change in flow and load parameters on the hydroturbine components over time. Significant changes in flow rate lead to a dynamic change in the flow section pressure in the form of a water-hammer event.
Recent studies of the PVC effect [7,8,9] have focused on developing methods for controlling and suppressing PVC in hydroelectric units, wherein data on the influence of vortex phenomena on the transient turbine are poorly presented in the literature. Transient regimes can occur in regions with a PVC, so it is of considerable interest to study the mechanisms of PVC formation in various transient regimes. The research [10] focuses on the dynamics of the PVC formation during the load variation employing transient numerical simulations. The results indicate four flow regimes with different characteristics during PVC formation. One of these is the presence of a developed rotating rope occurring at the part-load condition.
The features of the flow velocity and pressure distributions in transient regimes require that hydraulic turbines withstand extreme loads during normal, emergency or off-design transient operation [11]. Transient processes can be described by one-dimensional unsteady flow equations with known turbine characteristics [12,13].
The influence of transient regimes on the operation of hydraulic turbines has been studied experimentally and simulated numerically. It has been shown that a sudden decrease in turbine load is the most dangerous transient mode of operation [11] from the point of view of pressure pulsations. However, before shutting down the generator, it is possible to break a turbine with closed guide vanes to prevent possible rotor overspeed. In this case, the amplitude of pressure pulsations in the rotor is decreased [14], resulting in a reduction in the fatigue of the blade material.
Avdyushenko et al. [15] have proposed a method for calculating unsteady three-dimensional flows in hydroturbines of power plants in transient regimes. The method is based on the simultaneous solution of Reynolds equations for incompressible fluid flow on moving meshes, the runner rotation equation and the system of one-dimensional equations describing the propagation of elastic hydraulic shock in the flow domain. It is possible to use unconventional approaches to the numerical simulation of transient regimes. Kolšek et al. [16] calculated the rotational speed after a transient event (turbine sudden load rejection) as a function of the forces induced by the flow field.
Analytical models have been developed to study transient operating modes. For example, an approach based on the harmonic balance technique [17] has been used as a quasi-steady-state method to reduce the simulation time and capture the behavior of the system during a transient process. Yan et al. [18] have proposed an approach based on nonlinear dynamics and developed a nonlinear mathematical model of the hydroturbine governing system. The model identified some conditions for the occurrence of unsteady states in a transient regime.
In small-scale power generation systems, transient regimes also have an appreciable effect on hydroelectric units [19]. Investigation of transient regimes in pump-as-turbine (PAT) microhydroturbines has shown that a microhydroturbine operating in a transient mode has a lower efficiency than in steady-state operation.
The cited articles [12,13,14,15,16,17,18] describe approaches to the study of transient regimes that are generally based on numerical modeling and building analytical models. At the same time, verification of numerical data and testing of analytical models rely as a rule, solely on the integral characteristics of hydraulic turbines such as head, flow rate and torque on the shaft. However, to assess the accuracy of the calculations, experimental data on the flow distribution behind the turbine impeller are also required. Full-scale experiments on real hydraulic turbines have a number of limitations: it is difficult to reproduce the same operating regime, and the range of regimes in which a hydraulic turbine can operate is very narrow. Reliable experimental data can be obtained from measurements of the local characteristics of flow using the noncontact optical method of the laser-Doppler anemometer (LDA) on lab-scale test rigs [6,20]. Fortunately, model studies related to practical needs reveal new physical phenomena; for instance, those associated with the reconnection of a vortex filament and subsequent separation of a vortex ring, which can cause a significant pressure pulse in the draft tube of a hydraulic turbine [21].
The objective of this study was to investigate unsteady vortex phenomena during the transient operation of an air model of a hydroturbine. The novelty of the work is the use of an unconventional approach (modeling using air) to simulate transient operating modes of a hydroturbine. The replacement of water with air simplifies the sealing of joints and makes it possible to quickly change the draft tube geometry and use inexpensive plastic tubes capable of withstanding varying loads to mount the aerodynamic setup [6,22]. It should be noted that this modeling method has some limitations. In particular, using air, only precavitation flow regimes can be simulated, hydroacoustic effects cannot be taken into account, and there is a difference in sound speed between air and water. It is impossible to consider the influence of the cavitation effect on the vortex rope, but this effect is secondary since the vortex rope is also formed in precavitation flow regimes.
In this study, all experiments were performed on a Francis-99 draft tube model [23]. Particular attention is paid to the method for studying PVC features in transient modes, which allows a comprehensive examination of this phenomenon. The results of the modeling show great similarity with the steady-state modes of operation of the hydroturbine.
2. Research Methods
In the modeling of transient regimes, an important parameter is the ratio of the PVC period to the transient time since transient times that are too short can cause the influence of previous transients on the current one and their overlap. Estimation of the ratio of the PVC period to the transient time is important for comparing our results with literature data on transient regimes modeled using water as a working medium. In our experiments, the PVC frequency was about 20 Hz, and the times of transient processes were about 1–5 s. In modeling using water, a PVC frequency of 3.6 Hz and a transient time of 10 s were obtained [1]. In the two cases, the ratio of the PVC period to the transient time is approximately the same, suggesting that similar physical conclusions can be drawn from experiments using air and water as a working media.
To model the conditions for PVC formation, we did not simulate the entire hydroturbine channel, including the spiral case, the guide vanes and the runner, but we used a simplified geometry consisting of two swirlers, one stationary and one rotating, arranged in series. This makes it possible to simulate the velocity distribution at the inlet of the draft tube model that coincides with the velocity distribution at the inlet of the full-scale turbine draft tube [24,25,26]. The blades were designed so as to provide optimum performance of Francis hydraulic turbines [27] (Best Efficiency Point, BEP), which for the scale of the given test section, corresponds to a volumetric flow rate Qc = 0.049 m3/s and a speed of the clockwise rotating runner nc = 2432 rpm.
Some parts of the setup were created using a 3D printer, which allows a quick and accurate reproduction of the complex geometric boundary conditions in the test section. The Francis-99 draft tube cone with an entrance diameter D = 100 mm was made by 3D printing (Figure 1). The aerodynamic setup can be used to study flows with Reynolds numbers from 12,000 to 60,000, which correspond to the air flow rate range from 0.3Qc to 1.5Qc at room temperature, 296 K. The air flow was fed by a 7.5 kW MT-08 vortex blower with a maximum flow rate of 0.153 m3/s and a pressure head of 0.4 bar. The flow enters the working section through an inlet and passes through the first stationary vane swirler, which acts as a guide vane. It is followed by a rotating element—a runner with an attached cowl. The rotating swirler is driven through a shaft connected to an external servo drive. The cone had a 3 cm wide cut-out along the entire length, covered with transparent glass. In addition, two holes were provided on the sides of the cone to mount microphone sensors. Having passed through the working volume, the air enters the draft tube and then exits to the atmosphere. The air is supplied to the model under study using a blower fan. An expansion section with stilling grids and a confuser are placed into the aerodynamic circuit to equalize the flow in front of the working section [6].
The flow velocity at local points of the test section was measured with a LAD-06i laser-Doppler anemometer (LDA). The flow was seeded using an atomizer filled with paraffin oil and connected to a compressor.
The required regime (flow rate and rotor speed) was established using a special program. In addition, the program was used to change regimes and record signals from acoustic sensors. The program allows experiments to be performed at both constant and varying flow rates (transient regimes). In transient regimes, the following parameters were set: the lower frequency on the frequency converter controlling the blower motor, the upper frequency, the rotor speed (constant) and the number of transient cycles. Since the transient time is about a few seconds, it was decided to abandon the use of proportional-integral-differentiating (PID) flow control since the flow rate in transient processes is established in a few minutes, even with the optimally selected PID controller coefficients.
For acoustic measurements, Behringer ECM 8000 microphones were used. A description of the sensor for measuring the pressure pulsations can be found in [6]. The microphone signals were digitized by an L-Card E-440 ADC and amplified using Tube Microgain M200 preamplifiers.
The main errors are due to the inaccuracy in setting the flow rate, the frequency of rotation of the servo drive, the measurement accuracy by the LAD-06 I system and the measurement accuracy of the Behringer ECM 8000.
The errors in the experiments were mainly due to the inaccuracy in setting the operation mode, i.e., the flow rate and the speed of the servo drive. The flow rate Q was controlled by an IRVIS-RS4M-ULTRA flow meter with a measurement accuracy of 1.5%. The accuracy of setting the servo speed was 0.5%. The accuracy of the measurement of the PVC frequency and amplitude using Behringer ECM 8000 microphones was approximately 1%. The LDA system measured the speed of a single tracer particle with an error of 0.2%. For each measurement, a statistic of no less than 12,500 bursts at a local point in space was collected. This allowed the flow velocity at a given point to be determined with a confidence interval of 99.7% since each velocity component was averaged over more than 6000 measurements.
3. Results
For the study, we used the transient regime from the part-load point with a flow rate Q = 0.51Qc to the best efficiency point of the turbine with Q = Qc and back. The swirl speed n was constant and equal to 40.5 Hz. These parameters were chosen because at the turbine part-load point, there is a PVC, and at the best efficiency point, the PVC disappears [6]. To measure the characteristic lifetime of the PVC, we used different times for steady sections and different acceleration and deceleration times (flow rate changes). Each cycle was repeated 50 times, after which the results were averaged over all cycles.
Since we are dealing with unsteady signals, the Fourier transform is unsuitable for studying the signal parameters. The Fourier transform gives only the total contribution of harmonics over the entire time interval. Therefore, we need to use the window Fourier transform or wavelet transform. This provides localization of the features of the analyzed signal with time. In this work, we studied the difference signal from two microphones with sensors placed opposite each other [6] using the window Fourier transform and the wavelet transform (Mexican hat and Morlet wavelets). The window Fourier transform and the wavelet transform provide a clear visualization of the beginning and end of the PVC formation process.
To validate the experimental and data processing methods, we chose one transient regime with acceleration, deceleration, and steady-state times equal to 3 s each. Thus, the total length of one cycle of the transient regime was 12 s. An analysis of the same cycle of the transient regime is presented in Figure 2, Figure 3 and Figure 4. Figure 2 shows the difference signal spectrum obtained using the window Fourier transform. The sampling frequency of the original signal is 2048 Hz. This transform was performed using a Hanning window with a length of 1024 samples (0.5 s). The same number of samples was used for the window Fourier transform (the window overlap was 50%). These window parameters were chosen to provide good localization of the PVC signal in time with a noticeable loss in frequency. The characteristic PVC frequency is on the order of 20 Hz, which implies that approximately 10 PVC periods fit into a window with a length of 0.5 s.
Figure 3 and Figure 4 show spectrograms of the difference signal obtained using the Mexican hat and Morlet wavelets, respectively. It can be seen that for determining the PVC lifetime, it does not matter which wavelet is used since the Mexican hat and Morlet wavelets give the same result. However, the Mexican hat yields poorer frequency localization than the Morlet wavelet. The result obtained is correct since problems requiring good spatial resolution and not demanding spectral resolution are usually solved using the Mexican hat wavelet [28]. Comparing all three spectrograms, we can conclude that all three transforms are suitable for determining the PVC lifetime since they have sufficient localization in time. However, they do not provide sufficient frequency resolution of the difference signal to see how the PVC frequency changes during the transient regime since very small windows are required: one or two PVC periods can fall into one window. In this case, it makes no sense to calculate the signal frequency. Thus, it makes little difference whether the window Fourier transform or the wavelet transform is used to determine the PVC lifetime. The wavelet transform provides better localization for high-frequency processes with a short lifetime than the window Fourier transform [28]. The vortex core precession has a relatively low frequency of approximately 20 Hz; i.e., this was not a high-frequency process. In further processing of the results, we used the Mexican hat wavelet transform because we did not need a good frequency resolution of the signal.
The next experiment was performed to study the dependence of the PVC frequency on the flow rate. A transient regime from a flow rate of 0.4Qc to a flow rate of 0.7Qc was implemented. A feature of this transient process is that it is very slow: one run takes 1.5 h. This was done to record the PVC frequency throughout the transient by increasing the data array. Figure 5 shows PVC pulsation spectra for various flow rates. The PVC frequency varies in the range from 16 to 19 Hz. At a flow rate less than Q = 0.44Qc, a PVC is not observed. Then, at a flow rate Q = 0.44Qc, a PVC forms. The PVC amplitude first increases as the flow rate increases approaching the regime with the most developed PVC (Q = 0.52Qc), and then, with a further increase in flow rate, the PVC weakens, its amplitude decreases, and the PVC disappears (Q = 0.64Qc). It is interesting that the PVC frequency does not depend linearly on the flow rate since the degree of flow swirl decreases with increasing flow rate, which also affects the PVC frequency.
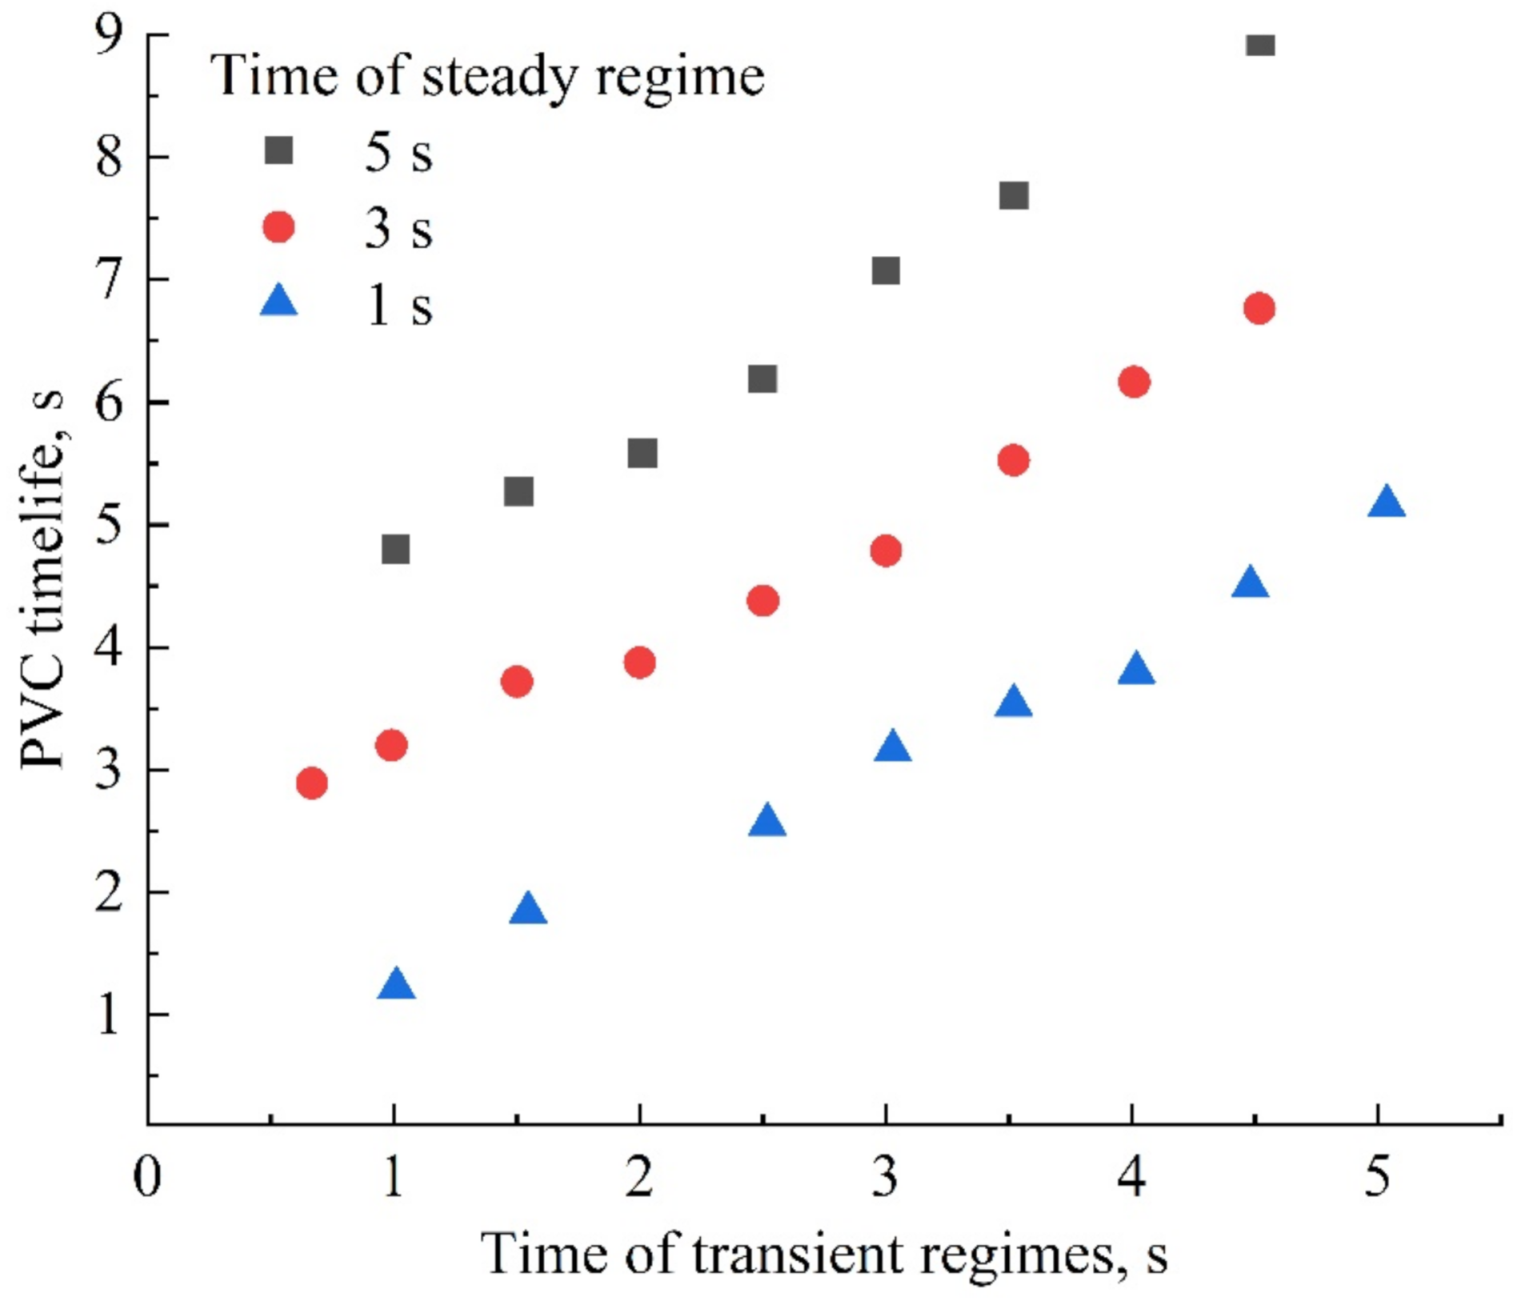
A total of approximately 50 different transient regimes with different transient and steady-state times were investigated. For each regime, a wavelet transform was performed for a difference signal from two microphones. As a result of the wavelet transform of signals, we obtained two-dimensional arrays, each of which contained 40 rows and approximately 500 thousand columns. A row (scale parameter) is the reciprocal of the signal frequency. For each array, we searched for the row with the maximum sum of the magnitudes of the difference signal received from the microphones. In other words, a search was made for the frequency at which the pulsation amplitude was maximal; this frequency corresponded to the PVC frequency. The criterion for the presence of PVC in the flow was selected based on a comparison of the levels of pressure pulsations in the case when the PVC is present and when there is no PVC. It was believed that a PVC was present in the flow when the pressure pulsations were three or more times higher than the average background pulsations. The points at the beginning and end of the PVC pulsations were determined. The PVC lifetime was determined as the length in time of the section with pulsations exceeding the background ones. For each regime, these times were calculated and then averaged over 50 cycles. Figure 6 shows a plot of the dependence of the PVC lifetime on the time length of the section with the change in flow rate for three different steady-state times (1, 3 and 5 s). The dependence of the PVC lifetime in the transient regime is inversely proportional to the transient rate. The time of the transient regime is much longer than one period of the PVC; therefore, the lifetime of the PVC is proportional to the time of the stationary section of the transient regime.
The distributions of the axial and tangential velocity components were analyzed for the transient regime from Q = 0.51Qc to Q = Qc and back. This regime corresponds to the transition from high part-load to the best efficiency point of the turbine.
The velocity profiles in this transient regime were measured at distances of 5, 15, 25, 50 and 75 mm from the rotating swirl with a step of 2 mm from the cone wall closest to the LDA to the far wall of the cone. At each point, the transient regime was repeated at least 25 times. For data processing, a spatial point was first recorded. The axial and tangential velocities with a given flow rate increment were extracted from the data array by a computer program. Next, the velocity components were averaged over all the cycles for each fixed phase, the result was saved, and another spatial point was fixed. After the program processed all the spatial points, the distributions of the axial and tangential velocities were plotted.
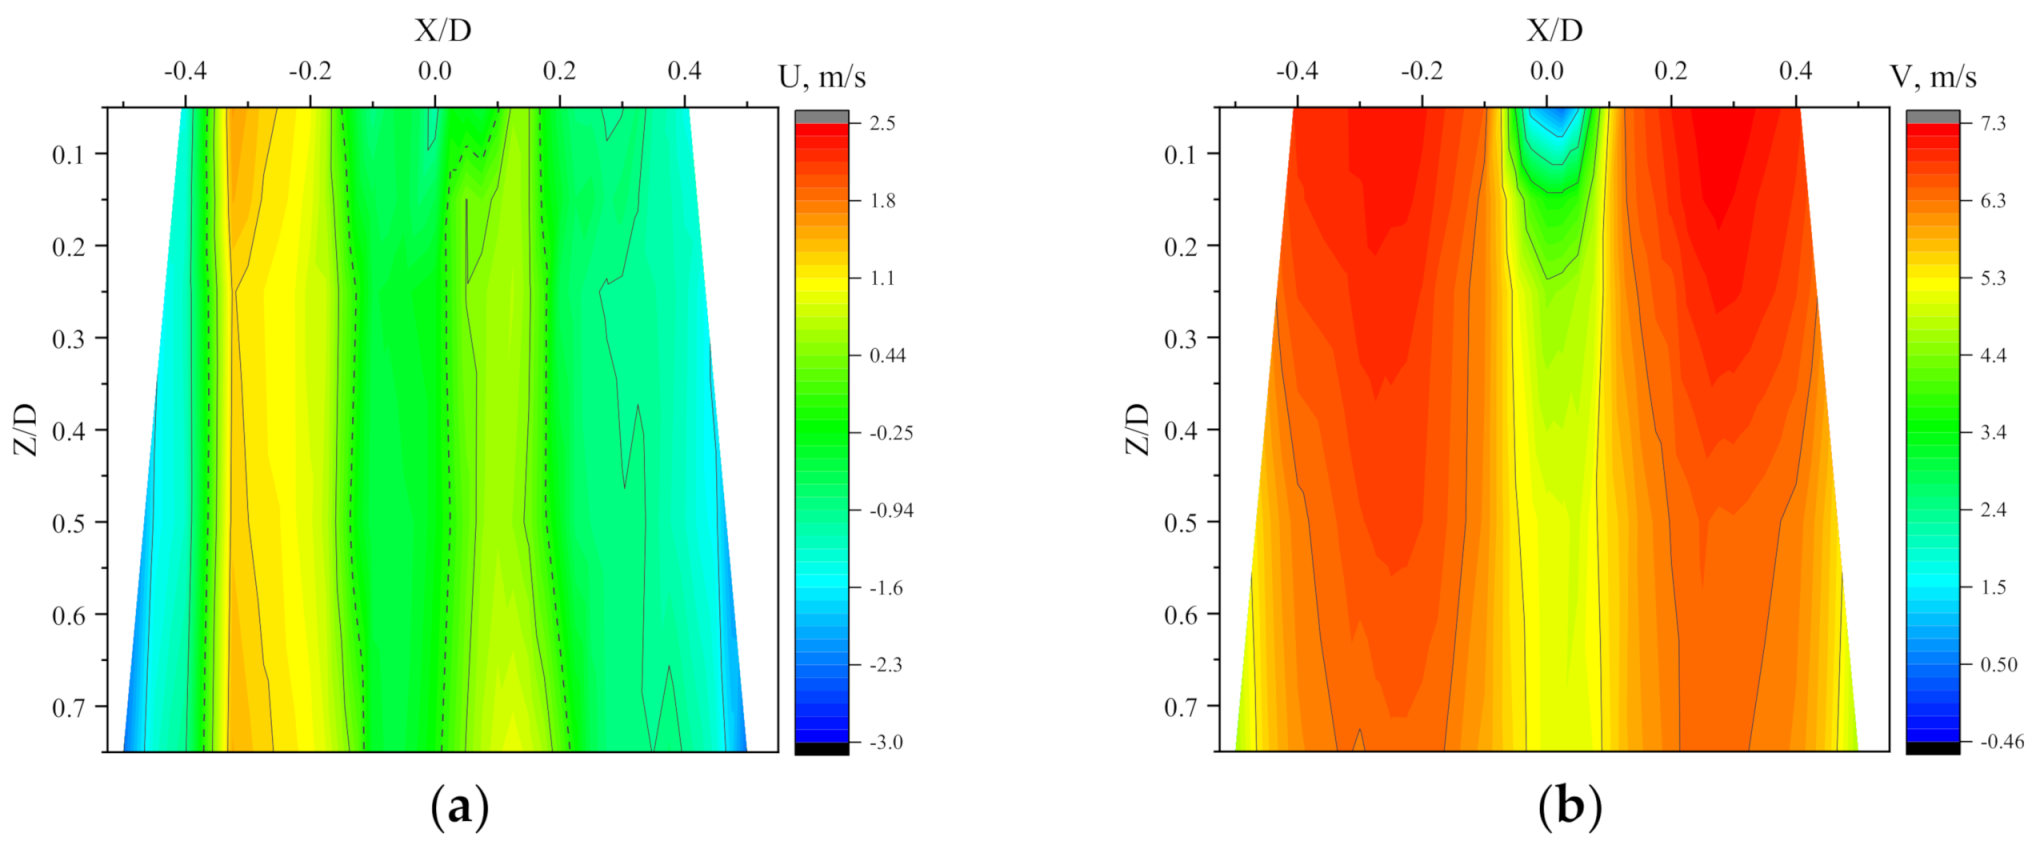
Figure 7, Figure 8, Figure 9, Figure 10 and Figure 11 show the distributions of the tangential and axial velocities for different phases in units of the phase angle, taking into account the complete transition of 360°. Phase averaging was carried out with a step of 5°; the number of LDA bursts per velocity component in a given phase was at least 500. The computer program extracts axial and tangential velocities from the data array in increments of flow rate in Q/Qc = 0.007, or 5°. Next, the selected velocities are averaged over the cycles at each spatial point, and the axial and tangential velocity distributions are built. The vortex intensity decreases with increasing phase, which can be seen from the distribution of the tangential velocity. In the case of partial load conditions at phase 0° (Figure 7), the axial momentum is much weaker than the angular momentum, and the flow is forced to squeeze along the cone wall where the axial velocity attains its maximum (Figure 7). The much wider central area, progressively increasing in transversal size when moving downstream, is near a stagnant flow. The tangential velocity shows that the vortex deviates from the central position in the cone, i.e., strong PVC motion observed in the cone (Figure 7). The tangential velocity distribution under optimal conditions with a phase of 360° shows a flow structure consisting of two swirling flows concentric in rotating in opposite directions (Figure 11). The inner part of the swirling flow with a transverse size of approximately 20 mm, slightly offset from the central axes of the cone, rotates in a counterclockwise direction, following the exit angle of the guide, but is opposite to the direction of rotation of the impeller.
Thus, the obtained distributions of the axial velocity show that at first, there is an extensive recirculation zone (shown by the white dashed line, Figure 7), which then begins to degenerate (Figure 8), and the velocity distributions approach the shape typical of the point of maximum turbine efficiency (Figure 11). For the regime Q = Qc, the tangential velocity distribution reveals two concentric counter-rotating cylindrical rod-like streams with a negative swirl (relative to the runner rotation direction) in the inner region and a positive swirl in the outer region. In the regime with PVC formation, the axial velocity appears to be almost stagnant in the core, the flow being pushed into the peripheral annular region. When approaching the optimal regime, the central valley in the axial velocity profiles is narrowed to the transverse dimension of the cowl. A comparison of the obtained profiles with the profiles for stationary regimes [6] shows their similarity, which indicates that the velocity profiles in the transition regimes change quasistatically; that they are a sequence of steady regimes.
4. Conclusions
Regimes with PVC formation in an air model of the Francis-99 turbine draft tube under transient operation conditions were studied. The transition from turbine part-load operation (Q = 0.51Qc) to the best efficiency point (Q = Qc) and back was considered. A comparison of the window Fourier transform and wavelet transforms applied to this problem is given. The characteristic times of PVC formation and the establishment of the flow regime with a change in the setup control parameters were determined using a continuous wavelet transform. Conditional averaging of sample data obtained by repetition of transient regimes was carried out to analyze the measured signals of acoustic sensors and LDA. It was found that the PVC lifetime in a transient regime is directly proportional to the acceleration/deceleration time. The dynamics of the PVC frequency and amplitude as a function of the flow rate were studied in an experiment with a slow transition from a flow rate Q = 0.4Qc to Q = 0.7Qc. Conditional averaging of the velocity distributions in the cone of the turbine model shows that the velocity distributions in transient regimes change quasistatically; i.e., they are a sequence of steady regimes between part-load operation and the best efficiency point of the turbine. The flow inertia plays a minor role in transients since one PVC period is much less than the transient time. If the transition time is of the order of the PVC period, then it will no longer be possible to observe a quasistatic picture of velocity profiles. However, an additional study of the PVC effect is required in cases where the transient process cannot be assumed to be much slower than the rotational motion of the PVC. The method proposed in this study of the PVC can be employed in further experimental investigations of the PVC effect in faster transient processes.
Author Contributions
D.S., I.L., E.G. and S.S. contributed to the paper equally. All authors have read and agreed to the published version of the manuscript.
Funding
This investigation was supported by the Russian Foundation for Basic Research (Project No.: 18-08-01467, in the part of pressure measurements and analysis of phase-averaged velocity distributions). The design and installation of the experimental setup was carried out partly within the framework of a state contract with IT SB RAS. I. Litvinov acknowledges support of the grant of the President of the Russian Federation (Project No.: МК-1504.2021.4, in the part of pressure signal analysis).
Institutional Review Board Statement
Not applicable.
Informed Consent Statement
Not applicable.
Data Availability Statement
Data sharing not applicable.
Conflicts of Interest
The authors declare no conflict of interest.
References
- Chirag, T.; Cervantes, M.J.; Bhupendrakumar, G.; Dahlhaug, O.G. Pressure Measurements on a High-Head Francis Turbine during Load Acceptance and Rejection. J. Hydraul. Res. 2014, 52, 283–297. [Google Scholar] [CrossRef]
- Jiang, L.-Q.; Fang, Z.; Zhao, Z.-L.; Zheng, A.-Q.; Wang, X.-B.; Li, H.-B. Levoglucosan and Its Hydrolysates via Fast Pyrolysis of Lignocellulose for Microbial Biofuels: A State-of-the-Art Review. Renew. Sustain. Energy Rev. 2019, 105, 215–229. [Google Scholar] [CrossRef]
- Gubin, M.F. Draft Tubes of Hydro-Electric Stations; Amerind Publishing Company for the US Bureau of Reclamation: New Delhi, India, 1973. [Google Scholar]
- Syred, N. A Review of Oscillation Mechanisms and the Role of the Precessing Vortex Core (PVC) in Swirl Combustion Systems. Prog. Energy Combust. Sci. 2006, 32, 93–161. [Google Scholar] [CrossRef]
- Tran, C.T.; Long, X.; Ji, B.; Liu, C. Prediction of the Precessing Vortex Core in the Francis-99 Draft Tube under off-Design Conditions by Using Liutex/Rortex Method. J. Hydrodyn. 2020, 32, 623–628. [Google Scholar] [CrossRef]
- Litvinov, I.; Shtork, S.; Gorelikov, E.; Mitryakov, A.; Hanjalic, K. Unsteady Regimes and Pressure Pulsations in Draft Tube of a Model Hydro Turbine in a Range of Off-Design Conditions. Exp. Therm. Fluid Sci. 2018, 91, 410–422. [Google Scholar] [CrossRef]
- Javadi, A.; Nilsson, H. Active Flow Control of the Vortex Rope and Pressure Pulsations in a Swirl Generator. Eng. Appl. Comput. Fluid Mech. 2017, 11, 30–41. [Google Scholar] [CrossRef] [Green Version]
- Pasche, S.; Avellan, F.; Gallaire, F. Optimal Control of Part Load Vortex Rope in Francis Turbines. J. Fluids Eng. 2019, 141, 081203. [Google Scholar] [CrossRef]
- Tanasa, C.; Ciocan, T.; Muntean, S. Numerical Assessment of Pulsating Water Jet in the Conical Diffusers. AIP Conf. Proc. 2017, 050002. [Google Scholar] [CrossRef]
- Sotoudeh, N.; Maddahian, R.; Cervantes, M.J. Investigation of Rotating Vortex Rope Formation during Load Variation in a Francis Turbine Draft Tube. Renew. Energy 2020, 151, 238–254. [Google Scholar] [CrossRef]
- Jiménez, O.F.; Chaudhry, M.H. Stability Limits of Hydroelectric Power Plants. J. Energy Eng. 1987, 113, 50–60. [Google Scholar] [CrossRef]
- Wylie, E.B.; Streeter, V.L.; Suo, L. Fluid Transients in Systems; Prentice Hall, Prentice-Hall International: Upper Saddle River, NJ, USA; London, UK, 1997; ISBN 978-0-13-934423-7. [Google Scholar]
- Zhang, X.; Cheng, Y. Simulation of Hydraulic Transients in Hydropower Systems Using the 1-D-3-D Coupling Approach. J. Hydrodyn. 2012, 24, 595–604. [Google Scholar] [CrossRef]
- Mulu, B.G.; Jonsson, P.P.; Cervantes, M.J. Experimental Investigation of a Kaplan Draft Tube—Part I: Best Efficiency Point. Appl. Energy 2012, 93, 695–706. [Google Scholar] [CrossRef]
- Avdyushenko, A.Y.; Cherny, S.G.; Chirkov, D.V.; Skorospelov, V.A.; Turuk, P.A. Numerical Simulation of Transient Processes in Hydroturbines. Thermophys. Aeromech. 2013, 20, 577–593. [Google Scholar] [CrossRef]
- Kolšek, T.; Duhovnik, J.; Bergant, A. Simulation of Unsteady Flow and Runner Rotation during Shut-down of an Axial Water Turbine. J. Hydraul. Res. 2006, 44, 129–137. [Google Scholar] [CrossRef]
- Cvijetic, G.; Culic, L.; Jasak, H. Analysis of Transients in Francis Turbine Using Fourier Methods. In Proceedings of the AIAA Scitech 2019 Forum, San Diego, CA, USA, 7–11 January 2019. [Google Scholar] [CrossRef]
- Yan, D.; Wang, W.; Chen, Q. Nonlinear Modeling and Dynamic Analyses of the Hydro–Turbine Governing System in the Load Shedding Transient Regime. Energies 2018, 11, 1244. [Google Scholar] [CrossRef] [Green Version]
- Madeira, F.C.; Fernandes, J.F.P.; Pérez-Sánchez, M.; López-Jiménez, P.A.; Ramos, H.M.; Costa Branco, P.J. Electro-Hydraulic Transient Regimes in Isolated Pumps Working as Turbines with Self-Excited Induction Generators. Energies 2020, 13, 4521. [Google Scholar] [CrossRef]
- Bosioc, A.; Tanasa, C.; Muntean, S.; Susan-Resiga, R. 2D LDV Measurements and Comparison with Axisymmetric Flow Analysis of Swirling Flow in a Simplified Draft Tube. In Proceedings of the 3rd IAHR International Meeting Workgroup on Cavitation and Dynamic Problem in Hydraulic Machinery and Systems, Brno, Czech Republic, 14–16 October 2009; pp. 551–560. [Google Scholar]
- Skripkin, S.G.; Tsoy, M.A.; Kuibin, P.A.; Shtork, S.I. Study of Pressure Shock Caused by a Vortex Ring Separated From a Vortex Rope in a Draft Tube Model. J. Fluids Eng. 2017, 139, 081103. [Google Scholar] [CrossRef]
- Nishi, M.; Yoshida, K.; Yano, M.; Okamoto, M.; Miyagawa, K.; Liu, S. A Preliminary Study on the Swirling Flow in a Conical Diffuser with Jet Issued at the Center of the Inlet. J. Phys. Chem. 2007. [Google Scholar] [CrossRef]
- Trivedi, C.; Gandhi, B.K.; Cervantes, M.J.; Dahlhaug, O.G. Experimental Investigations of a Model Francis Turbine during Shutdown at Synchronous Speed. Renew. Energy 2015, 83, 828–836. [Google Scholar] [CrossRef]
- Litvinov, I.V.; Mitryakov, A.S.; Shtork, S.I. A Study of Transient Flow Modes in a Hydraulic Turbine Draft Tube Model. Power Technol. Eng. 2016, 50, 1–5. [Google Scholar] [CrossRef]
- Skripkin, S.; Tsoy, M.; Kuibin, P.; Shtork, S. Swirling Flow in a Hydraulic Turbine Discharge Cone at Different Speeds and Discharge Conditions. Exp. Therm. Fluid Sci. 2019, 100, 349–359. [Google Scholar] [CrossRef]
- Skripkin, S.; Tsoy, M.; Shtork, S.; Hanjalić, K. Comparative Analysis of Twin Vortex Ropes in Laboratory Models of Two Hydro-Turbine Draft-Tubes. J. Hydraul. Res. 2016, 54, 450–460. [Google Scholar] [CrossRef]
- Sonin, V.; Ustimenko, A.; Kuibin, P.; Litvinov, I.; Shtork, S. Study of the Velocity Distribution Influence upon the Pressure Pulsations in Draft Tube Model of Hydro-Turbine. IOP Conf. Ser. Earth Environ. Sci. 2016, 49, 082020. [Google Scholar] [CrossRef]
- Daubechies, I. Ten Lectures on Wavelets; Society for Industrial and Applied Mathematics: Philadelphia, PA, USA, 1992; ISBN 978-0-89871-274-2. [Google Scholar]
Figure 1.
Experimental section. 1—drive shaft of the runner, 2—stilling grid, 3– guide vanes, 4—runner, 5—transparent measuring window, 6—microphones, 7—cone, 8—cowl of the runner. Transparent arrows show the direction of air flow.
Figure 1.
Experimental section. 1—drive shaft of the runner, 2—stilling grid, 3– guide vanes, 4—runner, 5—transparent measuring window, 6—microphones, 7—cone, 8—cowl of the runner. Transparent arrows show the direction of air flow.

Figure 2.
Spectrogram obtained using the window Fourier transform.

Figure 3.
Spectrogram obtained using the Mexican hat wavelet transform.

Figure 4.
Spectrogram obtained using the Morlet wavelet transform.

Figure 5.
Precessing vortex core (PVC) pulsation spectra for various flow rates.

Figure 6.
Dependence of the PVC lifetime on the transient time. The steady-state times are 1, 3 and 5 s, respectively.
Figure 6.
Dependence of the PVC lifetime on the transient time. The steady-state times are 1, 3 and 5 s, respectively.

Figure 7.
Maps of tangential (a) and axial (b) velocities for a 0° phase of the transient regime. The white dotted line represents a region with a negative axial velocity.
Figure 7.
Maps of tangential (a) and axial (b) velocities for a 0° phase of the transient regime. The white dotted line represents a region with a negative axial velocity.

Figure 8.
Maps of tangential (a) and axial (b) velocities for a 90° phase of the transient regime. The white dotted line represents a region with a negative axial velocity.
Figure 8.
Maps of tangential (a) and axial (b) velocities for a 90° phase of the transient regime. The white dotted line represents a region with a negative axial velocity.

Figure 9.
Maps of tangential (a) and axial (b) velocities for a 180° phase of the transient regime.

Figure 10.
Maps of tangential (a) and axial (b) velocities for a 270° phase of the transient regime.
Figure 10.
Maps of tangential (a) and axial (b) velocities for a 270° phase of the transient regime.

Figure 11.
Maps of tangential (a) and axial (b) velocities for a 360° phase of the transient regime. The dotted line represents the line along which the speed is zero.
Figure 11.
Maps of tangential (a) and axial (b) velocities for a 360° phase of the transient regime. The dotted line represents the line along which the speed is zero.

Publisher’s Note: MDPI stays neutral with regard to jurisdictional claims in published maps and institutional affiliations. |
© 2021 by the authors. Licensee MDPI, Basel, Switzerland. This article is an open access article distributed under the terms and conditions of the Creative Commons Attribution (CC BY) license (http://creativecommons.org/licenses/by/4.0/).
Share and Cite
MDPI and ACS Style
Litvinov, I.; Suslov, D.; Gorelikov, E.; Shtork, S. Experimental Study of Transient Flow Regimes in a Model Hydroturbine Draft Tube. Energies 2021, 14, 1240. https://doi.org/10.3390/en14051240
AMA Style
Litvinov I, Suslov D, Gorelikov E, Shtork S. Experimental Study of Transient Flow Regimes in a Model Hydroturbine Draft Tube. Energies. 2021; 14(5):1240. https://doi.org/10.3390/en14051240
Chicago/Turabian StyleLitvinov, Ivan, Daniil Suslov, Evgeny Gorelikov, and Sergey Shtork. 2021. "Experimental Study of Transient Flow Regimes in a Model Hydroturbine Draft Tube" Energies 14, no. 5: 1240. https://doi.org/10.3390/en14051240
Note that from the first issue of 2016, this journal uses article numbers instead of page numbers. See further details here.