Article

Characterizing the Microscopic Anisotropic Permeabilities of Tight Oil Reservoirs Impacted by Heterogeneous Minerals

1
Institute of Unconventional Petroleum Science and Technology, China University of Petroleum, Beijing 102249, China
2
Research Institute of Exploration and Development, Xinjiang Oilfield Company, Karamay 834000, China
3
Xinjiang Key Laboratory of Shale Oil Exploration and Development, Karamay 834000, China
4
School of Earth and Space Sciences, Peking University, Beijing 100871, China
5
State Key Laboratory of Nonlinear Mechanics, Institute of Mechanics, Chinese Academy of Sciences, Beijing 100190, China
6
School of Engineering Science, University of Chinese Academy of Sciences, Beijing 100049, China
*
Author to whom correspondence should be addressed.
Energies 2022, 15(18), 6552; https://doi.org/10.3390/en15186552
Submission received: 13 July 2022 / Revised: 29 August 2022 / Accepted: 1 September 2022 / Published: 7 September 2022
(This article belongs to the Collection Flow and Transport in Porous Media)

Abstract

:
This study aimed to reveal the anisotropic permeabilities of tight oil reservoirs impacted by heterogeneous minerals. SEM imaging, image processing, fractal calculation, microscopic reservoir modeling, and visual flow simulation were carried out to investigate the above problems. Results show that the variation coefficient of two-dimensional permeability for the studied tight reservoir samples ranges from 0.09 to 0.95, with an average value of 0.68. The penetration coefficient ranges from 1.16 to 2.64, with an average value of 2.13. The ratio of maximum to minimum permeability is between 1.25 and 7.67, with an average value of 5.62. The fluid flow in tight reservoirs has significant anisotropy comprising dominant flow through conductive channels. Flow in tight oil reservoirs tends to involve minor hydraulic fracturing with no proppant.

1. Introduction

Porosity and permeability are both important physical parameters that characterize reservoir rocks. There is no doubt that permeability is one of the most indispensable parameters that directly impacts oil production. The heterogeneity and anisotropy of permeability are also related to oil recovery efficiency [1,2,3,4,5]. In order to evaluate the physical properties of rocks more efficiently, scholars have decided to define relevant parameters in two-dimensional space. Several scholars have come up with the concept of “two-dimensional porosity” via observation under a microscope to carry out the rapid and convenient evaluation of reservoirs It quantitatively describes the development of reservoir space on a two-dimensional space scale. As we know, porosity and permeability could correspond to each other in three-dimensional space, but scholars have not yet proposed the concept of “two-dimensional permeability” in the two-dimensional space as matched with “two-dimensional porosity,” so the application of “two-dimensional porosity” has been greatly restricted. Therefore, the physical property evaluation system in two-dimensional reservoirs needs to be further improved. Adhering to the principle of carrying out concept matching in the unified dimension space, the concept of “two-dimensional permeability” is proposed for the first time to improve this evaluation system [6,7,8,9,10,11].
In addition, for unconventional rocks such as shale gas reservoirs, the gas shows continuous flow, slip flow, Knudsen diffusion, and other flow characteristics in multi-scale space. Scholars have established relative apparent permeability models to characterize the cross-scale seepage characteristics of gas in shale [12,13,14,15]. As the subject of this paper focuses on tight oil, the concept of “two-dimensional permeability” introduced in this study is not as complex as the apparent permeability of gas-bearing rocks.
From a microscopic perspective, previous researchers have carried out many pore and permeability tests and established the relationship between pore and permeability of various reservoirs, but the test results and the correlation are established in three-dimensional space [16,17]. For example, Li et al. (2007) considered that pipe flow and seepage flow have unified properties [18]; they provided the generalized form of the Hagen–Poiseuille equation:
K = n π r 4 8 τ
In Equation (1), “K” is permeability, “n” is the number of capillaries in reservoir, “R” is the average radius of capillaries, and “ τ ” is the tortuosity of channels.
The above calculation method for permeability is based on single capillary analysis, and average capillary radius is selected to evaluate the permeability. Frankly speaking, it is the “average permeability” within a certain reservoir area that largely ignores the impact of micro-details on the reservoir as a whole and fails to fully consider the significance of micro-fractures as channeling channels and the reality of micro-flow inrush caused by the non-uniform distribution of pore radius values [2,19,20,21,22]. In this study, we paid full attention to these existing problems in previous studies. By combining the techniques of SEM observation, image processing, micro-reservoir framework modeling and visual micro-quantitative flow simulation, the characteristics and mechanism of the influence of reservoir properties on two-dimensional permeability were analyzed. The specific application of two-dimensional permeability in unconventional reservoir exploration and development is elaborated in order to make the evaluation system for the physical properties of reservoirs complete from a micro perspective.
A large number of previous studies and field practice have shown that, from a macroscopic perspective, dynamic fractures occur often due to unsteady changes in reservoir fluid pressure during the process of water injection. On the one hand, due to the emergence of new fractures, new flow channels have been added to provide an effective path for remaining oil production. On the other hand, due to the penetration of dynamic fractures of water injection, direct communication between production and injection wells can be quickly facilitated, resulting in water channeling and greatly reducing oil recovery. The authors believe that there should be a change in thinking in the process of water-flooding development: from the perspective of geological engineering integration, the water injection development process is actually an event involving minor hydraulic fracturing with no proppant, and the generation of dynamic fractures and the increase of pores caused by long-term water-flooding are both strong evidences of this view. Compared with the true hydraulic fracturing process, there are several essential differences when we treated the water-flooding process as an event of minor hydraulic fracturing with no proppant [23,24,25]:
(1)
In terms of process flow, the event of minor hydraulic fracturing with no proppant is only based on water injection rather than fracture making, sand filling, and displacement in the true hydraulic fracturing process;
(2)
For the injection fluid type, fluid in the event of minor hydraulic fracturing with no proppant is purely water, as opposed to fracturing fluid with high viscosity and high shear in the true hydraulic fracturing process.
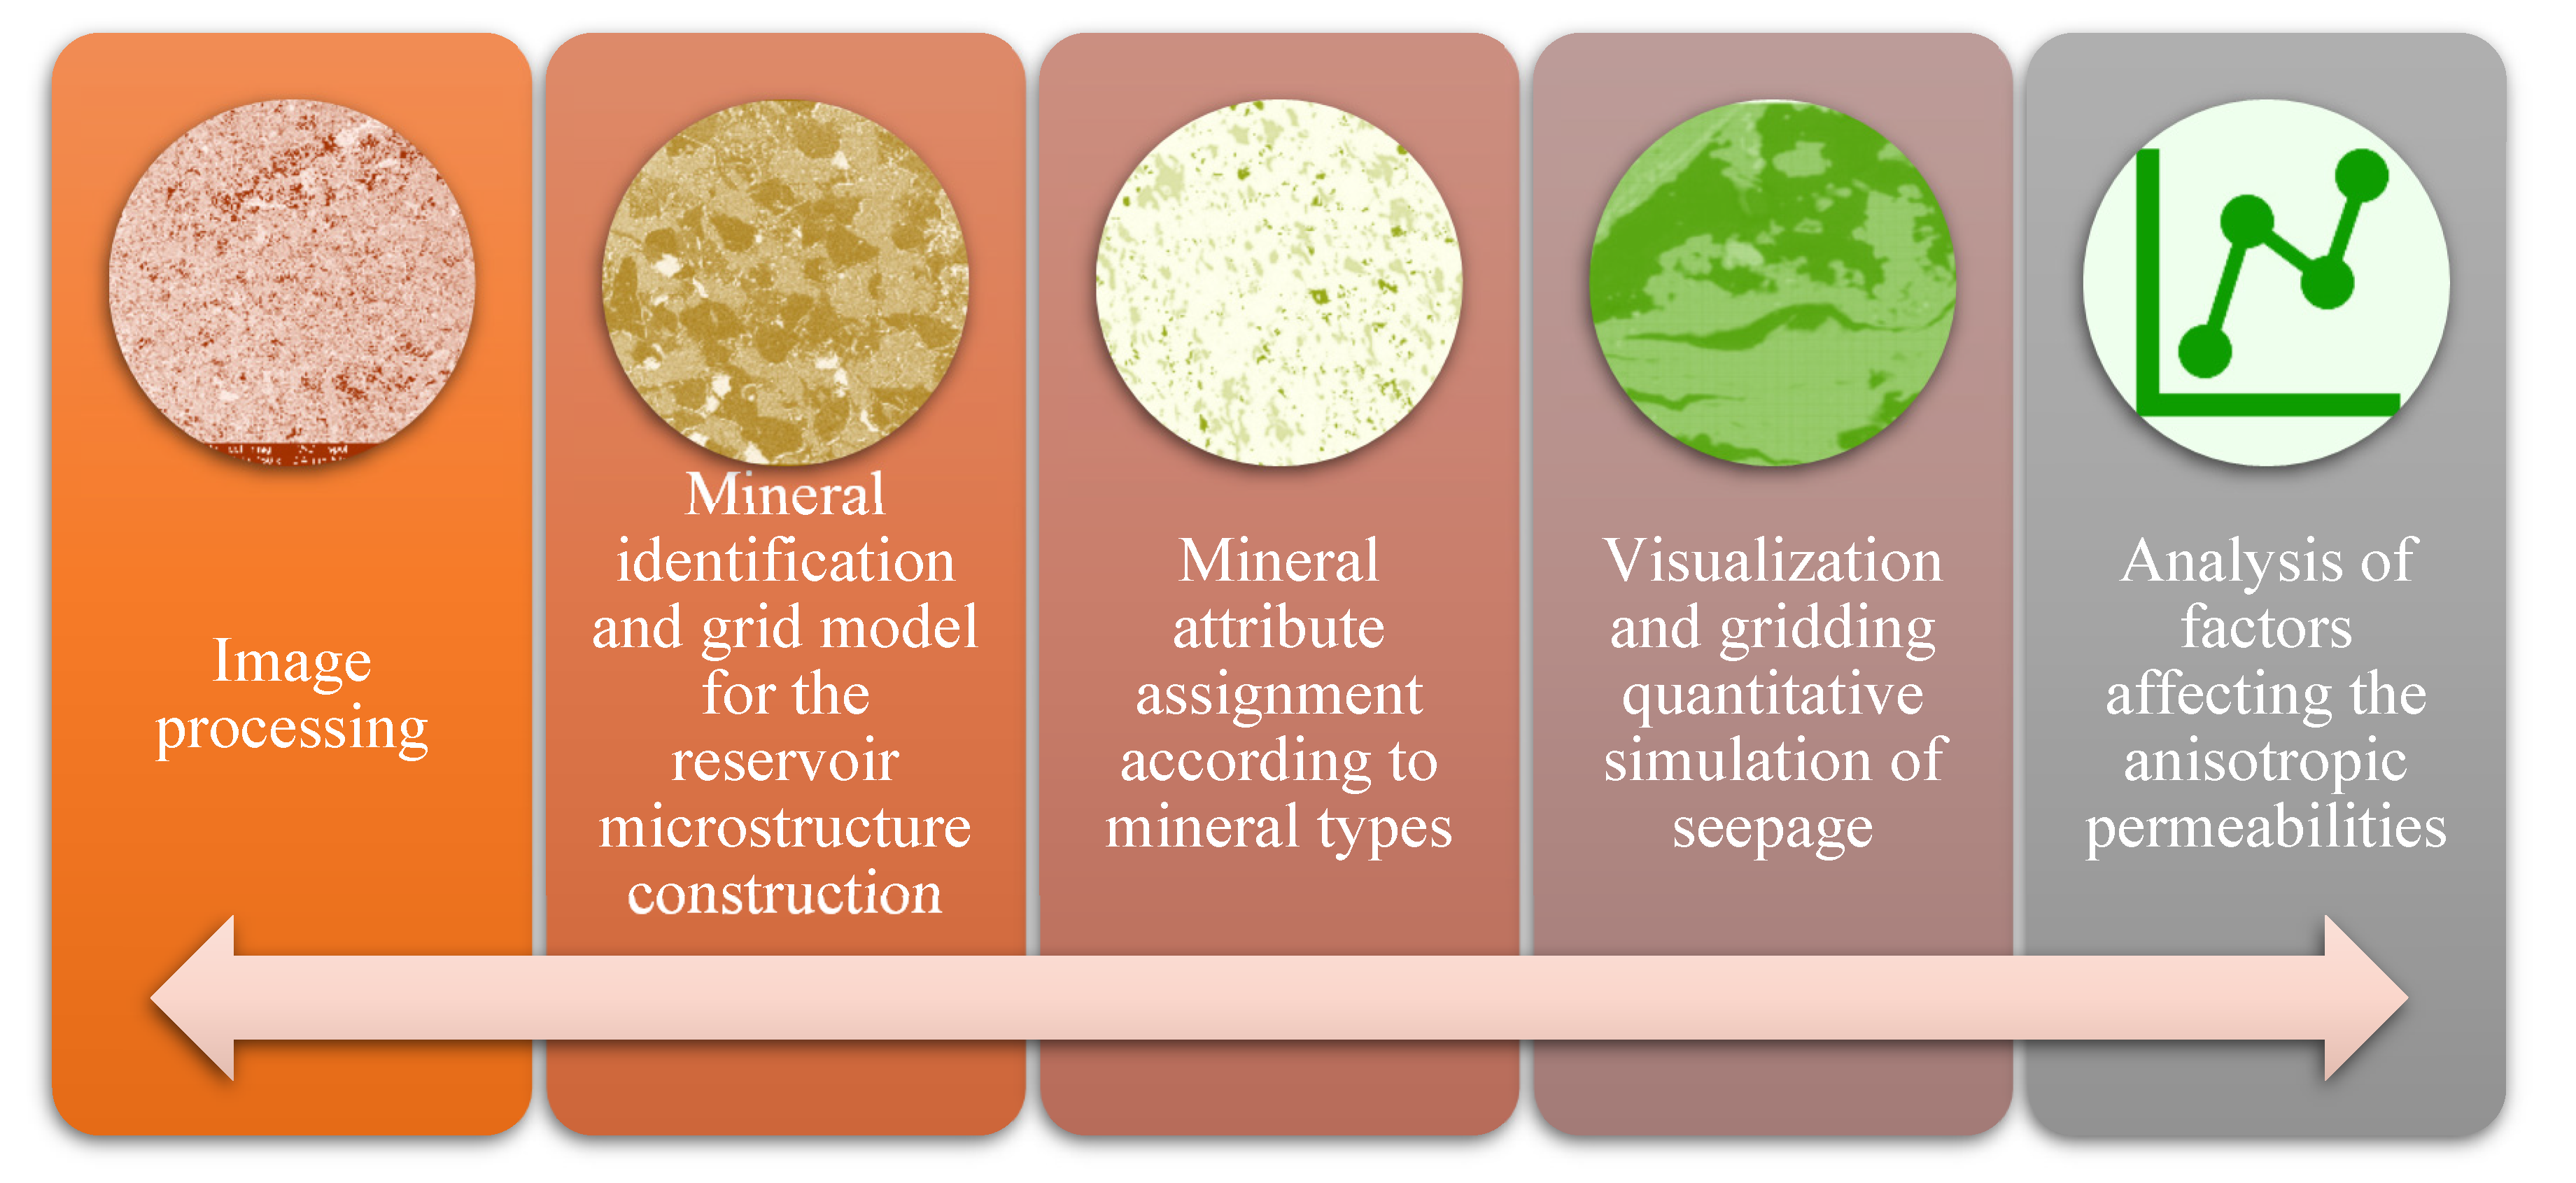
2. Methodology

The Ordos Basin is located in the west of the North China continental block, which is a large multicycle craton basin with a simple structure. The sedimentary facies of Yanchang formation, its main oil-bearing formation, are composed of large-area lake delta front and delta plain. There is a strong correlation between these oil-bearing properties and physical properties. The plane distribution range of the sand body controls the distribution range of the oil reservoir, which is conducive to the formation of large-scale lithologic oil reservoirs. The Yanchang formation is divided into ten members in total, and the seventh member is usually called the Chang 7 formation. The reservoir development of the Chang 7 formation is generally regular, and the boundaries of sand and mudstone are generally flat and widely extended. It is easy to distinguish a single sand body with a thickness of about three meters. The pinch-out phenomenon of the local sand body is apparent, and the interlayer is widely developed [26,27,28,29].
The lithology of the tight sandstone reservoir in the Chang 7 formation is mainly gray-white and gray-green medium elongated stone sandstone. It also includes lithic arkose and feldspathic lithic sandstone, with low composition maturity. The authors observed the cores of tight sandstones in the Ordos Basin (Figure 1).
Obviously, the difference in oil content is expected to be significant in the distribution of pores and the flow and imbibition characteristics. The micro cross bedding of the reservoir are developed, and the common scouring surface reflects strong hydrodynamic conditions, representing the typical characteristics of the sedimentary microfacies of underwater distributary channels (Figure 1e,f).
At the same time, natural microfractures are also developed in tight sandstone reservoirs (Figure 1e,f). Most of the remaining oil is enriched along the development location of bedding fractures. During the process of hydraulic fracturing, artificial fractures are easily linked to form more complex flow channels, which increases the difficulty of exploitation. Therefore, there is significant anisotropy in the flow behavior of the reservoir.

2.1. The Concept of “Two-Dimensional Permeability”

Porosity and permeability are important rock properties. Porosity defines a reservoir’s ability to store formation fluid, and permeability defines how easily formation fluid can flow through a reservoir [30,31,32,33]. Conventional reservoir evaluation requires a large amount of porosity and permeability test data. The porosity and permeability data of a sample could correspond relatively one-to-one within the allowable range of experimental error. However, for Chinese continental tight rock reservoirs, the porosity and permeability values are extremely low (porosity is about 10%, permeability is less than 0.3 × 10⁻³ μm2), and porosity testing is time-consuming. As a result, the accuracy of the test results decreases, causing logical inversion due to due to inaccurate flowmeter tests [34,35,36,37].
Based on the pore development in the microscopic field of view, the ratio of the area occupied by the pores in a fixed field of view to the total area of the field of view is defined as the two-dimensional porosity. Two-dimensional porosity can be quickly determined by means of microscopic evaluation, graph paper projection, image processing, etc., thus sequentially improving accuracy. Two-dimensional porosity is meant to provide a judgment basis regarding the degree of pore development in two-dimensional space so as to quickly evaluate reservoir storage capacity [38,39,40,41,42].
Correspondence between porosity and permeability was achieved in a standard core drill string (diameter = 2.5 cm and length = 5 cm) used in conventional experiments. However, in the two-dimensional space, the permeability has not been reflected in the microscopic field of view; that is, the concept of permeability corresponding to the “two-dimensional porosity” is still lacking in the two-dimensional space.
Based on this, in order to make up for the shortcomings in practical applications and highlight the new perspective, which is that all water-flooding processes in tight rocks should be treated as the events of minor hydraulic fracturing with no proppant, this paper proposes the concept of “two-dimensional permeability” based on the idea of finding the concept of permeability corresponding to “two-dimensional porosity” in two-dimensional space.
The concept of “two-dimensional permeability” refers to the ability of rocks in the plane of view to allow fluid to pass under a certain pressure difference. It is an extension of the concept of “apparent permeability” from three-dimensional space to two-dimensional space. It would be necessary for the study of all sedimentary reservoirs [43,44,45,46,47]. Its purpose is to highlight that the water-flooding development of tight rocks always refers to the coupling process of rock deformation (and even rock fracturing) and fluid flow.
The extension of the concept of “two-dimensional permeability” is the reservoir rock in the field of view. The field of view covers the microscopic view of an ordinary microscope, a field emission scanning electron microscope (FE-SEM), micro-nano CT, and focused ion beam scanning electron microscope (FIB-SEM) [48,49,50,51,52]. The field of view, in line with the concept of “two-dimensional porosity,” constitutes a parameter system for the evaluation of physical properties of planar reservoirs.

2.2. Flow Simulation

In this study, we combined field emission SEM imaging, image processing, micro-reservoir framework modeling, visual flow simulation, and other methods. The research process is shown in Figure 2. The imaging instrument used in this study is a “Quanta 650 FEG” high-resolution, multi-purpose, field emission-scanning electron microscope. This simulation method adopts the grid quantitative simulation system developed by Corelab. The simulation system takes into account the impact of the mechanical properties of minerals on fluid flow. It has great advantages in simulating the micro-flow process of multiphase fluid in porous media and in the quantitative analysis of flow speed at any position in reservoir space.
With regard to the setting of the simulation parameters, the vertical and horizontal grids are divided into grids with 86 × 100 accuracy, and the accuracy of grids is 37.4 × 37.4 μm. According to Table 1, the porosity, permeability, Young’s modulus, and Poisson’s ratio are input into the grid simulator in turn. At the same time, to maximize the impact of filling, a larger flow duration (1000 min) is set.
The simulation process is as follows: The fluid is injected from the midpoint of the horizon. With the advance of the water injection processes, according to the grid data such as porosity, permeability, and mechanical parameters, the oil–water two-phase motion equation, state equation, and continuity equation are combined to solve the non-linear equations of each grid to obtain the rate value. With the continuous injection of fluid, the fluid gradually extends to the surrounding grid, and there is a certain conductivity between the adjacent grids. The calculation results of the speed values of the adjacent grids will interact with each other during the filling process. The solution process of the equation will also be completed until the end of the program. The grid distribution of the final speed values is the plane distribution of the fluid trajectory and speed. In order to characterize the anisotropy of two-dimensional permeability, we define four two-dimensional permeabilities in the east, west, south, and north directions, which are referred to as “E-permeability”, “W-permeability”, “S-permeability”, and “N-permeability”, respectively.

3. Results and Discussions

3.1. High-Pressure Mercy Injection of the Studied Rock Samples

The results of the high-pressure mercury injection experiment show that the pore-throat radius distribution of tight sandstone in the study area is significantly heterogeneous. The maximum pore-throat radius is distributed at 0.268 μm~1.568 μm. The average value was 0.895 μm (Figure 3a). The average value of pore-throat radius is 0.066 μm~0.373 μm, while the average value was 0.217 μm (Figure 3b). The median pore throat radius is distributed at 0.023 μm~0.265 μm. The average value was 0.150 μm (Figure 3c). With an increase in the maximum pore-throat radius and the median radius, the permeability increases exponentially, and the correlation is high (Figure 3a,c). With an increase in the average pore-throat radius, permeability increases power exponentially, and their correlation is significant (Figure 3b). The pore-throat radius parameter most related to permeability is the average pore throat radius, followed by the median pore radius and, finally, the maximum pore radius. The pore-throat radius greatly affects the permeability of tight oil reservoirs (Figure 3a–c).

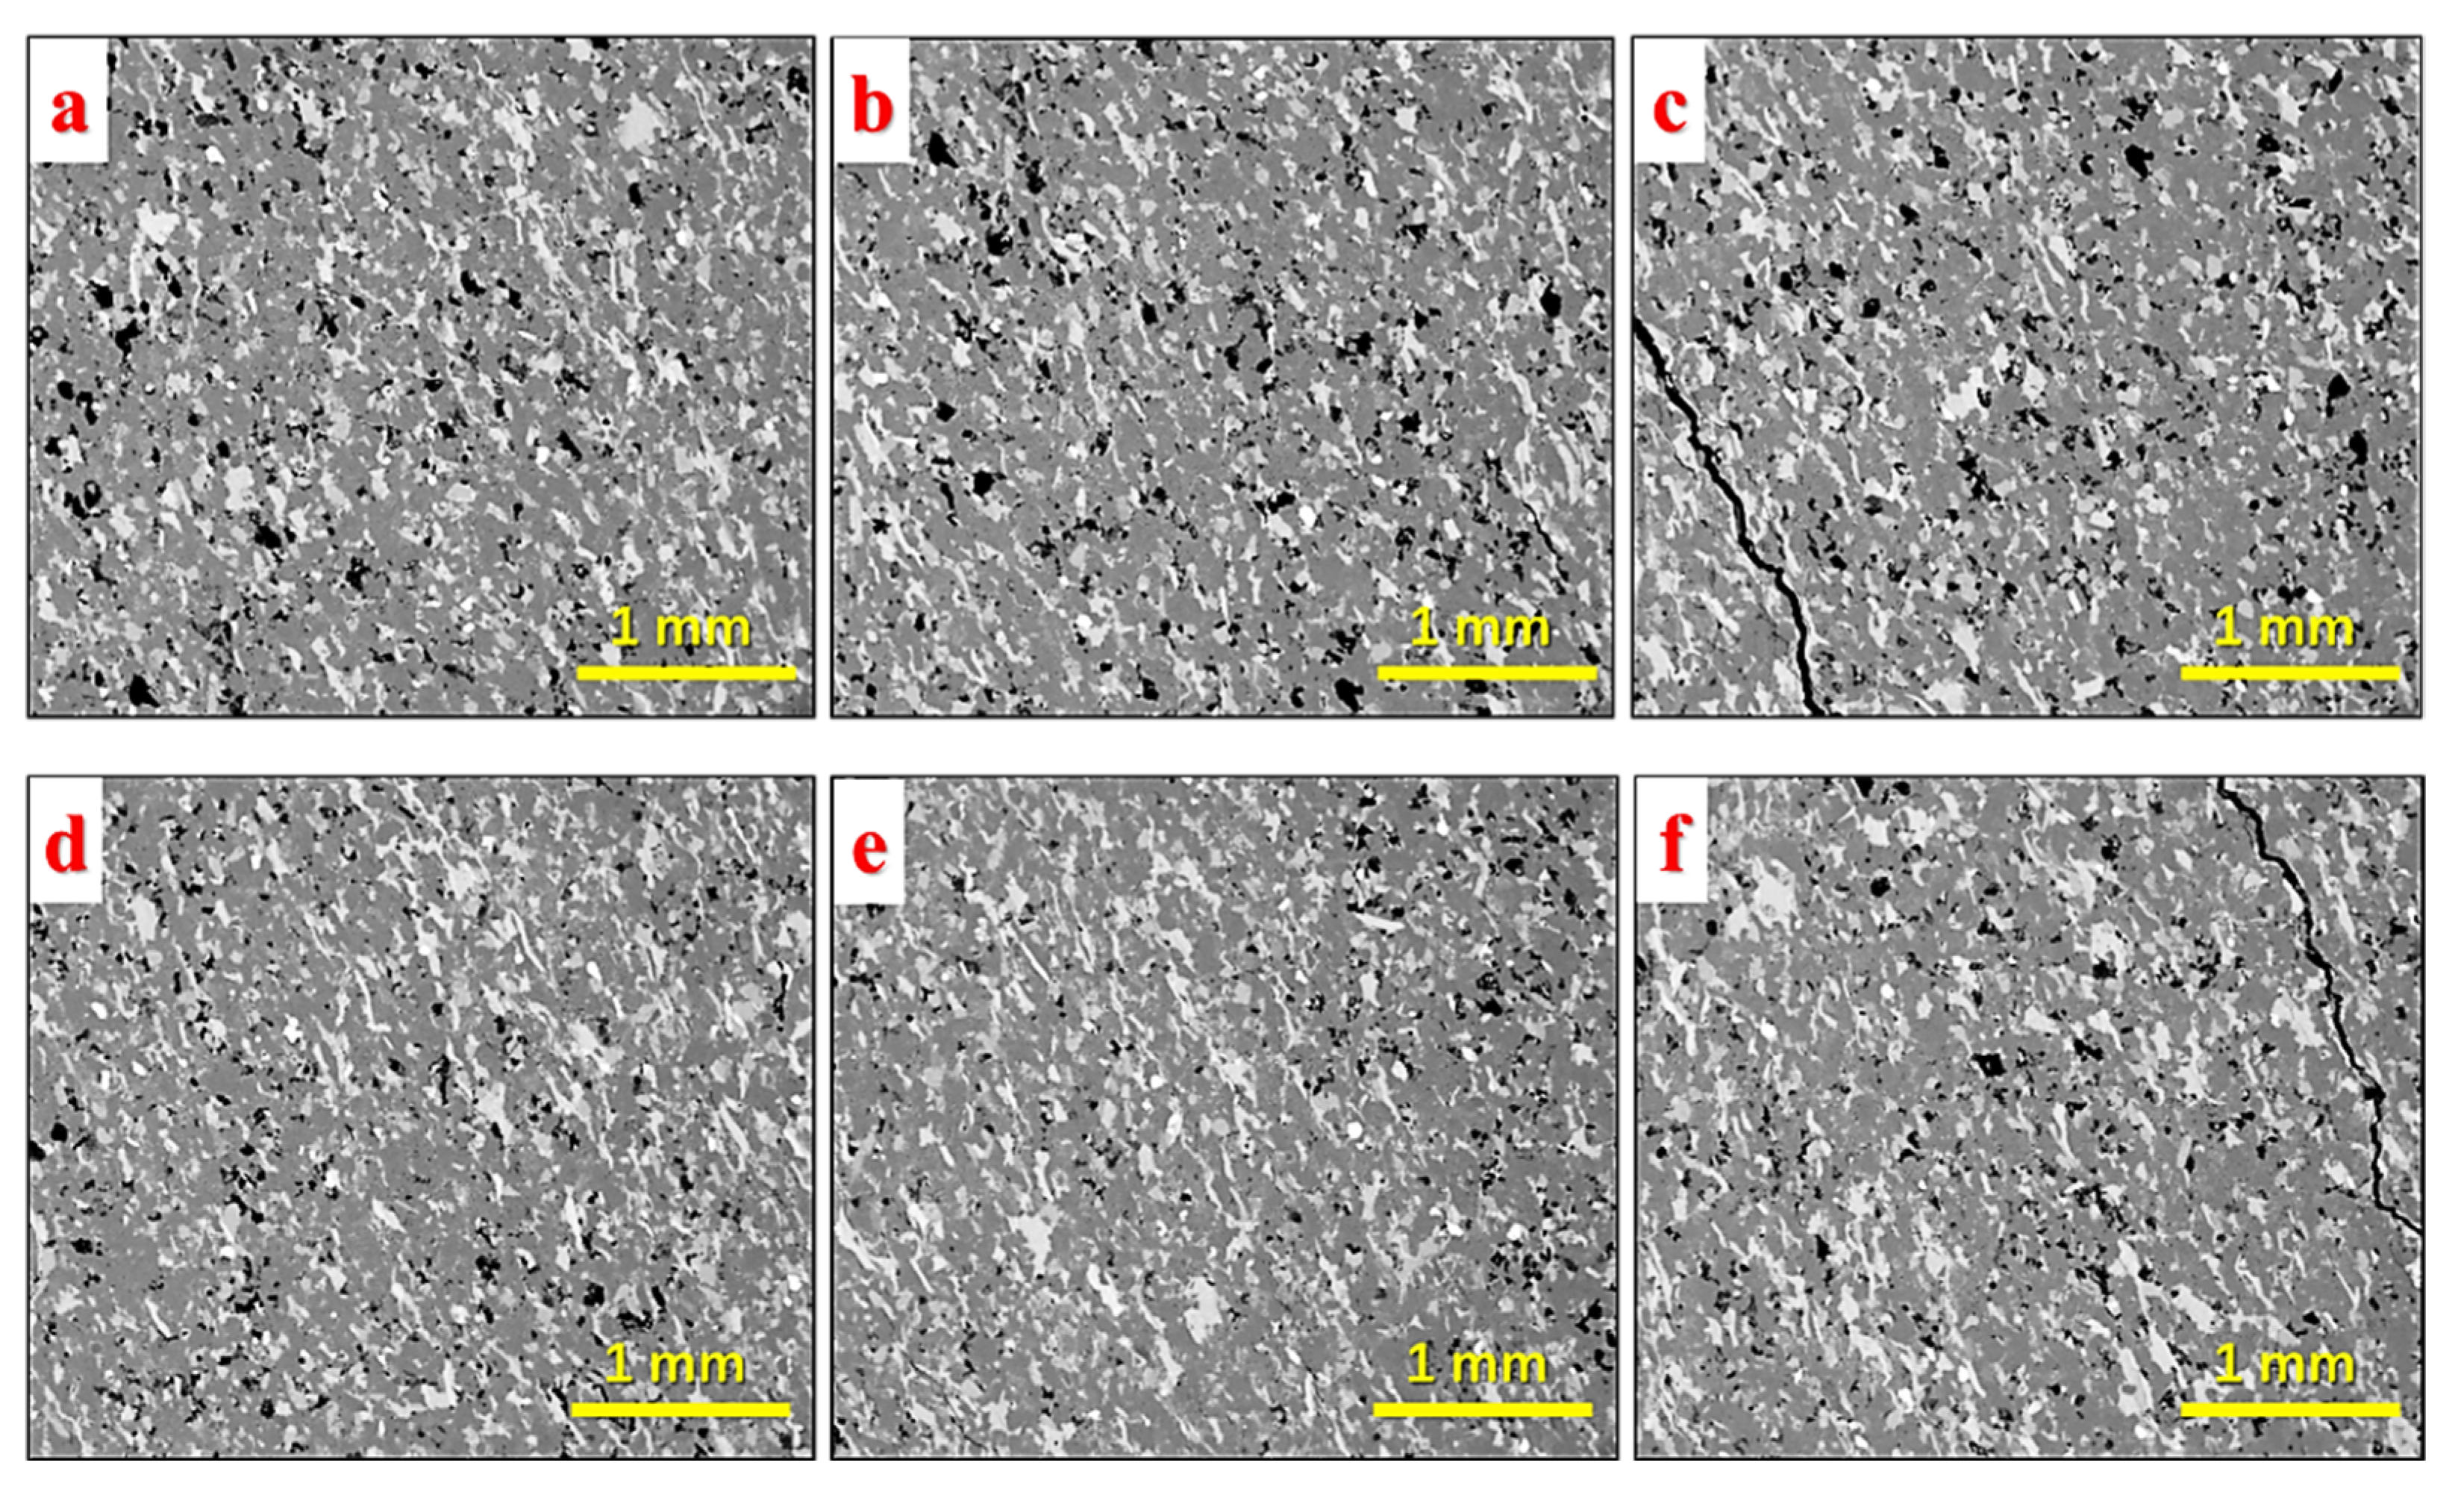
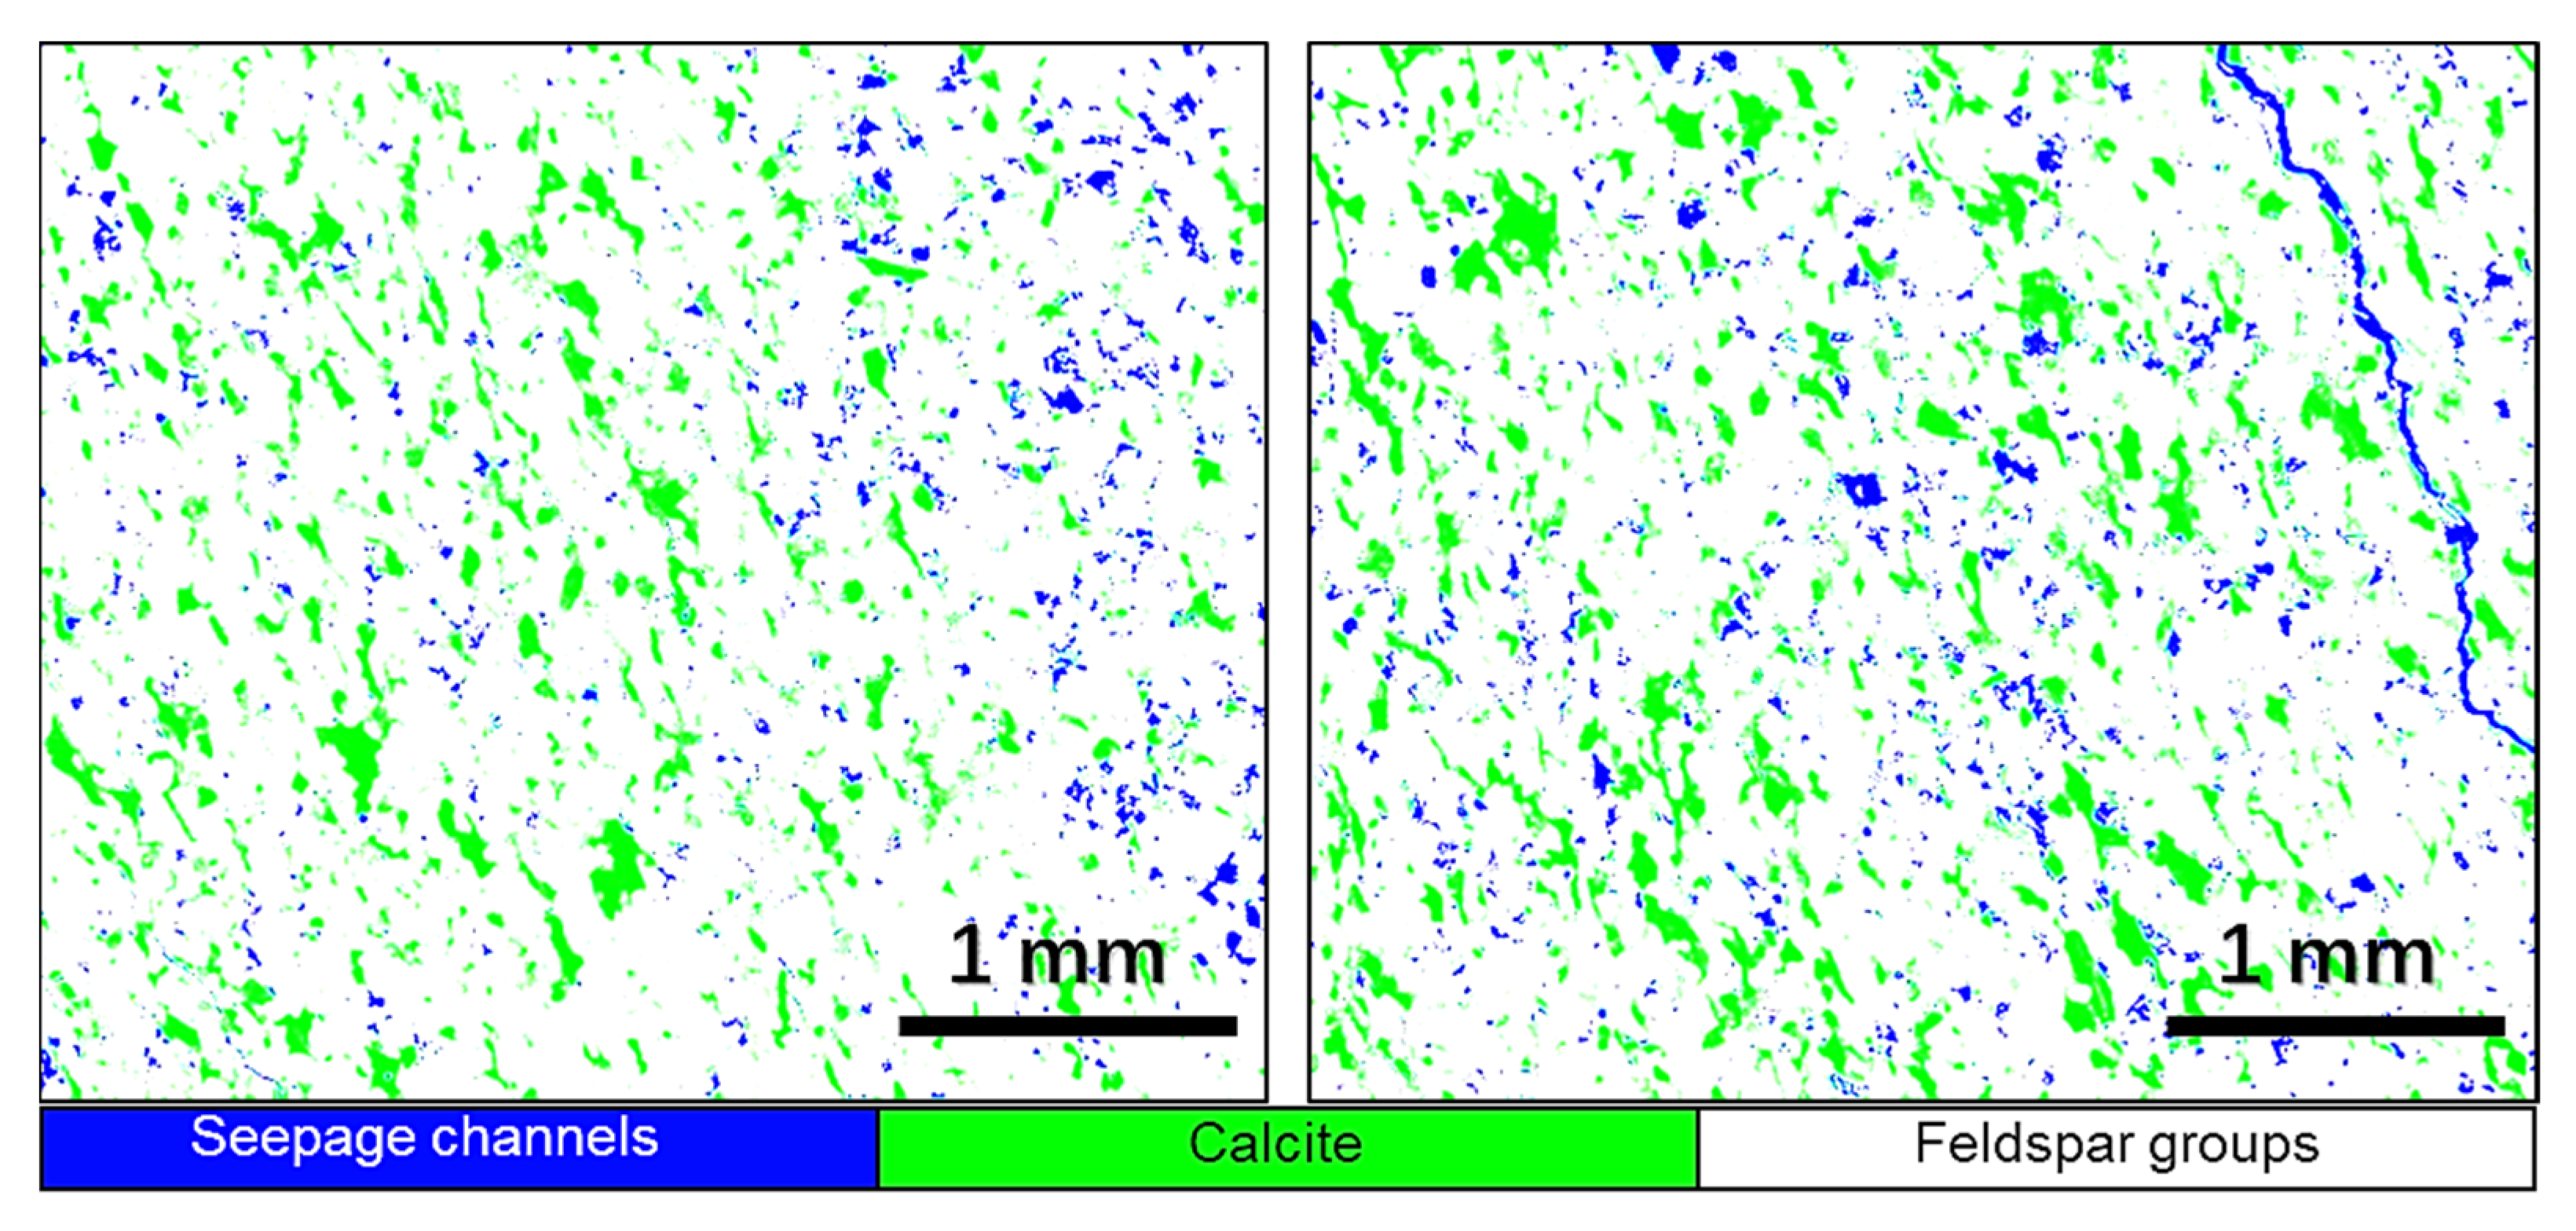
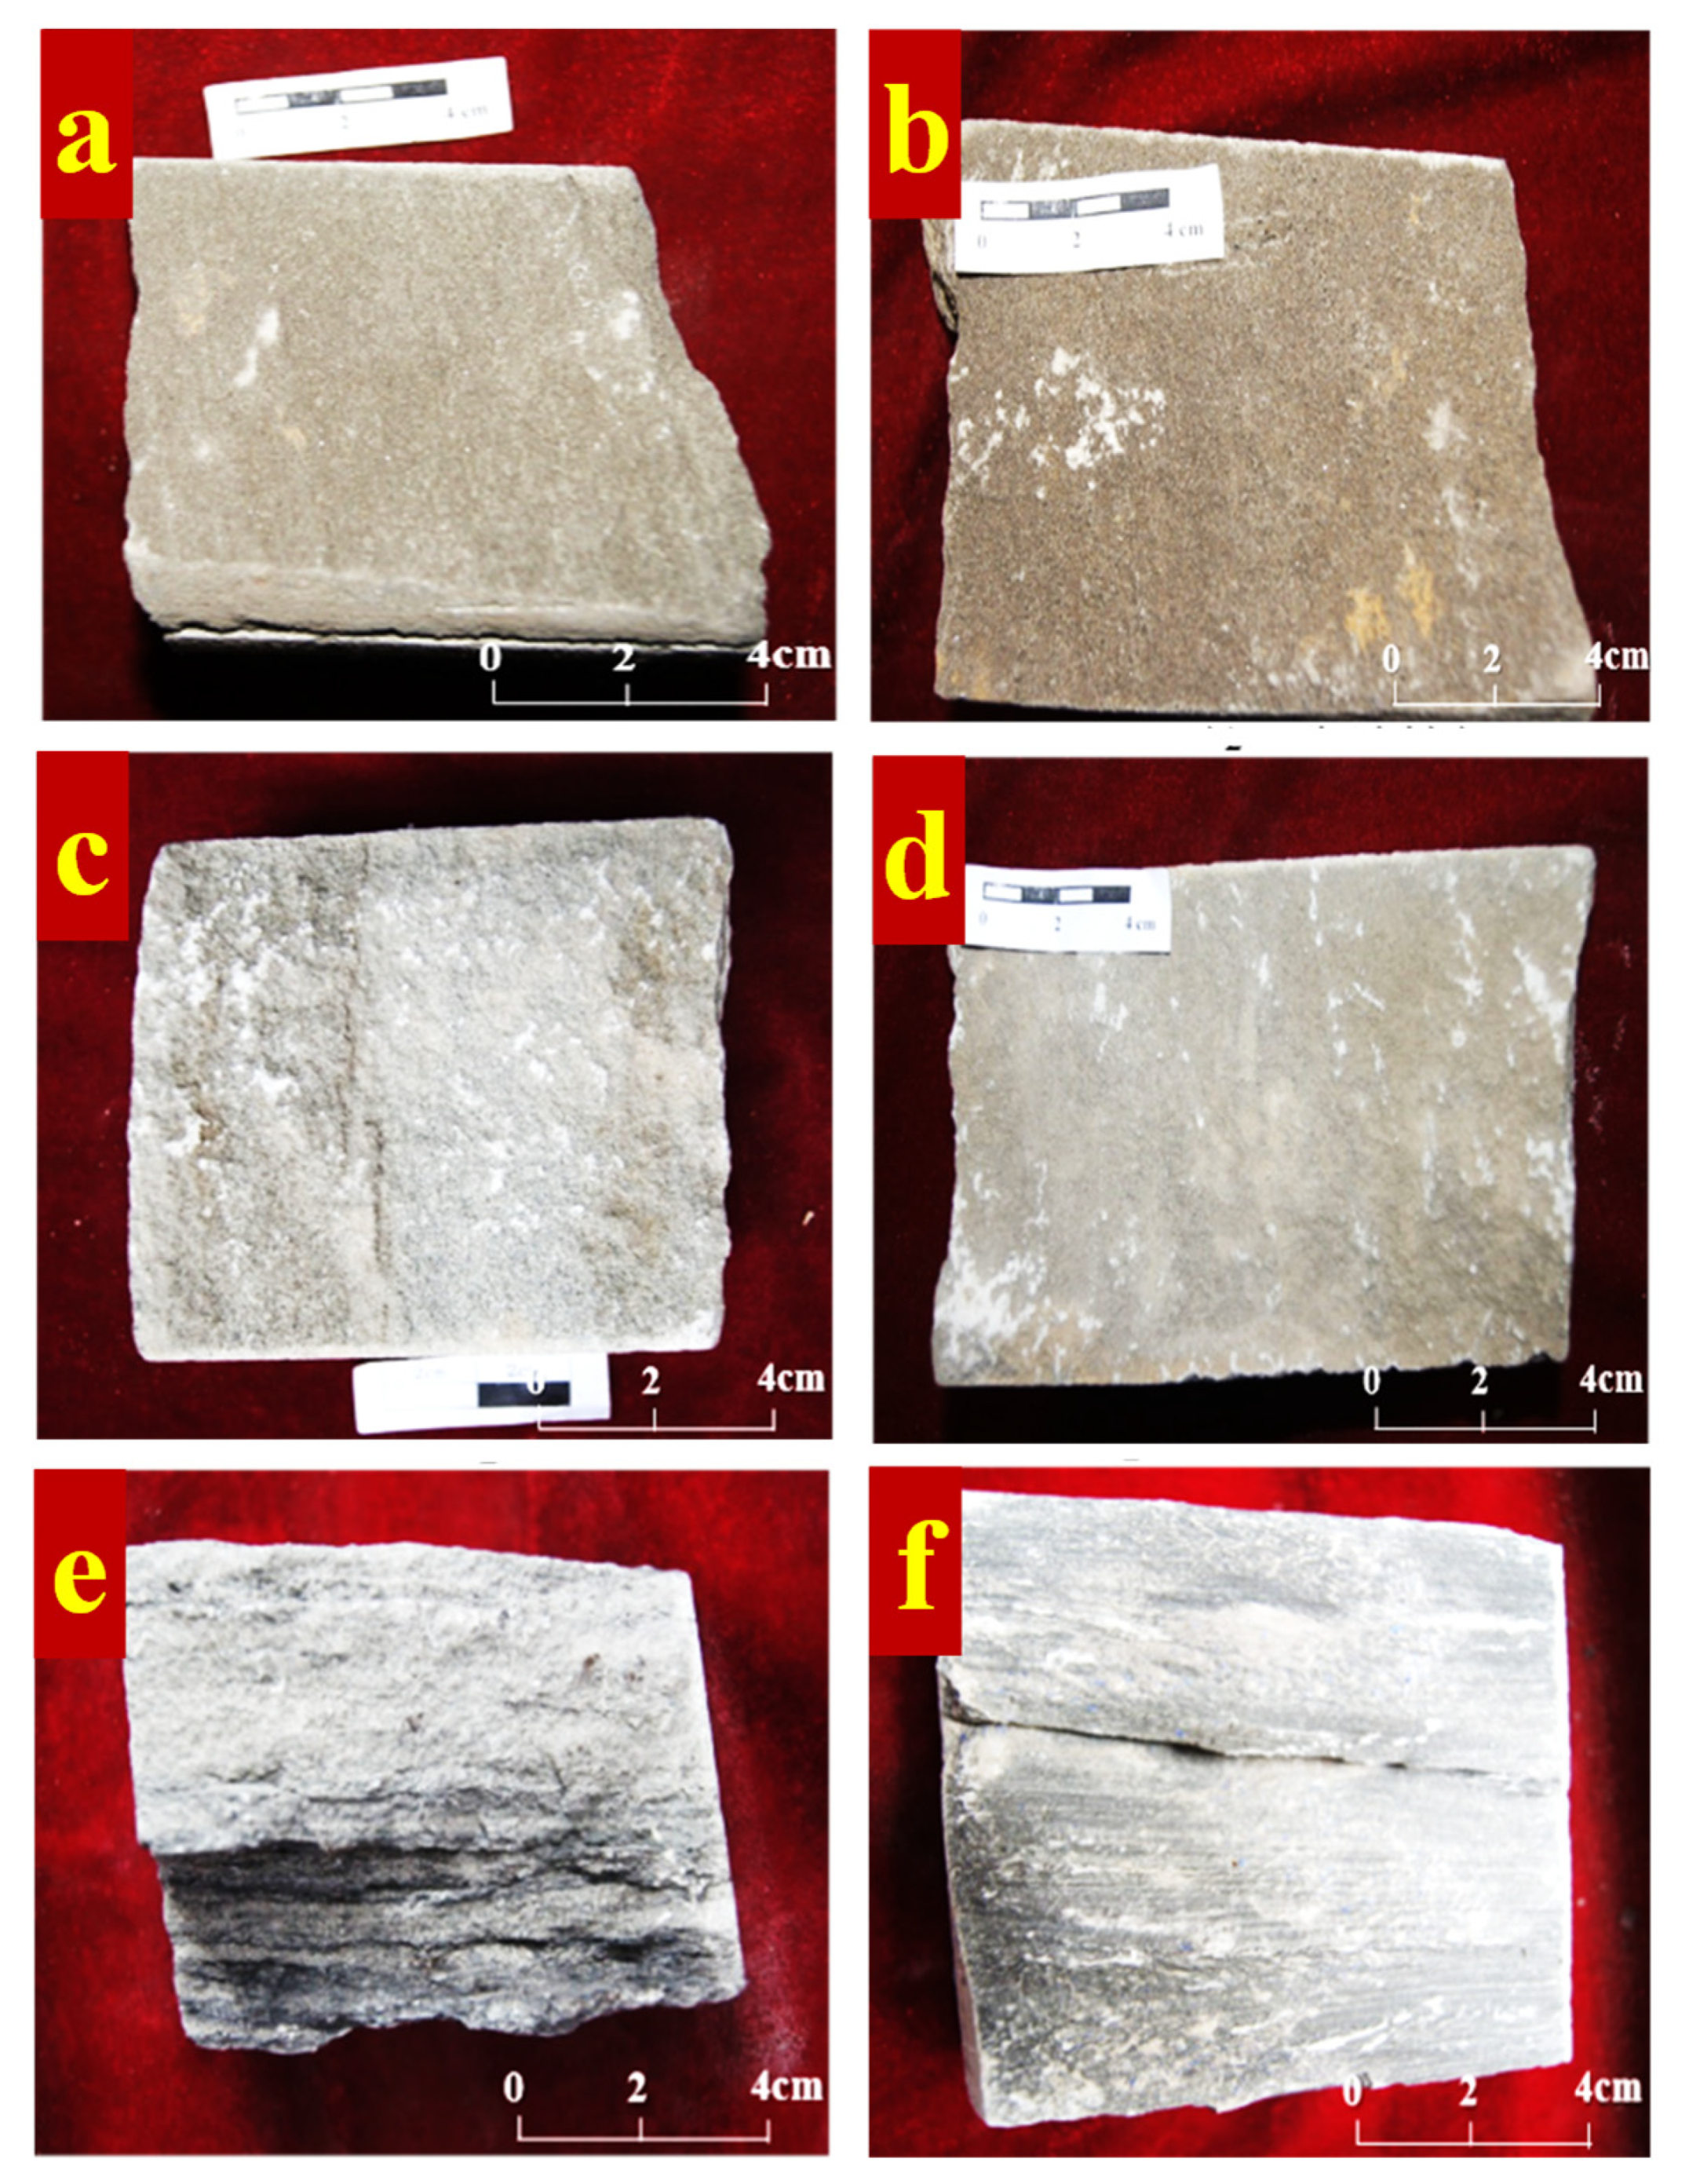
3.2. Imaging Characterization of Tight Rocks

Through the observation on tight rock reservoirs by scanning electron microscope, it is found that the overall pore development is relatively low (Figure 4). Figure 4a–f were taken from different fields of view, and they all belong to tight sandstone which are referred to as samples a–f in the following text, respectively. The samples a-f mentioned in Figure 4 and the following text do not correspond to samples a–f in Figure 1. Carbonate minerals (i.e., main calcite, a small part of dolomite) are the main cements, and some micro-fractures are visible (Figure 4c,f). At the same time, the orientation degree of pore development is high, which is basically consistent with the orientation of cements and has a significant impact on the flow characteristics in the plane horizon (Figure 4a–f).

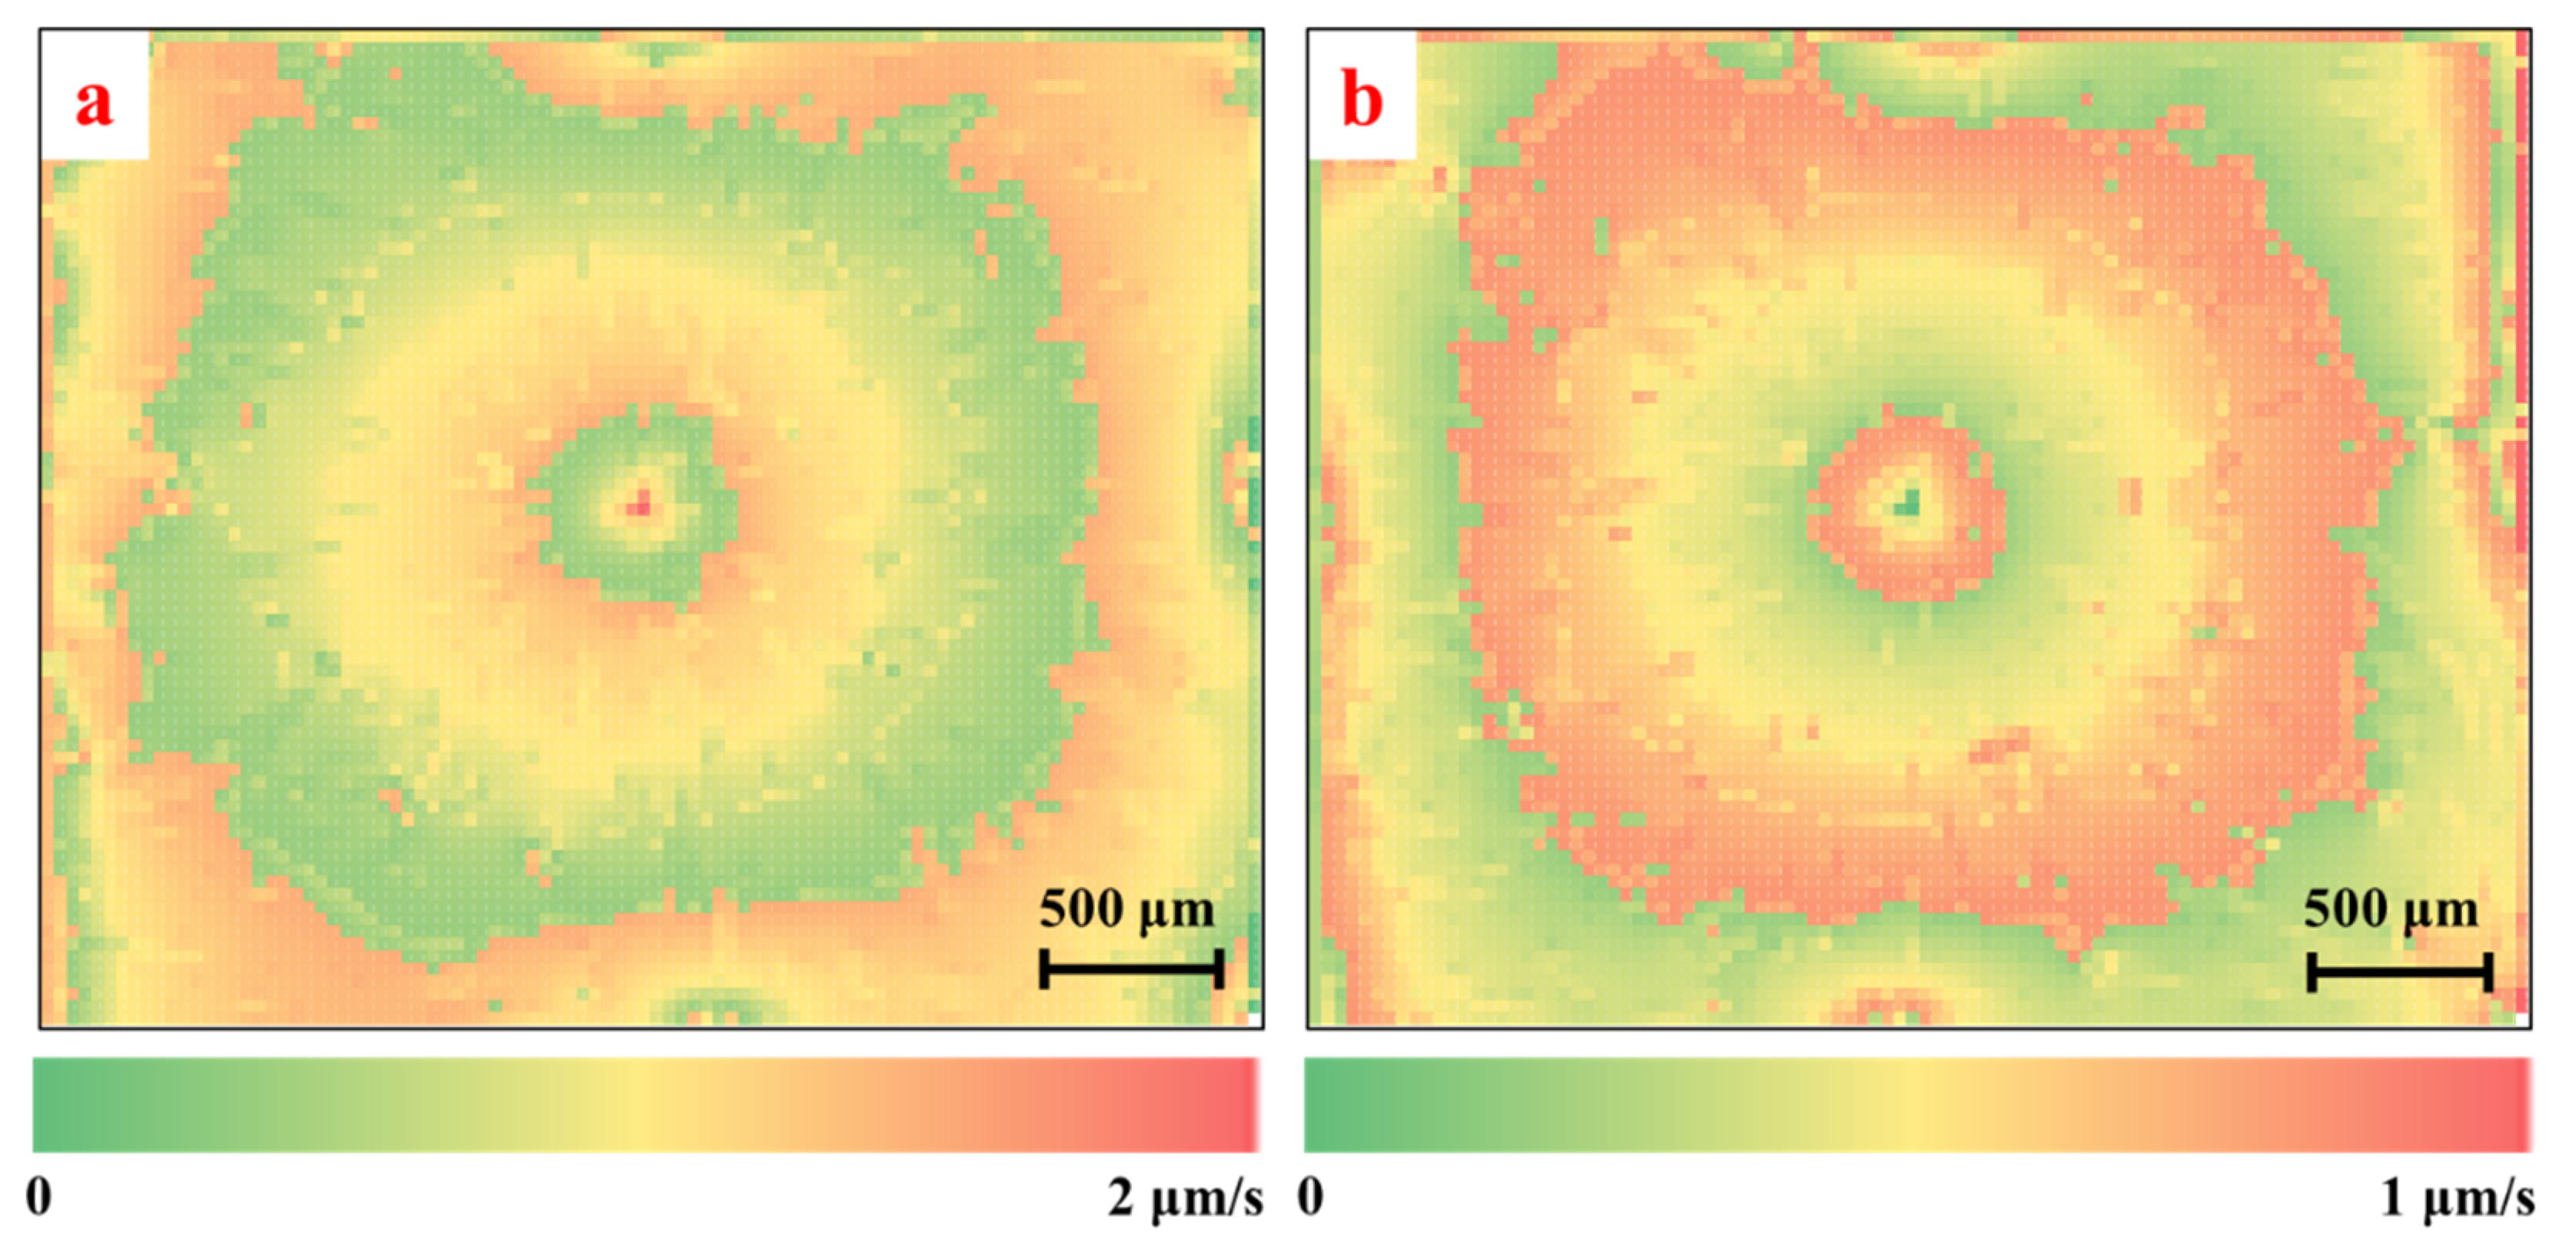
3.3. Microscopic Flow Characteristics

Table 1 shows that the mechanical properties of minerals differ. Obviously, for various tight reservoirs, the difference in mineral composition and content results in variations in the mechanical properties of the entire rock. As the effective stress of rock increases, permeability will gradually decrease, as exhibited in stress-sensitive phenomena. Under the same effective stress, the smaller the Young’s modulus and Poisson’s ratio of the rock, the greater the loss of the rock’s permeability. Here, we can provide a typical example to illustrate the above phenomenon. Assuming that the main mineral components of Samples “a” and “b” are K-feldspar and Na-feldspar, respectively and then assuming that the pore-throat parameters of the above two samples are basically the same, and the main composition of Sample “a” is mainly Na-feldspar, the Young’s modulus and Poisson’s ratio of the entire Sample “a” tend to the properties of Na-feldspar. Similarly, the main composition of Sample “b” is mainly K-feldspar, so the Young’s modulus and Poisson’s ratio of the entire “b” are close to the properties of K-feldspar. Obviously, under conditions in which the effective stress of the same value changes, the permeability loss of Sample “b” is greater than that of Sample “a”. The minimum horizontal principal stress distribution in the study area ranges from 20 to 60 MPa, and the permeability of rocks with different mineral compositions are affected to varying degrees under overburden pressure.
Considering the influence of mineral elasticity on the flow process, the main minerals in tight rock reservoirs, including the feldspar group, calcite longitudinal and shear wave time difference and density, are calculated statistically, and then the elastic modulus and Poisson’s ratio are calculated (Table 1).
In the whole horizon, we identified four types of typical minerals: skeleton mineral feldspar (including K-feldspar and Na-feldspar) and calcite and clay minerals. The threshold values of pore, feldspar, and calcite increase in turn (Figure 5). By using the image processing algorithm “inter-modes” and drawing the cumulative probability distribution curve of the threshold, the threshold values of pore and various minerals can be divided into pore (0–71), feldspar (71–169), and calcite (169–255).
We take Samples “a” and “b” to show their two-dimensional seepage rate distribution at the final time (1000 min). There is significant heterogeneity and anisotropy in the seepage rate (Figure 6). The permeability calculations and statistics are carried out according to the simulation results. Results show that the two-dimensional permeability values of tight reservoirs are distributed between 0.03 × 10⁻³ μm2 and 0.63 × 10⁻³ μm2, the arithmetic average of two-dimensional permeability is 0.10 × 10⁻³ μm2~0.24 × 10⁻³ μm2, the geometric average of two-dimensional permeability is 0.09 × 10⁻³ μm2~0.17 × 10⁻³ μm2, and the harmonic average of two-dimensional permeability is 0.07 × 10⁻³ μm2~0.13 × 10⁻³ μm2. The average values are 0.17 × 10⁻³ μm2, 0.13 × 10⁻³ μm2, and 0.10 × 10⁻³ μm2, respectively (Figure 7).
Using the idea of reservoir heterogeneity characterization, the quantitative characterization parameters of reservoir heterogeneity, such as the variation coefficient, penetration coefficient and the ratio of maximum to minimum, are calculated.
The coefficient of variation, the penetration coefficient, and the ratio of maximum to minimum are defined as the ratio of standard deviation of two-dimensional permeability to the average value of two-dimensional permeability, the ratio of maximum to average value of four-way permeability, and the ratio of maximum to minimum value of four-way permeability, respectively. The greater the three parameters, the stronger the heterogeneity.
Figure 8 shows that the variation coefficient of the two-dimensional permeability of tight reservoir samples ranges from 0.09 to 0.95 with an average value of 0.68. The abrupt injection coefficient ranges from 1.16 to 2.64 with an average value of 2.13, while the ratio of maximum to minimum is between 1.25 and 7.67, with an average value of 5.62. The numerical distribution of the three parameters shows that the fluid flow in tight reservoirs has significant heterogeneity in plane and that there are dominant flow channels (Figure 8a–f).
The frequency statistics of flow direction in six samples of tight reservoir are carried out, and cumulative probability distribution curves are constructed (Figure 9). According to the distribution characteristics of the frequency statistics histogram, the distribution of flow direction can be classified into five types: single peak-single column type, single peak-double column type, double peak-single column type, three peak-single column type, and four peak-single column type.
The distribution characteristics of the flow direction are as follows:
(1)
Sample “a”
Sample “A” falls under the “three peak & single column” type. The flow direction angles corresponding to the “double peak” are 30.6 degrees, 183.5 degrees, and 322.0 degrees, respectively. The flow angle corresponding to the “single column” is 316.0 degrees (Figure 9a).
(2)
Sample “b”
Sample “b” falls under the “four peak & single column” type. The flow direction angles corresponding to the “double peak” are 16.8 degrees, 157.5 degrees, 202.5 degrees, and 322 degrees. The flow angle corresponding to the “single column” is 316.0 degrees (Figure 9b).
(3)
Sample “c”
Sample “c” falls under the “single peak & single column” type. The flow angles corresponding to the “single peak” are 91.2 degrees, and the flow angle corresponding to the “single-column” is 315.0 degrees. The main flow angle ranges from 80.0~104.5 degrees (Figure 9c).
(4)
Sample “d”
Sample “d” falls under the “single peak & double column” distribution. The flow direction angle of the “single peak” is 81.6 degrees. The flow direction angles of the “double column” are 91.8 degrees and 316.0 degrees (Figure 9d).
(5)
Sample “e”
Sample “e” falls under the “single peak & single column” distribution. The flow angle corresponding to the “single peak” is 91.2 degrees, the main flow angle interval ranges from 80.0 to 110.0 degrees and the flow angle corresponding to the “single column” is 315.0 degrees (Figure 9e).
(6)
Sample “f”
Sample “f” falls under the “single peak & single column” distribution. The flow angle corresponding to the “single peak” is 91.2 degrees, the main flow angle interval is 78.0 to 110.6 degrees, and the flow angle corresponding to the “single column” is 315.0 degrees (Figure 9f).

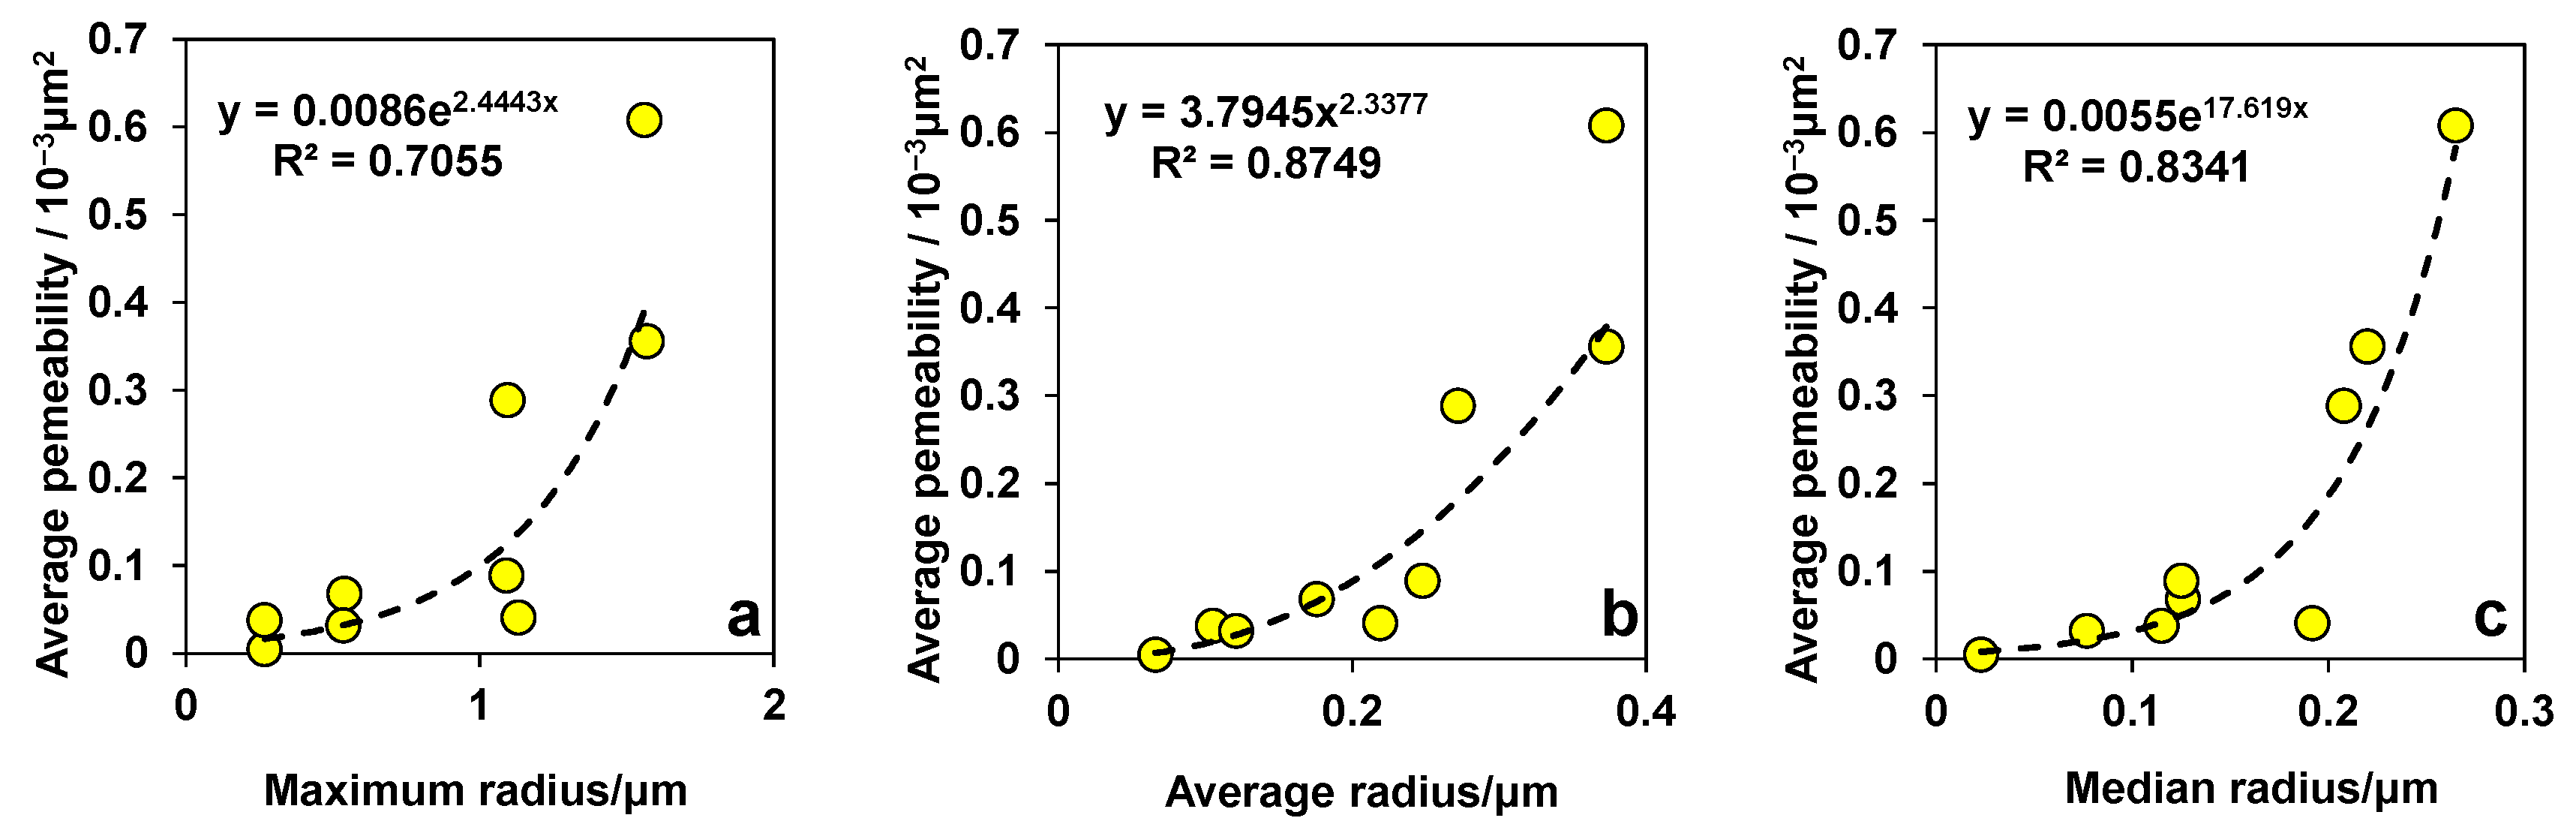
3.4. Mechanism of Flow Anisotropy

From Figure 9, it can be seen that the horizontal flow direction of each reservoir varies greatly and that this is closely related to pore characteristics, mineral composition, and mineral distribution.
There are obvious “single column” in the direction angle of flow in the plane horizon of each reservoir (i.e., the angle frequency of a certain direction is larger), and the corresponding flow direction angles of “single column” are 315~316 degrees. To some extent, the “single column” represents the dominant flow direction. It is found that the pore throat and cements (calcite and a small amount of dolomite) of the tight reservoir extends along the direction of 136 and 316 degrees. This indicates that there is a dominant flow direction in the flow process and that the dominant direction is closely related to the pore throat and mineral distribution direction.
Figure 9 shows that the flow direction angles of reservoirs “c,” “e”, and “f “are “single peak & single column” distributions, which may be related to the development of micro-fractures in the lower left and upper right of reservoirs “c” and “f,” respectively. The development of micro-fractures makes the reservoir plane become the “pore-fracture dual media” and enhances heterogeneity; thus, the flow characteristics are different from single media. At the same time, reservoir “e” does not develop micro-fractures; however, when compared with other reservoir horizons, the development degree of cements is the highest, the development degree of pore throat is the lowest, pore throat mainly distributes in the upper right area, and the heterogeneity is strong.
The heterogeneous distribution of pore throat and the existence of micro-cracks will lead to a “single peak-single column” distribution of flow direction angle (e.g., “c,” “e”, and “f”). For homogeneous porous media, the flow direction angle presents a “multi-peak” distribution, and the quantitative arrangement of pore throats and minerals will determine the existence of a “single column” or a “multi-column” (e.g., “a,” “b”, and “d”). Therefore, the homogeneity of pore throat distribution, the development of micro-cracks, and the orientation of pore-throat minerals are the most important factors affecting the flow direction angle.

4. Conclusions

(1)
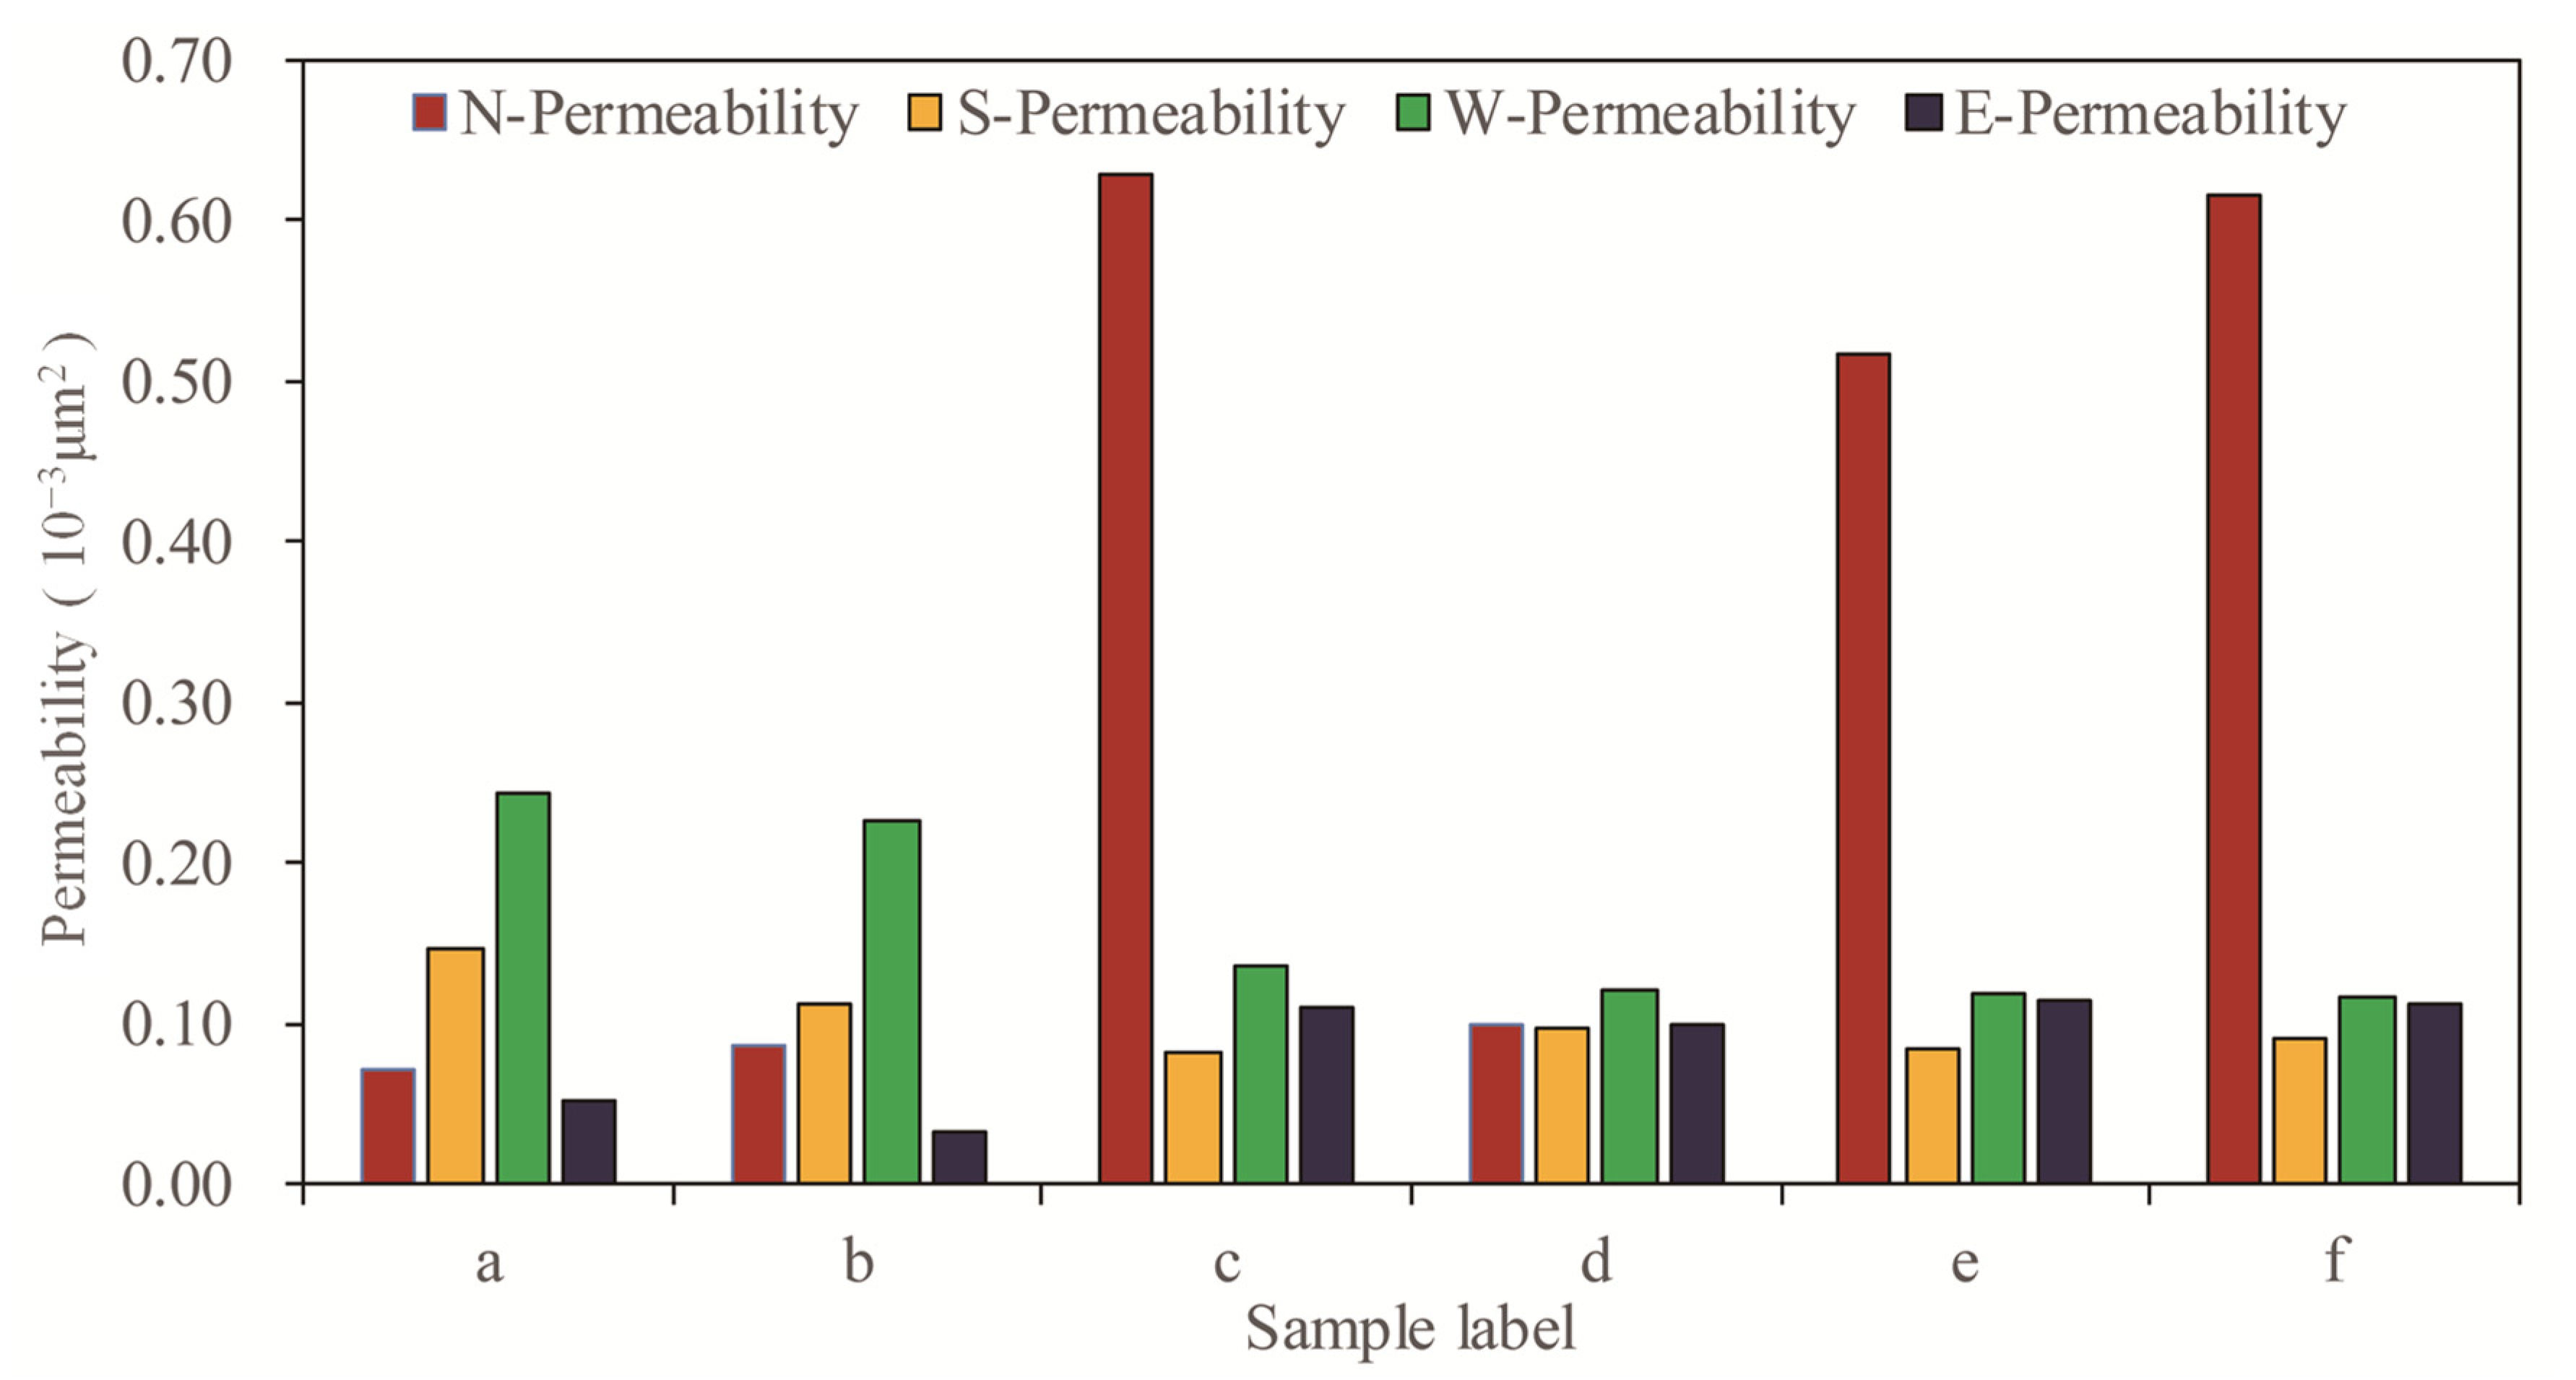
The concept of “two-dimensional permeability” could be used to characterize the microscopic anisotropic permeabilities of tight oil reservoirs impacted by heterogeneous minerals.
(2)
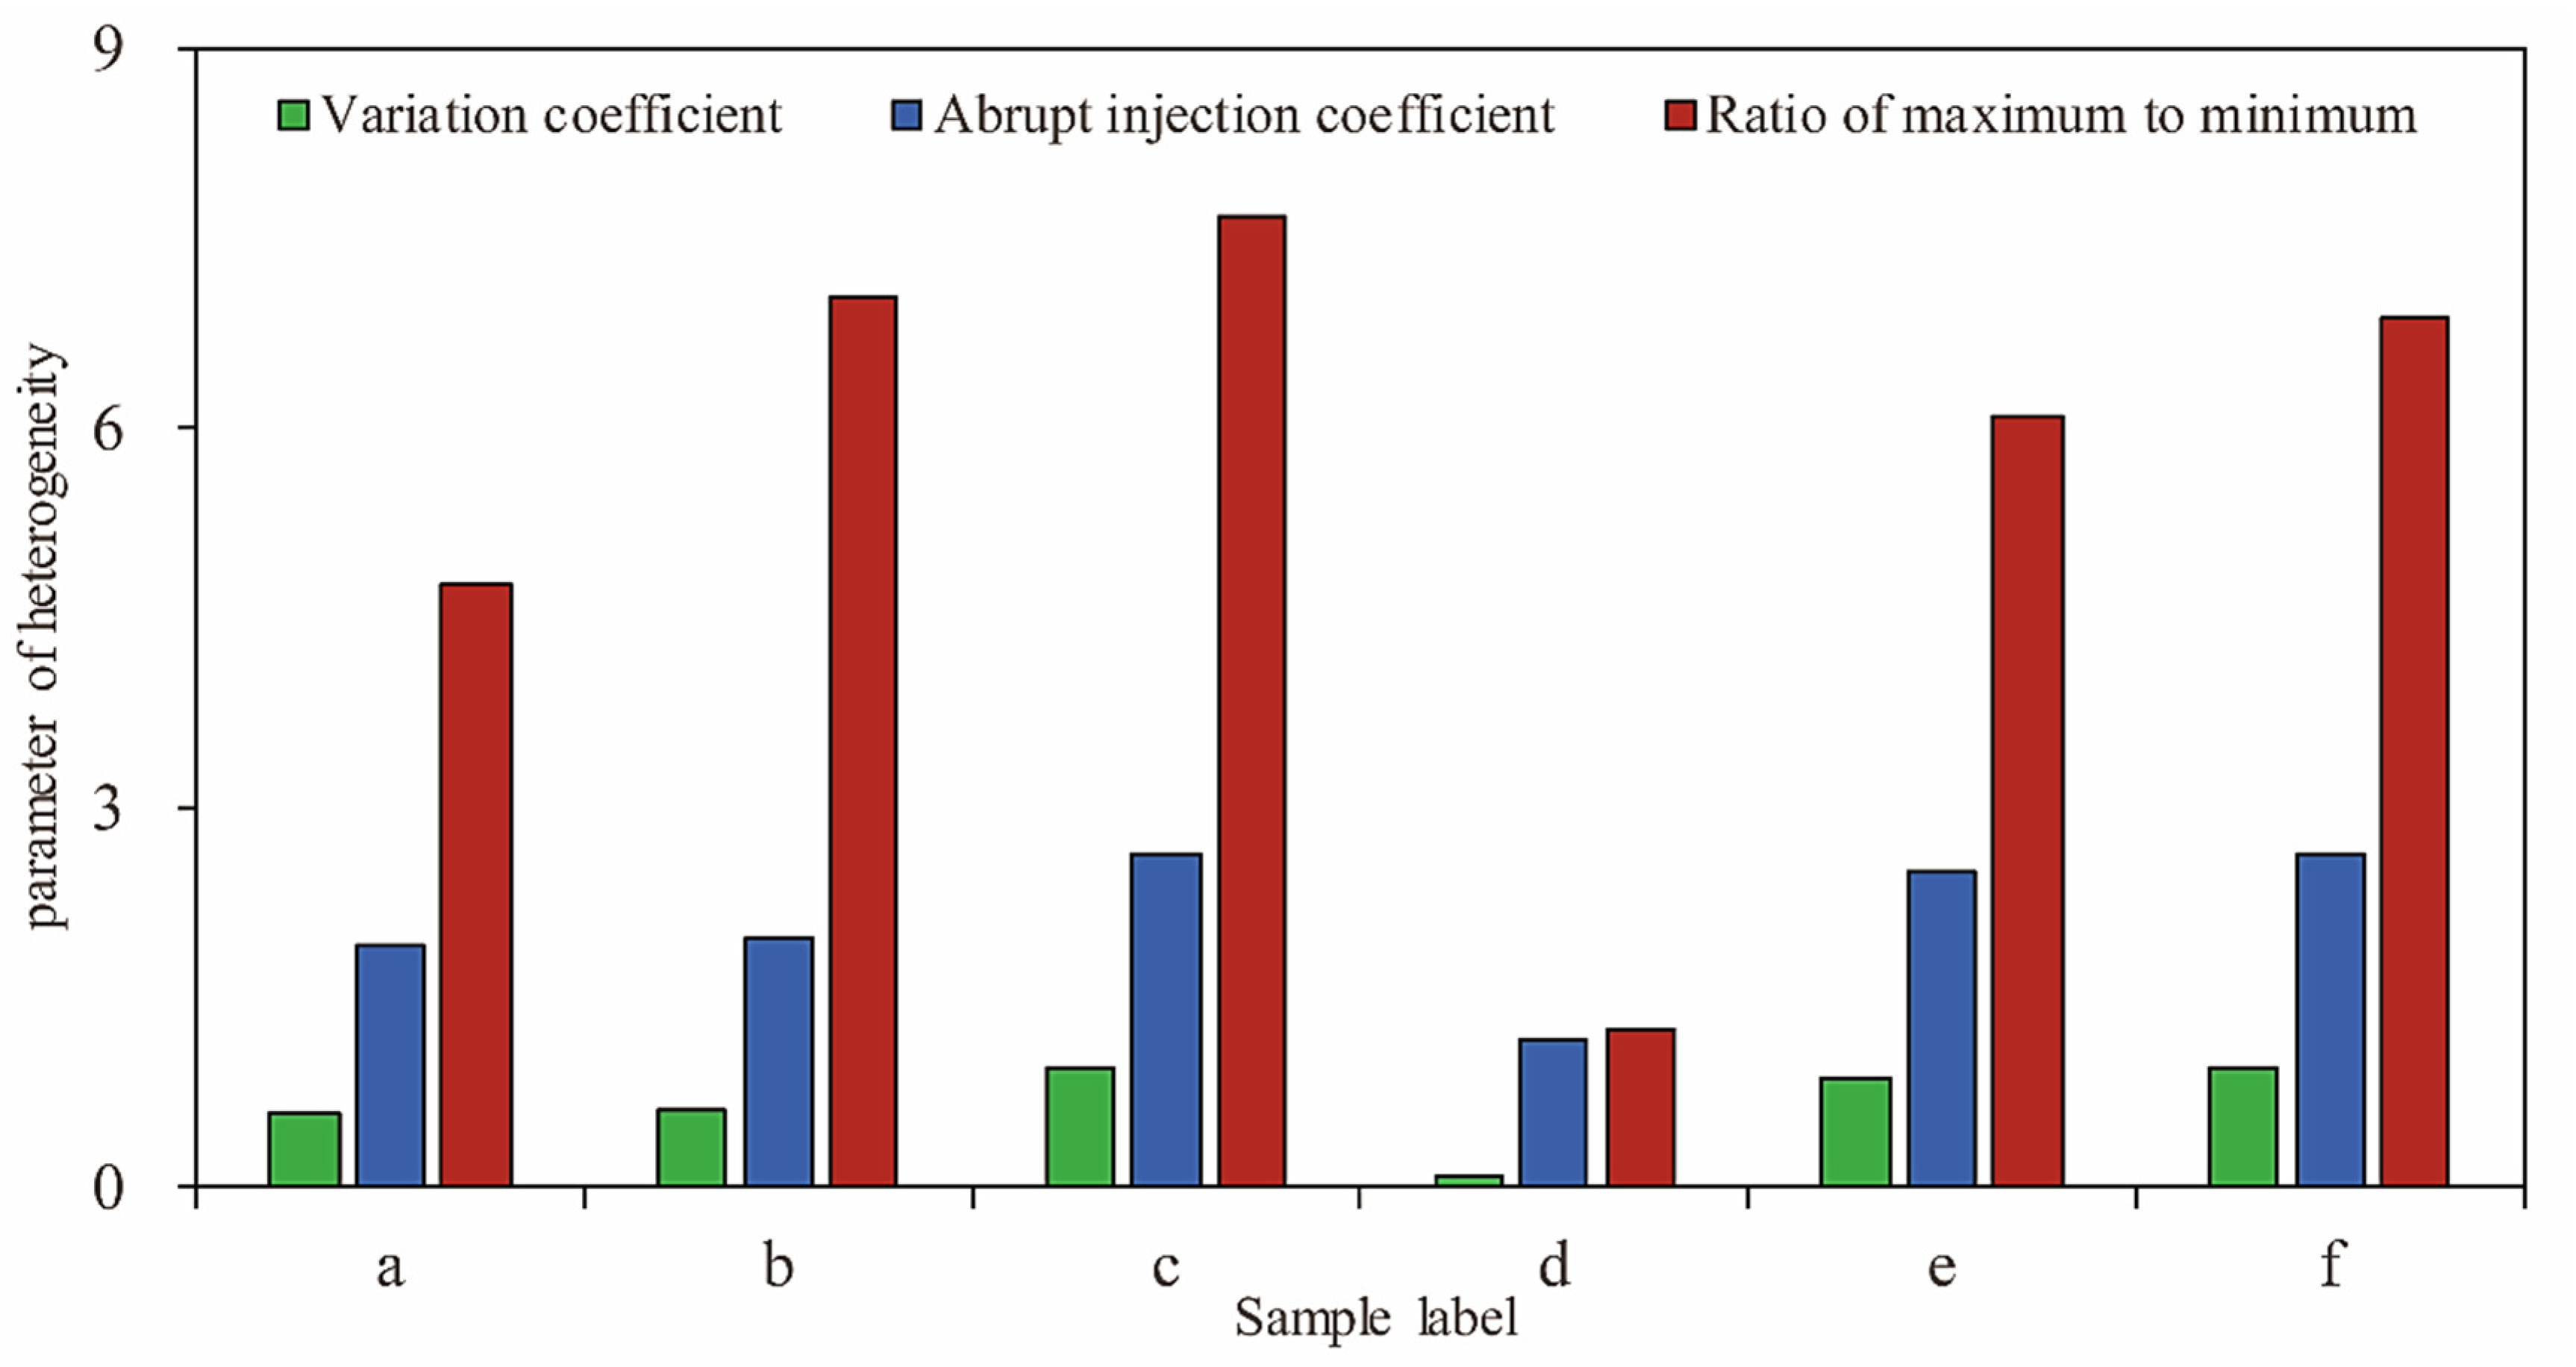
As to the two-dimensional permeability, the ratio of maximum to minimum is between 1.25 and 7.67, with an average value of 5.62. The fluid flow in tight reservoirs has significant heterogeneity in plane, and there are several dominant flow channels.
(3)
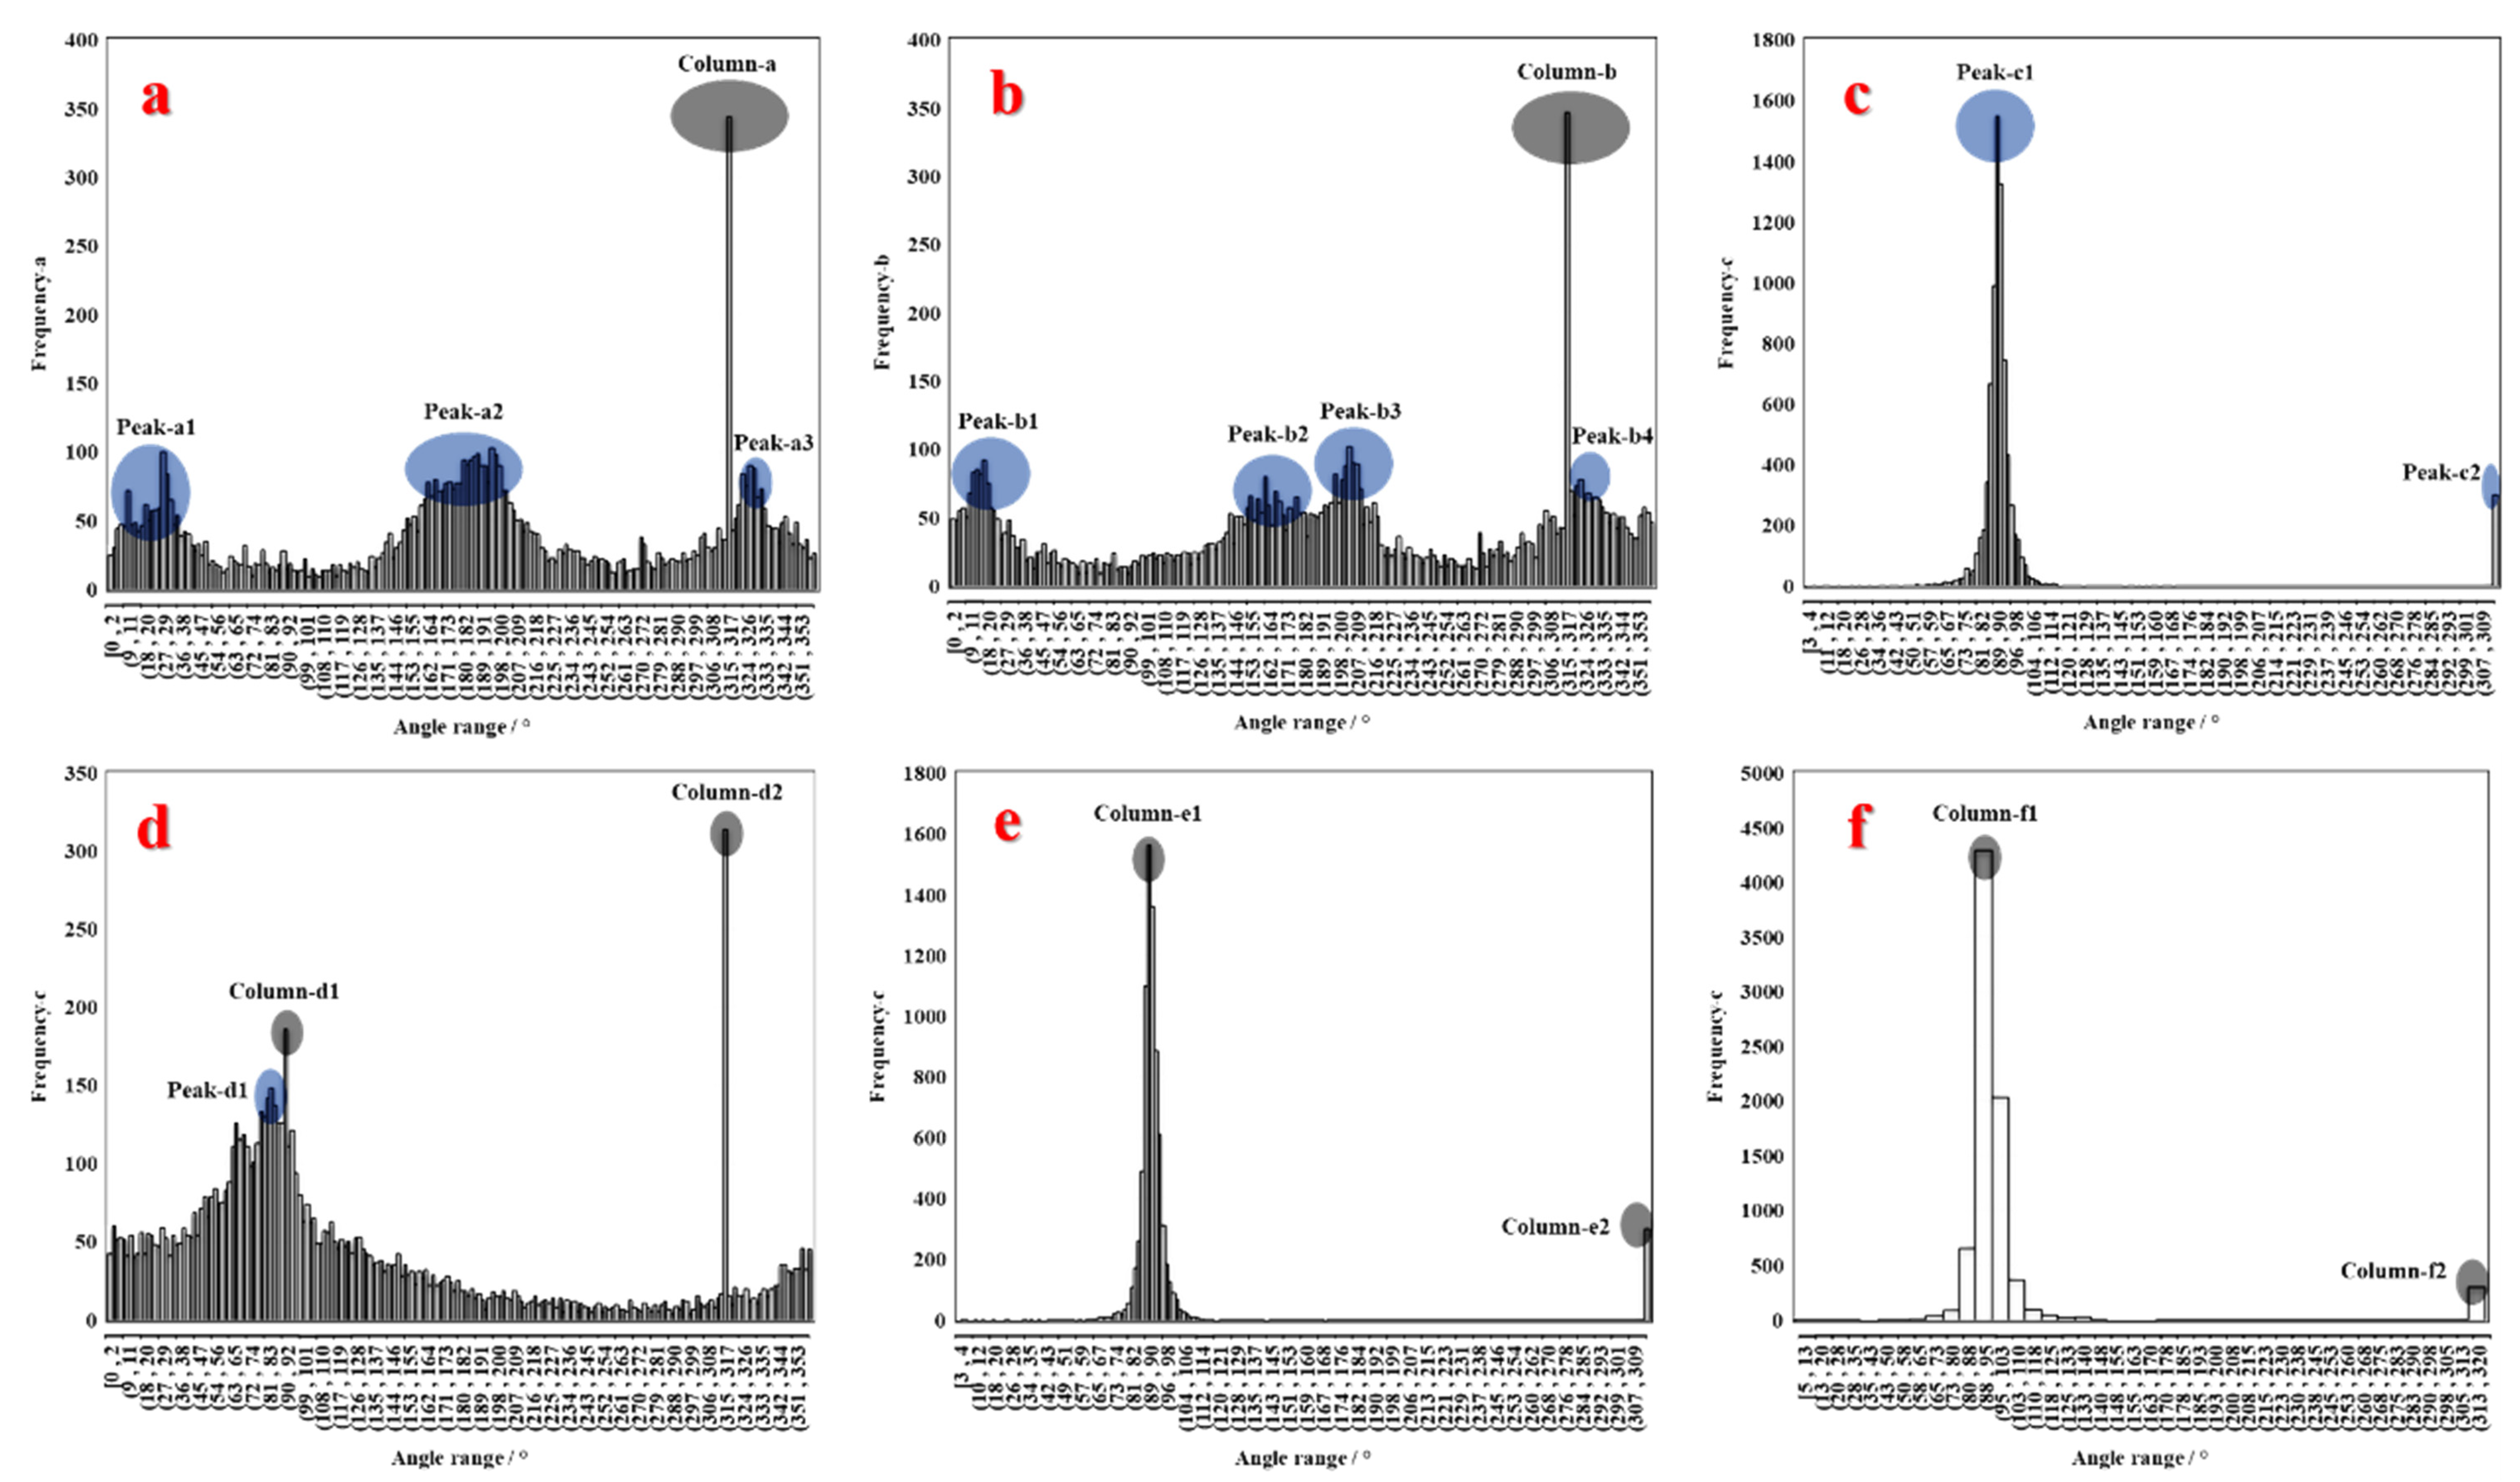
The homogeneity of pore throat distribution, the development of micro-cracks, and the orientation of pore-throat minerals are the most important factors affecting flow direction angles.

Author Contributions

Writing—original draft preparation S.D. and Z.W.; Investigation S.D., Z.W., H.G., Y.W. (Yun Wei), Y.W. (Yi Wang), K.J., N.X. and Y.Z.; Writing—review & editing S.D. All authors have read and agreed to the published version of the manuscript.

Funding

This work was funded by National Natural Science Foundation of China (NSFC, Grant No.41902132).

Conflicts of Interest

The authors declare no conflict of interest.

References

  1. Anyim, K.; Gan, Q. Fault zone exploitation in geothermal reservoirs: Production optimization, permeability evolution and induced seismicity. Adv. Geo-Energy Res. 2020, 4, 1–12. [Google Scholar] [CrossRef]
  2. Zhang, B.; He, Q.; Lin, Z.; Li, Z. Experimental study on the flow behaviour of water-sand mixtures in fractured rock specimens. Int. J. Min. Sci. Technol. 2021, 31, 377–385. [Google Scholar] [CrossRef]
  3. Xue, Y.; Ranjith, P.G.; Dang, F.; Liu, J.; Wang, S.; Xia, T.; Gao, Y. Analysis of deformation, permeability and energy evolution characteristics of coal mass around borehole after excavation. Nonrenew. Resour. 2020, 29, 3159–3177. [Google Scholar] [CrossRef]
  4. Yu, G.; Xu, F.; Cui, Y.; Li, X.; Kang, C.; Lu, C.; Li, S.; Bai, L.; Du, S. A new method of predicting the saturation pressure of oil reservoir and its application. Int. J. Hydrogen Energy 2020, 45, 30244–30253. [Google Scholar] [CrossRef]
  5. Zhang, F.; Zhang, C. Evaluating the potential of carbonate sub-facies classification using NMR longitudinal over transverse relaxation time ratio. Adv. Geo-Energy Res. 2021, 5, 87–103. [Google Scholar] [CrossRef]
  6. Li, J.; Li, B.; Cheng, Q.; Gao, Z. Evolution of anisotropic coal permeability under the effect of heterogeneous deformation of fractures. Nat. Resour. Res. 2021, 30, 3623–3642. [Google Scholar] [CrossRef]
  7. Smith, M.M.; Hao, Y.; Carroll, S.A. Development and calibration of a reactive transport model for carbonate reservoir porosity and permeability changes based on CO2 core-flood experiments. Int. J. Greenh. Gas Control 2017, 57, 73–88. [Google Scholar] [CrossRef]
  8. Wang, Z.; Qin, Y.; Li, T.; Zhang, X. A numerical investigation of gas flow behavior in two-layered coal seams considering interlayer interference and heterogeneity. Int. J. Min. Sci. Technol. 2021, 31, 699–716. [Google Scholar] [CrossRef]
  9. Zhang, C.; Zhang, L. Permeability characteristics of broken coal and rock under cyclic loading and unloading. Nat. Resour. Res. 2019, 28, 1055–1069. [Google Scholar] [CrossRef]
  10. Zhang, L.; Liu, X.; Zhao, Y.; Zhou, Y.; Shan, B. Effect of pore throat structure on micro-scale flow characteristics of tight gas reservoirs. Nat. Gas. Ind. B 2020, 7, 160–167. [Google Scholar] [CrossRef]
  11. Jia, L.; Li, K.; Shi, X.; Zhao, L.; Linghu, J. Application of gas wettability alteration to improve methane drainage performance: A case study. Int. J. Min. Sci. Technol. 2021, 31, 621–629. [Google Scholar] [CrossRef]
  12. Xu, J.; Wu, K.; Yang, S.; Cao, J.; Chen, Z. Nanoscale free gas transport in shale rocks: A hard-sphere based model. In SPE Unconventional Resources Conference; OnePetro: Richardson, TX, USA, 2017. [Google Scholar]
  13. Xu, J.; Wu, K.; Li, Z.; Pan, Y.; Li, R.; Li, J.; Chen, Z. A model for gas transport in dual-porosity shale rocks with fractal structures. Ind. Eng. Chem. Res. 2018, 57, 6530–6537. [Google Scholar] [CrossRef]
  14. Xu, J.; Wu, K.; Li, R.; Li, Z.; Li, J.; Xu, Q.; Li, L.; Chen, Z. Nanoscale pore size distribution effects on gas production from fractal shale rocks. Fractals 2019, 27, 1950142. [Google Scholar] [CrossRef]
  15. Hatami, M.; Bayless, D.; Sarvestani, A. Poroelastic effects on gas transport mechanisms and influence on apparent permeability in shale. Int. J. Rock Mech. Min. Sci. 2022, 153, 105102. [Google Scholar] [CrossRef]
  16. Lu, Y. Higher-order Knudsen’s permeability correction model for rarefied gas in micro-scale channels. Nat. Gas. Ind. B 2019, 6, 502–508. [Google Scholar] [CrossRef]
  17. Wang, G.; Qin, X.; Han, D.; Liu, Z. Study on flow and deformation characteristics of coal microstructure by 3D reconstruction of CT images at high temperatures. Int. J. Min. Sci. Technol. 2021, 31, 175–185. [Google Scholar] [CrossRef]
  18. Li, C.; Zhang, X. Unification of flow equations in tubes and in porous media. Xinjiang Pet. Geol. 2007, 28, 252–253. (In Chinese) [Google Scholar]
  19. Alfi, M.; Hosseini, S.A.; Enriquez, D.; Zhang, T. A new technique for permeability calculation of core samples from unconventional gas reservoirs. Fuel 2018, 235, 301–305. [Google Scholar] [CrossRef]
  20. Liu, H.; Gao, S.; Ye, L.; Zhu, W.; An, W. Change laws of water invasion performance in fractured–porous water-bearing gas reservoirs and key parameter calculation methods. Nat. Gas Ind. B 2021, 8, 57–66. [Google Scholar] [CrossRef]
  21. Lu, C.; Ma, L.; Guo, J.; Xiao, S.; Zheng, Y.; Yin, C. Effect of acidizing treatment on microstructures and mechanical properties of shale. Nat. Gas Ind. B 2020, 7, 254–261. [Google Scholar] [CrossRef]
  22. Tang, J.; Zhu, J.; Shao, T.; Wang, J.; Jiang, Y. A coal permeability model with variable fracture compressibility considering triaxial strain condition. Nat. Resour. Res. 2021, 30, 1577–1595. [Google Scholar] [CrossRef]
  23. Dai, C.; Liu, H.; Wang, Y.; Li, X.; Wang, W. A simulation approach for shale gas development in China with embedded discrete fracture modeling. Mar. Pet. Geol. 2019, 100, 519–529. [Google Scholar] [CrossRef]
  24. Luo, A.; Li, Y.; Wu, L.; Peng, Y.; Tang, W. Fractured horizontal well productivity model for shale gas considering stress sensitivity, hydraulic fracture azimuth, and interference between fractures. Nat. Gas Ind. B 2021, 8, 278–286. [Google Scholar] [CrossRef]
  25. Wood, D.A. The natural gas sector needs to be mindful of its sustainability credentials. Adv. Geo-Energy Res. 2020, 4, 229–232. [Google Scholar] [CrossRef]
  26. Wang, X.; Li, J.; Jiang, W.; Zhang, H.; Feng, Y.; Yang, Z. Characteristics, current exploration practices, and prospects of continental shale oil in China. Adv. Geo-Energy Res. 2022, 6, 454–459. [Google Scholar] [CrossRef]
  27. Xue, P.; Zhang, L.; Liang, Q.; Sun, X.; Zhao, Q.; Qi, P. Thermodynamic characteristics of CH4 adsorption by continental shale: A case study of the Upper Triassic Yanchang shale in the Yanchang Gasfield, Ordos Basin. Nat. Gas Ind. B 2020, 7, 269–277. [Google Scholar] [CrossRef]
  28. Zhou, X.; Chen, D.; Xia, Y.; Zeng, J.; Qiao, J.; Xu, X.; Cai, J. Spontaneous imbibition characteristics and influencing factors of Chang 7 shale oil reservoirs in Longdong area, Ordos basin. Earth Sci. 2022, 47, 3045–3055. (In Chinese) [Google Scholar]
  29. Wang, B.; Sun, J.; Shen, F.; Li, W.; Zhang, W. Mechanism of wellbore instability in continental shale gas horizontal sections and its water-based drilling fluid countermeasures. Nat. Gas Ind. B 2020, 7, 680–688. [Google Scholar] [CrossRef]
  30. Du, S.; Shi, Y.; Guan, P.; Zhang, Y. New inspiration on effective development of tight reservoir in secondary exploitation by using rock mechanics method. Energy Explor. Exploit. 2016, 34, 3–18. [Google Scholar] [CrossRef]
  31. Du, S.; Zhao, Y.; Jin, J.; Kou, G.; Shi, Y.; Huang, X. Significance of the secondary pores in perthite for oil storage and flow in tight sandstone reservoir. Mar. Pet. Geol. 2019, 110, 178–188. [Google Scholar] [CrossRef]
  32. Halim, M.C.; Hamidi, H.; Akisanya, A.R. Minimizing formation damage in drilling operations: A critical point for optimizing productivity in sandstone reservoirs intercalated with clay. Energies 2021, 15, 162. [Google Scholar] [CrossRef]
  33. Zeng, Z. Frac-n-Flow testing to screen brittle fracture stages in Wolfcamp formation, Permian basin, USA. Energies 2021, 14, 5450. [Google Scholar] [CrossRef]
  34. Du, S. Anisotropic rock poroelasticity evolution in ultra-low permeability sandstones under pore pressure, confining pressure, and temperature: Experiments with Biot’s coefficient. Acta Geol. Sin. Engl. Ed. 2021, 95, 937–945. [Google Scholar] [CrossRef]
  35. Khurpade, P.D.; Kshirsagar, L.K.; Nandi, S. Characterization of heterogeneous petroleum reservoir of Indian Sub-continent: An integrated approach of hydraulic flow unit—Mercury intrusion capillary pressure—Fractal model. J. Pet. Sci. Eng. 2021, 205, 108788. [Google Scholar] [CrossRef]
  36. Milad, M.; Junin, R.; Sidek, A.; Imqam, A.; Tarhuni, M. Huff-n-puff technology for enhanced oil recovery in shale/tight oil reservoirs: Progress, gaps, and perspectives. Energy Fuels 2021, 35, 17279–17333. [Google Scholar] [CrossRef]
  37. Zeng, Y.; Du, S.; Zhang, X.; Zhang, B.; Liu, H. The crucial geometric distinctions of microfractures as the indispensable transportation channels in hydrocarbon-rich shale reservoir. Energy Rep. 2020, 6, 2056–2065. [Google Scholar] [CrossRef]
  38. Radwan, A.E.; Nabawy, B.S.; Kassem, A.A.; Hussein, W.S. Implementation of rock typing on waterflooding process during secondary recovery in oil reservoirs: A case study, El Morgan oil field, Gulf of Suez, Egypt. Nonrenew. Resour. 2021, 30, 1667–1696. [Google Scholar] [CrossRef]
  39. Abitkazy, T.; Du, S.; Xu, F.; Shi, Y. Pore structure characterization of clay minerals in the Lower Karamay formation conglomerate reservoir in the Junggar basin and its impact on hydrocarbon storage and seepage. Acta Geol. Sin. Engl. Ed. 2019, 95, 558–569. [Google Scholar] [CrossRef]
  40. Shi, G.; Kou, G.; Du, S.; Wei, Y.; Zhou, W.; Zhou, B.; Li, Q.; Wang, B.; Guo, H.; Lou, Q.; et al. What role would the pores related to brittle minerals play in the process of oil migration and oil & water two-phase imbibition? Energy Rep. 2020, 6, 1213–1223. [Google Scholar]
  41. Rajkumar, P.; Pranesh, V.; Kesavakumar, R. Influence of CO2 retention mechanism storage in Alberta tight oil and gas reservoirs at Western Canadian Sedimentary Basin, Canada: Hysteresis modeling and appraisal. J. Pet. Explor. Prod. Technol. 2021, 11, 327–345. [Google Scholar] [CrossRef]
  42. Syed, F.I.; Muther, T.; Van, V.P.; Dahaghi, A.K.; Negahban, S. Numerical trend analysis for factors affecting eor performance and co2 storage in tight oil reservoirs. Fuel 2022, 316, 123370. [Google Scholar] [CrossRef]
  43. Guo, D.; Lv, P.; Zhao, J.; Zhang, C. Research progress on permeability improvement mechanisms and technologies of coalbed deep-hole cumulative blasting. Int. J. Coal Sci. Technol. 2020, 7, 329–336. [Google Scholar] [CrossRef]
  44. Gao, Q.; Han, S.; Cheng, Y.; Li, Y.; Yan, C.; Han, Z. Apparent permeability model for gas transport through micropores and microfractures in shale reservoirs. Fuel 2021, 285, 119086. [Google Scholar] [CrossRef]
  45. Liu, B.; Zhao, Y.; Zhang, C.; Zhou, J.; Li, Y.; Sun, Z. Characteristic strength and acoustic emission properties of weakly cemented sandstone at different depths under uniaxial compression. Int. J. Coal Sci. Technol. 2021, 8, 1288–1301. [Google Scholar] [CrossRef]
  46. Liu, H.; Guo, C.; Xu, C. Study on the two-component gas apparent permeability model in shale nanopores considering Knudsen number correction. J. Pet. Sci. Eng. 2022, 213, 110405. [Google Scholar] [CrossRef]
  47. Zhang, Q.; Chen, X.; Wang, H.; Xu, C. Exploration on molecular dynamics simulation methods of microscopic wetting process for coal dust. Int. J. Coal Sci. Technol. 2021, 8, 205–216. [Google Scholar] [CrossRef]
  48. Zuo, J.; Yang, R.; Gong, M.; Ma, X.; Wang, Y. Fracture characteristics of iron ore under uncoupled blast loading. Int. J. Min. Sci. Technol. 2022, 32, 657–667. [Google Scholar] [CrossRef]
  49. Shan, L.; Bai, X.; Liu, C.; Feng, Y.; Liu, Y.; Qi, Y. Super-resolution reconstruction of digital rock CT images based on residual attention mechanism. Adv. Geo-Energy Res. 2022, 6, 157–168. [Google Scholar] [CrossRef]
  50. Hu, D.; Wei, Z.; Liu, R.; Wei, X.; Chen, F.; Liu, Z. Enrichment control factors and exploration potential of lacustrine shale oil and gas: A case study of Jurassic in the Fuling area of the Sichuan Basin. Nat. Gas Ind. B 2022, 9, 1–8. [Google Scholar] [CrossRef]
  51. Wang, G.; Li, Y.; Wang, E.; Huang, Q.; Wang, S.; Li, H. Experimental study on preparation of nanoparticle-surfactant nanofluids and their effects on coal surface wettability. Int. J. Min. Sci. Technol. 2022, 32, 387–397. [Google Scholar] [CrossRef]
  52. Chen, K.; Li, J.; Tang, X.; Shen, J.; Wang, P.; Peng, J.; Meng, J. Key geological factors for shale gas accumulation in the Wufeng–Longmaxi Fms in the central Yangtze area. Nat. Gas Ind. B 2021, 8, 1–12. [Google Scholar] [CrossRef]
Figure 1. Pictures of the evaluated core samples. (a,b) Show sandstone samples with high oil saturation. (c,d) Indicate sandstone samples with medium oil saturation. (e,f) Display sandstone samples with low oil saturation.
Energies 15 06552 g001
Figure 2. The technical workflow used.
Energies 15 06552 g002
Figure 3. Correlation analysis between pore throat radius and permeability in tight oil reservoirs.
Energies 15 06552 g003
Figure 4. Field emission SEM observation of samples a–f.
Energies 15 06552 g004
Figure 5. Identification of pore and main mineral types in tight rock reservoirs.
Energies 15 06552 g005
Figure 6. Flow speed distribution of Samples (a,b) at the final time (1000 min).
Energies 15 06552 g006
Figure 7. Simulation results of the four-dimensional permeability of samples a–f.
Energies 15 06552 g007
Figure 8. Variability coefficient, penetration coefficient, and gradient statistics of two-dimensional permeability of samples a–f.
Energies 15 06552 g008
Figure 9. Simulation results of the anisotropic flow angle distribution of samples a–f.
Energies 15 06552 g009
Table 1. Calculation of petro-physical parameters of the studied minerals.
MineralChemical FormulaP Wave Transit Time/μs/mS Wave Transit Time/μs/mDensity/g/cm3Young’s Modulus/GPaPoisson Ratio
K-feldsparKAlSi3O82264142.5338.070.29
Na-feldsparNaAlSi3O81543212.5967.890.35
Oligoclase(Ca,Na)[Al(Al,Si)Si2O8]1602952.780.090.29
Labradorite(Ca,Na)[Al(Al,Si)Si2O8]1532822.787.540.29
Ca-feldsparCaAl2Si2O81482932.7484.680.33
CalciteCaCO31512922.7183.750.32
Publisher’s Note: MDPI stays neutral with regard to jurisdictional claims in published maps and institutional affiliations.

